Deleterious mutation load in the admixed mice population
 Umayal Ramasamy1,2
  Abigail Elizur
 Sankar Subramanian
- 1School of Science, Engineering, and Technology, The University of the Sunshine Coast, Moreton Bay, QLD, Australia
- 2Centre for Bioinnovation, The University of the Sunshine Coast, Sippy Downs, QLD, Australia
Deleterious mutation loads are known to correlate negatively with effective population size (Ne). Due to this reason, previous studies observed a higher proportion of harmful mutations in small populations than that in large populations. However, the mutational load in an admixed population that derived from introgression between individuals from two populations with vastly different Ne is not known. We investigated this using the whole genome data from two subspecies of the mouse (Mus musculus castaneus and Mus musculus musculus) with significantly different Ne. We used the ratio of diversities at nonsynonymous and synonymous sites (dN/dS) to measure the harmful mutation load. Our results showed that this ratio observed for the admixed population was intermediate between those of the parental populations. The dN/dS ratio of the hybrid population was significantly higher than that of M. m. castaneus but lower than that of M. m. musculus. Our analysis revealed a significant positive correlation between the proportion of M. m. musculus ancestry in admixed individuals and their dN/dS ratio. This suggests that the admixed individuals with high proportions of M. m. musculus ancestry have large dN/dS ratios. We also used the proportion of deleterious nonsynonymous SNVs as a proxy for deleterious mutation load, which also produced similar results. The observed results were in concordance with those expected by theory. We also show a shift in the distribution of fitness effects of nonsynonymous SNVs in the admixed genomes compared to the parental populations. These findings suggest that the deleterious mutation load of the admixed population is determined by the proportion of the ancestries of the subspecies. Therefore, it is important to consider the status and the level of genetic admixture of the populations whilst estimating the mutation loads.
Introduction
Population genetic theories predict a negative relationship between effective population size (Ne) and the fraction of deleterious mutations (Kimura and Ohta, 1978; Kimura, 1983). According to this, populations with small Ne accumulate more deleterious mutations than those with large Ne. This is because the effect of genetic drift is high amongst small populations, and hence the purifying selection is inefficient in purging deleterious mutations. Initially, accumulation of deleterious mutations was assumed to occur only in the asexual population, which was called as “Muller’s ratchet” (Muller, 1964; Felsenstein, 1974). Later, Lynch et al. (1995) showed the possibility of accumulation of harmful mutations in sexual populations, particularly when the population is small. The proportion of deleterious mutations has been estimated in a number of species, including humans, chimpanzees, mice, cows, chickens, fruit flies, and plants (Eyre-Walker and Keightley, 1999; Schultz et al., 1999; Li and Saunders, 2005; Rubin et al., 2010; Bourneuf et al., 2017; Sohail, et al., 2017). These studies showed that amongst mammals, humans have the highest proportion of deleterious mutations. This is because the ancestral effective population size of humans is known to be the smallest of the mammals examined so far (Keightley and Eyre-Walker, 2000). Comparisons involving different populations within a species also showed similar patterns. For example, previous studies reported that European Americans have a significantly higher proportion of deleterious mutations than African Americans (Lohmueller et al., 2008; Fu et al., 2014; Subramanian, 2016). This observation could be explained based on the population bottleneck that occurred in Europeans when they migrated out of Africa. This was further confirmed by another large-scale study that showed a positive correlation between deleterious mutation load and the distance from Africa (Henn et al., 2016). Human populations experienced serial population bottlenecks as they migrated out of Africa, and populations that are furthest from Africa might have experienced more bottlenecks than those proximal to Africa. Therefore, the latter harbour more deleterious mutations than the former (Henn et al., 2016).
The effects of bottlenecks were also observed in populations that migrated much more recently. For instance, French Canadians have more deleterious mutations than those who live in France or Non-French Canadians (Peischl et al., 2018). Similarly, people living on Islands such as Greenland were also found to have more deleterious mutations than their mainland counterparts (Pedersen et al., 2017). In both cases, severe bottlenecks occurred due to the limited number of individuals who formed the founders of these populations. Hence the reduction in the population size caused the accumulation of higher proportions of deleterious mutations in French Canadians and Greenlanders than in their mainland counterparts.
During domestication, only a small subset of wild animals was selected, and hence the effective population size of domesticated animals is significantly reduced compared to their wild counterparts (Moyers et al., 2018). Due to this reason, the proportion of deleterious mutations is expected to be higher in domesticated animals than in their wild progenitors. A number of studies provided empirical evidence for this prediction. For example, an earlier study showed that domesticated dog breeds have a much higher deleterious mutation load than wild wolves (Marsden et al., 2016). Similar results were reported by comparing the exomes of domesticated and wild yaks (Xie et al., 2018). Using 432 animals belonging to 54 worldwide cattle breeds, a previous study found a negative correlation between heterozygosity and deleterious mutational load, which suggests that breeds that have low genetic variation have higher deleterious mutational load than those with high genetic variation (Subramanian, 2021). Since heterozygosity is the product of Ne and mutation rate (μ), and the mutation rate is largely similar across breeds, the above relationship implies a negative correlation between Ne and the mutation load.
Apart from domestication, the difference in the natural population sizes also cause a variation in the mutational loads. For instance, the island population of kakapo (a parrot species endemic to New Zealand) was found to carry a much higher proportion of deleterious variants than the mainland population (Foster et al., 2021). Similarly, the deleterious mutational load of mammoths that lived on Wrangel island was much higher than that of those who lived on the mainland (Rogers and Slatkin, 2017). Since the population size of island species are smaller than that of mainland ones, the accumulation of deleterious mutations was the result of high genetic drift modulating the mutations of the former. Similarly, killifish populations in drylands harboured more deleterious variants than those from the wetlands (Willemsen et al., 2020). This is because the former is known to have a smaller population size than the latter. Furthermore, a study on Alpine ibex found evidence for the accumulation of mildly deleterious SNVs but the purging of highly deleterious SNVs during population bottleneck (Grossen et al., 2020).
Almost all of the previous studies used the ratio of nonsynonymous-to-synonymous diversities (dN/dS) as the proxy for the deleterious mutation loads. Their findings clearly demonstrated low and high mutation loads in populations with large and small Ne. However, genetic admixture occurs quite often between populations with distinctly different Ne. For instance, a previous study showed the fitness of Neanderthals was significantly less than that of humans because the former has smaller Ne than the latter (Harris and Nielsen, 2016). Furthermore, this study revealed that non-African populations that admixed with Neanderthals (non-Africans) have a 0.5% reduction in fitness (Harris and Nielsen, 2016). However, it is important to understand how the mutational load of the admixed progenies derived from two populations (or subspecies) with widely different Ne (and, in turn, mutation loads) is shaped by evolution. To investigate this, we obtained the whole genome data of Mus musculus castaneus and Mus musculus musculus and their hybrid or admixed populations. We specifically selected these because the subspecies M. m. musculus and M. m. castaneus have population sizes of 60,000–120,000 and 200,000–400,000, respectively (Salcedo et al., 2007; Geraldes et al., 2008), and previous studies have found a much higher mutational load in the former compared to that observed in the latter (Phifer-Rixey et al., 2012; Subramanian, 2018). We estimated the dN/dS ratios and the proportion of deleterious nonsynonymous SNVs (nSNVs) for the admixed mouse population and compared them with those of their parental populations. We also examined the correlation between the level of admixture and deleterious mutational loads.
Materials and methods
Genome data
Whole genome data for 11 Mus musculus castaneus, 11 Mus musculus musculus, 18 hybrids (M. m. castaneus’ M. m. musculus) and one Mus spretus were obtained from a previous study (Fujiwara et al., 2022). We only used the single nucleotide variations (excluding INDELS), and positions with more than two alleles were excluded. To determine derived alleles, the genomic positions of the outgroup Mus spretus were used to orient the mutations. We only included the positions where the outgroup was homozygous, and at least one Mus musculus genome had an allele that was different from the outgroup. We excluded the mitochondrial genome and sex chromosomes and used only autosomes. We used the genome annotations and extracted the protein-coding genes, and using the software PAML (Yang, 2007) we determined the number of nonsynonymous and synonymous sites. To identify nonsynonymous (nSNVs) and synonymous SNVs (sSNVs), the program SNPEffect was used (Cingolani et al., 2012).
Data analysis
The software plink was used to cluster the genomes based on their genetic relationship (Purcell et al., 2007), and the multidimensional scaling method was employed for this purpose. The VCF file was first converted into a binary bed format. The SNVs with <5% MAF (Minor Allele Frequency) were excluded, and genomes that contained >10% gap or unknown genotypes were excluded. Finally, the first two principal components that explain the maximum variation were used to plot the values and observe the population clusters. To determine the proportion of ancestries in each admixed genome of the hybrids the likelihood-based method admixture was used (Alexander et al., 2009). Using the cross-validation analysis, we determined the K value that had the lowest error and used that value (2) to denote the number of ancestral populations.
Using the number of nSNVs and sSNVs and their respective sites, we estimated the diversities at these sites and used them to compute their ratio (ωobs) as:
To determine the deleteriousness and to identify the harmful mutations, we used the PhyloP conservation scores (Hubisz et al., 2011). We obtained the basewise PhyloP scores based on 59 vertebrate genomes.1 The score was available for each position of the mouse chromosomes. The PhyloP scores were then mapped to the genomic positions, and any SNV present in a genomic position with a PhyloP score > 2.0 was designated as deleterious in nature. Based on this, the nSNVs with a PhyloP score > 2.0 were considered deleterious nSNVs. The number of deleterious nSNVs (DNobs) was divided by the number of all nSNVs (Nobs) to obtain the proportion of observed deleterious nSNVs (δobs) as given below:
To determine the distribution of fitness effects of the SNVs, the software DFE was used (Eyre-Walker et al., 2006). The site frequency spectrums (SFS) of M. m. castaneus, M. m. musculus, and the hybrid mice populations were obtained. To model the distribution, first the lookuptable program of this software was used. The output of this program was used along with the SFS of each population to obtain the fitness effects of the SNVs.
Theoretical prediction
To predict the genomic heterozygosity or diversity for admixed genomes (Hadm) by using the allele frequencies of their ancestral populations we used the equation developed by Boca et al. (2020), as given below:
where pj is the frequency of allele j, N is the number of alleles, γi is the proportion of admixture of ancestor i, and K is the number of ancestral populations contributed to the genetic makeup of the admixed populations. dadm calculated for nonsynonymous (dNadmn) and synonymous sites (dSadms) and their ratio of the predicted diversities (ωpre) was computed as:
Similarly, to predict the proportion of deleterious nonsynonymous SNVs (δpre) based on the nonsynonymous (Ni) and deleterious nonsynonymous SNVs (DNi) of the ancestral populations, we used the following formula:
where
Statistical analyses
The average dN/dS ratios and the mean proportion of deleterious nSNVs, along with the standard errors, were estimated for each pure and admixed genome. The significance between the mean estimates was determined using the Z test. A regression and correlation analysis was performed to study the relationship between the proportion of genetic admixture and dN/dS ratios or the proportion of deleterious nSNVs. The nonparametric Spearman’s rank correlation was used to determine the strength of the correlation.2 Furthermore, using the parametrical Pearson correlation also produced similar strength of the relationship. The statistical significance of the Pearson correlation was determined by converting the correlation coefficient r to the normal deviation Z, and this was accomplished using the online software r to P.3 In-house Perl scripts were used to map the PhyloP scores, calculate the point estimates and standard errors, and perform statistical tests.
Results
Population structure and admixture
To understand the genetic relationship between parental and admixed populations, the Principal Component Analysis (PCA) was performed. The results showed distinct clusters for parental populations (Figure 1A). The genomes of M. m. musculus are on the left and those of M. m. castaneus on the right ends of the plot. In contrast, the admixed individuals spread in between their parental populations. The hybrid genomes close to M. m. musculus suggest a high proportion of musculus ancestry and a low proportion of castaneus ancestry in their genome. Those close to M. m. castaneus suggest the opposite. To estimate the actual proportion of these ancestries, we used the maximum likelihood-based software Admixture. Figure 1B shows the unadmixed parental populations in single colours, which confirms the purity of these genomes. The admixed individuals are shown in two colours suggesting the levels of admixture, and the size of each colour on the columns indicates the proportions of the corresponding ancestry. The admixed mice genomes have 10%–95% of M. m. musculus ancestry.
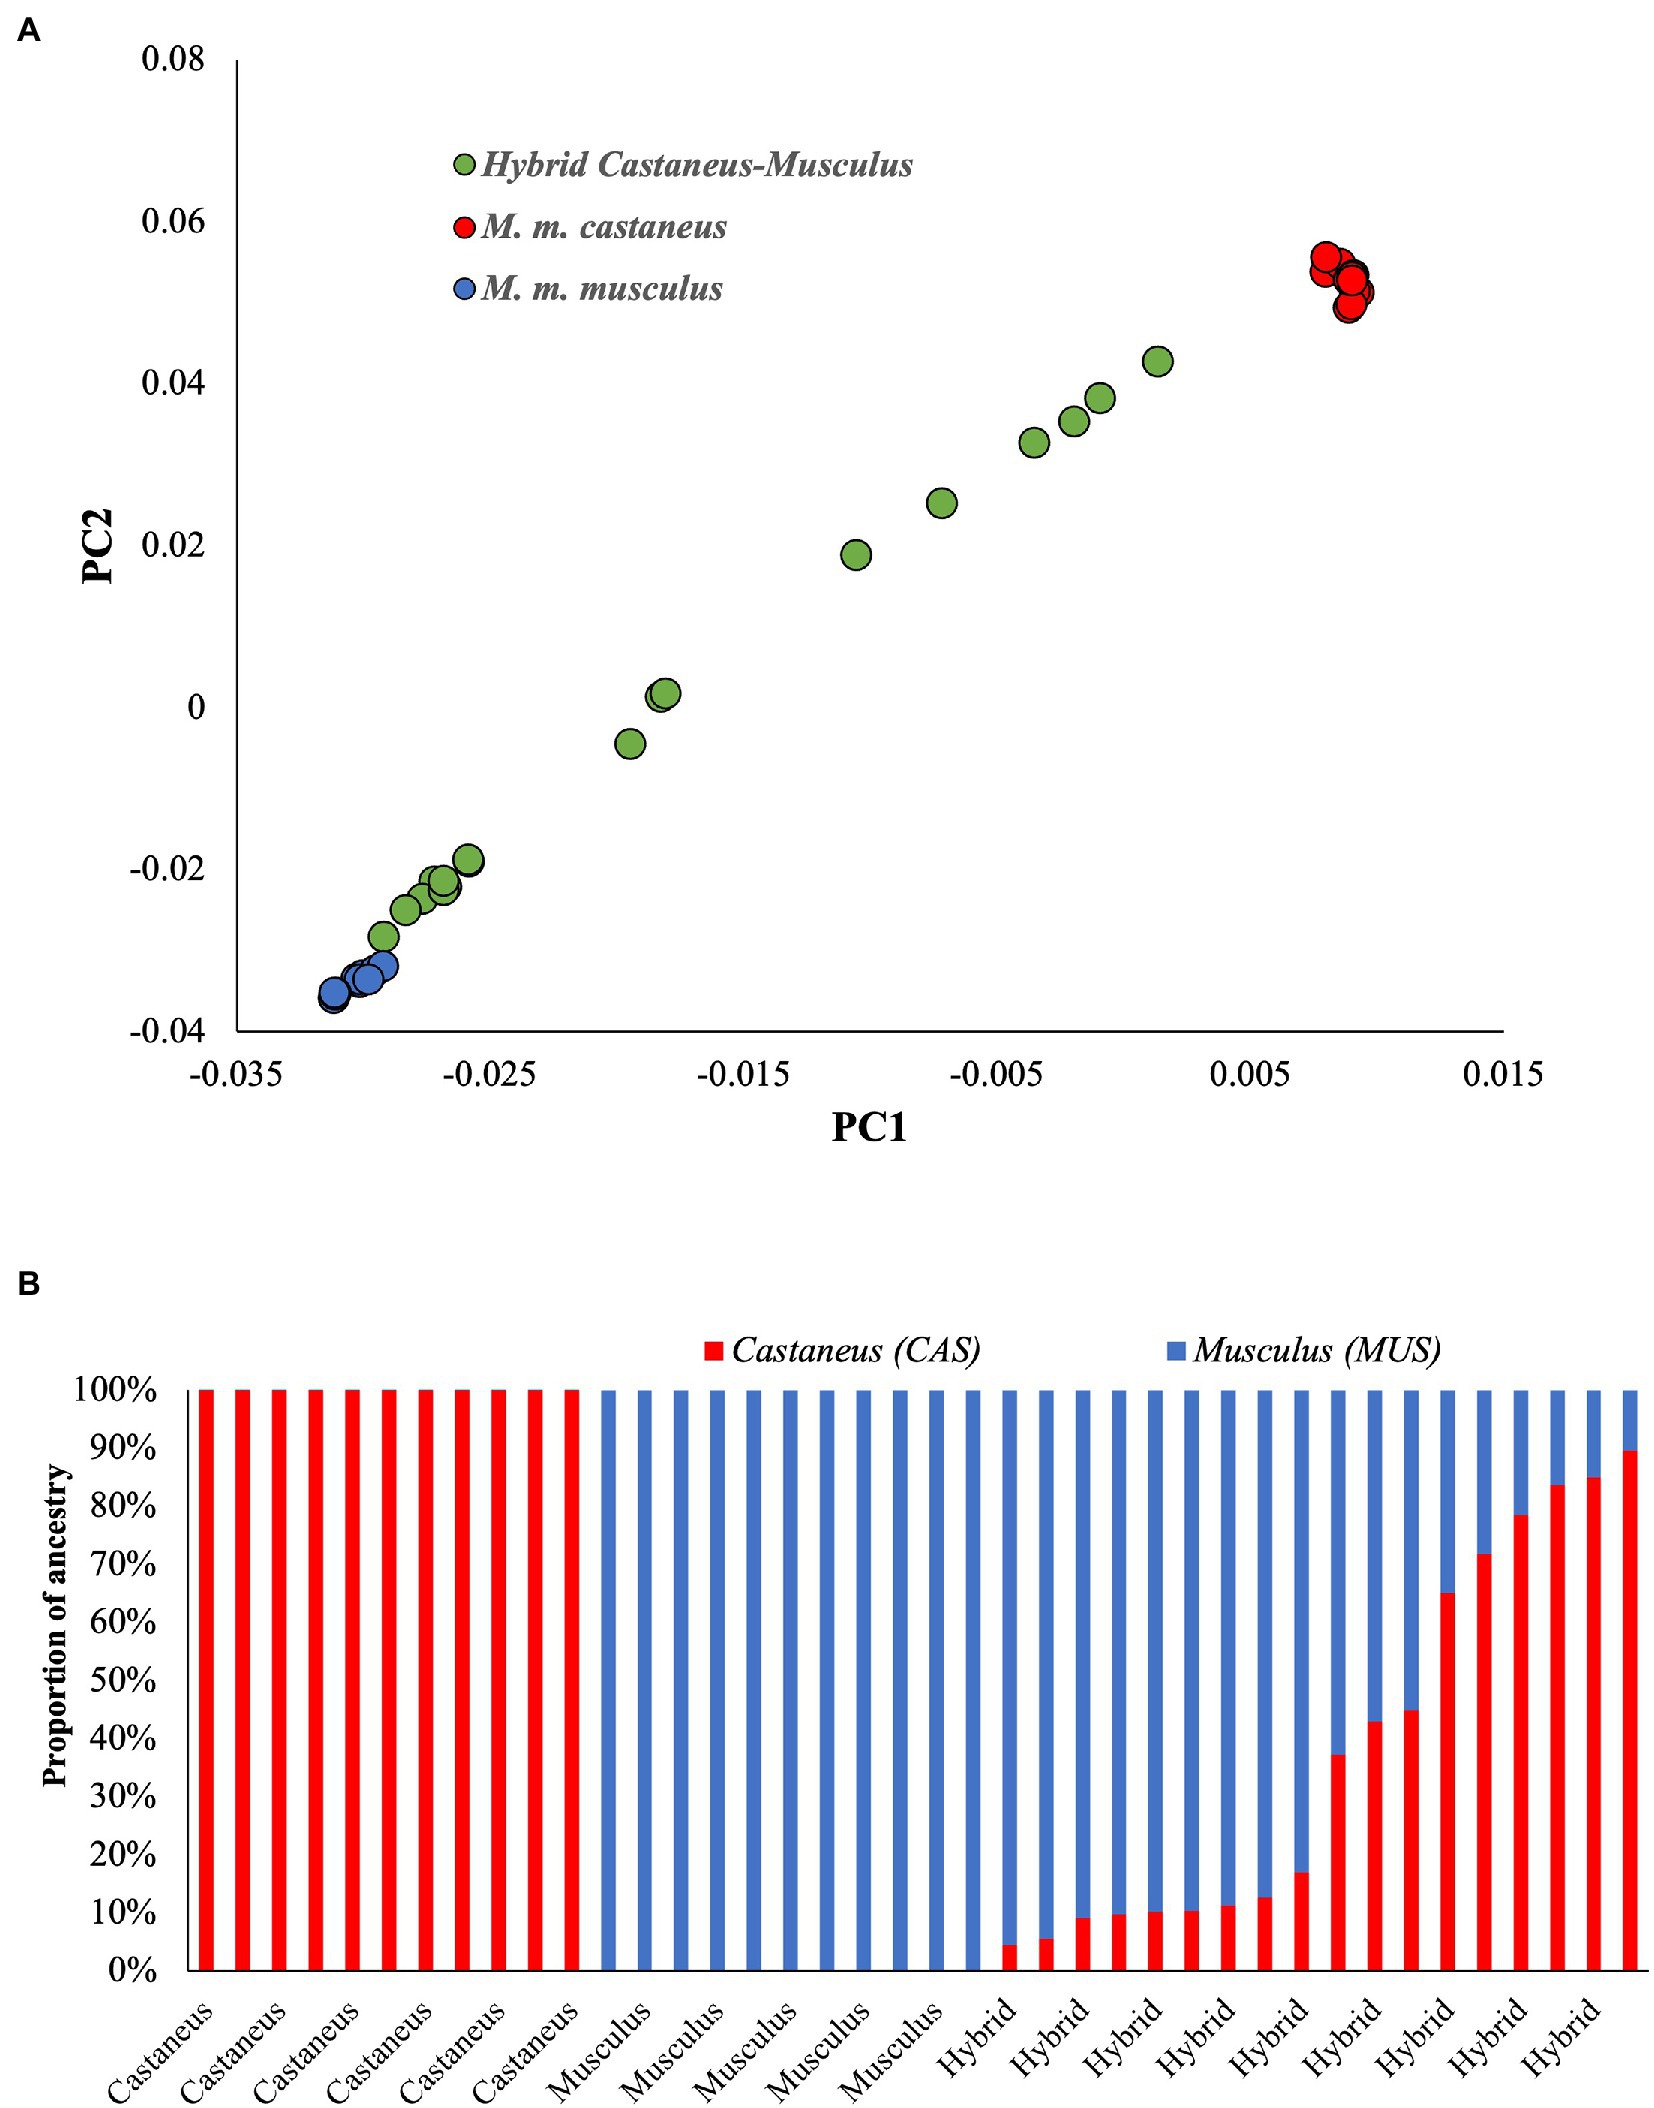
Figure 1. (A) Principal Component Analysis using pure and admixed mice populations. The pure populations (Mus musculus castaneus and Mus musculus musculus) are distinct and widely separated on the x-axis. In contrast, the admixed or hybrid populations spread between the parents. (B) The proportion of ancestries in each genome. Pure populations are shown in one colour, whereas the admixed individuals have two colours representing the proportions of different ancestries.
The ratio of nonsynonymous and synonymous diversities
To estimate the deleterious mutation load in each genome, we first calculated the dN/dS ratio for each genome. The average estimate and standard error were computed for M. m. castaneus, M. m. musculus, and the admixed populations. Figure 2A shows the mean estimates were very distinct for the populations, and the differences between them were highly significant (p < 0.00001, using a Z test). The ratio of M. m. musculus was higher than that of M. m. castaneus, and importantly that observed for the admixed population was intermediate between the two. We then plotted the dN/dS ratios of each admixed individual against the proportion of M. m. musculus ancestry of these genomes (Figure 2B). Our results showed a highly significant (rho = 0.89, p < 0.00001, Spearman’s rank correlation) positive correlation between the two variables. The dN/dS ratio was small for admixed individuals with less proportion of M. m. musculus ancestry, and it was high for those with a high fraction of the musculus ancestry.
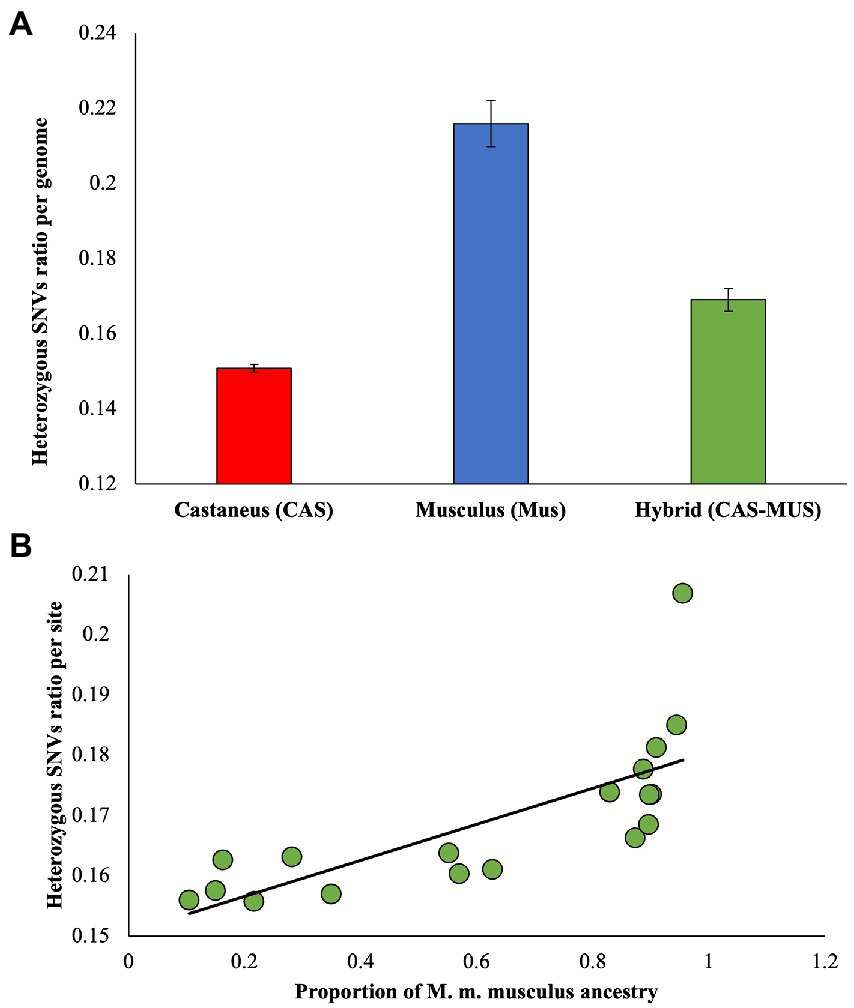
Figure 2. (A) The ratio of diversities at nonsynonymous and synonymous sites (ωobs = dN/dS) was estimated for pure and admixed populations. The error bars show the standard error of the mean. The differences between dN/dS ratios of the hybrid and M. m. musculus (p < 0.00001) and that between the hybrid and M. m. castaneus (p < 0.00001) populations were significant. (B) Correlation between the proportion of M. m. musculus ancestry/admixture and the dN/dS ratio estimated for admixed individuals. The relationship was highly significant (rho = 0.89, p < 0.00001), and the best-fitting curve is shown.
The proportion of deleterious nSNVs
To further examine the harmful mutation loads, we used the proportion of deleterious nSNVs as the measure to quantify the load. We computed this using homozygous nSNVs, and heterozygous nSNVs and then combined these two to obtain the proportion for all deleterious nSNVs. As shown in Figure 3A, the mean estimate of the proportion of all deleterious nSNVs was the highest for M. m. musculus, lowest for M. m. castaneus, and intermediate for the admixed population. The differences between the mean estimates were also statistically significant (at least p < 0.00001). Similar results were observed for the proportion of deleterious homozygous and heterozygous nSNVs as well (Figures 3B,C). Although the differences between the mean estimates were statistically significant, the magnitude of the differences was high for the heterozygous and low for the homozygous SNVs.
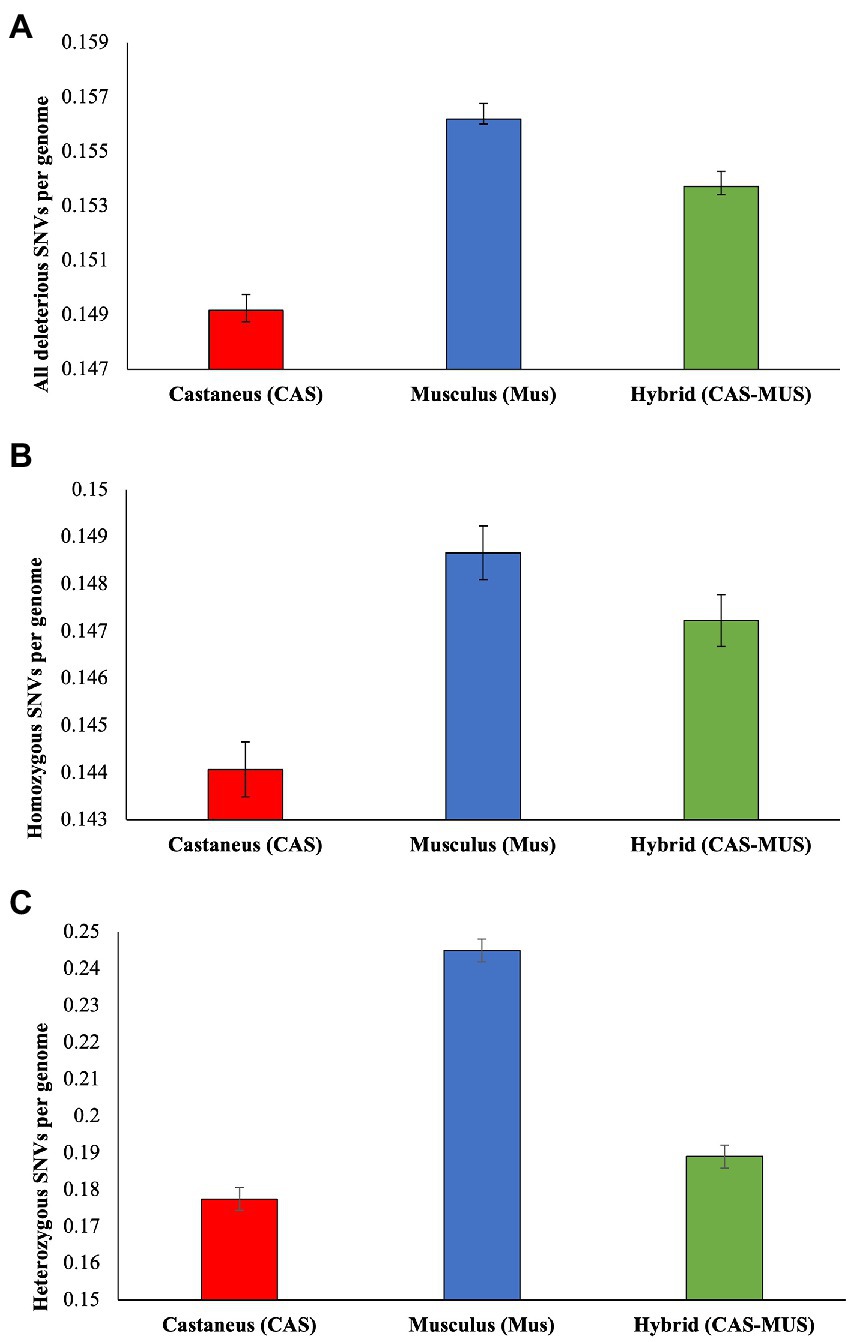
Figure 3. The proportion of deleterious nonsynonymous SNVs (nSNVs) (δobs) computed for M. m. castaneus, M. m. musculus, and admixed populations. (A) All deleterious nSNVs, (B) Homozygous deleterious nSNVs, and (C) Heterozygous deleterious nSNVs. The error bars show the standard error of the mean. The differences between the proportion of deleterious nSNVs of the hybrid and M. m. musculus were significant for all (p < 0.00001), homozygous (p < 0.0341), and heterozygous SNVs (p < 0.00001). Similarly, the differences between the hybrid and M. m. castaneus were also significant for All (p < 0.00001), homozygous (p < 0.00001), and heterozygous SNVs (p < 0.0001).
To understand the relationship between the proportion of M. m. musculus admixture/ancestry and the deleterious mutation load, a correlation analysis was conducted. For this purpose, first, we plotted the proportion of M. m. musculus ancestry against the proportion of all deleterious nSNVs of each genome (Figure 4A). This produced a highly significant positive relationship (rho = 0.91, p < 0.00001), which suggests that the admixed individuals with high proportions of M. m. musculus ancestry also have high proportions of deleterious nSNVs and those with low proportions have less proportions of these SNVs. Similarly, highly significant positive relationships were also observed for the homozygous (rho = 0.94, p < 0.00001) and heterozygous SNVs (rho = 0.81, p < 0.0001; Figures 4B,C).
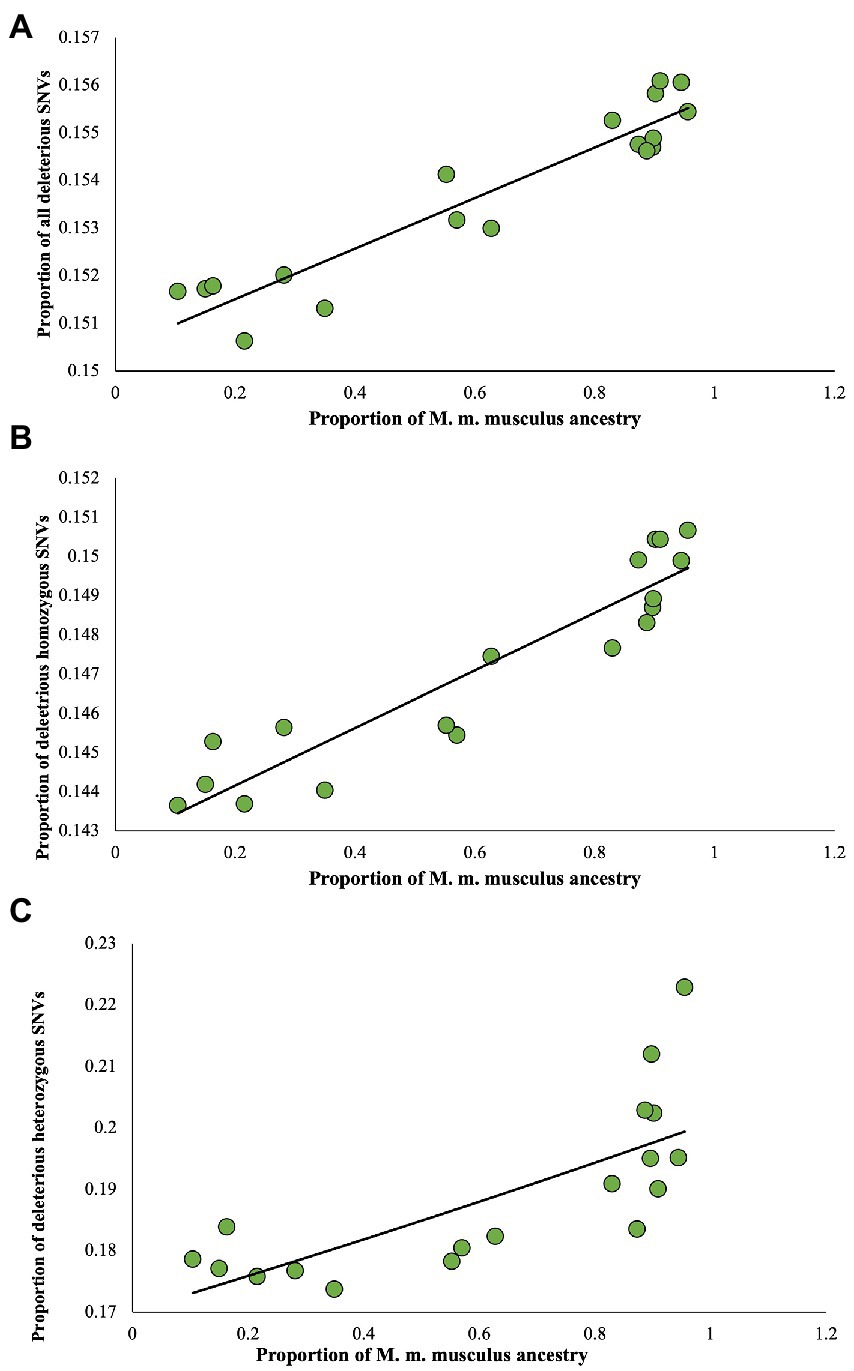
Figure 4. Relationship between the proportion of M. m. musculus ancestry/admixture and the proportion of deleterious nSNVs estimated for admixed individuals. (A) All deleterious nSNVs, (B) Homozygous deleterious nSNVs, and (C) Heterozygous deleterious nSNVs. The relations were highly significant for all (rho = 0.91, p < 0.00001), homozygous (rho = 0.94, p < 0.00001), and heterozygous SNVs (rho = 0.81, p < 0.0001). The best-fitting curves are shown.
Expected and observed mutational loads in admixed populations
Previous results revealed the patterns of mutation load observed in admixed populations. In order to understand the patterns expected solely based on the allele frequencies of the ancestral parent populations, we used the Equation (3) developed by a previous study to estimate the expected heterozygosity (see Methods). Using this formula, we first calculated the predicted nonsynonymous (dNadm) and synonymous (dSadm) diversities and obtained the predicted ratio of these diversities (ωpre). We then compared this ratio with that observed for the admixed genomes (ωobs). The observed nonsynonymous (dN) and synonymous (dN) diversities were 11% smaller than those corresponding predicted diversities (dNadm and dSadm, respectively). However, the observed ratio of these diversities (ωobs) was not statistically different from that expected (ωpre; p = 0.33; Figure 5). We also developed an Equation (5) to estimate the predicted proportion of deleterious SNVs (δpre) in admixed genomes based on the level of contributions of their ancestral populations (see Methods). The proportion of deleterious SNVs observed for the admixed populations was compared (δobs) with the predicted proportion of these SNVs (Figure 5). Our results did not reveal any significant difference between the predicted and observed proportions (p = 0.32).
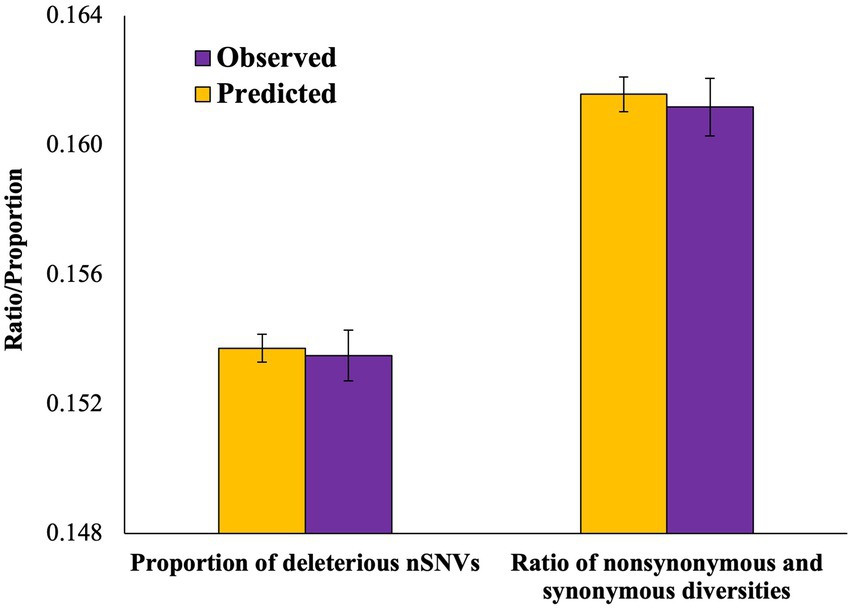
Figure 5. Column graph comparing the observed (ωobs) and predicted (ωpre) ratios of nonsynonymous and synonymous diversities and the proportion of deleterious SNVs observed (δobs) and predicted (δpre). The differences between the observed and predicted values of the ratios (p = 0.33) and the proportions (p = 0.32) were not statistically significant.
Distribution of fitness effects
To infer the fitness effects of nonsynonymous SNVs, we used the software DFE by providing the site frequencies of nonsynonymous and synonymous SNVS as input. This analysis produced the fraction of nSNVs belonging to different fitness effect categories. The results revealed that the M. m. musculus population has the highest fraction of mildly deleterious or nearly neutral (Nes < 10) nSNVs and lowest fractions of moderately (Nes 10–100) and highly deleterious nSNVs (Nes > 100; Figure 6). An opposite trend was observed for M. m. castaneus population. The admixed mice had a significantly higher fraction of mildly deleterious nSNVs (p < 0.001) than M. m. castaneus and significantly lower fraction of mildly deleterious nSNVs (p < 0.001) than M. m. musculus population. In contrast, the hybrid mice had a significantly lower fraction of moderately deleterious nSNVs (p < 0.001) than M. m. castaneus and a significantly higher fraction of moderately deleterious nSNVs (p = 0.003) than M. m. musculus population. Whilst the admixed populations had a significantly higher fraction of highly deleterious SNVs than M. m. musculus (p < 0.001) there was no significant difference in the fraction of highly deleterious SNVs between the admixed and M. m. castaneus populations (p = 0.12).
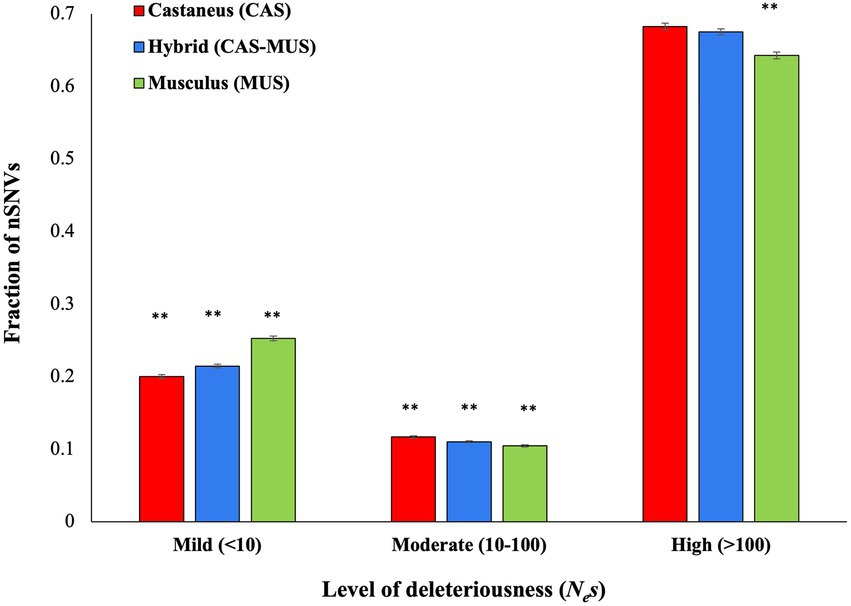
Figure 6. Distribution of fitness effects of nonsynonymous SNVs (nSNVs). The X-axis shows the level of deleteriousness of nSNVs in terms of the product of effective population size (Ne) and selection coefficient (s). The nSNVs were grouped into mildly (Nes < 10), moderately (Nes 10–100) and highly (Nes > 100) deleterious in nature. The double asterisks indicate statistical significance at the 1% level (Z-test, two-tailed). The actual p-values for each comparison are given in the main text (see Results).
Discussion
Population genetic theories predict a higher proportion of deleterious mutations in a population with a small Ne compared to that with a large Ne (Crow and Kimura, 1970; Phifer-Rixey et al., 2012; Marsden et al., 2016; Subramanian, 2021). Many previous studies provided empirical evidence for this prediction using genome data from humans and other vertebrates (Lu et al., 2006; Mezmouk and Ross-Ibarra, 2014; Renaut and Rieseberg, 2015; Kono et al., 2016; Marsden et al., 2016; Pedersen et al., 2017; Ramu et al., 2017; Makino et al., 2018; Peischl et al., 2018; Xie et al., 2018; Bosse et al., 2019; Robinson et al., 2019; Dussex et al., 2021; Subramanian, 2021). Using the dN/dS ratio as the measure to quantify deleterious mutation load, these studies consistently showed that the populations with small Ne had a higher ratio than those with large Ne. However, the mutation load of the populations that derive from genetic admixture between two parental populations with distinctly different Ne is not known. In the present study, using the dN/dS ratio and the proportion of deleterious nSNVs as proxies to quantify deleterious mutation load in mouse populations that result from the admixture between the subspecies M. m. castaneus and M. m. musculus. We report two main findings. First, the mean dN/dS ratio and the proportion of deleterious nSNVs estimated for the admixed mouse population was intermediate between those of observed for their parental populations. Second, these measures positively correlated with the fraction of M. m. musculus ancestry (or negatively correlated with the fraction of M. m. castaneus ancestry).
The results of this study can be explained by the fact that the Ne of M. m. castaneus (200,000–400,000) is much higher than that of M. m. musculus (60,000–120,000; Salcedo et al., 2007; Geraldes et al., 2008). Since deleterious mutation load negatively correlates Ne (Kimura and Ohta, 1978; Kimura, 1983), this load is expected to be higher in M. m. musculus compared to that in M. m. castaneus. Our results exactly showed this, as the dN/dS ratio (Figure 2A) and the proportion of deleterious nSNVs (Figure 3) were found to be higher for the former than those for the latter. On the other hand, the deleterious mutation load for the population that derived from the admixture of these two subspecies is expected to be less than that of M. m. musculus as they have a fraction of M. m. castaneus ancestry, which will tend to reduce the overall load of the admixed individuals. Similarly, the deleterious mutation load of the admixed population is expected to be higher than that of M. m. castaneus as they have a fraction of M. m. musculus ancestry, which will tend to increase the overall load of the hybrids. Due to this reason, the dN/dS ratio (Figure 2A) and the proportion of deleterious nSNVs (Figure 3) observed for admixed genomes were higher than those of M. m. castaneus and less than those of M. m. musculus population. The above prediction was further confirmed by the positive correlation between the proportion of M. m. musculus ancestry and the dN/dS ratio (Figure 2B) or the proportion of deleterious nSNVs (Figure 4). Note that if we used the M. m. castaneus ancestry we found a negative correlation with the same strength and same level of statistical significance.
Previous studies on dogs, cows, and yak used deleterious heterozygous and homozygous nSNVs counts to compare mutational loads between populations with different Ne (Marsden et al., 2016; Xie et al., 2018; Subramanian, 2021). However, populations with small Ne are expected to have a higher number of deleterious as well as neutral (or benign) homozygous nSNVs than those with large Ne. Therefore, the above studies observed a high number of deleterious and neutral homozygous SNVs in the genomes of the former and low in the latter. Since the deleterious and neutral homozygous SNVs show similar patterns, the use of SNV counts to measure the mutational load is not accurate. Due to this reason, we used the proportion of deleterious homozygous nSNVs, which was calculated by dividing the number of deleterious homozygous nSNVs by the number of all (benign + deleterious) homozygous nSNVs (Figures 3B, 4B) and this proportion removes the bias expected in using the nSNV counts. A similar measure was used for heterozygous deleterious nSNVs as well (Figures 3C, 4C).
Although we observed the ratio of nonsynonymous and synonymous diversities in the admixed genomes it is important to examine the loads expected in these based on the allele frequencies of their parental populations. Although the observed nonsynonymous and synonymous diversities were significantly smaller than those predicted, their ratios were not. This is because the rate of reduction in the observed estimates of both nonsynonymous and synonymous sites was almost the same (~11%). This result and the similarity between the predicted and observed proportion of deleterious nSNVs suggest that the level of admixture more likely determines the mutational loads of the admixed progenies.
The distribution of fitness effects of nonsynonymous nSNVs revealed a higher proportion of mildly deleterious SNVs and a lower proportion of moderately and highly deleterious nSNVs in M. m. musculus than M. m. castaneus. This suggests that some of the highly deleterious nSNVs that were removed from M. m. castaneus population were present or segregating in the M. m. musculus population. This is because these nSNVs were deleterious for the former but became or behaved as mildly deleterious in the latter population. The potential reason is that the presence or removal of the nSNVs is determined by the product of effective population size (Ne) and selection coefficient (s). Therefore, for a large population, the Nes will be larger than that of a small population for the same vale of s. Hence, the fitness consequences of nSNVs in small populations will be relatively less deleterious than that in large populations. Therefore, some of the nSNVs that were highly deleterious for M. m. castaneus were mildly deleterious for M. m. musculus. The genetic Admixture between M. m. castaneus and M. m. musculus results in the loss of some of the moderately deleterious nSNVs whilst gaining or accumulating some of the mildly deleterious ones.
Although many previous studies estimated the mutation load in pure or unadmixed populations, how these loads are modulated by the proportion of ancestry in admixed genomes was not clearly demonstrated before. Hence, the analyses performed here make this study novel and unique. Due to this new approach, the results of this study have opened up new dimensions in understanding the diversity and mutational load of admixed populations in comparison to their ancestral/parental populations. Eventually, this approach will help to recognise the role of gene flow between populations, particularly in exchanging harmful mutations.
Conclusion
Using the whole genome data, this study revealed the patterns of deleterious mutation load in a mouse population, which derived from genetic admixture between two distinct populations belonging to the subspecies M. m. castaneus and M. m. domesticus. The results showed the dN/dS ratio and the proportion of deleterious nSNVs of admixed populations were intermediate compared to their parents. This could be observed only if the parental populations had significant variation in their mutational load, which is driven by their effective population sizes. Our study also revealed a significant positive correlation between the proportion of admixture and the dN/dS ratio or the proportion of deleterious nSNVs in admixed individuals. This suggests the role of admixture in shaping the deleterious mutation loads. Whilst this was observed in mice, it is highly likely that similar patterns are expected in other vertebrates as well. Therefore, it is important to consider the status and the level of genetic admixture of the populations whilst estimating the mutation loads.
Data availability statement
Publicly available datasets were analysed in this study. This data can be found at: https://www.ddbj.nig.ac.jp/bioproject/ accession: PRJDB11027.
Author contributions
SS conceived the idea, designed and supervised the research, and wrote the manuscript with inputs from other authors. UR performed research and data analysis, and contributed to writing the manuscript. AE supervised the research and contributed to writing and editing the manuscript. All authors contributed to the article and approved the submitted version.
Funding
The research was supported by the University of the Sunshine Coast DVCR grant awarded to SS.
Conflict of interest
The authors declare that the research was conducted in the absence of any commercial or financial relationships that could be construed as a potential conflict of interest.
Publisher’s note
All claims expressed in this article are solely those of the authors and do not necessarily represent those of their affiliated organizations, or those of the publisher, the editors and the reviewers. Any product that may be evaluated in this article, or claim that may be made by its manufacturer, is not guaranteed or endorsed by the publisher.
Footnotes
1. ^http://hgdownload.Soe.ucsc.edu/goldenPath/mm10/phyloP60way/
References
Alexander, D. H., Novembre, J., and Lange, K. (2009). Fast model-based estimation of ancestry in unrelated individuals. Genome Res. 19, 1655–1664. doi: 10.1101/gr.094052.109
Boca, S. M., Huang, L., and Rosenberg, N. A. (2020). On the heterozygosity of an admixed population. J. Math. Biol. 81, 1217–1250. doi: 10.1007/s00285-020-01531-9
Bosse, M., Megens, H. J., Derks, M. F. L., Cara, Á. M. R., and Groenen, M. A. M. (2019). Deleterious alleles in the context of domestication, inbreeding, and selection. Evol. Appl. 12, 6–17. doi: 10.1111/eva.12691
Bourneuf, E., Otz, P., Pausch, H., Jagannathan, V., Michot, P., Grohs, C., et al. (2017). Rapid discovery of de novo deleterious mutations in cattle enhances the value of livestock as model species. Sci. Rep. 7:11466. doi: 10.1038/s41598-017-11523-3
Cingolani, P., Platts, A., Wang le, L., Coon, M., Nguyen, T., Wang, L., et al. (2012). A program for annotating and predicting the effects of single nucleotide polymorphisms, snpeff: Snps in the genome of drosophila melanogaster strain w1118; iso-2; iso-3. Fly (Austin) 6, 80–92. doi: 10.4161/fly.19695
Crow, J. F., and Kimura, M. (1970). An introduction to population genetics theory. An introduction to population genetics theory. New York: Harper & Row.
Dussex, N., van der Valk, T., Morales, H. E., Wheat, C. W., Díez-del-Molino, D., von Seth, J., et al. (2021). Population genomics of the critically endangered kākāpō. Cell Genomics 1:100002. doi: 10.1016/j.xgen.2021.100002
Eyre-Walker, A., and Keightley, P. D. (1999). High genomic deleterious mutation rates in hominids. Nature 397, 344–347. doi: 10.1038/16915
Eyre-Walker, A., Woolfit, M., and Phelps, T. (2006). The distribution of fitness effects of new deleterious amino acid mutations in humans. Genetics 173, 891–900. doi: 10.1534/genetics.106.057570
Felsenstein, J. (1974). The evolutionary advantage of recombination. Genetics 78, 737–756. doi: 10.1093/genetics/78.2.737
Foster, Y., Dutoit, L., Grosser, S., Dussex, N., Foster, B. J., Dodds, K. G., et al. (2021). Genomic signatures of inbreeding in a critically endangered parrot, the kakapo. G3 (Bethesda) 11:jkab307. doi: 10.1093/g3journal/jkab307
Fu, Q. M., Li, H., Moorjani, P., Jay, F., Slepchenko, S. M., Bondarev, A. A., et al. (2014). Genome sequence of a 45,000-year-old modern human from western siberia. Nature 514:445. doi: 10.1038/nature13810
Fujiwara, K., Kawai, Y., Takada, T., Shiroishi, T., Saitou, N., Suzuki, H., et al. (2022). Insights into mus musculus population structure across eurasia revealed by whole-genome analysis. Genome Biol. Evol. 14, 14:evac068. doi: 10.1093/gbe/evac068
Geraldes, A., Basset, P., Gibson, B., Smith, K. L., Harr, B., Yu, H. T., et al. (2008). Inferring the history of speciation in house mice from autosomal, x-linked, y-linked and mitochondrial genes. Mol. Ecol. 17, 5349–5363. doi: 10.1111/j.1365-294X.2008.04005.x
Grossen, C., Guillaume, F., Keller, L. F., and Croll, D. (2020). Purging of highly deleterious mutations through severe bottlenecks in alpine ibex. Nat. Commun. 11:1001. doi: 10.1038/s41467-020-14803-1
Harris, K., and Nielsen, R. (2016). The genetic cost of neanderthal introgression. Genetics 203, 881–891. doi: 10.1534/genetics.116.186890
Henn, B. M., Botigue, L. R., Peischl, S., Dupanloup, I., Lipatov, M., Maples, B. K., et al. (2016). Distance from sub-Saharan Africa predicts mutational load in diverse human genomes. Proc. Natl. Acad. Sci. U. S. A. 113, E440–E449. doi: 10.1073/pnas.1510805112
Hubisz, M. J., Pollard, K. S., and Siepel, A. (2011). Phast and rphast: phylogenetic analysis with space/time models. Brief. Bioinform. 12, 41–51. doi: 10.1093/bib/bbq072
Keightley, P. D., and Eyre-Walker, A. (2000). Deleterious mutations and the evolution of sex. Science 290, 331–333. doi: 10.1126/science.290.5490.331
Kimura, M. (1983). The neutral theory of molecular evolution Cambridge, UK: Cambridge University Press.
Kimura, M., and Ohta, T. (1978). Stepwise mutation model and distribution of allelic frequencies in a finite population. Proc. Natl. Acad. Sci. U. S. A. 75, 2868–2872. doi: 10.1073/pnas.75.6.2868
Kono, T. J., Fu, F., Mohammadi, M., Hoffman, P. J., Liu, C., Stupar, R. M., et al. (2016). The role of deleterious substitutions in crop genomes. Mol. Biol. Evol. 33, 2307–2317. doi: 10.1093/molbev/msw102
Li, W. H., and Saunders, M. A. (2005). News and views: the chimpanzee and us. Nature 437, 50–51. doi: 10.1038/437050a
Lohmueller, K. E., Indap, A. R., Schmidt, S., Boyko, A. R., Hernandez, R. D., Hubisz, M. J., et al. (2008). Proportionally more deleterious genetic variation in European than in African populations. Nature 451, 994–997. doi: 10.1038/nature06611
Lu, J., Tang, T., Tang, H., Huang, J., Shi, S., and Wu, C. I. (2006). The accumulation of deleterious mutations in rice genomes: a hypothesis on the cost of domestication. Trends Genet. 22, 126–131. doi: 10.1016/j.tig.2006.01.004
Lynch, M., Conery, J., and Burger, R. (1995). Mutational meltdowns in sexual populations. Evolution 49, 1067–1080. doi: 10.1111/j.1558-5646.1995.tb04434.x
Makino, T., Rubin, C. J., Carneiro, M., Axelsson, E., Andersson, L., and Webster, M. T. (2018). Elevated proportions of deleterious genetic variation in domestic animals and plants. Genome Biol. Evol. 10, 276–290. doi: 10.1093/gbe/evy004
Marsden, C. D., Ortega-Del Vecchyo, D., O’Brien, D. P., Taylor, J. F., Ramirez, O., Vilà, C., et al. (2016). Bottlenecks and selective sweeps during domestication have increased deleterious genetic variation in dogs. Proc. Natl. Acad. Sci. U. S. A. 113, 152–157. doi: 10.1073/pnas.1512501113
Mezmouk, S., and Ross-Ibarra, J. (2014). The pattern and distribution of deleterious mutations in maize. G3 (Bethesda) 4, 163–171. doi: 10.1534/g3.113.008870
Moyers, B. T., Morrell, P. L., and McKay, J. K. (2018). Genetic costs of domestication and improvement. J. Hered. 109, 103–116. doi: 10.1093/jhered/esx069
Pedersen, C. T., Lohmueller, K. E., Grarup, N., Bjerregaard, P., Hansen, T., Siegismund, H. R., et al. (2017). The effect of an extreme and prolonged population bottleneck on patterns of deleterious variation: insights from the greenlandic inuit. Genetics 205, 787–801. doi: 10.1534/genetics.116.193821
Peischl, S., Dupanloup, I., Foucal, A., Jomphe, M., Bruat, V., Grenier, J. C., et al. (2018). Relaxed selection during a recent human expansion. Genetics 208, 763–777. doi: 10.1534/genetics.117.300551
Phifer-Rixey, M., Bonhomme, F., Boursot, P., Churchill, G. A., Pialek, J., Tucker, P. K., et al. (2012). Adaptive evolution and effective population size in wild house mice. Mol. Biol. Evol. 29, 2949–2955. doi: 10.1093/molbev/mss105
Purcell, S., Neale, B., Todd-Brown, K., Thomas, L., Ferreira, M. A. R., Bender, D., et al. (2007). Plink: a tool set for whole-genome association and population-based linkage analyses. Am. J. Hum. Genet. 81, 559–575. doi: 10.1086/519795
Ramu, P., Esuma, W., Kawuki, R., Rabbi, I. Y., Egesi, C., Bredeson, J. V., et al. (2017). Cassava haplotype map highlights fixation of deleterious mutations during clonal propagation. Nat. Genet. 49, 959–963. doi: 10.1038/ng.3845
Renaut, S., and Rieseberg, L. H. (2015). The accumulation of deleterious mutations as a consequence of domestication and improvement in sunflowers and other compositae crops. Mol. Biol. Evol. 32, 2273–2283. doi: 10.1093/molbev/msv106
Robinson, J. A., Raikkonen, J., Vucetich, L. M., Vucetich, J. A., Peterson, R. O., Lohmueller, K. E., et al. (2019). Genomic signatures of extensive inbreeding in isle royale wolves, a population on the threshold of extinction. Sci. Adv. 5:eaau0757. doi: 10.1126/sciadv.aau0757
Rogers, R. L., and Slatkin, M. (2017). Excess of genomic defects in a woolly mammoth on Wrangel island. PLoS Genet. 13:e1006601. doi: 10.1371/journal.pgen.1006601
Rubin, C. J., Zody, M. C., Eriksson, J., Meadows, J. R. S., Sherwood, E., Webster, M. T., et al. (2010). Whole-genome resequencing reveals loci under selection during chicken domestication. Nature 464, 587–591. doi: 10.1038/nature08832
Salcedo, T., Geraldes, A., and Nachman, M. W. (2007). Nucleotide variation in wild and inbred mice. Genetics 177, 2277–2291. doi: 10.1534/genetics.107.079988
Schultz, S. T., Lynch, M., and Willis, J. H. (1999). Spontaneous deleterious mutation in Arabidopsis thaliana. Proc. Natl. Acad. Sci. U. S. A. 96, 11393–11398. doi: 10.1073/pnas.96.20.11393
Sohail, M., Vakhrusheva, O. A., Sul, J. H., Pulit, S. L., Francioli, L. C., Genome of the Netherlands Consortium, et al. (2017). Negative selection in humans and fruit flies involves synergistic epistasis. Science 356, 539–542. doi: 10.1126/science.aah5238
Subramanian, S. (2016). Europeans have a higher proportion of high-frequency deleterious variants than Africans. Hum. Genet. 135, 1–7. doi: 10.1007/s00439-015-1604-z
Subramanian, S. (2018). Influence of effective population size on genes under varying levels of selection pressure. Genome Biol. Evol. 10, 756–762. doi: 10.1093/gbe/evy047
Subramanian, S. (2021). Deleterious protein-coding variants in diverse cattle breeds of the world. Genet. Sel. Evol. 53:80. doi: 10.1186/s12711-021-00674-7
Willemsen, D., Cui, R., Reichard, M., and Valenzano, D. R. (2020). Intra-species differences in population size shape life history and genome evolution. eLife 9:e55794. doi: 10.7554/eLife.55794
Xie, X., Yang, Y., Ren, Q., Ding, X., Bao, P., Yan, B., et al. (2018). Accumulation of deleterious mutations in the domestic yak genome. Anim. Genet. 49, 384–392. doi: 10.1111/age.12703
Keywords: mutation load, deleterious SNVs, mouse, population bottleneck, genetic admixture, introgression
Citation: Ramasamy U, Elizur A and Subramanian S (2023) Deleterious mutation load in the admixed mice population. Front. Ecol. Evol. 11:1084502. doi: 10.3389/fevo.2023.1084502
Edited by:
Rongling Wu, The Pennsylvania State University (PSU), United StatesReviewed by:
Diego Ortega-Del Vecchyo, National Autonomous University of Mexico, MexicoAna Yansi Morales Arce, University of Bern, Switzerland
Copyright © 2023 Ramasamy, Elizur and Subramanian. This is an open-access article distributed under the terms of the Creative Commons Attribution License (CC BY). The use, distribution or reproduction in other forums is permitted, provided the original author(s) and the copyright owner(s) are credited and that the original publication in this journal is cited, in accordance with accepted academic practice. No use, distribution or reproduction is permitted which does not comply with these terms.
*Correspondence: Sankar Subramanian, ssankara@usc.edu.au