Environmental drivers of the vital urban coastal zones: An explorative case study based on the data-driven multi-method approach
 Yuting Yin
 Yuhan Shao
 Huilin Lu
 Yun Han
- 1Department of Landscape, College of Architecture and Urban Planning, Tongji University, Shanghai, China
- 2Department of Urban Planning and Design, College of Architecture, The University of Hong Kong, Hong Kong, Hong Kong SAR, China
Success in delivering dynamic urban coastal zones is considered essential, as it brings enormous opportunities to the social, economic, ecological, and cultural development of the cities in addition to benefitting the coastal zones. However, the environmental drivers contributing to urban coastal zone vitality remain uncertain due to unclarified spatial boundaries and the influences of diverse characteristics from surrounding contexts. This study aims at exploring environmental drivers that can vitalize urban coastal zones and can inform an effective way to instruct design procedures. It sets out from clarifying the spatial boundaries of urban coastal zones and emphasizing the mutual connections among its spatial components. A data-driven multi-method approach is used to analyze spatial forms, traffic organizations, land uses, landscape characteristics, and coastal functions of the eight typical coastal cases selected in different countries. Results suggested that six typical coastal zone types can be classified based on landscape characteristics and coastal functions, while the other vitality-related aspects, spatial forms, traffic organizations, and land uses are analyzed to imply design requirements for each type. It is found that requirements on vitality-related aspects of the six types evidently vary with the coastal functions, but there are similarities among the types with similar landscape characteristics.
Introduction
The coastal zone is where the terrestrial environment mutually influences marine environments (Carter, 2013). In response to global issues related to coastlines, relevant studies mostly contribute to projecting sea-level rise, mitigating storm hazards (Godschalk et al., 1989), monitoring shoreline erosion (Maged et al., 2010; Marghany, 2014), controlling waste disposal into coastal environments (Council, 1993), exploitation of coastal energy (Gill, 2005), and adapting climate change. Besides sustainable and ecological considerations, the coastal zones are also in possess of huge construction and development potentials—especially those located within urban areas to deliver dynamics to the coastal zones, as well as to bring enormous opportunities for the social, economic, ecological, and cultural development of the cities (Martínez et al., 2007; Barragán and De Andrés, 2015).
Nevertheless, the current environmental drivers contributing to the vitality of urban coastal zones remain uncertain, not only because the spatial boundary of urban coastal zones under urban design context has not been clarified and united but also the importance of urban coastal zones as social-spatial edges influencing both hinterlands and sea areas has not been fully understood. This study proposes that the delivery of urban coastal zone vitality should consider the waterfronts, the connected hinterlands, and the inshore sea areas as a whole; more importantly, emphasis should be placed on their mutual connections. A data-driven multi-method approach is used to explore environmental drivers in relation to the vitality of coastal cases selected in countries with evidently different geographical, landscape, morphological, and spatial attributes. Vitality contributors are then concluded on a typological basis of classifying urban coastal zones according to their contextual characteristics, and design instructions were then proposed accordingly.
The vitality of urban coastal zones
When coastal zones traverse cities, they usually trigger a highly concentrated area of local population and economy—areas with the most concentrated contradictions between land and marine development (Papatheochari and Coccossis, 2019). However, as a result of the different paths in coastal zone research, there is currently a lack of consistent spatial definitions in planning and management implementations. Marine-centered coastal zone planning tends to define rigid protection areas from the perspective of ecological protection (Duck, 2012) with scarce planning guidelines and instructions for the waterfronts and hinterlands; land-focused coastal zone planning mainly responds to local development requirements and merely considers the sea as a landscape resource (Ioppolo and Saija, 2013). No efficient way has been proposed to reflect the proper positioning and importance of urban coastal zones to facilitate local vitality and effectively connect hinterlands with the sea. To design dynamic urban coastal zones, it is crucial to begin with the planning and design perspective of exploring the definition of urban coastal zones and the social-spatial connections between its components must be investigated.
Coastal zone vitality is a design arena emerging only recently with the increasing emphasis on coastal development, but another similar concept, waterfront vitality, has long been regarded as an important planning focus in urban areas (Wakefield, 2007). The classic vitality theory formed by Jacobs (1961), Lynch (1984), and Gehl (1987) claimed three important factors determining urban vitality—people, activity, and space (Li et al., 2022). And spatial affordance under this context is revealed by the opportunities to attract different types of people to participate in different activities at different times of the day (Li et al., 2016). Thus, the vitality of waterfront areas can also be reflected through the interactions between human activities and physical environments (Li et al., 2022). Existing evidence has confirmed the effects of spatial form, traffic organization, landscape, cultural characteristics, and land uses on waterfront vitality (Norcliffe et al., 1996; Da and Xu, 2016). With respect to spatial form, block sizes (Sha et al., 2014), building densities (Bunce, 2011), and other textural attributes are found to be relevant; road networks with higher levels of integration (Wang F. et al., 2020), accessibility (Othman et al., 2021) and intersection density (Yang et al., 2018) are also positively related to waterfront vitality. In terms of the land use aspect, the mixed levels of land use (Lehrer and Laidley, 2008) and specific functions such as commercial activities (Hagerman, 2007) are proved to be influential, while vitality-related landscape characteristics include: openness (Sairinen and Kumpulainen, 2006), aesthetic and cultural value (Hurley, 2006), and the number and quality of landmarks (Gotham, 2002).
Many attempts have been made to explore how vitality can be generated within waterfront areas through planning and design interventions. These primarily fall into two categories. The first is the use of qualitative methods such as questionnaires (Woo et al., 2017), activity notations (Latip et al., 2012), and behavior mapping (Mansournia et al., 2016) to observe and compare the distribution of human activities and physical environment attributes across different sites. For example, Unt and Bell (Unt and Bell, 2014) used site observations and behavior mapping to compare waterfront spatial usage before and after small design interventions. Another approach is the use of quantitative methods; this normally involves the collection and analysis of data describing waterfront characteristics (Romero et al., 2016). The advancement of information technology in recent years—particularly the widely used big data and the advancement of location-based services—has provided technical support for extensive and in-depth investigations of the spatial-temporal characteristics of people and activities within urban waterfront areas. These newly emerged methods have been used by many researchers to measure the vitality of waterfront public spaces and disclose the relationships between environmental characteristics and spatial vitality (Liu et al., 2021; Niu et al., 2021). Yu et al. (2019) proved that there is a high spatial coupling between spaces with high levels of vitality and actual aggregation of activities using the open-sourced big data of streetscape images. Besides, there are also studies utilizing geographical information systems (GISs) to classify and identify coastal zones based on high-precision satellite maps (Balasubramanian et al., 2022; Thirumurthy et al., 2022).
Though efforts have been made to investigate the geospatial (i.e., locations (Yang and Shao, 2018), traffic connections (Wang F. et al., 2020), spatial compositions (Delclòs-Alió and Miralles-Guasch, 2018), and social dimensions such as symbolic identities (Hurley, 2006), human activities (Hoyle, 1999), and functions (Latip et al., 2012) that lead to the vitality of urban waterfronts, they can provide limited implications to coastal zones because no specific standard has been set to indicate the form such coastal zones should take. Urban coastal zone vitality cannot be achieved with the same methods used for waterfront vitality design due to their apparent differences. First, urban coastlines can be far longer than riversides and lakesides, and their characteristics may vary with the different contexts surrounding them. Thus, the successful experience of delivering one dynamic coastal zone cannot be applied to others without the support of the typological research basis and design implications summarized accordingly. Moreover, studies based on qualitative methods are limited in their exploration of vitality dimensions and sample sizes, while the data-based quantitative analysis approaches often ignore the role of local contexts in influencing coastal zone vitality. Therefore, practical instructions for designing vital urban coastal zones can hardly be developed without an analytical framework that is founded on typological thinking and integrates both qualitative and quantitative aspects.
This study, therefore, intends to formalize the concept of urban coastal zone vitality starting with clarifying its spatial components and emphasizing their interactive influences. The descriptive statistics analysis was used together with the case study to identify relevant environmental cues from urban coastal zone case studies selected in different countries since they are efficient in handling both qualitative and quantitative data. A qualitative analysis of landscape characteristics and coastal function aspects was first conducted to classify urban coastal zones, while a quantitative analysis of spatial form, traffic organization, and land use aspects was implemented to disclose the causes of coastal zone vitality. This study then explored design implications to inform how vitality can be delivered, while remaining responsive to local contexts for each coastal zone type and also adaptable to other urban coastal zones with similar characteristics.
Materials and methods
Selecting urban coastal zones cases
Two rounds of the case study selection process were conducted. The first round involved locating potential coastal zone cases through an extensive search of design and travel websites, design review articles, and related books. A total of 15 constructed coastal zone design case studies were identified and presented to a group of 10 expert researchers specializing in landscape, urban design, and architecture. Selection was based on the following review criteria: (1) the selected cases should be known for their vitality, attractiveness, and high visitor rates; (2) the selected case study areas should be fully constructed and developed with similar levels of prosperity in the hinterlands; and (3) the selected cases should have diverse coastal characteristics containing as many landscape and function types as possible. As a result, eight coastal zones with different orientations toward the sea were selected for further analysis, including Vancouver, Chicago, Toronto, Barcelona, Zhuhai, Qingdao, Shenzhen, Haikou, and Dalian (Figure 1).
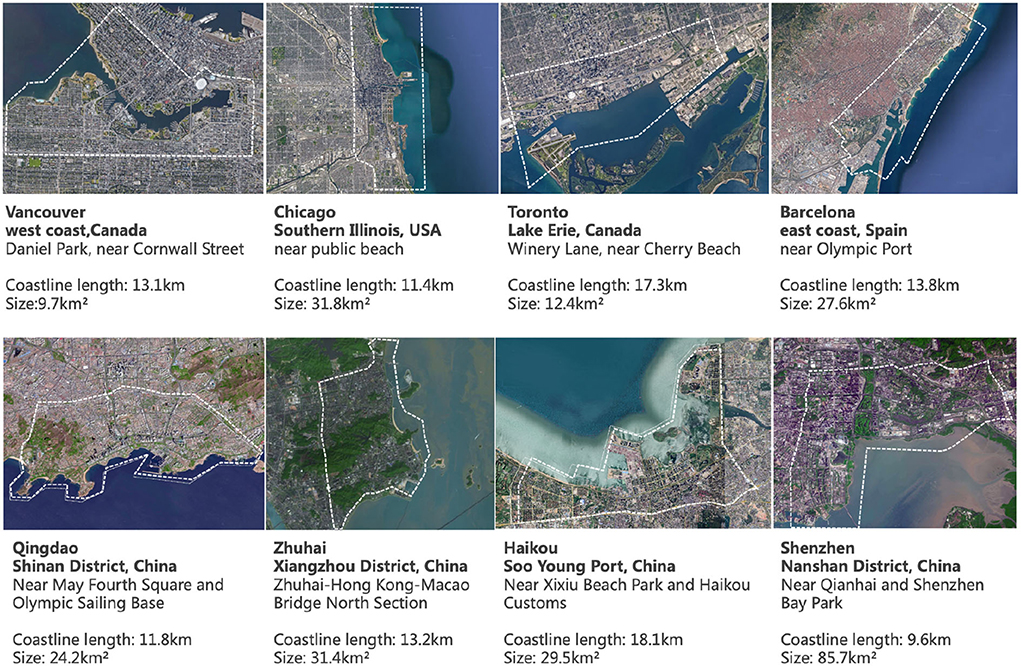
Figure 1. Site conditions of the eight selected coastal zone cases.
Determining coastal zone vitality indicators
Eleven indicators were selected from existing theoretical and empirical literature on waterfront vitality, coastal zone qualities, and the overlaps between environmental vitality and urban coastal zones; the definition (Table 1) and calculation formula of each indicator were also referred from previous studies. Among these, seven indicators measure quantitative vitality aspects of the selected coastal zone cases, including spatial forms, traffic organizations, and land use conditions, while the other four describe the landscape and functional attributes from a qualitative perspective.
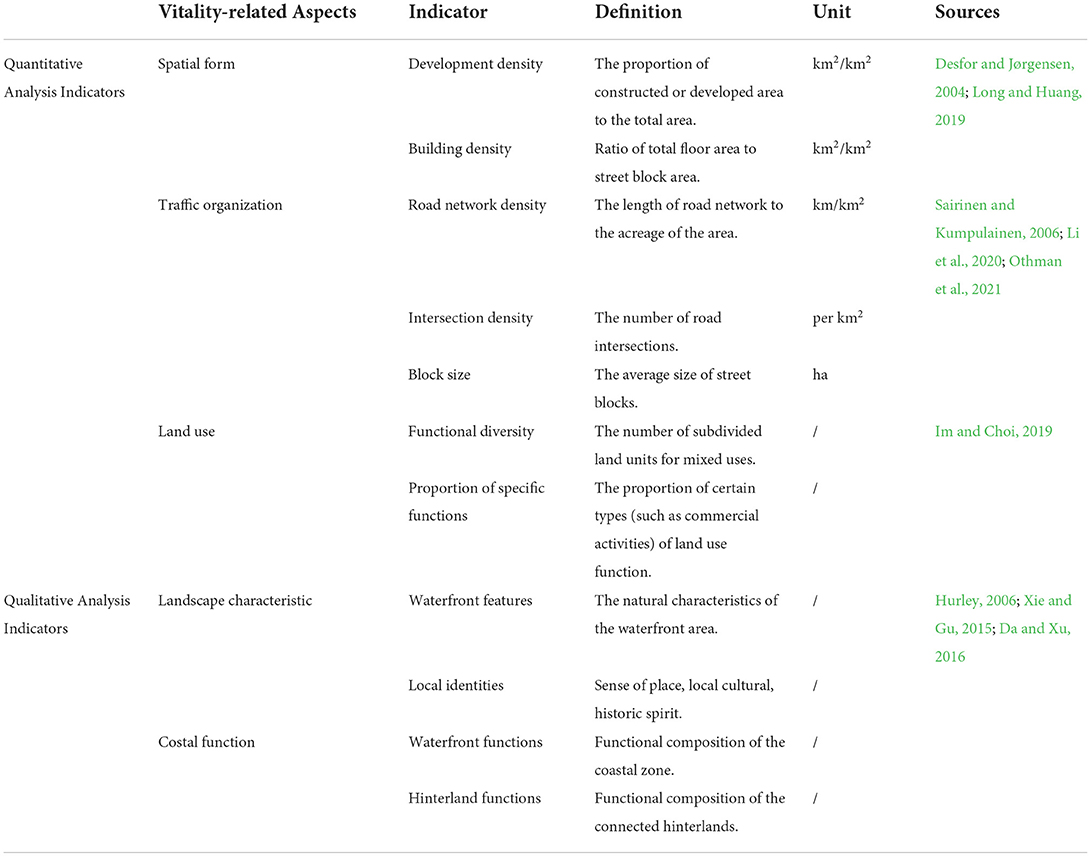
Table 1. Environmental indicators related to urban coastal zone vitality.
Analyzing coastal zone vitality indicators
Quantitative indicators analysis methods
The quantitative attributes related to urban coastal zone vitality include spatial form, traffic organization, and land uses. Quantitative data were mostly retrieved from national statistics and Google dataset updated around the year 2019 (Table 2). The result for each quantitative indicator was calculated and visualized using the ArcGIS platform to reveal the coastal zone characteristics.
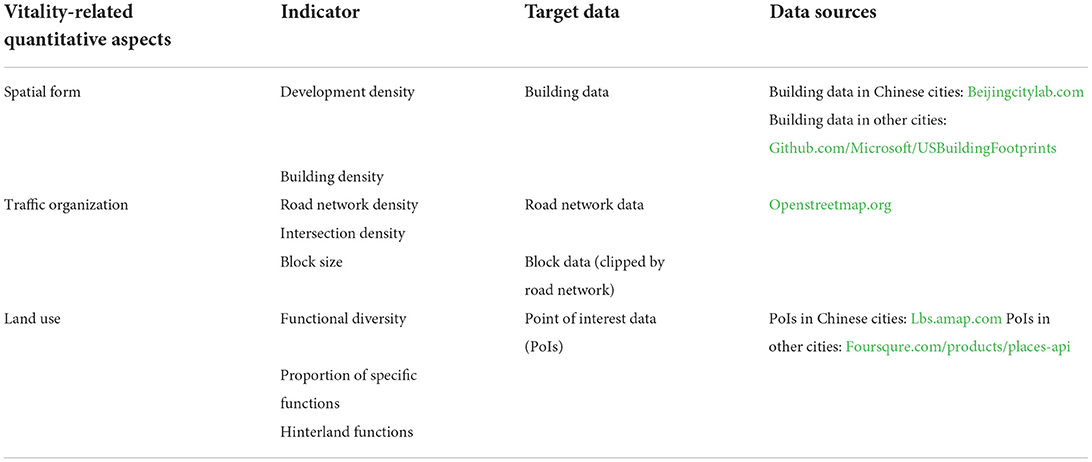
Table 2. Quantitative indicators and their related data sources.
The aspect of spatial form is described with three indicators—development density, building density, and building heights—and can be calculated using the three-dimensional spatial data. Building density and development intensity reveal the spatial utilization in horizontal and vertical directions, respectively (Hoppenbrouwer and Louw, 2005). An appropriate level of building density and development intensity can bring vitality to the coastal zone by shaping the interface of public spaces to attract social activities (Liu et al., 2021). Mathematically, the development density [refer to Eq. (1)], building density [refer to Eq. (2)], and building height [refer to Eq. (3)] can be defined as follows:
Where,
FAR: the development density of the coastal zone
Sgf: the total floor acreage of buildings in the coastal zone
S: the total acreage of the coastal zone
Where,
BCR: the average building density of the coastal zone
Sba: the vertical projection acreage of buildings in the coastal zone
S: the total acreage of the coastal zone
Where,
H: the building height
Havg: the average height of buildings within the block
The aspect of traffic organization encompasses the density of road networks and intersections and the sizes of street blocks. Road network density, intersection density, and block size can efficiently indicate whether the local traffic organization supports the effective development of coastal zones. Road network density illustrates the level of accessibility within the area and to other districts (Wang M. et al., 2020); the intersection density and block size are normally used to show how welcoming this area are to pedestrians (Jin et al., 2017) and how the spatial connectivity is handled in the coastal zone, respectively (Boulos, 2016). Based on the road network data obtained from Google Open Street Map, typology networks were built for the eight case studies to perform a large-scale calculation on urban road network indicators. Among which, road network density [refer to Eq. (4)], intersection density [refer to Eq. (5)], and block size [refer to Eq. (6)] are defined as below:
Where,
D: the road network density
L: the total length of the road network, including the trunk roads, the collector roads, and the branch roads
A: the total land acreage of the coastal zone
Where,
I: the intersection density
Ri: the number of intersections
A: the total land acreage of the coastal zone
Where,
L: the block size
Lavg: the land acreage of block
The aspect of land use is described with functional diversity and specific functions. Twelve points of interests (PoIs) categories were obtained from the Google dataset, including: transportation, healthcare, sports leisure, life convenience, culture and education, shopping and dining, hotels, the scenic spot, commercial housing, finance and insurance, government agencies, and business companies. These were then sorted into four major categories including employment, living, recreation, and transportation, and then visually mapped accordingly. The mix-used functions that reflect the type of diverse facilities and the proportion of each type of facility concurrently were calculated through the entropy value (Jiang et al., 2022). PoIs with specific functions, such as catering services (Liu et al., 2018) and sport leisure facilities (Mu et al., 2021) that can contribute to spatial vitality, were also calculated. Hence, functional diversity [refer to Eq. (6)] and proportion of specific functions [refer to Eq. (7)] are defined as follows:
Where,
i=1, …, n
FM: the functional diversity
n: the number of PoIs categories within a block in the coastal zone
Pi: the proportion of the i type of PoIs
L: the length of the block
where,
BUM: the proportion of specific functions
n: the number of PoIs categories within a block in the coastal zone
Pi: the proportion of the i type of PoIs.
Qualitative indicator analysis methods
Four qualitative indicators, waterfront features, local identities, waterfront functions, and hinterland functions, responsible for coastal zone vitality were analyzed for two purposes. The first was to classify urban coastal zones so that the underlying reason for bringing vitality could be explored and the design implications could be developed on a typological basis. Among the four indicators, the functions of the waterfront areas should be regarded as the results of the waterfront features and hinterland functions. Also, local identities are represented by diverse historical and cultural resources which can hardly be set as a classification standard.
Therefore, waterfront features and hinterland functions are used as criteria for categorizing coastal zone types, while local identity and waterfront functions are analyzed together with quantitative indicators to develop design instructions on delivering vitality for each type. The same group of experts previously noted conducted traditional design analysis on the eight case study sites through photos, online materials, and open-sourced records to discuss qualitative results on the four vitality-related indicators.
Results
Coastal zone vitality presented by qualitative and quantitative indicators
Descriptive analysis of qualitative indicators
The eight cases are coastal cities located between latitudes 20 and 50°N. Among these, Vancouver is the political, cultural, tourism, and transportation center of western Canada and has a waterfront characterized by public spaces, such as beaches and squares, and the hinterland functions are mainly residences and business offices. Chicago has a coastline toward the east with waterfront leisure space composed of beaches and green spaces, with evident industrial cultural characteristics. Its hinterland has commerce and office buildings, as well as residences and industrial facilities. Toronto, a Northwest coast city of Canada, waterfront partly retains the reefs as the dominant natural features, while the rest of the waterfront largely handles public life with squares; hinterland functions are composed of commerce, business, and industries. Barcelona has a coastal zone dominated by ports and beaches, and its hinterland functions are mainly for living and commercial purposes.
Four Chinese cases are mainly coastal cities in its eastern region. Among these, Qingdao is in the southeast of the Shandong Peninsula, bordering the Yellow Sea on its east and south sides. Its coastal zone is mostly composed of beaches, ports, and reefs, and the hinterland functions include residences and commerce. Shenzhen and Zhuhai are coastal cities located in the south of Guangdong province, adjacent to the South China Sea. The waterfront of Shenzhen is dominated by greenways, reefs, and beaches, and its hinterland functions include business, industries, and residences. In Zhuhai, reefs and beaches are the major characteristics of the waterfront, with residence and office buildings as hinterland compositions. Haikou is in the northern part of Hainan Island, close to the South China Sea, and its waterfront contains green spaces, ports, beaches, and reefs. The major hinterland functions of Haikou are living and services, with a limited proportion of commerce and business.
Qualitative analysis results on the eight coastal cases are shown in Figure 2.
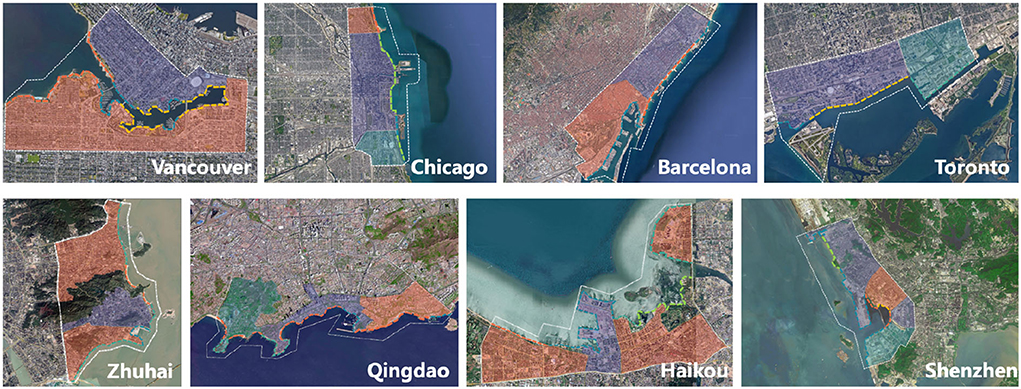
Figure 2. Qualitative analysis on the eight case study sites. (“ ” means reef, “
 ” means port, “
 ” means square/trail, “
 ” means green spaces, “
 ” means beach, “
 ” means living and services, “
 ” means industries and production, and “
 ” means commercial, cultural, and tourism).
Descriptive analysis of quantitative indicators
Numerous evidence suggests that an appropriate level of development density can facilitate urban vitality (Dovey and Pafka, 2014). A low level of development density has difficulty in supporting the aggregation of urban functions (Jiao, 2015) and the organization of multi-mode public transportation (Gharaibeh et al., 2022); this could impede commercial and social activities. People are also unlikely to use coastal zones when development density is too high, since the densified population and the oppressive building heights would negatively influence their perceived sense of comfort (Lan et al., 2021).
Figure 3 illustrates the development density analysis results of the eight case study sites. It is reflected that the overall mean density of the eight case study sites is relatively low, with a range between 1.0 and 4.0 km2/km2. Shenzhen has the highest development density (8.5 km2/km2), and the lowest is Toronto (1.2 km2/km2). The plot ratios of certain individual plots in Chicago are high, but the overall mean value still stays at a low level (1.8 km2/km2).
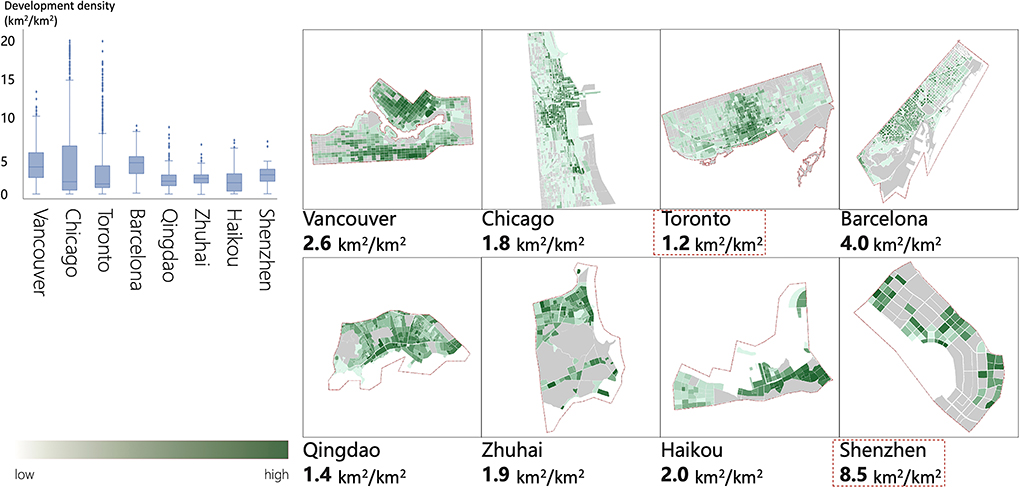
Figure 3. Development density analysis of the eight case study sites.
The vitality indicator of building density describes the spatial form aspect that can reveal the accessibility and availability of open spaces within the coastal zone (Ye et al., 2018). Building density should also be maintained at a moderate level to provide sufficient opportunities for the survival and lushness of open spaces, as well as to provide spaces for the elaborate design of surrounding landscapes. However, a too low or too high level of building density may either lead to unnecessary waste of land uses or uncomfortable human perception (Chen et al., 2022b). The analysis of the eight case study sites found that the building density of Barcelona (0.9 km2/km2) is the highest and Haikou (0.2 km2/km2) is the lowest, with the average density of all eight sites staying between 0.25 and 0.4 km2/km2 (Figure 4).
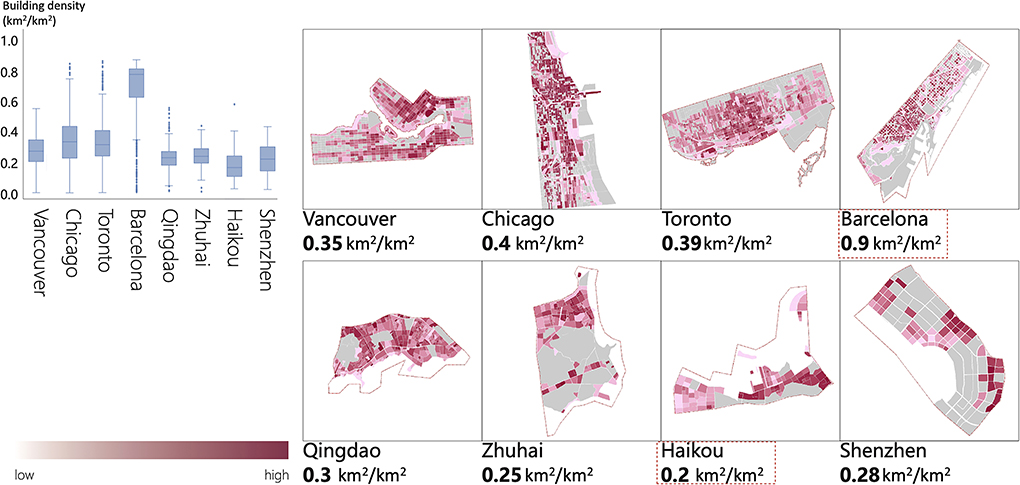
Figure 4. Building density analysis of eight case study sites.
Among the three traffic organization indicators, a high level of road network and intersection density has been proven to be positively related to spatial vitality (Long et al., 2019). Figure 5 indicates the road network density analysis results with an average appeared to be 13.0–18.0 km/km2. The road network density of Barcelona and Chicago reaches over 22.0 km/km2, but the highest density in Chinese sites is only 17.5 km/km2 (Qingdao). The site with the lowest road network density among all case study sites is Shenzhen (8.5 km/km2). As for the intersection density results presented in Figure 6, Toronto (105.0 per km2) ranks as the highest, while Shenzhen (9.5 per km2) and Chicago (10.0 per km2) have the fewest intersections within the coastal zones. The mean intersection density of the eight sites is 20.0–55.0 per km2.
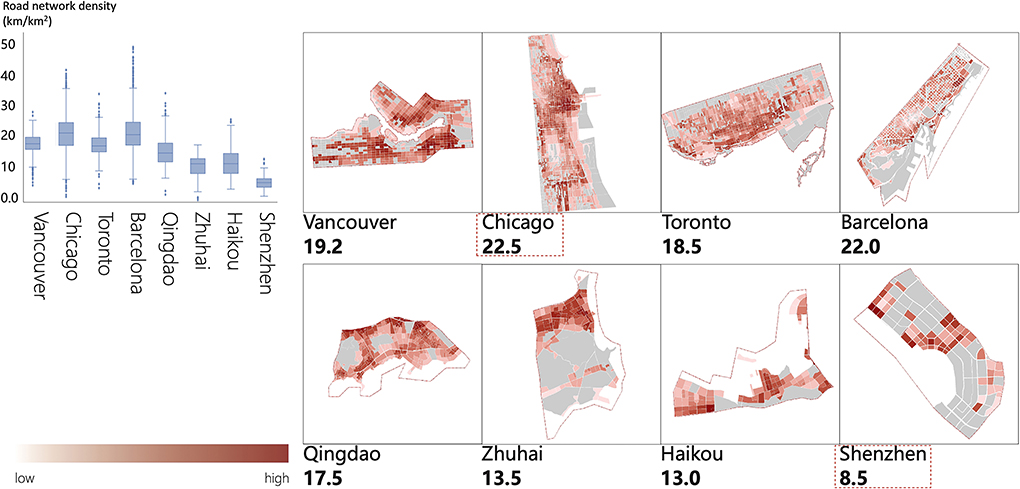
Figure 5. Road network density analysis of eight case study sites.
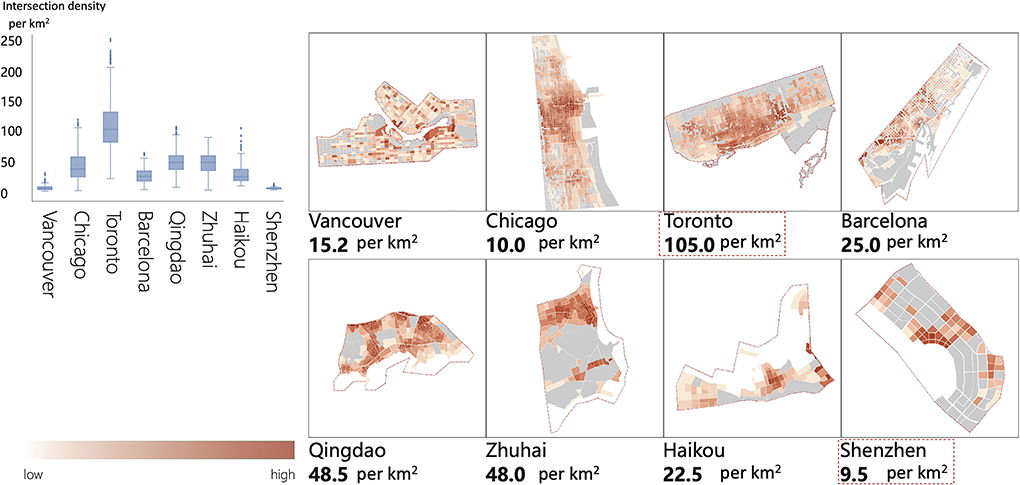
Figure 6. Intersection density analysis of the eight case study sites.
Small size (around 25.0 ha) of street blocks is widely encouraged (Ewing et al., 2016), since existing evidence indicates blocks at this scale can effectively improve local vitality by enhancing spatial connections (Zhang et al., 2021), encouraging social life at street edges (Yin and Wang, 2016), promoting mixed land uses (Long et al., 2019), and providing comfortable walking experiences (Hassan and Elkhateeb, 2021). Results show that all eight case study sites have block sizes under 25.0 ha, with an average of less than 3.0 ha (Figure 7). Chinese coastal zones have relatively larger block sizes compared to the others, especially in Shenzhen (12.5 ha) and Haikou (11.0 ha; Figure 7).
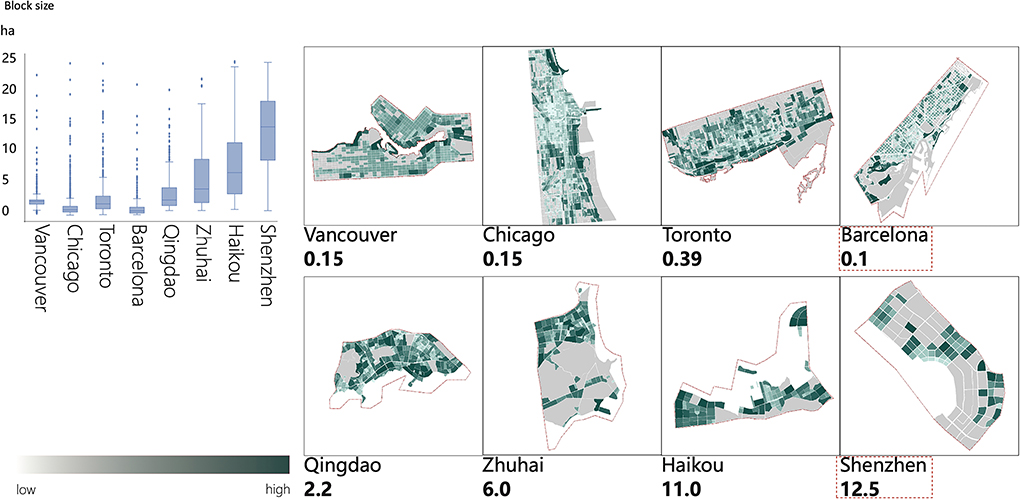
Figure 7. Block size analysis of the eight case study sites.
Functional diversities and the proportion of specific functions were used to indicate the land use aspect of coastal vitality. A moderate level of mixed functions in a block can provide residents with convenient life services and encourage walking activities to enhance the vitality within the area (Im and Choi, 2019). Results in Figure 8 suggested that the overall functional mixing value of Barcelona ranks highest (7.7%), followed by Chicago (7.3%), Qingdao (7.2%), and Zhuhai (6.8%). Functional diversities of the other four sites, however, are relatively low, with an average value between 3.0 and 8.0% (Figure 8). Another indicator in this aspect, the proportion of specific functions, is used to reflect the main functional attributes of blocks (Chen et al., 2022a). The analysis results reveal that most blocks within coastal zones of Vancouver, Chicago, Toronto, and Barcelona are dominated by residences and corresponding living and service functions, while in Qingdao, Shenzhen, and Haikou, the proportion of employment functions is distinctly higher than residential and recreational functions (Figure 9).
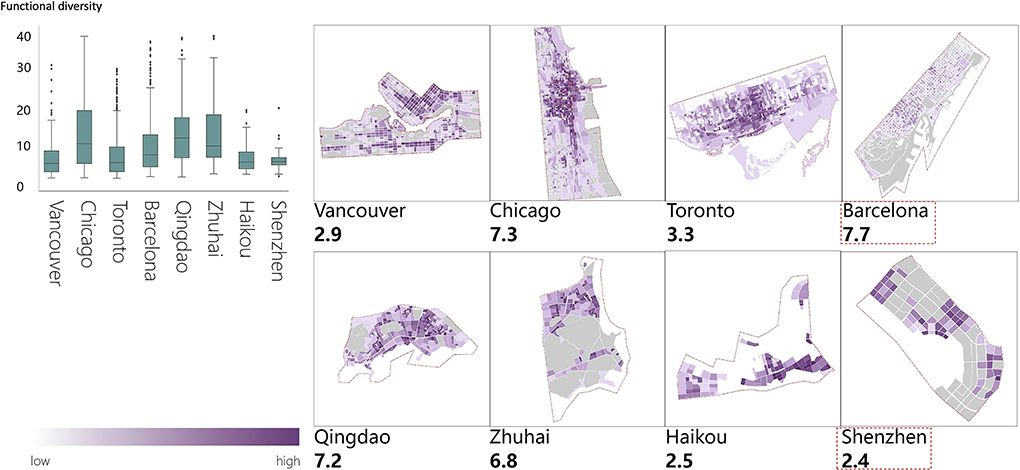
Figure 8. Functional diversities in the eight case study sites.
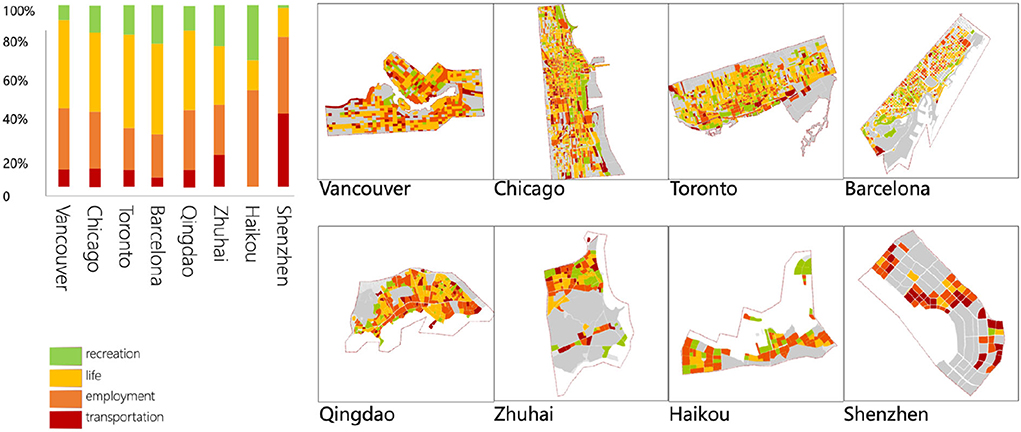
Figure 9. The proportion of specific functions in the eight case study sites.
Quantitative analysis results of the selected eight case study coastal zones are summarized in Table 3.
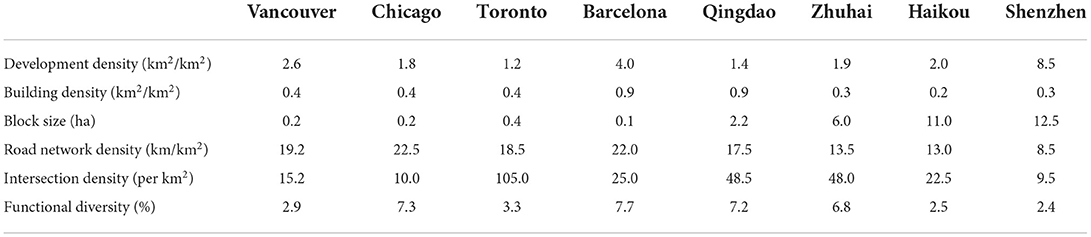
Table 3. The summary of quantitative analysis results of the selected eight case study coastal zones.
Classifying urban coastal zones based on qualitative analysis results
Urban coastal zones have different landscape characteristics due to their different contexts, such as geographical locations, climates, topography, and geomorphology. Waterfront features of the case study sites can be divided into soft and hard types; the soft types are those dominated by natural elements like beaches and green spaces, while the hard types are mainly dominated by ports, roads, squares, or reefs. Within hinterland functions, there are three basic types include living and services, industries and production, and commercial, cultural, and tourism. Through the combinative considerations of waterfront features and hinterland functions, urban coastal zones are classified into six major types (Figure 10); a hard waterfront with living and services as the major hinterland functions (H1), a hard waterfront with industries and production as the major hinterland functions (H2), a hard waterfront with commercial, cultural and tourism as the major hinterland functions (H3), a soft waterfront with living and services as the major hinterland functions (S1), a soft waterfront with industries and production as the major hinterland functions (S2), and a soft waterfront with commercial, cultural and tourism as the major hinterland functions (S3). The classification results of the selected eight coastal study sites are summarized in Table 4.
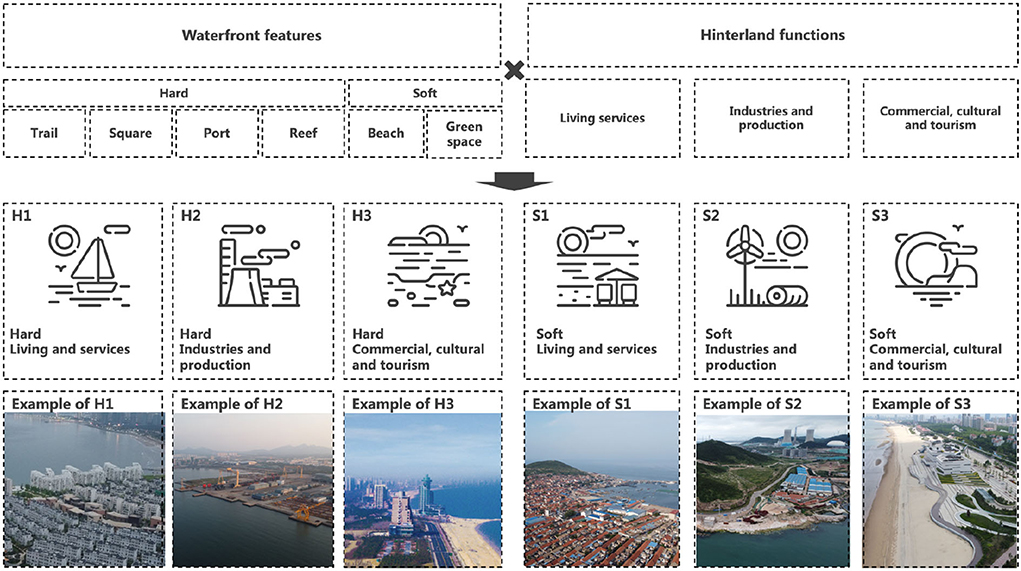
Figure 10. The classification results of urban coastal zones. The illustration photos were taken by the author.
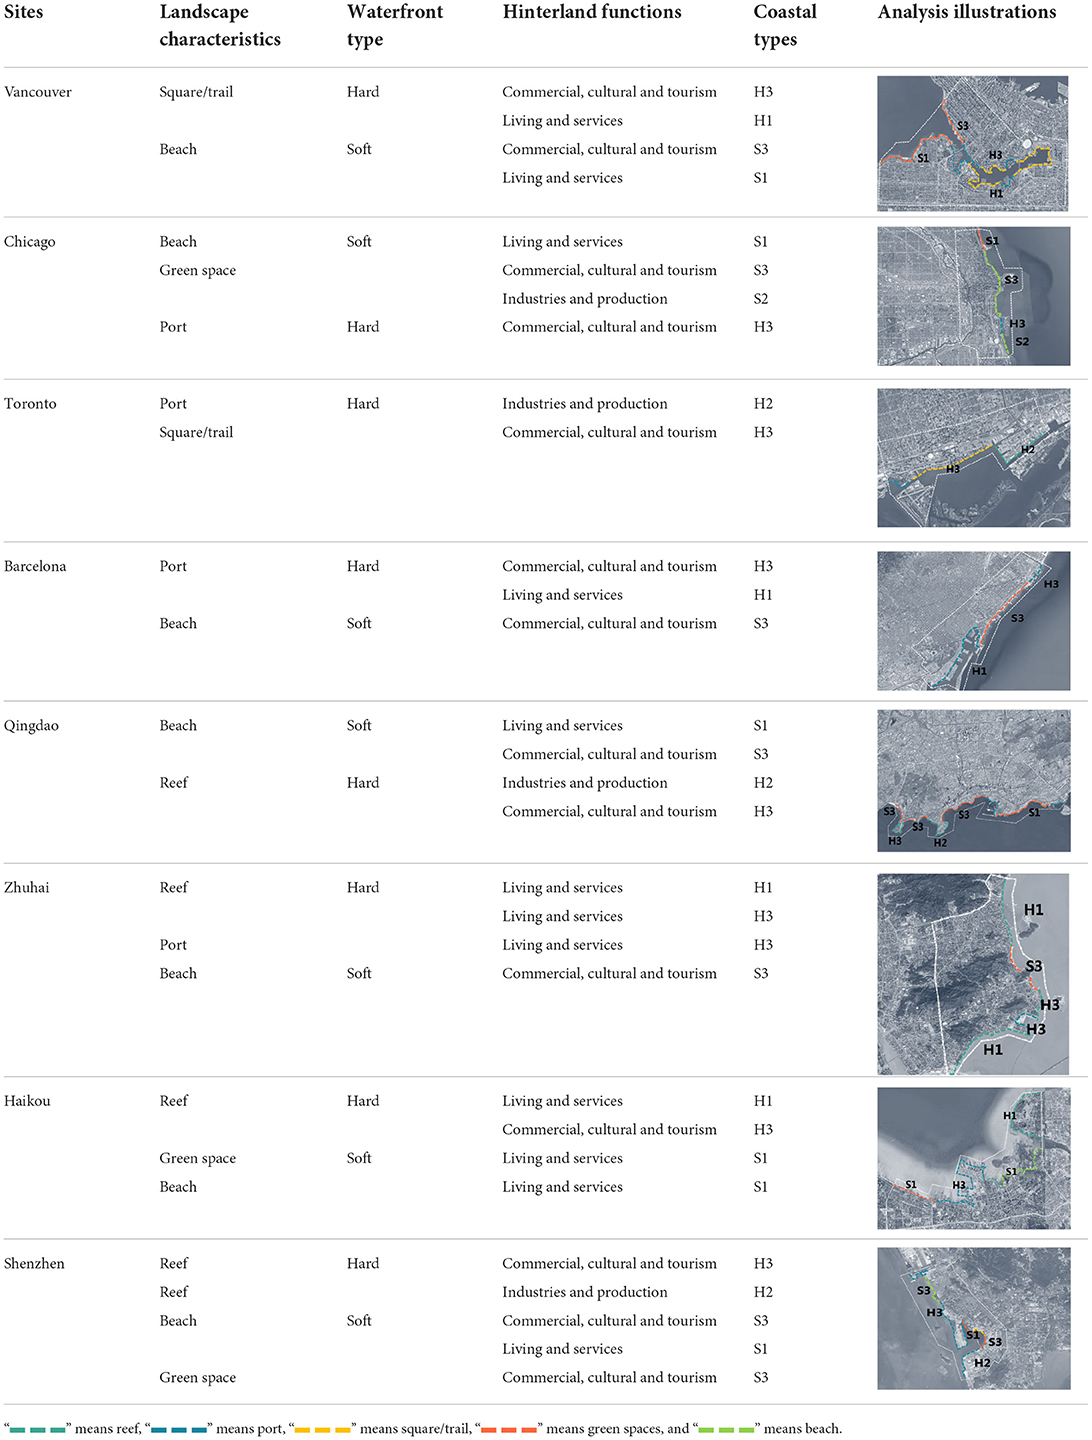
Table 4. The classification results of the selected eight coastal zones.
Design implications for vital urban coastal zones
The results of the quantitative and qualitative analysis disclosed the environmental drives of urban coastal zone vitality (Table 5), which informed a way to develop design implications, respectively, for the six coastal types.
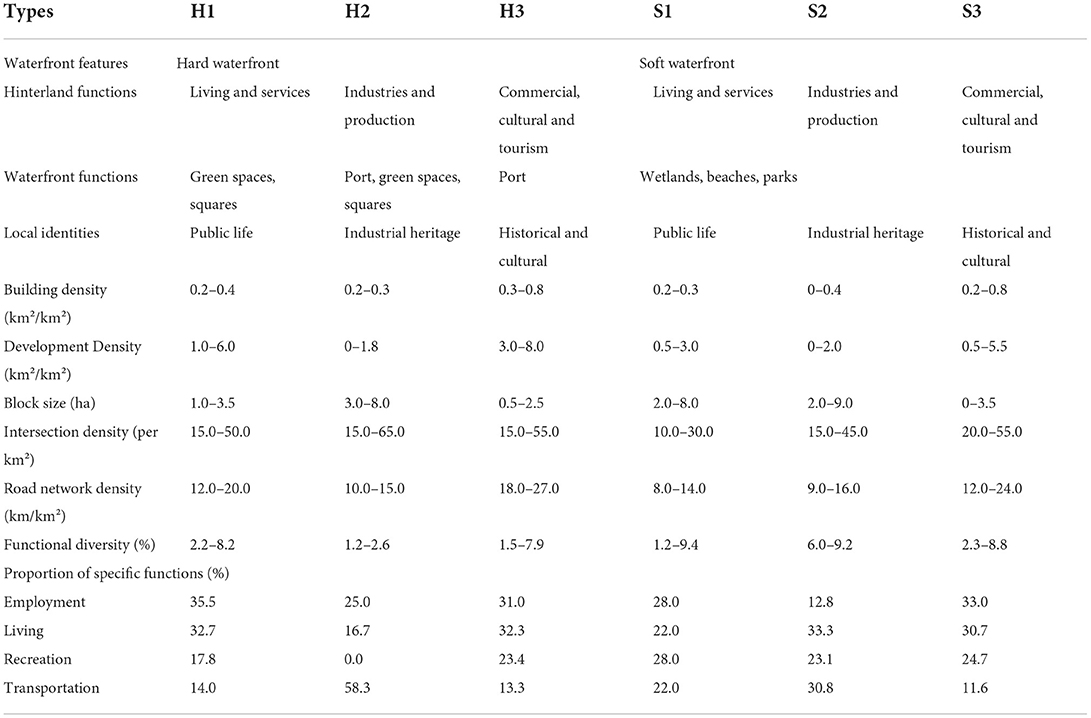
Table 5. Environmental drivers of coastal vitality based on typological analysis.
The H1 type is coastal zones with hard waterfront characteristics, such as reefs, ports, and squares, and hinterland functions are mostly composed of living and services. Green spaces and squares that can manage public life are recommended as the major waterfront functions. For this type of coastal zones, a relatively wide range of development density of 1.0–6.0 km2/km2 is allowed for delivering vitality but building density should be controlled within 0.2–0.4 km2/km2. Road network density and intersection density can also be flexible in the design requirements. Results indicate that 12.0–20.0 km/km2 of road network density and a range of 15.0–50.0 per km2 intersection density are beneficial to promote local vitality for this type. The block size in this coastal zone is encouraged to be around 1.0–3.5 ha, and functional diversity is encouraged to be within 2.2%−8.2%.
The H2 type is coastal zones characterized by hard waterfronts with industries and production as the major hinterland functions. The waterfronts can contain public spaces, and ports and other industrial heritages should be kept as landmarks. Research findings suggest development density should be controlled at under 1.8 km2/km2, and the building density should be between 0.2 and 0.3 km2/km2 to enhance the vitality of coastal zones. The control over intersection density can be loose (15.0–65.0 per km2), but a higher level of road network density (10.0–15.0 km/km2) is suggested. The acreage of block sizes between 3.0 and 8.0 ha and a low level of functional diversity (1.2%−2.6%) for each block are regarded as conducive to coastal vitality as well.
The H3, the last type with hard waterfronts, has commercial, cultural, and tourism as the dominant hinterland functions and should develop local history and culture as its coastal zone identity to provide tourist attractions. According to the results, both indicators of the spatial form aspect should be controlled at a high level, with development density between 3.0 and 8.0 km2/km2 and building density between 0.3 and 0.8 km2/km2. These two have the highest ranges of design requirements among the six coastal zone types. As for the traffic organization, road network density is suggested within 18.0–27.0 km/km2 and the block size between 0.5 and 2.5 ha. There is also a loose range of requirements for the indicators of intersection density (15.0–55.0 per km2) and functional diversity (1.5–7.9%).
The S1 type refers to coastal zones with soft waterfronts, such as wetlands, green spaces, and beaches, with residential and services as hinterland functions. The waterfronts should be characterized by public spaces, such as green spaces and squares, to provide a perception of leisure to local residents. Building density (0.2–0.3 km2/km2) and development density (0.5–3.0 km2/km2) should be low to encourage the aggregation of high-quality residential neighborhoods. The size of blocks, therefore, can be relatively large (2.0–8.0 ha). A moderate level of intersection density (10.0–30.0 per km2) and a low level of road network density (8.0–14.0 km/km2) are needed to bring vitality to this coastal zone type. Functional diversity is suggested to be within 1.2–9.4%.
The S2 type is coastal zones with soft waterfront characteristics; the hinterland functions are primarily composed of industries and production. Its industrial heritage can be regenerated into public spaces and can also serve as landmarks. The maximum that development density can reach is 2.0 km2/km2 but building density should be controlled under 0.4 km2/km2. Intersection density (15.0–45.0 per km2) and road network density (9.0–16.0 km/km2) should be at a moderate level, while the block can have a larger size with a range between 2.0 and 9.0 ha. Functional diversity between 6.0 and 9.2% is concluded from the analysis as being beneficial to deliver coastal vitality.
The S3 is the last type with the coastal zones characterized by the soft waterfront. It has commercial, cultural, and tourism as the major hinterland functions. Local historical and cultural characteristics should be emphasized along the corridors connecting the hinterland and the waterfront to lead tourists to a full exploration of the coastal zone. This type has the widest range for building density (0.2–0.8 km2/km2) among all six types, and development density is suggested to be between 0.5 and 5.5 km2/km2. Road network density (12.0–24.0 km/km2) and intersection density (20.0–55.0 per km2) should be controlled at a moderate level, while small block sizes (0–3.5 ha) are encouraged for this type. As for functional diversity, there is a relatively wide range of requirements 2.3–8.8%.
The comparison of the six types of urban coastal zones shows that waterfront functions and local identities should be in line with waterfront features and hinterland functions to facilitate coastal zone vitality. The range of the quantitative vitality indicators of the six coastal zone types also varies evidently with the hinterland functions, but there are similarities in vitality design control among the types with similar waterfront features. For example, the types of H3 and S3 both have the widest and highest ranges of development and building density. Similarities are also observed between H2 and S2 in terms of almost all vitality indicators, and the block sizes of these two types cover the widest and highest ranges. As for the H1 and S1 with hinterland functions of living and services, they have similar recommended design requirements on the indicators of building densities and block sizes. The most evident difference that is observed between coastal zones with similar hinterland functions is in functional diversity in H2 and S2; H2 has a range of 1.2–2.6%, while S2 is between 6.0 and 9.2%.
Discussion and conclusion
This study explores environmental drivers to deliver urban coastal zone vitality by analyzing the eight coastal zone cases. Eleven indicators were identified from the literature as being influential to coastal zone vitality, including development density, building density, road network density, intersection density, block size, functional diversity, proportion of specific functions, waterfront features, local identities, waterfront functions, and hinterland functions. In general, spatial form, function, and consistency between them are the key determinants of urban coastal zone vitality.
Six urban coastal zone types were classified based on their waterfront features and hinterland functions. Results suggested that coastal types with similar hinterland functions have similar characteristics of building density, block size, road network density, and functional diversity, while development density and intersection density are more likely to be affected by waterfront features. In the respect of spatial form, costal zones with hinterland functions of commercial, cultural, and tourism require a relatively high level of building and development density to provide sufficient human activities (Desfor and Jørgensen, 2004), as well as the small size of blocks to increase walkability (Sha et al., 2014). A relatively loose spatial form with a low level of building and development density and medium size of building blocks can be more favorable when coastal zone vitality needs to be balanced with other quality of life, for example, living and production. A high level of road network density and intersection density is also necessary for coastal zone vitality, especially for the type with commercial, cultural, and tourism as hinterland functions. This can possibly be explained by their positive relationship with walkability and connectivity (Li et al., 2020). In addition, the importance of functional diversity to urban vitality has been confirmed in this and existing studies (Im and Choi, 2019), though there are no differences in design constraints found for different coastal zone types.
Though research findings appear to be conclusive, there are limitations that exist in this research design and analysis. First, only eight coastal zone design case studies were selected to control their construction levels, locations, orientations, the scales of hinterlands, and the lengths of the coastal zones. The number of case studies is also constrained by the lack of an efficient way, and the case study selection since, to date, there are still no consistent definitions of urban coastal zone vitality. Though the emerging deep learning algorithms provided bases for large-scale image analysis, they have their shortages in identifying qualitative attributes and their application is also limited greatly by the generality of training datasets. With the development of artificial intelligence, the continuous accumulation of basic datasets as well as the vitality contributors disclosed in this study, they can together be used in evaluating the vitality of worldwide urban coastal zones and then, in turn, refine the definition and the contributors. Also, research outcomes may also be affected by the accuracy of the obtained data since for most potential indicators; Google is the only data source involved. Besides, a part of the quantitative data was retrieved from open-sourced government websites of different counties and the investigation years were slightly different—this could also bias the analysis results. The use of multiple data sources and robustness tests in future similar studies can help reduce data errors, though data collection standards may differ across platforms.
To conclude, this study set out from clarifying the social-spatial boundary of urban coastal zones and proposed a typological basis for future relevant research. Through a data-based case study analysis, a comprehensive perspective of understanding how urban coastal zone vitality was developed. Research outcomes provide cues for designing dynamic urban coastal zones that can be straightforwardly relevant to environmental planning and design aspects and are responsive and adaptable to local contexts. More importantly, they can be applied to coastal zones with similar characteristics or within the same categories, and thus, have practical values in promoting coastal city development strategies.
Data availability statement
Publicly available datasets were analyzed in this study. This data can be found at: [Beijingcitylab.com] [Github.com/Microsoft/USBuildingFootprints][https://Openstreetmap.org][Lbs.amap.com][Foursqure.com/products/places-api][Ditu.amap.com][Gditu.net].
Author contributions
YY and YS: conceptualization, methodology, validation, resources, and writing—review and editing. YH and HL: software, investigation, and visualization. YY, YH, and HL: formal analysis. YY: data curation and writing—original draft preparation. YS: supervision, project administration, and funding acquisition. All authors contributed to the article and approved the submitted version.
Funding
This research was funded by the Nature Science Foundation of China: 51808393; Shanghai Post-doctoral Excellence Program: 2021357; Restorative Urbanism Research Center (RURC), Joint Laboratory for International Cooperation on Eco-Urban Design, Tongji University (CAUP-UD-06).
Conflict of interest
The authors declare that the research was conducted in the absence of any commercial or financial relationships that could be construed as a potential conflict of interest.
Publisher's note
All claims expressed in this article are solely those of the authors and do not necessarily represent those of their affiliated organizations, or those of the publisher, the editors and the reviewers. Any product that may be evaluated in this article, or claim that may be made by its manufacturer, is not guaranteed or endorsed by the publisher.
References
Balasubramanian, G., Suresh, S., Goswami, S., Swaminathan, B., and Pereira, G. F. (2022). Delineation of sensitive coastal zone of northern Ramanathapuram coast, Tamilnadu, India, using a GIS approach. Geodesy Geodynam. 13, 456–463. doi: 10.1016/j.geog.2022.03.004
Barragán, J. M., and De Andrés, M. (2015). Analysis and trends of the world's coastal cities and agglomerations. Ocean Coastal Manage. 114, 11–20. doi: 10.1016/j.ocecoaman.2015.06.004
Boulos, J. (2016). Sustainable development of coastal cities-proposal of a modelling framework to achieve sustainable city-port connectivity. Proc. Soc. Behav. Sci. 216, 974–985. doi: 10.1016/j.sbspro.2015.12.094
Bunce, S. (2011). Public-Private Sector Alliances in Sustainable Waterfront Revitalization: Policy, Planning, and Design in the West Don Lands. Toronto: University of Toronto Press, 287–304.
Carter, R. W. G. (2013). Coastal Environments: An Introduction to the Physical, Ecological, and Cultural Systems of Coastlines. Amsterdam: Elsevier Science.
Chen, Y., Yang, J., Yang, R., Xiao, X., and Xia, J. (2022a). Contribution of urban functional zones to the spatial distribution of urban thermal environment. Building Environ. 216, 109000. doi: 10.1016/j.buildenv.2022.109000
Chen, Z., Dong, B., Pei, Q., and Zhang, Z. (2022b). The impacts of urban vitality and urban density on innovation: evidence from China's Greater Bay Area. Habitat Int. 119, 102490. doi: 10.1016/j.habitatint.2021.102490
Council, N. R. (1993). Managing Waste Water in Coastal Urban Areas. Washington, DC: National Academies Press.
Da, T., and Xu, Y. (2016). Evaluation on connectivity of urban waterfront redevelopment under hesitant fuzzy linguistic environment. Ocean Coastal Manage. 132, 101–110. doi: 10.1016/j.ocecoaman.2016.08.014
Delclòs-Alió, X., and Miralles-Guasch, C. (2018). Looking at Barcelona through Jane Jacobs's eyes: mapping the basic conditions for urban vitality in a Mediterranean conurbation. Land Use Policy 75, 505–517. doi: 10.1016/j.landusepol.2018.04.026
Desfor, G., and Jørgensen, J. (2004). Flexible urban governance. The case of Copenhagen's recent waterfront development. Eur. Plann. Stu. 12, 479–496. doi: 10.1080/0965431042000212740
Dovey, K., and Pafka, E. (2014). The urban density assemblage: modelling multiple measures. Urban Design Int. 19, 66–76. doi: 10.1057/udi.2013.13
Duck, R. W. (2012). Marine spatial planning: managing a dynamic environment. J. Environ. Policy Plan. 14, 67–79. doi: 10.1080/1523908X.2012.664406
Ewing, R., Hajrasouliha, A., Neckerman, K. M., Purciel-Hill, M., and Greene, W. (2016). Streetscape features related to pedestrian activity. J. Plan. Educ. Res. 36, 5–15. doi: 10.1177/0739456X15591585
Gharaibeh, A. A., Tawil, H. S., and Alomari, A. H. (2022). Developing an indicative spatial accessibility analysis tool for urban public transportation system. Case Studies Trans. Policy 10, 175–186. doi: 10.1016/j.cstp.2021.11.015
Gill, A. B. (2005). Offshore renewable energy: Ecological implications of generating electricity in the coastal zone. J. Appl. Ecol. 42, 605–615. doi: 10.1111/j.1365-2664.2005.01060.x
Godschalk, D. R., Brower, D. J., and Beatley, T. (1989). Catastrophic Coastal Storms: Hazard Mitigation and Development Management. Durham, NC: Duke University Press.
Gotham, K. F. (2002). Marketing mardi gras: commodification, spectacle and the political economy of tourism in New Orleans. Urban Stu. 39, 1735–1756. doi: 10.1080/0042098022000002939
Hagerman, C. (2007). Shaping neighborhoods and nature: urban political ecologies of urban waterfront transformations in Portland, Oregon. Cities 24, 285–297. doi: 10.1016/j.cities.2006.12.003
Hassan, D. K., and Elkhateeb, A. (2021). Walking experience: exploring the trilateral interrelation of walkability, temporal perception, and urban ambiance. Front. Architec. Res. 10, 516–539. doi: 10.1016/j.foar.2021.02.004
Hoppenbrouwer, E., and Louw, E. (2005). Mixed-use development: theory and practice in Amsterdam's eastern docklands. Eur. Plann. Stu. 13, 967–983. doi: 10.1080/09654310500242048
Hoyle, B. (1999). Scale and sustainability: the role of community groups in Canadian port-city waterfront change. J. Trans. Geograph. 7, 65–78. doi: 10.1016/S0966-6923(98)00030-1
Hurley, A. (2006). Narrating the urban waterfront: the role of public history in community revitalization. Pub. Histor. 28, 19–50. doi: 10.1525/tph.2006.28.4.19
Im, H. N., and Choi, C. G. (2019). The hidden side of the entropy-based land-use mix index: Clarifying the relationship between pedestrian volume and land-use mix. Urban Stud. 56, 1865–1881. doi: 10.1177/0042098018763319
Ioppolo, G., Saija, G., and Salomon, E. R. (2013). From coastal management to environmental management: the sustainable eco-tourism program for the mid-western coast of Sardinia (Italy). Land Use Policy 31, 460–471. doi: 10.1016/j.landusepol.2012.08.010
Jiang, Y., Han, Y., Liu, M., and Ye, Y. (2022). Street vitality and built environment features: A data-informed approach from fourteen chinese cities. Sustain. Cities. Soc. 79, 103724. doi: 10.1016/j.scs.2022.103724
Jiao, L. (2015). Urban land density function: a new method to characterize urban expansion. Landscape Urban Plan. 139, 26–39. doi: 10.1016/j.landurbplan.2015.02.017
Jin, X., Long, Y., Sun, W., Lu, Y., Yang, X., and Tang, J. (2017). Evaluating cities' vitality and identifying ghost cities in China with emerging geographical data. Cities 63, 98–109. doi: 10.1016/j.cities.2017.01.002
Lan, H., Lau, K. L., Shi, Y., and Ren, C. (2021). Improved urban heat island mitigation using bioclimatic redevelopment along an urban waterfront at Victoria Dockside, Hong Kong. Sust. Cities Soc. 74, 103172. doi: 10.1016/j.scs.2021.103172
Latip, N. S. A., Shamsudin, S., and Liew, M. S. (2012). Functional dimension at ‘Kuala Lumpur Waterfront'. Proc. Soc. Behav. Sci. 49, 147–155. doi: 10.1016/j.sbspro.2012.07.013
Lehrer, U., and Laidley, J. (2008). Old mega-projects newly packaged? Waterfront redevelopment in Toronto. Int. J. Urban Reg. Res. 32, 786–803. doi: 10.1111/j.1468-2427.2008.00830.x
Li, M., Shen, Z., and Hao, X. (2016). Revealing the relationship between spatio-temporal distribution of population and urban function with social media data. Geo J. 81, 919–935. doi: 10.1007/s10708-016-9738-7
Li, S., Wu, C., Lin, Y., Li, Z., and Du, Q. (2020). Urban morphology promotes urban vibrancy from the spatiotemporal and synergetic perspectives: a case study using multisource data in Shenzhen, China. Sustainability 12, 4829. doi: 10.3390/su12124829
Li, X., Li, Y., Jia, T., Zhou, L., and Hijazi, I. H. (2022). The six dimensions of built environment on urban vitality: fusion evidence from multi-source data. Cities 121, 103482. doi: 10.1016/j.cities.2021.103482
Liu, S., Lai, S. Q., Liu, C., and Jiang, L. (2021). What influenced the vitality of the waterfront open space? A case study of Huangpu River in Shanghai, China. Cities 114, 103197. doi: 10.1016/j.cities.2021.103197
Liu, X., Zhu, Z., Jin, L., Wang, L., and Huang, C. (2018). Measuring patterns and mechanism of greenway use–A case from Guangzhou, China. Urban Forestry Urban Greening 34, 55–63. doi: 10.1016/j.ufug.2018.06.003
Long, Y., and Huang, C. (2019). Does block size matter? The impact of urban design on economic vitality for Chinese cities. Environ. Plann. B Urban Anal. City Sci. 46, 406–422. doi: 10.1177/2399808317715640
Long, Y., Huang, C. J. E., Analytics, P. B. U., and Science, C. (2019). Does block size matter? The impact of urban design on economic vitality for Chinese cities. Environ. Plan. B Urban Anal. City Sci. 46, 406–422. doi: 10.1177/2399808317715
Maged, M., Zurina, S., and Mazlan, H. (2010). Mapping coastal geomorphology changes using synthetic aperture radar data. Int. J. Phys. Sci. 5, 1890–1896.
Mansournia, S., Gharaei, F., and Bahrami, B. (2016). Behavior mapping, an approach to assessment of urban spaces responsiveness. case study: recreational space of zrêbar lake Waterfront, Marivan, Kurdistan. Motaleate Shahri 5, 77–90.
Marghany, M. (2014). Simulation of three-dimensional of coastal erosion using differential interferometric synthetic aperture radar. Global NEST Journal, 16, 80–86. doi: 10.30955/gnj.001055
Martínez, M. L., Intralawan, A., Vázquez, G., Pérez-Maqueo, O., Sutton, P., and Landgrave, R. (2007). The coasts of our world: Ecological, economic and social importance. Ecol. Econ. 63, 254–272. doi: 10.1016/j.ecolecon.2006.10.022
Mu, B., Liu, C., Mu, T., Xu, X., Tian, G., Zhang, Y., et al. (2021). Spatiotemporal fluctuations in urban park spatial vitality determined by on-site observation and behavior mapping: a case study of three parks in Zhengzhou City, China. Urban Forestry Urban Greening 64, 127246. doi: 10.1016/j.ufug.2021.127246
Niu, Y., Mi, X., and Wang, Z. (2021). Vitality evaluation of the waterfront space in the ancient city of Suzhou. Front. Architec. Res. 10, 729–740. doi: 10.1016/j.foar.2021.07.001
Norcliffe, G., Bassett, K., and Hoare, T. (1996). The emergence of postmodernism on the urban waterfront: geographical perspectives on changing relationships. J. Transp. Geograph. 4, 123–134. doi: 10.1016/0966-6923(96)00005-1
Othman, A., Al-Hagla, K., and Hasan, A. E. (2021). The impact of attributes of waterfront accessibility on human well-being: Alexandria Governorate as a case study. Ain Shams Eng. J. 12, 1033–1047. doi: 10.1016/j.asej.2020.08.018
Papatheochari, T., and Coccossis, H. (2019). Development of a waterfront regeneration tool to support local decision making in the context of integrated coastal zone management. Ocean Coastal Manage. 169, 284–295. doi: 10.1016/j.ocecoaman.2018.12.013
Romero, V. P., Maffei, L., Brambilla, G., and Ciaburro, G. (2016). Modelling the soundscape quality of urban waterfronts by artificial neural networks. App. Acoust. 111, 121–128. doi: 10.1016/j.apacoust.2016.04.019
Sairinen, R., and Kumpulainen, S. (2006). Assessing social impacts in urban waterfront regeneration. Environ. Impact Assessment Rev. 26, 120–135. doi: 10.1016/j.eiar.2005.05.003
Sha, Y., Wu, J., Ji, Y., Chan, S. L. T., and Lim, W. Q. (2014). Xuhui Waterfront Area: Urban Restructuring for Quality Waterfront Working and Living. Shanghai Urbanism at the Medium Scale. Berlin: Springer.
Thirumurthy, S., Jayanthi, M., Samynathan, M., Duraisamy, M., Kabiraj, S., and Anbazhahan, N. (2022). Multi-criteria coastal environmental vulnerability assessment using analytic hierarchy process based uncertainty analysis integrated into GIS. J. Environ. Manage. 313, 114941. doi: 10.1016/j.jenvman.2022.114941
Unt, A. L., and Bell, S. (2014). The impact of small-scale design interventions on the behaviour patterns of the users of an urban wasteland. Urban Forestry Urban Green. 13, 121–135. doi: 10.1016/j.ufug.2013.10.008
Wakefield, S. (2007). Great expectations: waterfront redevelopment and the hamilton harbour waterfront trail. Cities 24, 298–310. doi: 10.1016/j.cities.2006.11.001
Wang, F., Zhao, M. X., and Meng, Q. L. (2020). Analysis of the vitality measurement and correlation factors of urban waterfront space. IOP Conf. Series Earth Environ. Sci. 612, 012013. doi: 10.1088/1755-1315/612/1/012013
Wang, M., Chen, Z., Mu, L., and Zhang, X. (2020). Road network structure and ride-sharing accessibility: A network science perspective. Comput. Environ. Urban Syst. 80, 101430. doi: 10.1016/j.compenvurbsys.2019.101430
Woo, S. W., Omran, A., Lee, C. L., and Hanafi, M. H. (2017). The impacts of the waterfront development in Iskandar Malaysia. Environ. Dev. Sust. 19, 1293–1306. doi: 10.1007/s10668-016-9798-3
Xie, P. F., and Gu, K. (2015). The changing urban morphology: waterfront redevelopment and event tourism in New Zealand. Tour. Manage. Persp. 15, 105–114. doi: 10.1016/j.tmp.2015.05.001
Yang, C., and Shao, B. (2018). Influence of waterfront public space elements on lingering vitality and strategies: taking two typical waterfronts along Huangpu River, Shanghai as examples. Urban. Archit 4, 40–47.
Yang, C., Shi, M., and Geng, H. (2018). Study on the pedestrian accessibility of waterfront area based on an understanding of urban fabric level: taking the estuary area of Suzhou River in Shanghai as an example. City Planning Rev. 42, 104–114.
Ye, Y., Li, D., and Liu, X. (2018). How block density and typology affect urban vitality: an exploratory analysis in Shenzhen, China. Urban Geograph. 39, 631–652. doi: 10.1080/02723638.2017.1381536
Yin, L., and Wang, Z. (2016). Measuring visual enclosure for street walkability: using machine learning algorithms and google street view imagery. App. Geograph. 76, 147–153. doi: 10.1016/j.apgeog.2016.09.024
Yu, Y., Zhaoxi, Z., Xiaohu, Z., and Wei, Z. (2019). Human-scale measurement of street space quality—a large-scale, high-accuracy evaluation framework combining street view data and new analytical techniques. Urban Plannin Int. 34, 18–27. doi: 10.22217/upi.2018.490
Keywords: urban coastal zone vitality, environmental drivers, typology, design implications, data-driven analysis
Citation: Yin Y, Shao Y, Lu H and Han Y (2022) Environmental drivers of the vital urban coastal zones: An explorative case study based on the data-driven multi-method approach. Front. Ecol. Evol. 10:962299. doi: 10.3389/fevo.2022.962299
Received: 06 June 2022; Accepted: 06 October 2022;
Published: 01 November 2022.
Edited by:
Ding Ma, Shenzhen University, ChinaReviewed by:
Prof-Maged Marghany, Syiah Kuala University, IndonesiaJanaka Bamunawala, University of Moratuwa, Sri Lanka
Copyright © 2022 Yin, Shao, Lu and Han. This is an open-access article distributed under the terms of the Creative Commons Attribution License (CC BY). The use, distribution or reproduction in other forums is permitted, provided the original author(s) and the copyright owner(s) are credited and that the original publication in this journal is cited, in accordance with accepted academic practice. No use, distribution or reproduction is permitted which does not comply with these terms.
*Correspondence: Yuhan Shao, shaoyuhan@tongji.edu.cn