Species richness and turnover patterns for tropical and temperate plants on the elevation gradient of the eastern Himalayan Mountains
 James H. Thorne1
  Hyeyeong Choe2*
  Lobzang Dorji3 Kezang Yangden3 Dorji Wangdi3
  Younten Phuntsho3 Karen Beardsley4
- 1Department of Environmental Science and Policy, University of California, Davis, Davis, CA, United States
- 2Department of Agriculture, Forestry and Bioresources, Seoul National University, Seoul, South Korea
- 3Department of Forest and Park Services, Ministry of Agriculture and Forests, Thimphu, Bhutan
- 4Global Affairs, University of California, Davis, Davis, CA, United States
Understanding species’ elevational distributions in mountain ecosystems is needed under climate change, but remote biodiverse mountain areas may be poorly documented. National Forest Inventories (NFIs) offer a potential source of data. We used NFI records from Bhutan to ask three questions about elevational richness patterns of Himalayan woody plant species. First, does the mean elevation for all species differ from those species whose entire elevational distribution is recorded in the survey? Second, how does the elevation of maximum richness differ when combining species originating from temperate and tropical regions vs. analyzing them separately? And third, do the highest species turnover rates adjoin elevation zones of maximum species richness? We used 32,198 species records from 1685 forest plots along a 7570 m gradient to map species elevation ranges. Species whose entire range was documented were those whose lowest records are located above 400 m, while bare rock defined all species’ upper limits. We calculated species richness and turnover using 400 m elevation bands. Of 569 species, 79% of temperate and 61% of tropical species’ elevation ranges were fully sampled within the NFI data. Mean elevation of tree and shrub species differed significantly for temperate and tropical species. Maximum combined species richness is from 1300 to 1700 m (277 species), differing significantly from maximum tropical (900–1300 m, 169) and temperate species richness (2500–2900 m, 92). Temperate tree turnover rate was highest in the bands adjoining its maximum species richness (2500–2900 m). But turnover for tropical trees was highest several bands above their maximum species richness, where turnover and decrease in richness interact. Shrub species turnover patterns are similar, but rates were generally higher than for trees. Bhutan’s NFI records show that woody plant species are arrayed on the Himalaya in part according to floristic origins, and that combining temperate- and tropical-originating floras for gradient-based studies such as species richness and turnover obscures actual elevational patterns. In addition, species whose ranges extend below the Himalayan elevation gradient should be accounted for in future studies that correlate climate and environment factors with elevational species richness patterns.
Introduction
The distribution of species’ elevations in mountain ecosystems is of interest as climate change progresses. This is partly because their range shifts on elevational gradients are more easily measured than across latitudinal distances, and because such shifts can offer insights into the effects of and biotic response to climate change. Among the questions being addressed using elevational gradients are species range dynamics (Breshears et al., 2008; Steinbauer et al., 2018), the relative impacts of water shortage on plant species interactions (Ale et al., 2018), and mid-elevation maxima hypotheses (Cardelús et al., 2006; Beck et al., 2017). However, many mountainous regions have been sparsely surveyed at landscape scales, which is problematic, as high levels of biodiversity are known or expected in lesser documented ranges, particularly the Andes (Hughes, 2016) and Himalayan Mountains (Miehe et al., 2015).
One region with relatively low species occurrence records is the eastern Himalaya, although many studies have used limited data to examine elevational patterns of woody vascular plant species, including Carpenter (2005); Behera and Kushwaha (2007), Acharya et al. (2011); Kluge et al. (2017), Manish et al. (2017); Rana et al. (2019), Sharma et al. (2019); Tiwari et al. (2020), and Hamid et al. (2021). The majority of these studies seek to quantify mid-elevation species richness patterns, to associate environmental predictors with elevational patterns of species richness or turnover, or to differentiate elevational distribution patterns according to various plant traits including endemism and life form. For field survey-based studies, the number of plots used has ranged from 40 (Tiwari et al., 2020) to 625 (Manish et al., 2017). Another widely used source of information has been species range descriptions from regional floras (Grytnes and Vetaas, 2002; Bhattarai and Vetaas, 2006; Khuroo et al., 2011; Feng et al., 2016; Kluge et al., 2017), or a combination of plots and floras (Rana et al., 2019). Most studies that consider species ranges rely at least in part on range descriptions in floras in this complex region, indicative of low availability of spatial records for species presences.
A little-tapped source of species locality records for biogeographic studies are recent national forest inventories (NFI), conducted by countries seeking to quantify the carbon attributes of their forestry sectors. NFIs include forest plot surveys that are used to calibrate remote sensing data, and which may document species of trees and other plants. In many cases herbarium samples are not collected at these plots, even while dominant plant species are identified. This leads to a fundamentally different type of occurrence record than those used to determine species ranges via voucher specimens, such as documented in global datasets like GBIF (GBIF.org, 2018). Nevertheless, NFI data have been used to describe turnover in forest composition (e.g., Gray et al., 2012) and to develop species range models across large areas (Pouteau et al., 2015). The advantage of NFI survey data is that large areas are systematically sampled, providing a data density often unavailable through collections, particularly in developing countries.
We used NFI data from the Himalayan Mountains of Bhutan (Forest Resources Management Division [FRMD], 2016; Figure 1) to quantify the elevation distributions of woody plant species based on field observations only. Bhutan occupies predominantly south-facing watersheds, separated by high ridges, within the eastern Himalayan Mountains. The mountainous country covers 38,394 km2 with elevations from 97 to 7570 m. It contains a wide array of environmental conditions and vegetation types, starting with tropical forests in the southeast where rainfall can exceed 5000 mm/year to alpine conditions and perpetual snowfields in the north. The majority of the country’s area occupies elevations between 1000 and 3000 m and is composed of forested hills and montane valleys where most of the human population is found. The species composition of its flora is influenced by at least four floristic regions; the Indian, Indo-Chinese, Sino-Japanese and Central Asian, and the boundary between two Floristic Kingdoms, the Holarctic and Paleotropic, hereafter called “temperate” and “tropical” regions, traverses the country from east to west (Miehe et al., 2015).
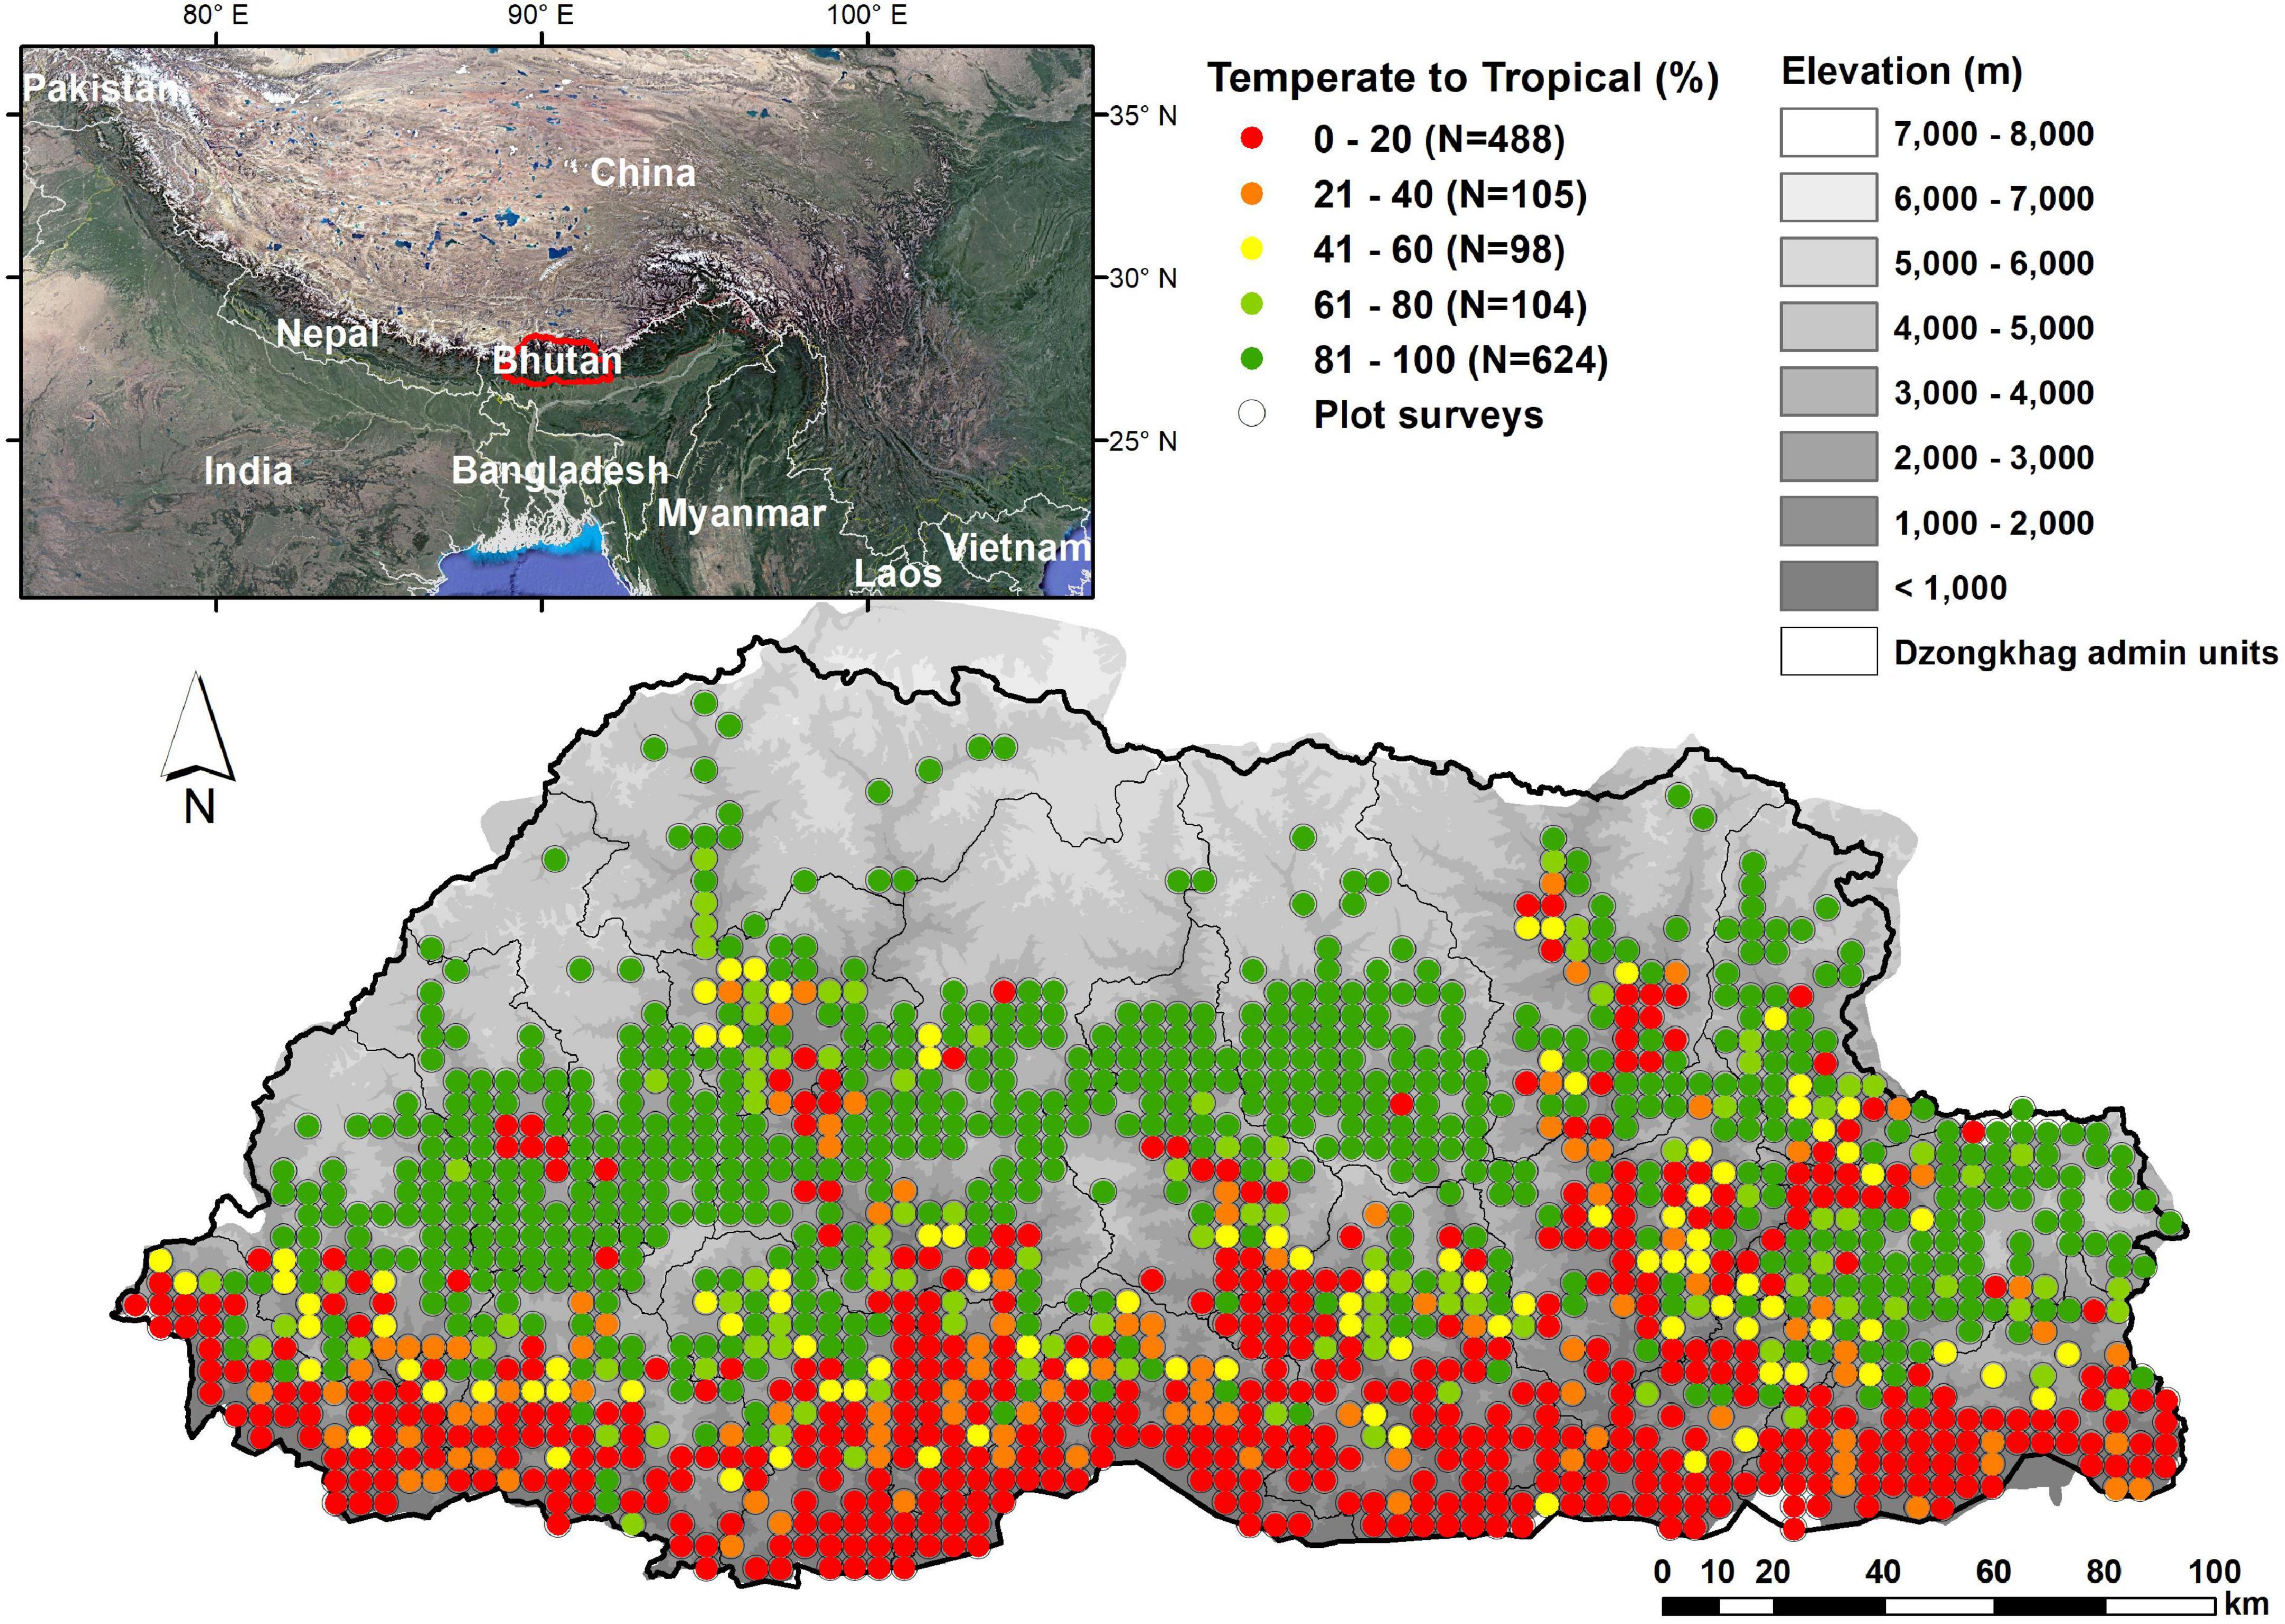
Figure 1. Study area, location of surveyed NFI plots and percentage of temperate to tropical trees at each plot.
We used Bhutan’s NFI records to quantify the elevational distribution of tree and shrub species. We measured the mean elevation of trees, shrubs, and all species for those originating from temperate or tropical regions. We also tested for differences when including or excluding species whose entire elevation range could not be determined from the records.
We then partitioned the elevation gradient into 400 m elevation bands starting at 100 m, and explored the effects of using different combinations of species on the elevation band of maximum species richness. We were particularly interested in the contribution of flora from temperate and tropical regions. We tested the mid-elevation maxima hypothesis by comparing the maximum species richness elevation for all woody species and for tree and shrub species with the maximum species richness for temperate and tropical region-originating species in the same categories. We also asked whether species turnover on elevation (Legendre, 2014) is highest at elevations immediately to either side of species richness maxima.
Materials and methods
National Forest Inventory Bhutan
Bhutan’s NFI used spatially stratified sampling, targeting 2424 plots across the country from 2012 to 2015. The survey’s primary aim was to collect comprehensive forest baseline data, for assessment of forest carbon stocks.
Field crews of 5 foresters visited pre-selected locations arrayed on a 4 × 4 km grid. Of 2424 targeted plot locations, 1685 were surveyed (Figure 1), while 739 were not accessible due to extremely difficult terrain or unfavorable weather conditions. Bhutan’s forest plot methodology (Forest Resources Management Division [FRMD], 2016) is similar to the US Forest Service’s methods (USFS, 2017), and to methods used in other national forest inventories for carbon accounting (Tomppo et al., 2010). The inventory design uses a probabilistic sampling framework and is aimed at the collection of all possible data for multiple uses. While data collection predominantly focused on trees, the same sample size, sampling unit, plot design, and area were used to record shrub species, and sub-plots were used to assess carbon pools and herbaceous attributes. Most trees and shrubs could be easily identified by the field crews. Initially, a few samples and photographs of the plants were taken. However, none of the samples were useful as preservation was extremely difficult due to weather and the crews were walking several days from one plot to another. Therefore, no voucher plant samples were collected. The crews recorded the local names for unknown species and were later identified by information from volumes I and II of Know the Plants of Bhutan (Thinley, 2004, 2010) and by local experts. The Flora of Bhutan was used as the taxonomic authority to standardize the names of tree and shrub species (Grierson and Long, 1984, 1987, 1991, 1999, 2001; Noltie, 1994, 2000; Pearce and Cribb, 2002).
Bhutan’s plots are composed of three circular plots of 12.62 m radius (500 m2) placed in an “L” shaped transect with a center, North and East plot. All trees >10 cm diameter at breast height (DBH) were measured. Shrubs species were also identified within the plots. We combined the three circular plots from each survey location to create a single record. We used plots containing tree and shrub species to chart their elevational occurrences.
Observations identified only to genus (e.g., Beilschmiedia sp.) were excluded, as were plots with no elevation recorded. We conducted an online review of species names to remove synonyms and confirm life form (tree or shrub or both). Websites used to confirm taxonomy, known habitats occupied, range, and elevation distributions were the: Kew center’s Plants of the World Online and The Plant List for taxonomic authority, the Digital Floras of China and India, Bhutan’s Biodiversity Portal, the Missouri Botanical Garden, Wikipedia, and the Useful Tropical Plants. We checked each species name for synonyms and current status, and retained only names in use, using the Kew Center’s Plants of the World Online as the taxonomic authority (Supplementary Appendix 1). We labeled species as to plant kingdom affiliation (temperate or tropical) and checked for survey records beyond described geographic or elevational extents, as ways to identify potential errors in the NFI database.
We also identified the elevation of maximum abundance (stems/plot) along the elevation distribution of each species. Plots with maximum abundance at the bottom or top of a species’ elevation distribution may indicate potential errors in the database. However, we did not remove these data, in the interest of accurately portraying the NFI records. Such observation locations could become targets for further inspection to validate the abundance at that elevation, potentially with herbarium samples taken.
Elevation differences for tropical and temperate originating species
We used the plot data to describe the elevation range of tree and shrub species. If the lowest elevation at which a species was recorded is higher than 400 m, we considered its entire elevation range was represented in the sampling. The upper boundary was considered to have been recorded because the alpine zone above the tree and shrub lines is present across the study area. Using the elevations recorded in the plot data, we calculated the mean elevation of shrubs, trees and all species, including or excluding association with floristic kingdom. We used Welch’s ANOVA (Analysis of Variance) to check if the elevation means of these groups were significantly different for trees, shrubs, and all species, after confirming that the variances between groups were not equal using Bartlett’s test.
Mid-elevation species richness maxima hypothesis
To measure species richness along the elevation gradient, we summed the species of trees, shrubs, and of all species, and of subsets of temperate- and tropical-originating tree and shrub species by 200 and 400 m elevation bands. Species richness patterns were fairly similar for these two models (Supplementary Figure 1 for species richness patterns by 200 m elevation bands), so we used 400 m bands in order to minimize the possibility of false negatives, where a species was present at some elevation but was simply not recorded in the selected plot locations.
Elevational species turnover
We asked whether turnover was highest in the elevation band adjacent to the maximum species richness. Species having both tree and shrub life forms were included in the summary statistics and turnover calculations according to how they were documented in each plot (tree or shrub). We used the beta diversity partitioning framework developed by Podani and Schmera (2011) and Carvalho et al. (2012), and modeled turnover (replacement) using the BAT (Cardoso et al., 2022) package in R (version 4.1.2) for 200 and 400 m elevation band. We included and excluded species that are found in less than four plot locations [105 trees (33%) and 192 shrubs (58%)] as a sensitivity analysis because these species could inflate the rates of turnover. Turnover rates were slightly higher for the all-species and the 200 m versions, compared to the 400 m analysis. We present the results for species found in more than three plots, using the 400 m band analysis to minimize potential false negatives associated with systematic field survey points and to minimize the potential of false absences because species which were found above and below some elevation range (e.g., 300–500 m) may simply not have been documented in the plots surveyed in the 300–500 m band, particularly for species found in only a few plots.
Results
Overall, 569 species of trees and shrubs were documented, including 80 that occur as both tree and shrub (Figure 2, Supplementary Figures 2, 3, and Supplementary Tables 1, 2). Elevation distributions of tree species are from 132 to 4320 m (Figure 2, Supplementary Figure 2, and Supplementary Table 3). Tree species’ minimum elevations ranged from 132 to 3888 m, while their mean elevations ranged from 200 to 4062 m. The maximum elevation for trees was 4320 m (Betula utilis) and 4235 m (Rhododendron wightii). R. wightii also had the highest minimum elevation detected at 3888 m, indicating an elevation range of just 347 m (Supplementary Figure 2). The lowest elevation tree species, recorded at 132 m are Callicarpa arborea, Dillenia pentagyna, Garuga pinnata, Oroxylum indicum, Terminalia bellirica, and Wrightia arborea. These species are all described as occupying wet or dry tropical environments.
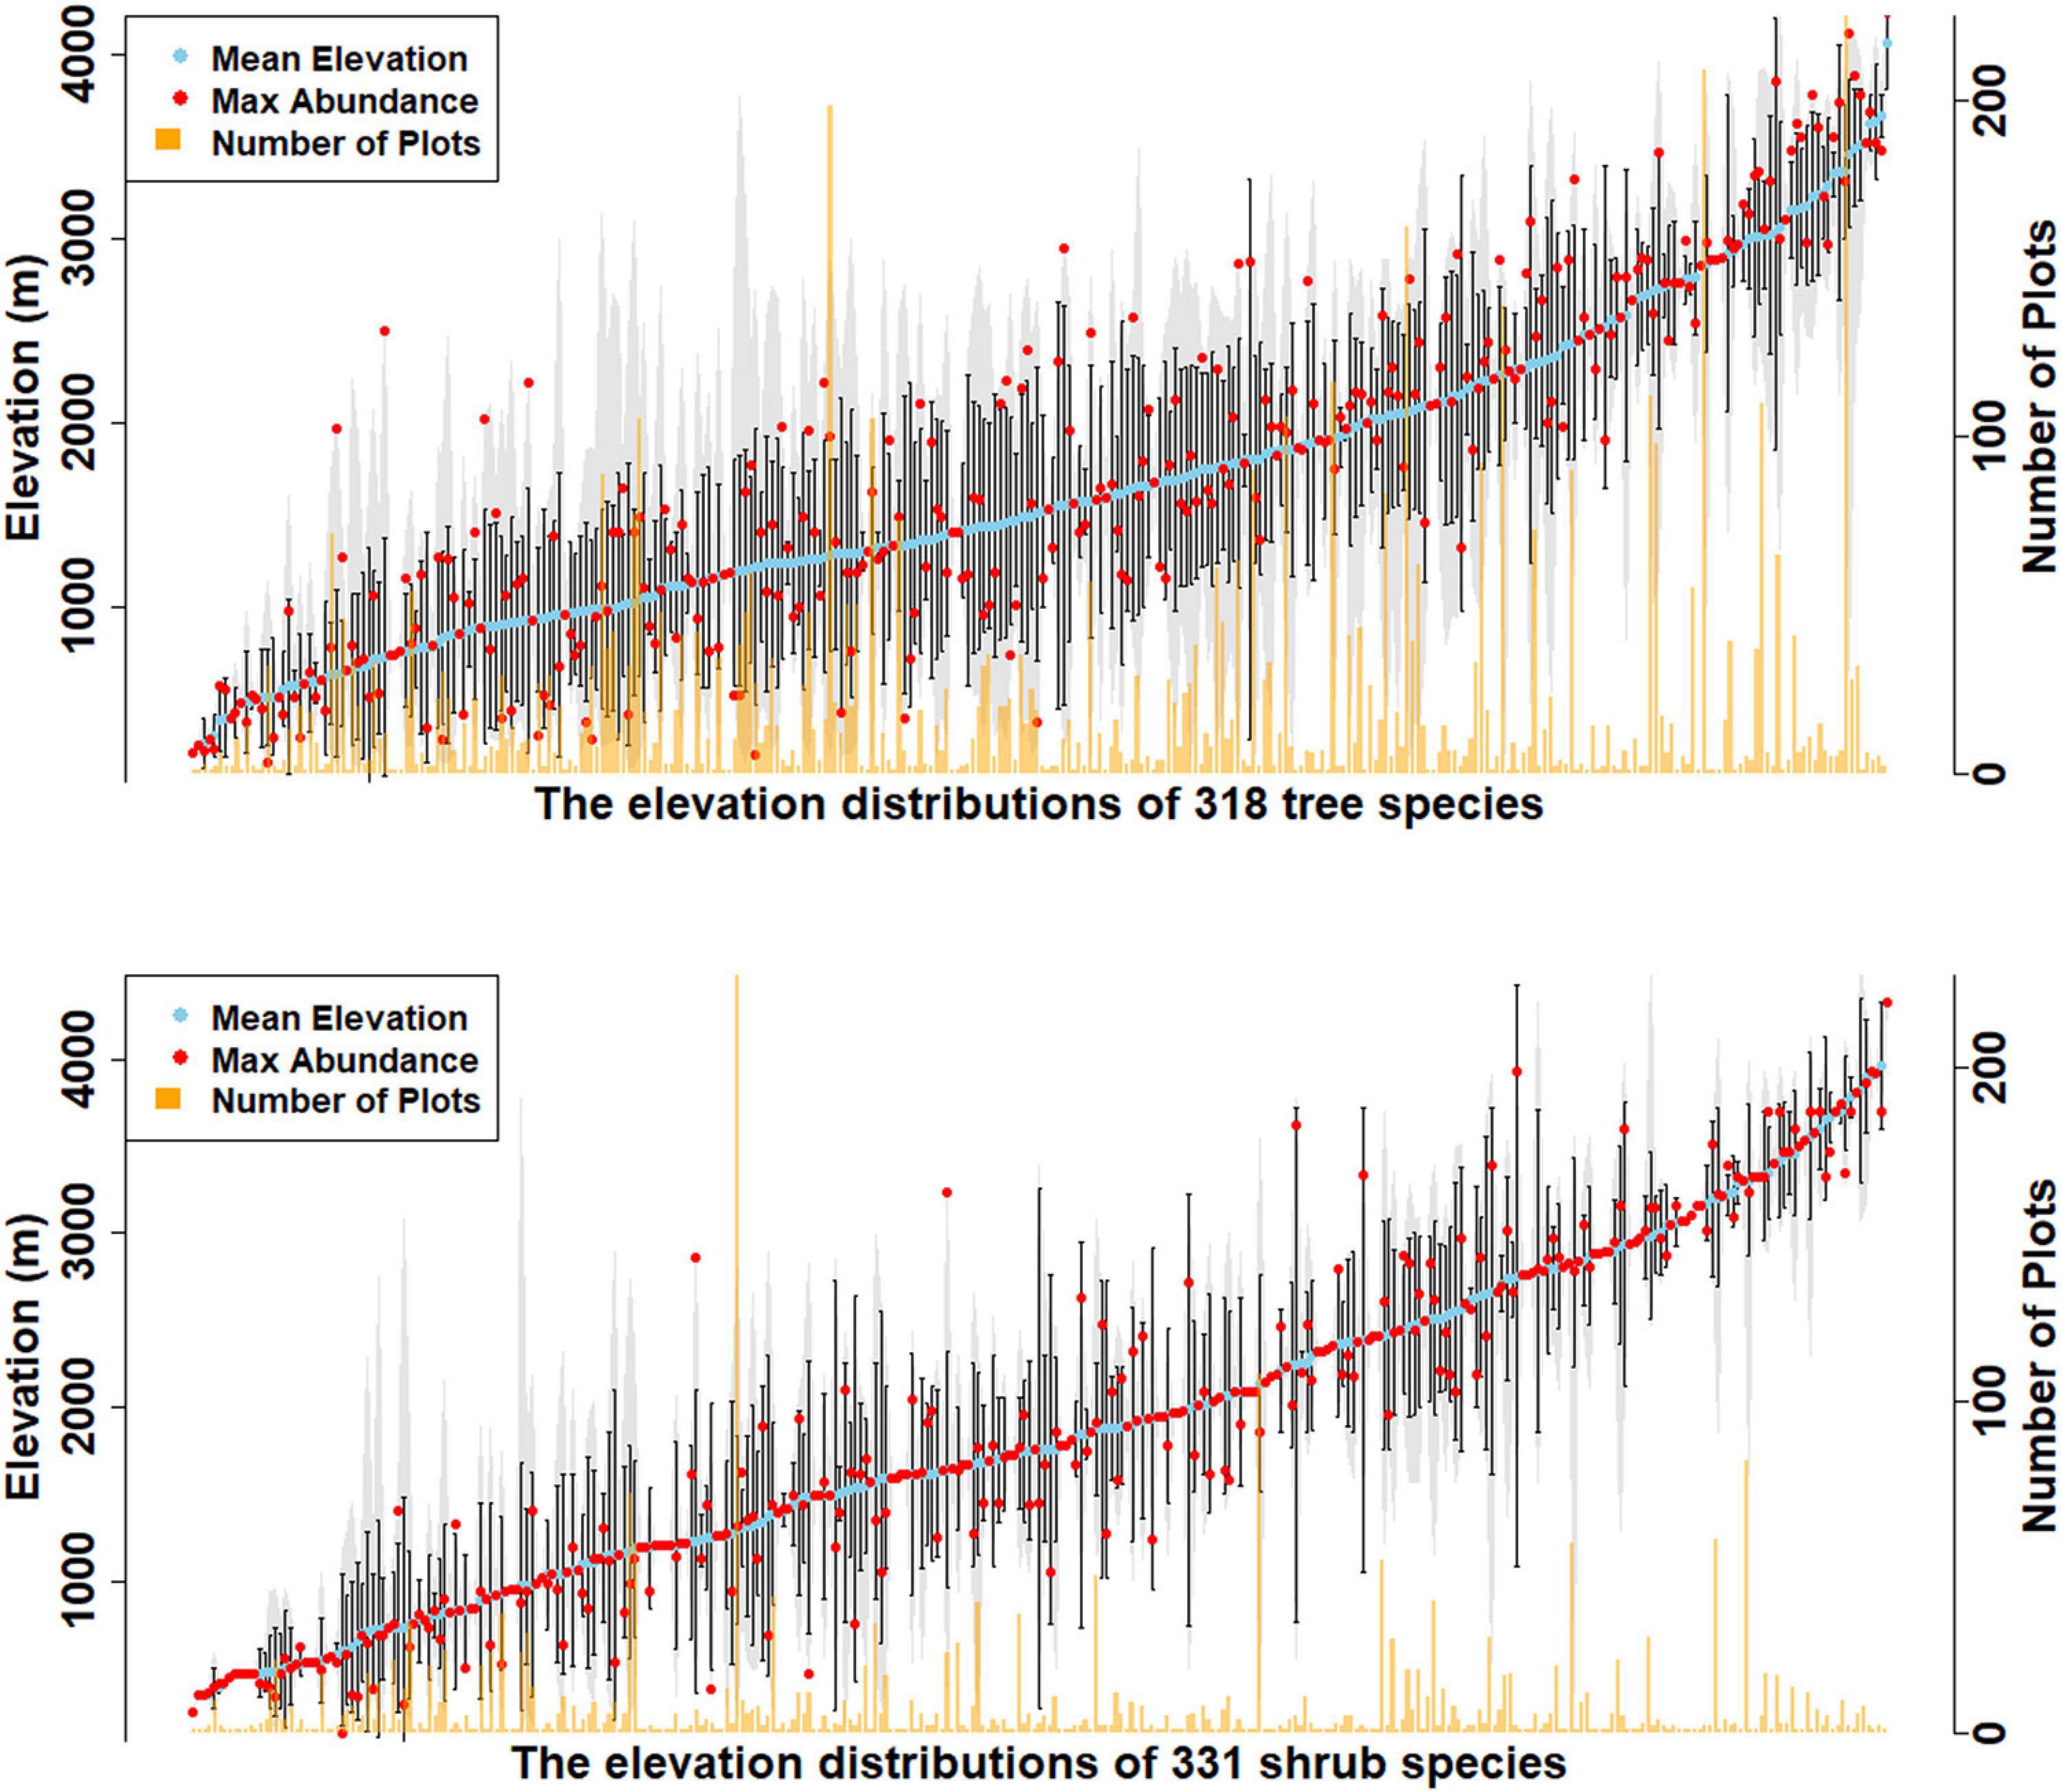
Figure 2. Elevational distribution of tree and shrub species recorded in the survey. The blue dots show the mean elevation for each species, red shows location of elevation of maximum abundance, and tan shows the number of plots in which each species was found. Vertical black lines are the standard deviation of elevation from the mean of each species, while the gray areas show the entire recorded elevation range of each species.
Shrub species’ elevations range from 132 to 4320 m (Figure 2, Supplementary Figure 3, and Supplementary Table 4). The lowest elevation shrub species were recorded at 132 m (Senna occidentalis) and 146 m (Murraya koenigii and Coffea benghalensis). C. benghalensis is not native to Bhutan and is likely from a cultivated area. Minimum elevations of shrub species ranged from 132 to 4320 m (Rhododendron nivale), while mean elevations ranged from 248 to 4320 m. The maximum elevation for shrubs is 4,560 m, where Rhododendron lepidotum is recorded (Supplementary Figure 3).
Mean elevation differences
Of the 100 temperate tree species, the elevation ranges of 84 were fully within elevations surveyed, as well as 92.1% of the temperate shrubs (117 out of 127 species). For tropical species, 44.2% of the trees’ (68 out of 154 species) and 68% of the shrubs’ (87 out of 128 species) ranges were fully sampled by our metric.
In nearly all cases, the mean elevation for all woody species differs significantly from the mean elevations of tropical or temperate woody species (Figure 3 and Supplementary Table 5). For all trees the mean elevation is 2174 m (SD 1035 m), while the mean for temperate tree species is 548 m higher (p < 0.001), and for tropical tree species it is 890 m below (p < 0.001). Lower elevations are dominated by tropical trees, with proportions of temperate species increasing to 50% of forest composition around 1968 m (SD = 559 m) (Figure 1).
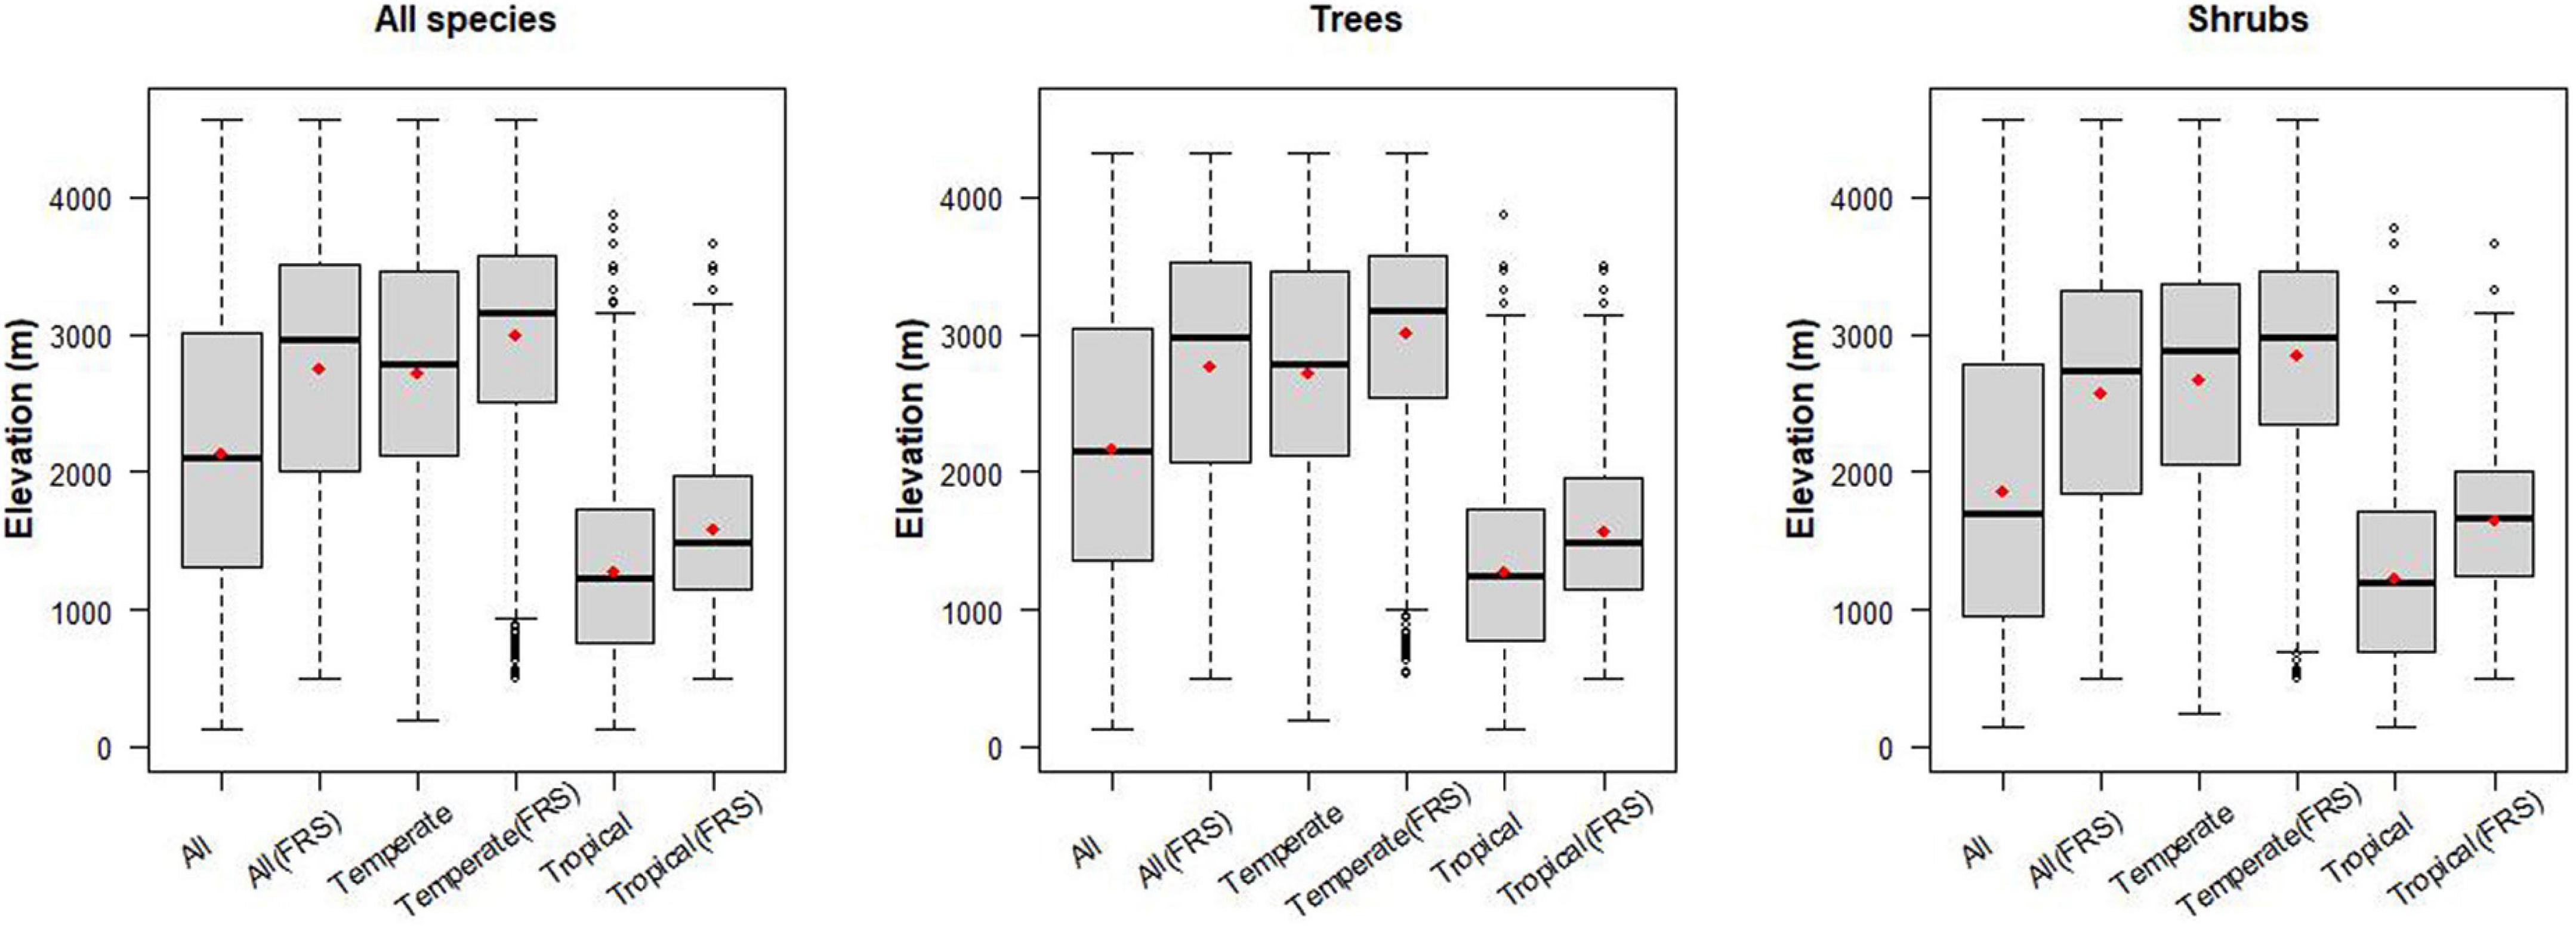
Figure 3. Elevation differences for tropical- and temperate-originating trees and shrubs along the elevation gradients of Bhutan. We also assessed the elevation distributions for species that are located higher than 500 m so their entire elevation range was represented in the sampling. FRS in the x-label represents “Full Range Sampled.” Red point in each bar is the mean elevation within group.
Elevation differences for temperate and tropical shrub species richness maxima are similar to the elevation differences of temperate and tropical tree species richness maxima. Temperate and tropical shrub species richness maxima differ from the overall species maximum for shrubs of 1854 m. Temperate shrub species richness maximum is 808 m higher (p < 0.001), while for tropical shrub species it is 620 m lower (p < 0.001) than their overall mean elevation. Note the similarity in the extent of elevation difference between species richness maxima for temperate and tropical trees (1284 m), and shrubs (1234 m).
The all-species-combined mean is closer to the tree pattern with mean elevation at 2140 m (SD 1043 m), and temperate species 578 m higher (p < 0.001), and tropical species 864 m lower (p < 0.001).
Tree species richness patterns
The survey records 48,932 trees at 1,468 plot locations, of which 48,925 are identified to genus, and 28,564 are identified to species, comprising 344 species names. After checks for synonyms and trees listed in online resources only as shrubs, there remained 318 tree species represented by 28,436 records. Of these, 63 species were recorded in 30 or more locations and 50 are documented at a single location. The three most frequently recorded species are Abies densa, Acer campbellii, and Schima wallichii (Supplementary Table 3). The tree species belong to 71 families, with 187 genera, with the most species-rich genera being Rhododendron (18 species), Ficus (11 species), and Magnolia (10 species) (Supplementary Table 3).
For tropical tree species, maximum species richness of 116 is in band 3 (900–1300 m), but for temperate tree species it is in band 7 (2500–2900 m), with 61 species (Figure 4A and Table 1).
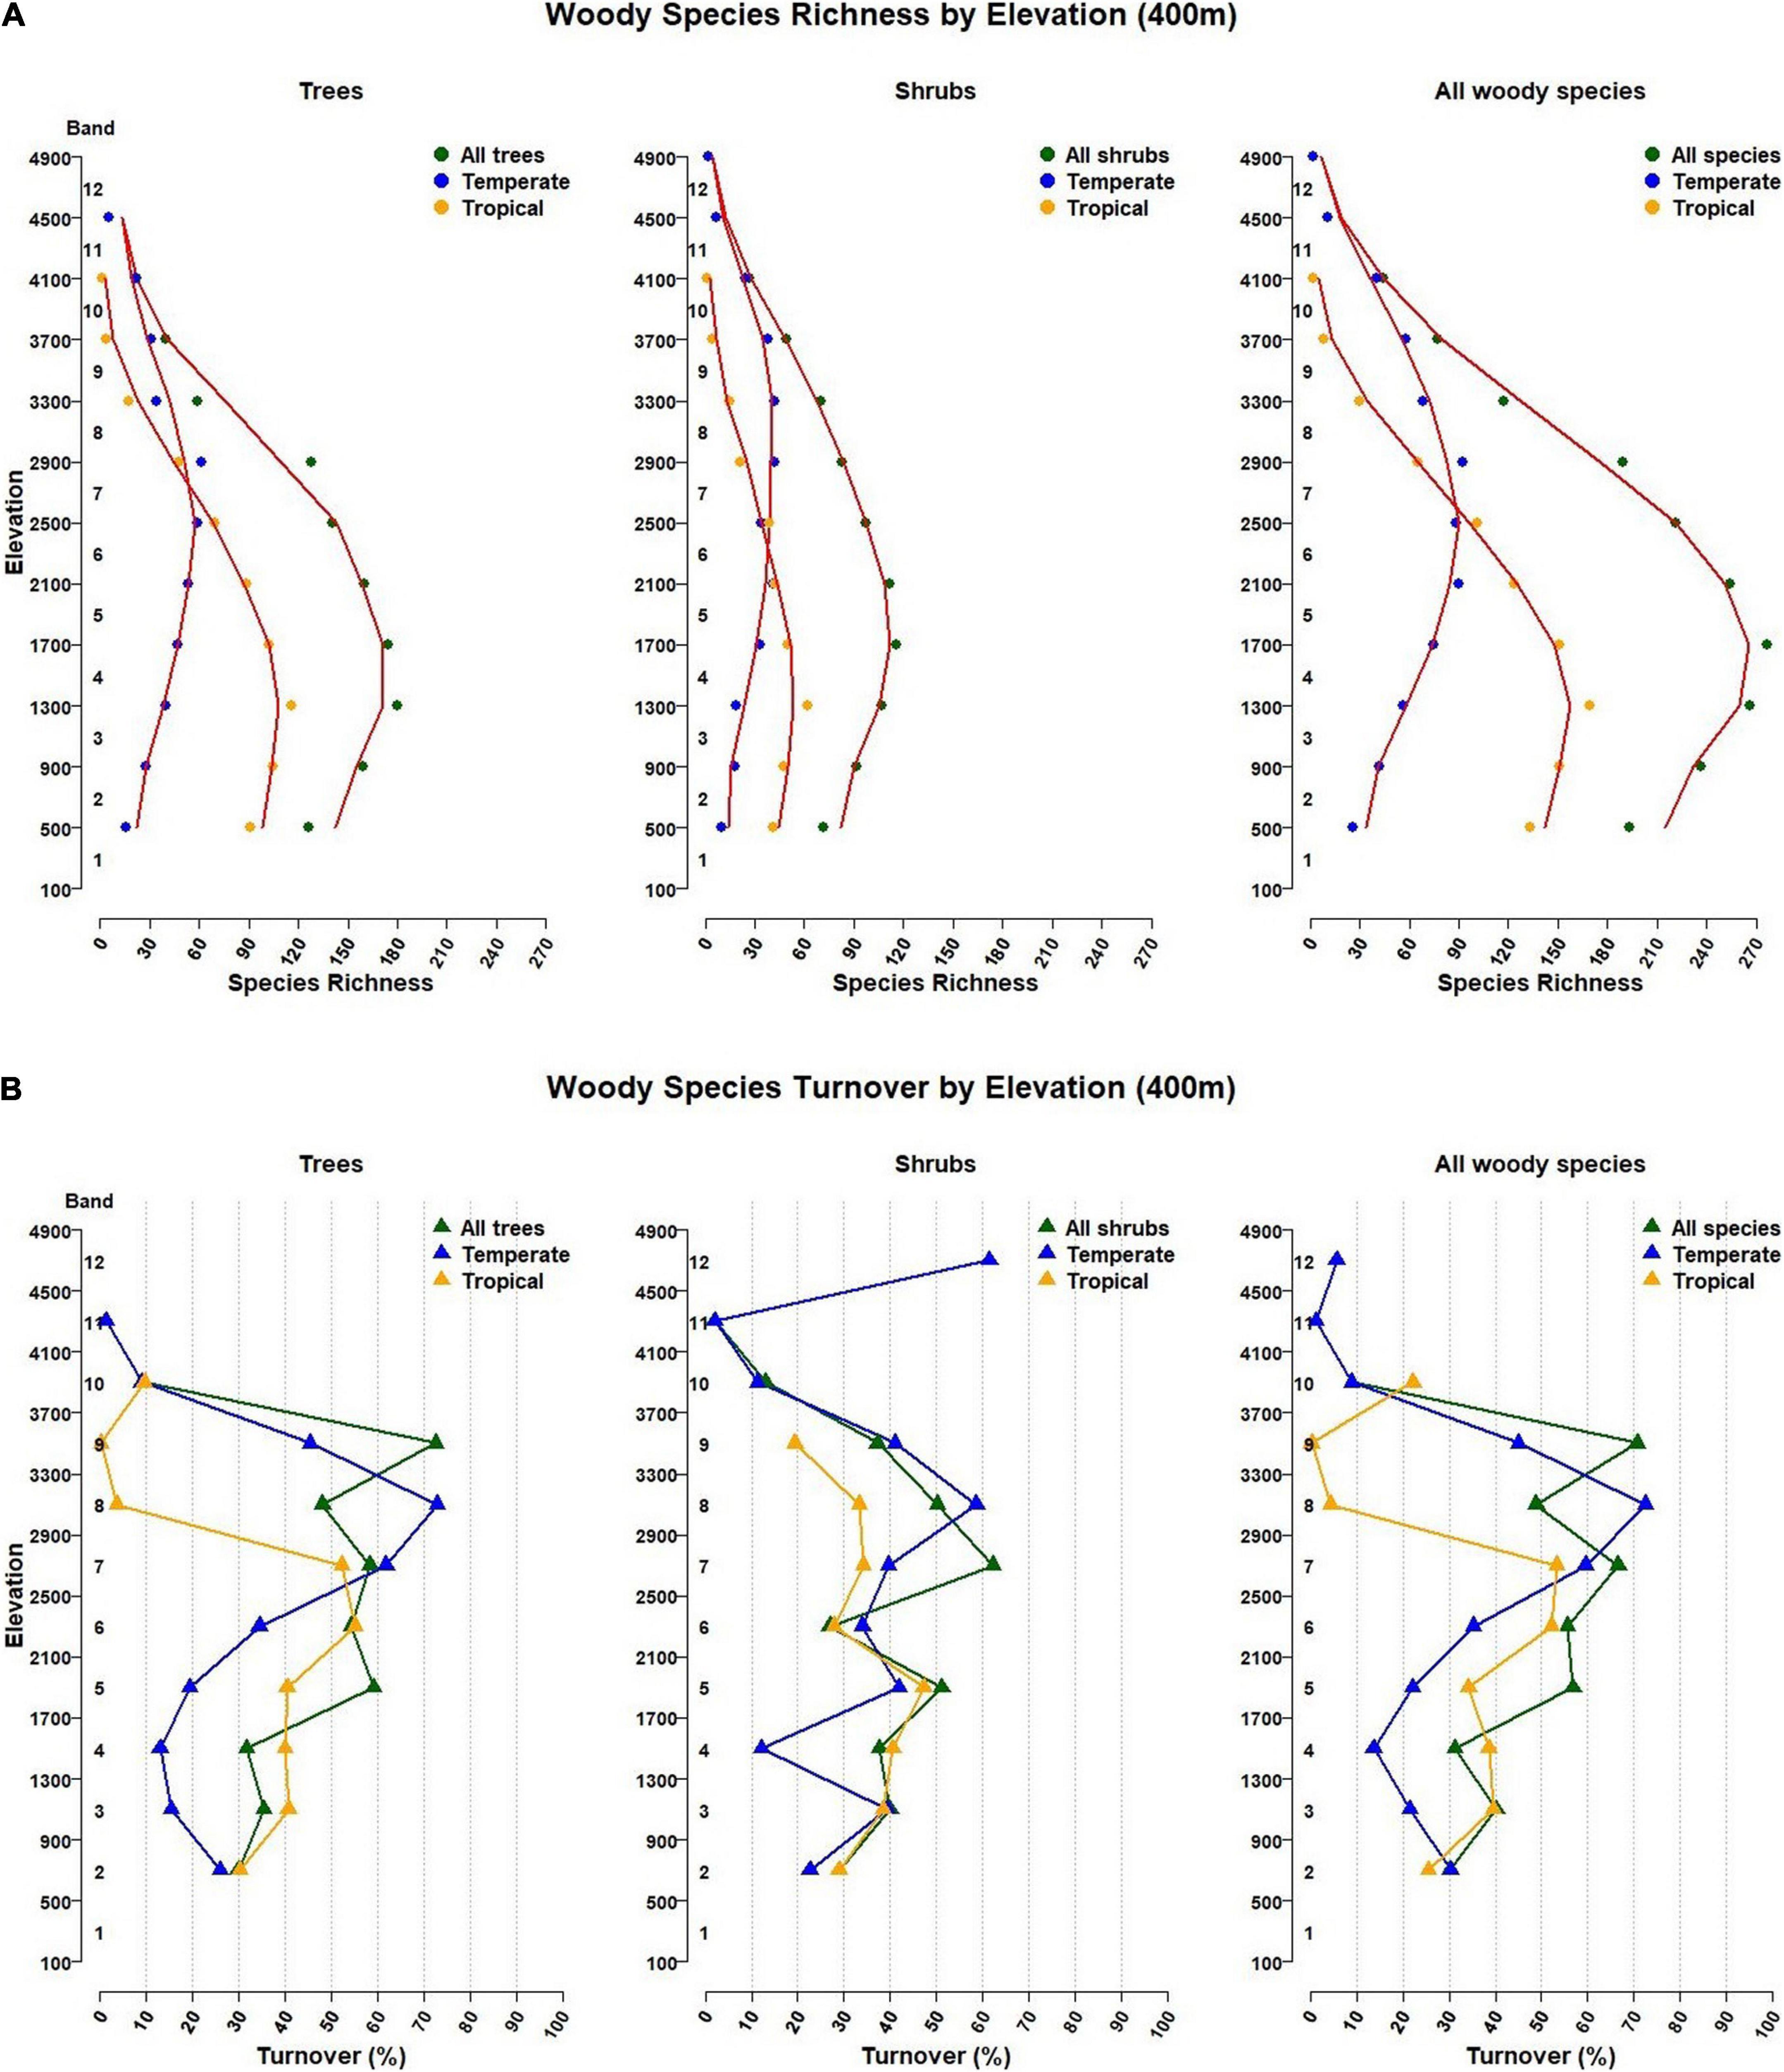
Figure 4. (A) Woody species richness patterns and (B) Woody species turnover by elevation band in Bhutan. Elevations are presented in twelve 400 m elevation bands starting at 100 m. In (A), the red lines are a moving average from three elevation bands. In (B), turnover percentages shown are from the band below to the band the triangle is in. Corresponding elevation band values are in Table 2.
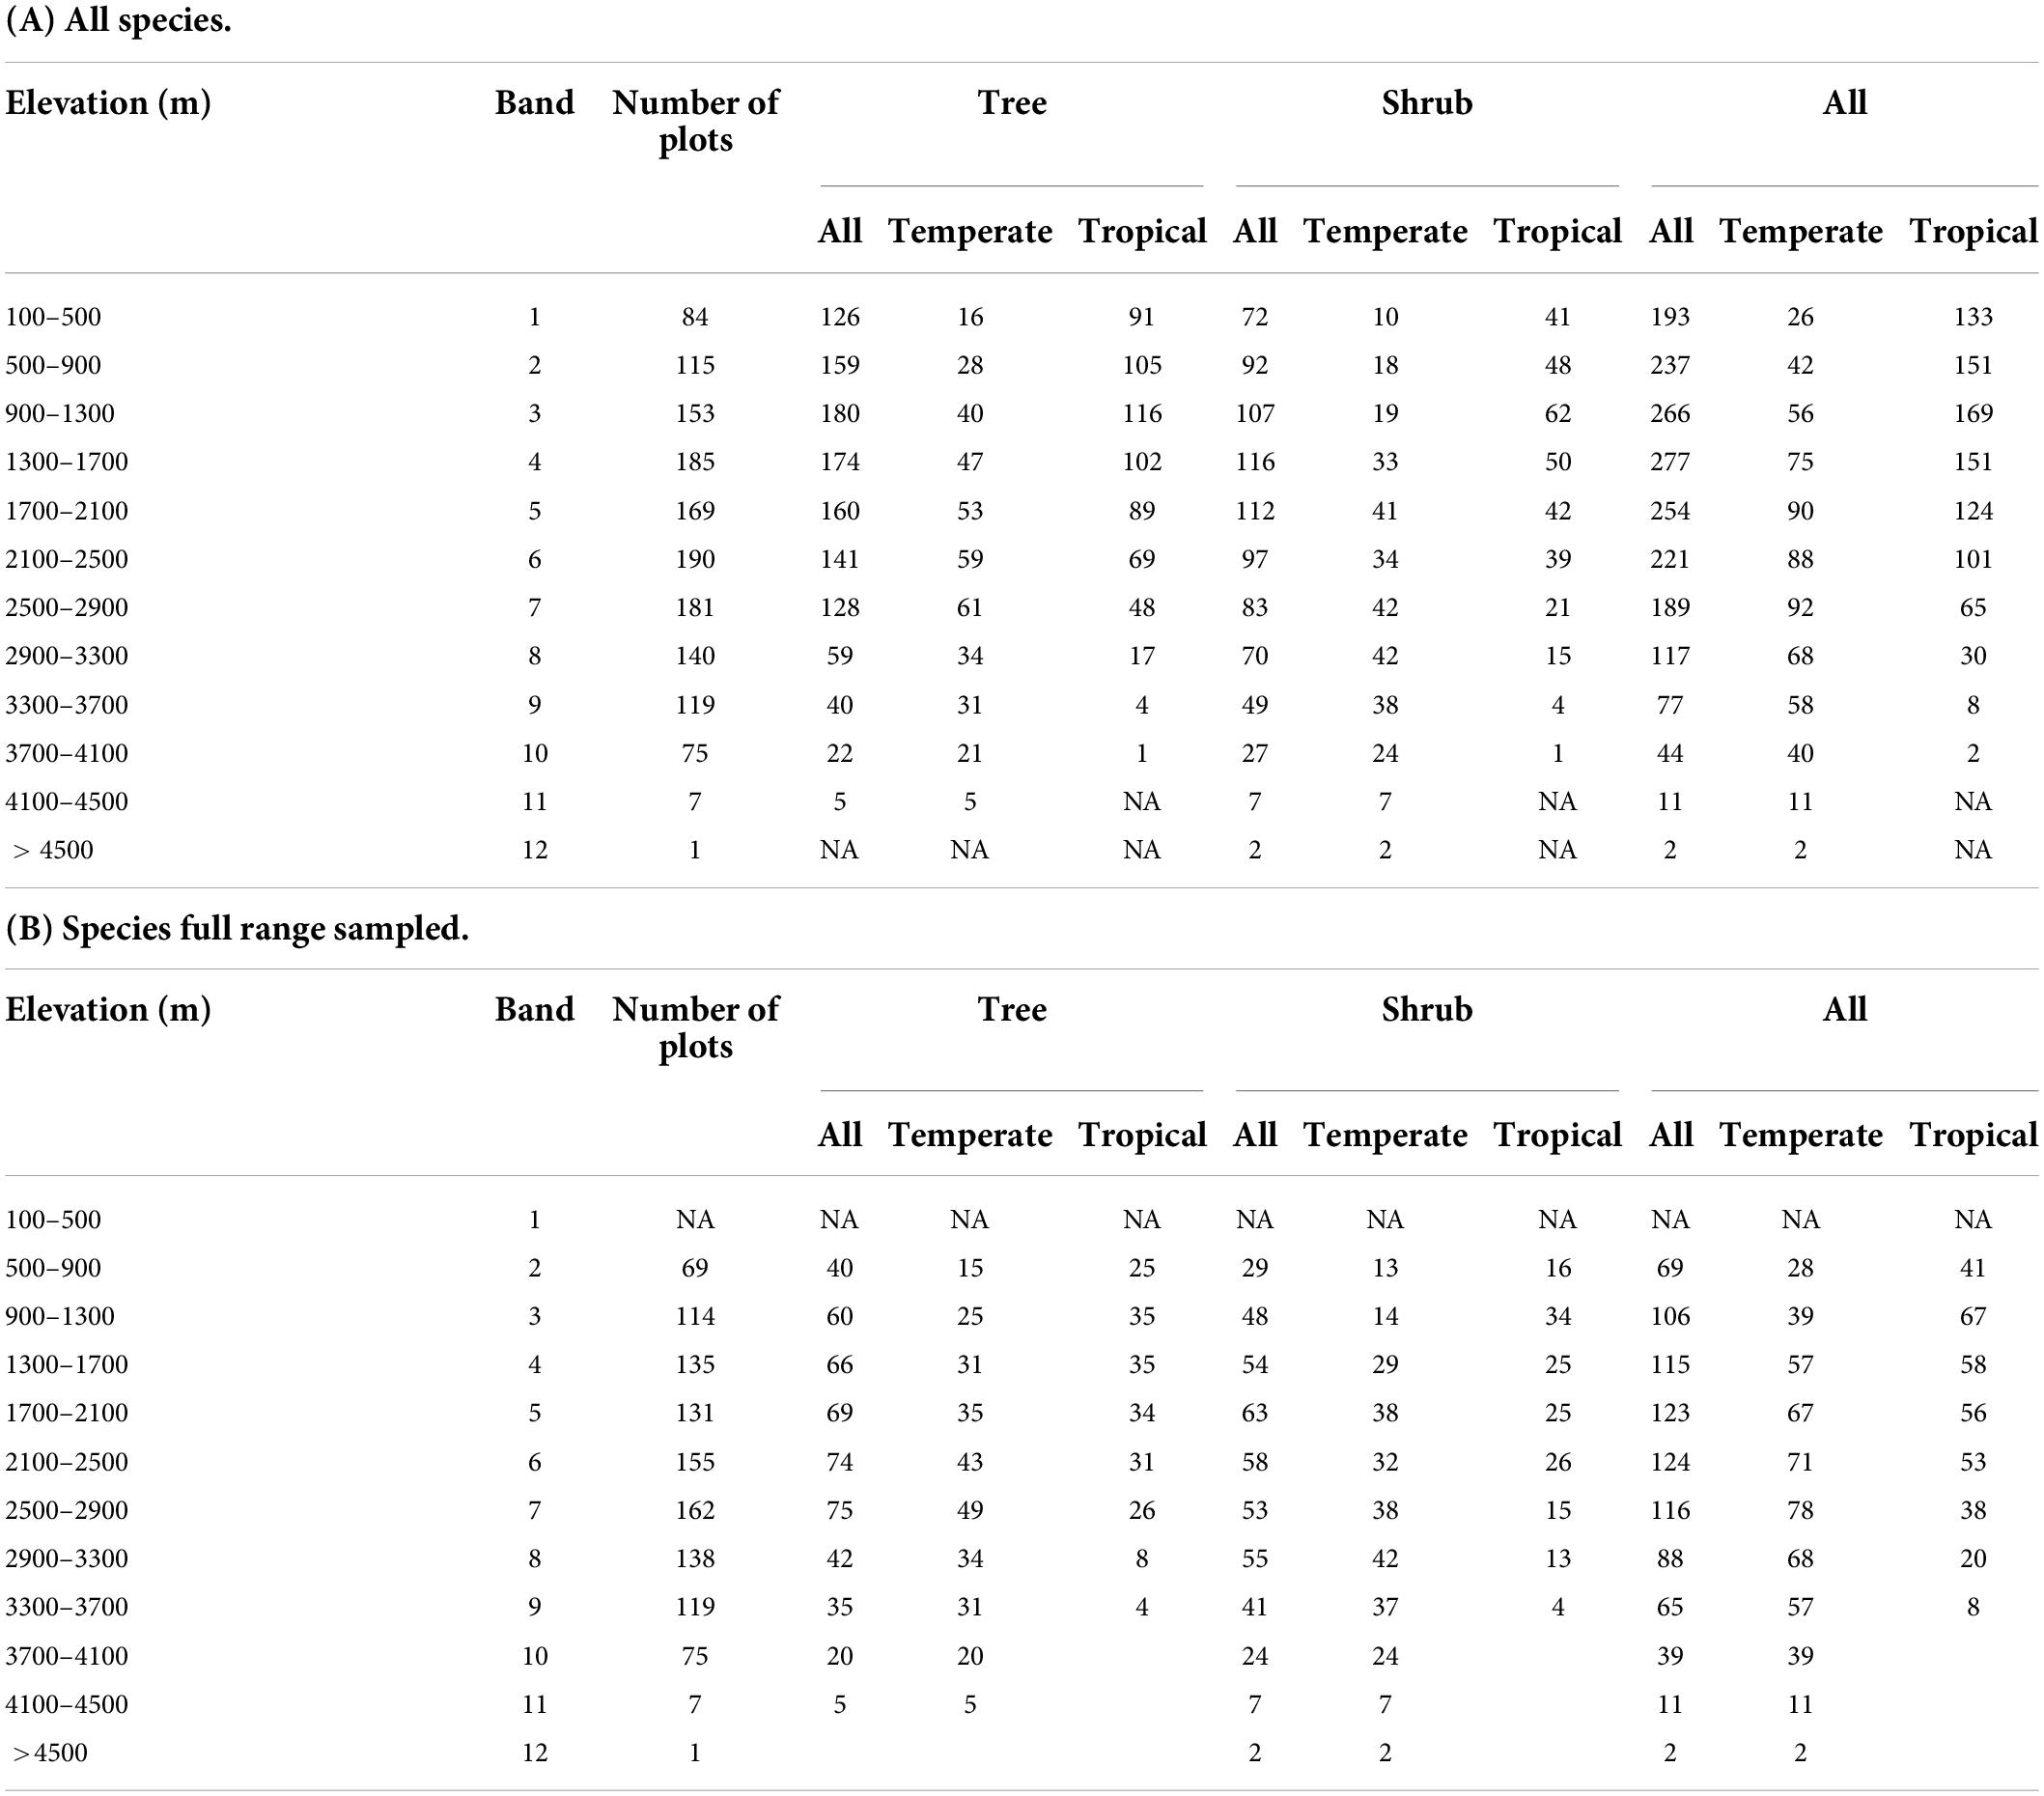
Table 1. Species richness of tropical- and temperate-origins for trees, shrubs and combined species, stratified by 400 m elevation bands: (A) for all species analyzed and (B) for only species whose full range was sampled.
Shrub species richness patterns
The survey recorded 8,874 shrubs at 1,474 locations, of which 8,786 are identified to genus, and 4,137 are identified to species, comprising 353 species names. After checks for synonyms and species listed in online resources as only trees, there remained 331 shrub species represented by 3,762 records. The shrub species belong to 106 families and 214 genera, with the most species-rich genera being Rhododendron (18 species), Rubus (10 species), and Berberis (6 species). There are 17 species with more than 30 location records and 128 species represented by a single location (Supplementary Table 4).
Maximum temperate species richness (42) was found in bands 8 and 9 (2500–3300 m), and in band 3 (900–1300 m) for tropical shrubs (62) (Figure 4A and Table 1).
Combined tree and shrub richness patterns
For all woody species by 400 m bands, maximum species richness is 277, in band 4 (1300–1700 m), which is also the maximum richness elevation for all shrubs (116 species). Maximum tree species richness is in band 3 (900–1300 m; 180 species). For tropical species, maximum richness of 169 species is also in band 3, while for all temperate woody species, maximum richness of 92 species is in band 8 (2500–2900 m) (Figure 4A and Table 1).
When examined by 200 m intervals, maximum species richness still appears near to 1700 m (202 species the 1400–1600 m band), and species richness within 10% of that number occurs from 800 to 2000 m, as well as at 400 to 600 m (Supplementary Figure 1 and Supplementary Table 6).
Species turnover
Turnover for all tree species averages 32.3% across the lowest three elevation bands (100-500 m to 1300–1700 m). Band 4, with the second largest number of tree species (Table 1A, “All” in “Tree” column) has a high turnover level (59.1%) into band 5 (1700–2100 m). This high turnover continues for three bands with an average of 57.2% for three bands, going from band 4 into band 5, band 5 into band 6, and band 6 into band 7 (Figure 4B and Table 2A). But, the highest rate of species replacement for all tree species was from band 8 to band 9 (2900–300 to 3300–3700 m), with mean turnover of 72.5% to the band below. Turnover results by 200 m elevation band and for all species are provided in Supplementary Tables 7, 8.
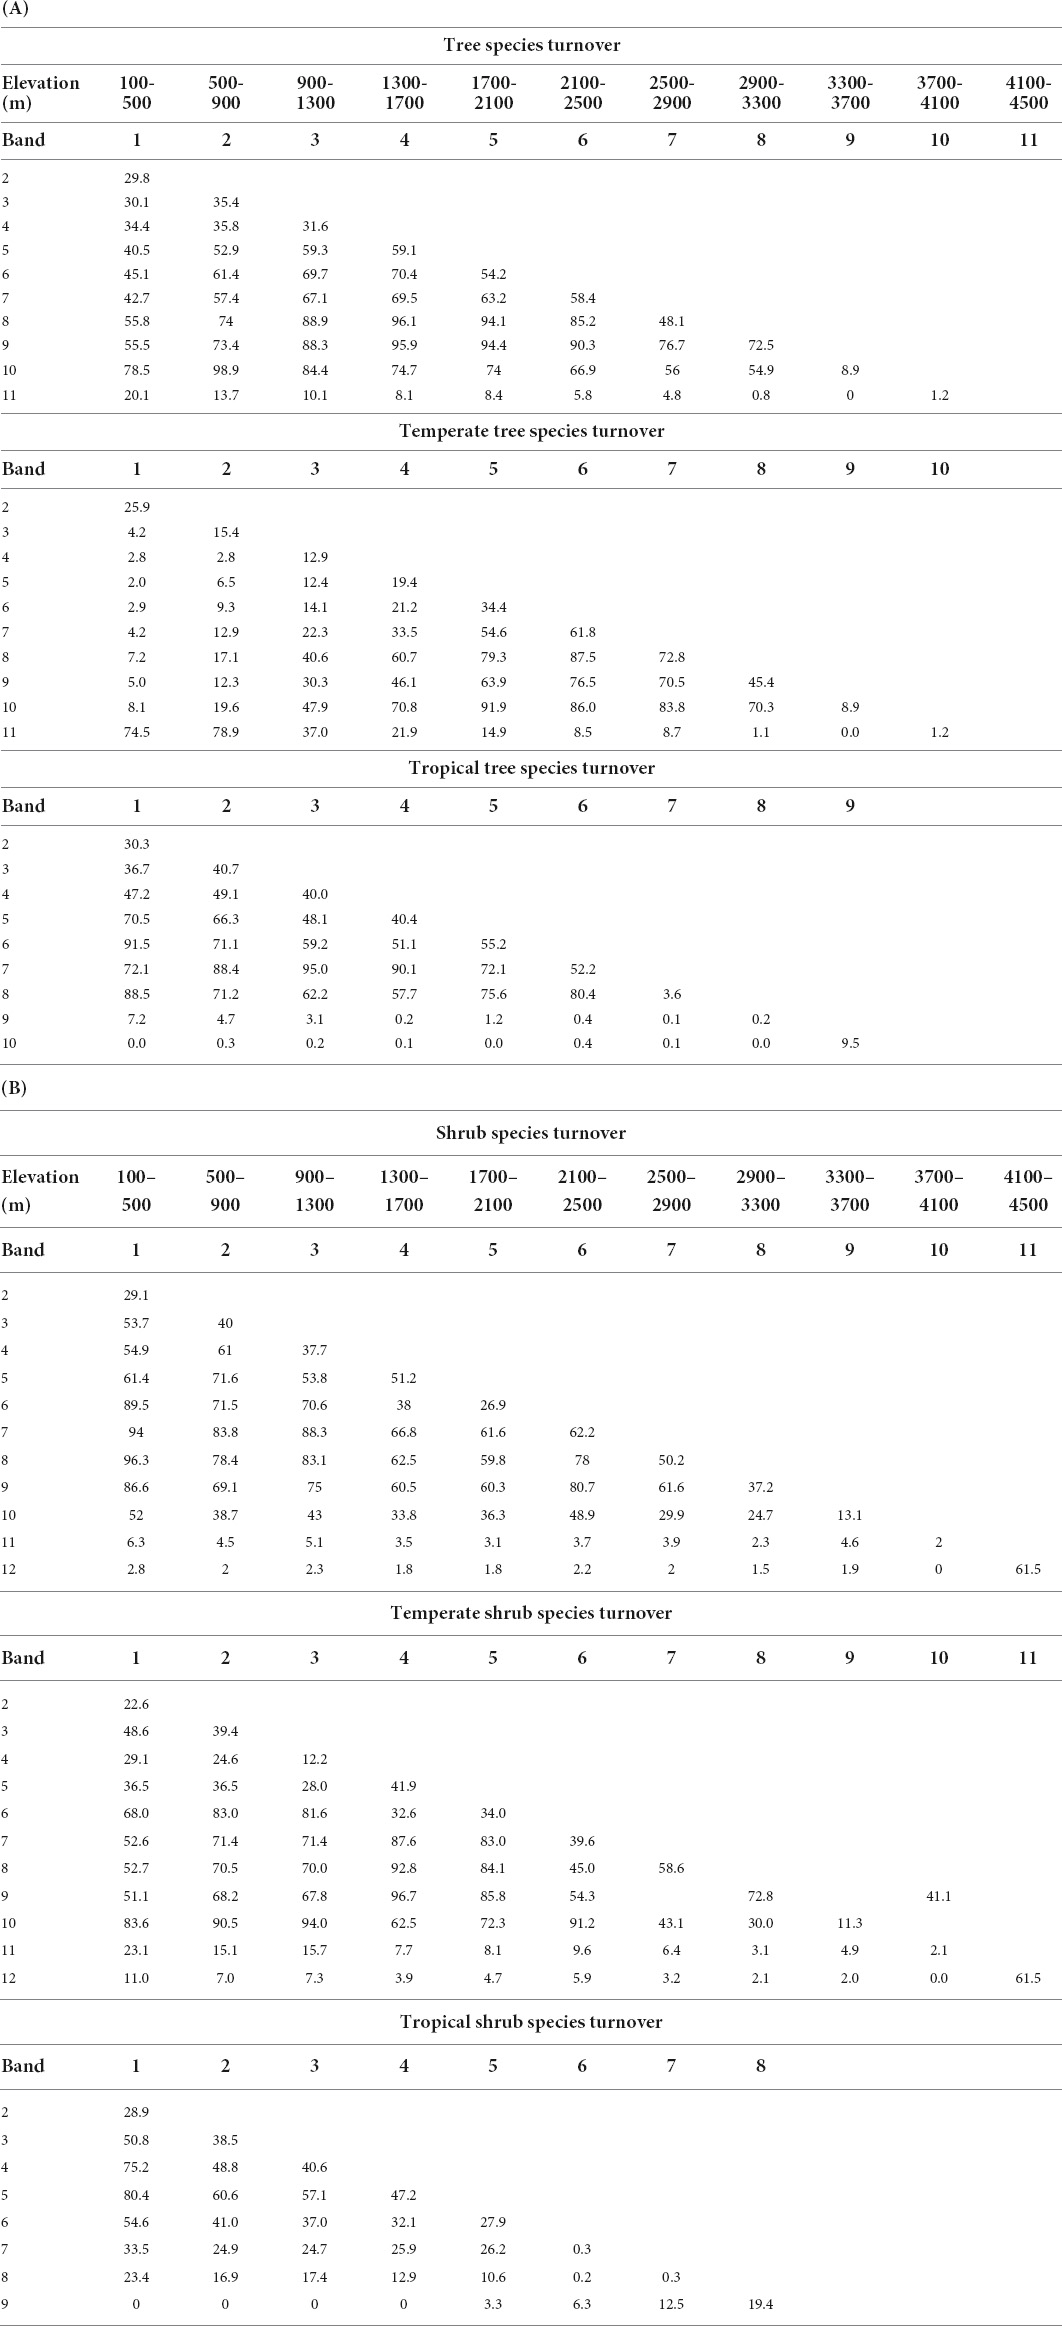
Table 2. Species turnover by percent using 400 m breaks for (A) tree and (B) shrub species that occurred in more than three forest inventory plots.
Turnover for tropical tree species was highest (55.2%) transitioning from band 5 (1700–2100 m) to 6 (2100–500 m) and 52.2% from band 6 to 7 (2500–2900 m). This does not align with the highest species richness for tropical trees, in band 3 (900–1300 m), but it does match a continuous decline of tropical tree species richness (Table 1A).
Turnover for temperate tree species was highest transitioning from band 7 (2500–2900 m), the band with highest tree species richness, to band 8 (2900–3300 m) (72.8%) and to band 6 (2100–2500 m; 61.8%) (Figure 4B and Table 2A).
Species turnover for all shrubs was highest (62.2%) going from band 6 (2100–2500 m) to band 7 (2500–2900 m) and second highest at the highest elevation. However, the maximum richness for shrub species is in band 4 (1300–1700 m; n = 116; Table 1A). Turnover is also high going up from band 4 into band 5, at 51.2%.
When turnover was separated for temperate and tropical shrub species, the highest rate was at the highest band for temperate shrubs at 61.5%. Maximum temperate shrub richness is 42, in bands 7 and 8. Turnover between these two was second highest, at 58.6%. A gradual decrease in turnover is observed above band 8, while below band 7, turnover remains relatively high until passing from band 4 into band 3, where temperate shrub species decline from 33 to 19 (Table 1A).
Band 3, has the highest species richness band for tropical shrubs (900–1300 m). There is high turnover of 40.6% going into band 4, but the highest turnover is from band 4 to band 5, with turnover of 47.2%.
Discussion
Species elevation ranges
The mean elevation of all woody species significantly differed from the mean elevation of temperate or tropical species. These differences were further accentuated when restricting the species to those whose ranges we estimated were fully sampled. This was informative for a subset of temperate species, where the identification of fully sampled species ranges permitted the removal of species tolerant of lower elevations whose ranges may not have been fully sampled, and the identification of higher mean elevations for the ranges of fully sampled species. This subset of temperate species may have greater vulnerability to climate change, because of their more restricted elevation ranges (Trew and Maclean, 2021).
The same rule for tropical species, that if there was no presence record below 400 m it was not present, also increased the mean elevation for tropical trees and shrubs. We are less confident of these results because of the relatively few forest plots surveyed at the lowest elevations (84 plots below 500 m, but only 4 plots below 200 m, Supplementary Table 6). However, it is probable that many of the 155 tropical species whose elevations were not fully sampled have ranges that extend beyond the borders of Bhutan and into the Indian subcontinent or southeast Asia. This raises the question of whether correlations with climate variables for these species on the elevation gradient could be misleading, because their ranges extend beyond the elevations that many biogeographic studies in this region of the Himalaya have measured. Many studies have sought climate and environmental drivers for patterns of species richness (e.g., Carpenter, 2005; Acharya et al., 2011; Manish et al., 2017; Rana et al., 2019; Hamid et al., 2021). Our study raises the question of how much influence do species with ranges that extend beyond the elevation gradient have upon the measures of species richness that are used as response variables in studies that correlate climate and environmental conditions with species richness patterns?
Species richness and potential drivers
The elevation gradient on which Bhutan’s woody plants are arrayed is one of the highest in the world. We found our measures of species richness maxima mostly agree with the studies described in Miehe et al. (2015) that suggest a zone of maximum species richness between 1500 and 2500 m. While for all woody vascular plant species we found increased species richness starting lower, from 500 to 900 m (237 species), our overall species maxima peak agrees with Miehe et al., with 277 species in our 1300–1700 m band. Our study had the advantage of using a large number of systematically arrayed plots of fixed size, even though we only analyzed trees and shrubs.
Bhutan occupies a biogeographical nexus in the Himalayan Mountains, between the wetter eastern Himalaya and Hengduan Mountains of southeast Asia (comprising the Sino-Japanese, Central Asian, and Indo-Chinese floristic regions) and the central and drier western Himalayas of Nepal and Kashmir (comprising or influenced by the Indian, Central Asian, Iran-Turanian, and Sudano-Zambezian floristic regions; Manish et al., 2022). Both nearby eastern and western Himalayan sections have high levels of biodiversity. The Hengduan Mountains have high species richness, originating from in situ evolution associated with Miocene uplift (Xing and Ree, 2017). To the west, the companion to the Flora of Nepal counts over 6200 plant species (Miehe et al., 2015), and describes an overall decreasing level of biodiversity proceeding along the mountains further to the west, as well as pointing to the latitudinal interface between the temperate (Holarctic) and tropical (Paleotropical) regions.
Our study suggests similar levels of species richness to areas immediately east and west. To the east, Rana et al. (2019) found 269 tree species (91 from the literature), while our field-based measures compare, with 318. However, their estimates of elevation-band species richness by origin are considerably higher than what we found, particularly for tropical species below 1000 m, where they estimate between 350 and 400 tropical tree species, while our counts were no higher than 116 (900–1300 m). This may be due to the increasing prevalence of wet tropical conditions to the east, as opposed to increasingly dry tropical conditions found westerly along the Himalayan front (Miehe et al., 2015). Our measures also agree with Manish et al. (2017) who calculate 285 tree and 313 shrub species from their sampling in the Sikkim Himalaya, to the east of Bhutan.
Another study in Sikkim (Sharma et al., 2019), examined the effect of scale on the elevation zone of maximum species richness. They examined 100, 200, and 300 m bands and found greater variation in richness patterns with 100 m bands. They suggest that the ecotones between different forest types contribute to mid-elevation maxima. We also found a scalar effect; that using a 200 m band for tracking species richness (Supplementary Table 6) led to estimates of a wider range of high species richness elevations starting around 600 m (197 species) and declining again around 2400 m (151 species). However, in order to reduce potential false negatives associated with rare-species sampling, we thought the 400 m band-approach provided more robust results.
To the west, studies in Nepal have consistently documented humped species richness distributions, including Carpenter (2005), who found lack of evidence for a null-model mid domain effect, but that environmental drivers are potentially the most relevant; and Vetaas and Grytnes (2002), who found maximum plant species richness between 1500 and 2500 m, while for species endemic to Nepal or the Himalayas it was 3800–4200 m. Oommen and Shanker (2005) examined plant species in the western Himalaya at several spatial scales. At the broadest spatial scale, they found a unimodal pattern of species richness. They found a mid-domain richness maxima for temperate species, which we also document. We suggest that this is because our study captured the full elevation range extent of the majority of temperate woody species (79%), quite different from tropical species (61%). This may be why studies that try to correlate environmental drivers to species richness maxima find inconclusive results. Oommen and Shanker (2005) also suggest high species richness at ecotones, which we consider a promising avenue for further study, using for example, the 11 natural forest and shrub vegetation types recognized by Bhutan’s Department of Forestry and Park Services (Forest Resources Management Division [FRMD], 2016).
However, the high levels of turnover that we found are likely representative of several factors: that the conjunction and overlap of species from the two floristic kingdoms (temperate and tropical) and multiple floristic regions may be interacting with the multiple bands of different vegetation types; and that there may be two gradients: one of species that are relatively more- or less-tolerant of freezing; and the other similarly, of tropical conditions (Oommen and Shanker, 2005; Kessler et al., 2011; Miehe et al., 2015). Although turnover was highest adjacent to the most species-rich band for temperate trees, a more common pattern appears to be gradually decreasing levels of turnover along the gradients that are likely associated with decreasing suitability for the various groups. Tropical trees, for example, show greater levels of turnover at increasing elevation starting 500 m beyond band 4, which has the highest number of species. There is a pattern of decreasing turnover levels with increasing elevation for tropical shrubs; turnover is high (40.6%) going from band 3, the most species-rich band, to band 4. But the highest turnover rate is from band 4 to band 5, with turnover of 47.2%, and then rapidly decreasing as the upper limits of tropical shrubs are reached. For temperate shrub species, maximum temperate shrub richness is 42 in bands 7 and 8. Turnover between these two was second highest, at 58.6%. A gradual decrease in turnover is observed above band 8, to the outlier at the highest level, while below band 7, turnover remains relatively high until passing from band 4 into band 3, where temperate shrub species decline from 33 to 19 (Table 1A). This gradual decrease may be associated with transition among various forest habitats (Forest Resources Management Division [FRMD], 2016).
We found that including species with only one-three observation records increased overall turnover rates by an average of 7.5% for trees and 3.9% for shrubs across the elevation bands (Supplementary Table 7). Measuring turnover using narrower-than-400 m bands also inflated turnover rates for most elevations (Supplementary Table 8). While other authors have used 100 m as an acceptable elevation span (e.g., Kluge et al., 2017; Bhatta et al., 2018), we thought that the potential to have missed species presences at some elevations (false absences) was sufficient to justify larger elevation bands. However, turnover was high nevertheless, both in bands adjacent the highest species richness when considering floristic origin, and for tropical species and temperate shrubs at their upper limits, where overall species numbers drop off precipitously.
National Forest Inventory contributions to biogeography of species richness
Bhutan’s NFI shows how forest inventory surveys can help resolve regional biogeographic patterns by filling in location data for many woody plant species, in this case for a section of the Himalayan arc. The occurrence data can be used to vet models, provide range extensions, or identify elevations at which additional surveys can increase biogeographic knowledge. For example, Bhutan’s NFI records extend the documented elevation range of Erythrina arborescens as described in the eFlora of China (Supplementary Appendix 1). A systematic compilation of species elevation ranges from various floras would permit a data-driven assessment of range extensions embedded in the NFI, however, this was beyond the scope of our study.
Bhutan’s native flora is estimated to be at least 3927 (Kluge et al., 2017). However, the descriptions of these species represent the expertise of knowledgeable botanists, and the authors note that many of the botanical districts they analyze are documented by only a species list (Kluge et al., 2017). The NFI data can provide presence points within these districts. The NFI data can also be combined with data from floristic surveys that often form the basis for modeling species ranges or classifying dominant vegetation types. Bhutan’s NFI data could also potentially be used for an assessment of the degree of overlap between species from different floristic regions, perhaps along the Himalayan arc; or by elevation to examine plants from tropical and temperate regions, as in this study.
Another use of the species locality records described here could be in assessing the strength of ecotonal boundaries in the region (Ashton, 2017). In particular, species found in the subtropical zone were only partitioned as far as plant kingdoms in this study. For example, of the 16 temperate tree species that had records in our lowest band, seven could be considered subtropical and associated with the tropical-subtropical zone (Ashton and Zhu, 2020), while the remainder have wider geographic distributions. The records from one of these 16 tree species, Magnolia pterocarpa, also provides a range extension (see range map1). For tropical species, we think it is likely that the elevational gradient approach to demarcating their ranges, and therefore their climate tolerances, is likely insufficient, because their ranges in many cases extend to the south into the Indian subcontinent and/or the wet tropics of southeast Asia.
For some species, the NFI records provide a baseline of their elevational distribution that does not have to be modeled, or estimated from floras. For example, Chukrasia tabularis, with 30 records, has a mean elevation of 827 m, is most abundant at 278 m and was found from 146 to 1775 m. Such data can be used to monitor elevational shifts associated with climate change (Steinbauer et al., 2018; Wang et al., 2019), and for developing correlations with climatic and environmental predictor data, which could lead to a better elevational range model. That in turn can be used to portray future range dynamics, and to make predictions about what forest types and species are likely to persist or to be transformed as climate change continues. NFI data can support understanding such changes, which are important both for Bhutan, and potentially also for the Indian subcontinent and Southeast Asia, because forest and landcover changes in the Himalayan headwaters of the major rivers could cause changes in river and flooding regimes downstream (Simran et al., 2020).
The Bhutan Forestry Department (Forest Resources Management Division [FRMD], 2016) describes a number of forest types that are arrayed on elevation, and many vegetation types are well described in Miehe et al. (2015). The NFI data provide a chance to classify the combinations of species into quantified versions of these classifications.
Generally, habitats in Bhutan proceed from low elevation wet or dry tropical zones to wet and dry subtropical, to warm and cool broadleaf forests, to mixed broadleaf-conifer and subalpine conifer forests, and high elevation dwarf broadleaf species, as elevation increases from near sea level to over 4000 m. The different online botanical sources we reviewed (Supplementary Appendix 1) use a wide variety of terms to describe the habitats to which species are associated within this region. Standardizing these descriptions, such as those used for the Indian subcontinent and those of southeast Asia, and consideration of how best to address the habitats of temperate species of the eastern Himalaya, Heungduan Mountains, and China with those of the Tibetan Plateau and the western Himalyan Mountains would be helpful in creating a more unified biogeographic perspective of habitat types.
Since Bhutan’s NFI is predominantly based on digital records, and has only a small number of people responsible for its maintenance, the use of potential errors flagged by documenting the elevation of greatest abundance, when that occurs at the upper or lower end of a species’ range, could inform further field checking of the distribution of those species (Supplementary Figures 2, 3). We also found a considerable number of synonyms and species classed as trees that were shrubs and vice versa. We used the Kew Center’s Plants of the World Online as the taxonomic authority. However, tools that could allow for easier taxonomic revision would be helpful.
Finally, we found the NFI data to be a reliable source for assessing modeled results of other studies about the patterns of elevational diversity of trees and shrubs, through provision of a large number of species locations. This approach could be applied to other countries whose NFI protocols are similar, and could also find application in studies of latitudinal gradients for larger, but less mountainous areas.
Data availability statement
The data analyzed in this study is subject to the following licenses/restrictions: All species and their elevation ranges are included in the Supporting Information (Supplementary Tables 1, 2) to this publication. The original forest survey data (FRMD 2016) are the property of Bhutan’s Department of Forest and Park Services, and may be requested from Bhutan’s Forest Resources Management Division, Department of Forests and Park Services. Requests to access these datasets should be directed to bhutannfi@gmail.com.
Author contributions
JT, HC, and KB conceived the ideas and designed methodology. LD, KY, DW, and YP collected the data. HC analyzed the data. JT led the writing of the manuscript. All authors contributed critically to the drafts and gave final approval for publication.
Funding
The Article Processing Charges were funded by Seoul National University.
Acknowledgments
Seminar funding at UC Davis was provided by the USDA Forest Service, International Programs. Design and field work of Bhutan’s National Forest Inventory was supported by various agencies at different levels of NFI planning, field enumeration and data analysis. We thank the following groups. Royal Government of Bhutan who provided the major part of the fund for conduct of NFI, Netherlands Development Agency (SNV), for the technical assistance in inventory designing and piloting, Bhutan Trust Fund for Environment Conservation for supporting the preparatory phase and initiating the enumeration phase for six western Dzongkhags, European Union (EU) through Renewable Natural Resources (RNR) Sector Support Programme (EU-RNR SSP) for supporting the field enumeration, European Union (EU) through Global Climate Change Alliance (GCCA) for supporting the capacity building of NFI field crews, FAO through the United Nations Reducing Emission from Deforestation and Forest Degradation Targeted Support program (UN REDD-TS) for supporting the institutional capacity building, UNDP through Low Emission Capacity Building project (LECB) for supporting human resources capacity building in forest carbon assessment, Forest Carbon Partnership Facility (FCPF) for the World Bank facilitated REDD C Readiness Preparation Proposal that has supported field enumeration and continues to support the remaining, ICIMOD through GIZ REDD C Himalayas: Developing and Using Experience in Implementing REDD in the Himalayas Project. We acknowledge the services of USDA Forest Service Experts; Timothy Gordon Gregoire; Dr. Maung Myint; Dr. Julian Fox, Forestry Officer, Dr. Javier Garcia Perez, Mr. Stefano Ricci, and Mino Togna, for technical assistance at various levels of NFI. Most importantly, we would like to thank Mr. Santosh Katwal and Mr. Ugyen Penjor, who were part of NFI coordinating team while implementing the field work with the NFI field crew: Late Langna Tshering, Karma Tenzin, Basant Thapa, I. K. Bhujel, Tashi, Tshering Wangchuk, Tshering Phuntsho, Tashi Phuntsho, Tenzin Dorji, Tenzin Jamtsho, Nidup Dorji, Phurpa Tshering, Tularam Suberi, Guman Singh Biswa, Jamyang Tenzin, Kezang Phuntsho, Dorji Wangchuk, Sonam Wangpo, Changala, Sonam Wangdi, Rinchen Dorji, Singye, Phurba Dorji, Harkey Ghalley, Yeshey Nidup, Tandin Wangchuk, Chimi Tshewang, Sangay Penjor, Gyeltshen, Dawa Wangdi Sherpa, Sangay Lhajay, Dorji Dukpa, Tashi Tobgay, Gembo Tshering, Dawa Norbu, Rinchen Khandu, Lhakpa Tshering, Tashi Dorji, Tshering Wangchuk, Rinchen Dorji, Phurpa Dorji, Nidup Dorji, Chedup, Pema Namgyal, Tenzin Rabgay, Karma Nidup, Karman Subba, Karma Gyeltshen, Namgay Dorji, Late Wangchuk, D. B. Chettri, Sonam Drupchu, Phuntsho, Karma Dorji, and Lha Tshering.
Conflict of interest
The authors declare that the research was conducted in the absence of any commercial or financial relationships that could be construed as a potential conflict of interest.
Publisher’s note
All claims expressed in this article are solely those of the authors and do not necessarily represent those of their affiliated organizations, or those of the publisher, the editors and the reviewers. Any product that may be evaluated in this article, or claim that may be made by its manufacturer, is not guaranteed or endorsed by the publisher.
Supplementary material
The Supplementary Material for this article can be found online at: https://www.frontiersin.org/articles/10.3389/fevo.2022.942759/full#supplementary-material
Footnotes
References
Acharya, B. K., Chettri, B., and Vijayan, L. (2011). Distribution pattern of trees along an elevation gradient of Eastern Himalaya, India. Acta Oecol. 37, 329–336. doi: 10.1016/j.actao.2011.03.005
Ale, R., Zhang, L., Li, X., Raskoti, B. B., Pugnaire, F. I., and Luo, T. (2018). Water shortage drives interactions between cushion and beneficiary species along elevation gradients in dry Himalayas. J. Geophys. Res. Biogeosci. 123, 226–238. doi: 10.1002/2017JG004365
Ashton, P. S. (2017). Patterns of variation among forests of tropical Asian mountains, with some explanatory hypotheses. Plant Ecol. Divers. 10, 361–377. doi: 10.1080/17550874.2018.1429028
Ashton, P., and Zhu, H. (2020). The tropical-subtropical evergreen forest transition in East Asia: An exploration. Plant Divers. 42, 255–280. doi: 10.1016/j.pld.2020.04.001
Beck, J., McCain, C. M., Axmacher, J. C., Ashton, L. A., Bärtschi, F., Brehm, G., et al. (2017). Elevational species richness gradients in a hyperdiverse insect taxon: A global meta-study on geometrid moths. Glob. Ecol. Biogeogr. 26, 412–424. doi: 10.1111/geb.12548
Behera, M. D., and Kushwaha, S. P. S. (2007). An analysis of altitudinal behavior of tree species in Subansiri district, Eastern Himalaya. Biodivers. Conserv. 16, 1851–1865. doi: 10.1007/s10531-006-9083-0
Bhatta, K. P., Grytnes, J., and Vetaas, O. R. (2018). Scale sensitivity of the relationship between alpha and gamma diversity along an alpine elevation gradient in central Nepal. J. Biogeogr. 45, 804–814. doi: 10.1111/jbi.13188
Bhattarai, K. R., and Vetaas, O. R. (2006). Can Rapoport’s rule explain tree species richness along the Himalayan elevation gradient, Nepal? Divers. Distributions 12, 373–378. doi: 10.1111/j.1366-9516.2006.00244.x
Breshears, D. D., Huxman, T. E., Adams, H. D., Zhou, C. B., and Davison, J. E. (2008). Vegetation synchronously leans uphill. Proc. Natl. Acad. Sci. U.S.A. 105, 11591–11592. doi: 10.1073/pnas.0806579105
Cardelús, C. L., Colwell, R. K., and Watkins, J. E. (2006). Vascular epiphyte distribution patterns: Explaining the mid-elevation richness peak. J. Ecol. 94, 144–156. doi: 10.1111/j.1365-2745.2005.01052.x
Cardoso, P., Mammola, S., Rigal, F., and Carvalho, J. (2022). BAT: Biodiversity Assessment Tools. R Package Version 2.8.1. Available online at: https://CRAN.R-project.org/package=BAT (accessed July 14, 2022).
Carpenter, C. (2005). The environmental control of plant species density on a Himalayan elevation gradient. J. Biogeogr. 32, 999–1018. doi: 10.1111/j.1365-2699.2005.01249.x
Carvalho, J. C., Cardoso, P., and Gomes, P. (2012). Determining the relative roles of species replacement and species richness differences in generating beta-diversity patterns. Glob. Ecol. Biogeogr. 21, 760–771. doi: 10.1111/j.1466-8238.2011.00694.x
Feng, J., Hu, X., Wang, J., and Wang, Y. (2016). Support for the elevational Rapoport’s rule among seed plants in Nepal depends on biogeographical affinities and boundary effects. Ecol. Evol. 6, 7246–7252. doi: 10.1002/ece3.2473
Forest Resources Management Division [FRMD] (2016). National Forest Inventory Report: Stocktaking Nation’s Forest Resources, Vol. 1. Bhutan: Ministry of Agriculture and Forests.
Gray, A. N., Brandeis, T. J., Shaw, J. D., McWilliams, W. H., and Miles, P. D. (2012). “Forest inventory and analysis database of the United States of America (FIA),” in Vegetation Databases for the 21st Century. Biodiversity and Ecology, Vol. 4, eds J. Dengler, J. Oldeland, F. Jansen, M. Chytry, J. Ewald, M. Finckh, et al. (Washington, DC: United States Department of Agriculture), 225–231. doi: 10.7809/b-e.00079
Grierson, A. J. C., and Long, D. G. (1984). Flora of Bhutan: Including a Record of Plants from Sikkim. Volume 1, Part 2. Edinburgh: Royal Botanic Garden Edinburgh.
Grierson, A. J. C., and Long, D. G. (1987). Flora of Bhutan: Including a Record of Plants from Sikkim. Volume 1, Part 3. Edinburgh: Royal Botanic Garden Edinburgh.
Grierson, A. J. C., and Long, D. G. (1991). Flora of Bhutan Volume 2, Part 1. Edinburgh: Royal Botanic Garden Edinburgh.
Grierson, A. J. C., and Long, D. G. (1999). Flora of Bhutan: Including a Record of Plants from Sikkim and Darjeeling, Volume 2, Part 2. Edinburgh: Royal Botanic Garden Edinburgh.
Grierson, A. J. C., and Long, D. G. (2001). Flora of Bhutan: Including a Record of Plants from Sikkim and Darjeeling, Volume 2, Part 3. Edinburgh: Royal Botanic Garden Edinburgh.
Grytnes, J. A., and Vetaas, O. R. (2002). Species richness and altitude: A comparison between null models and interpolated plant species richness along the Himalayan altitudinal gradient, Nepal. Am. Nat. 159, 294–304. doi: 10.1086/338542
Hamid, M., Khuroo, A. A., Malik, A. H., Ahmad, R., and Singh, C. P. (2021). Elevation and aspect determine the differences in soil properties and plant species diversity on Himalayan mountain summits. Ecol. Res. 36, 340–352. doi: 10.1111/1440-1703.12202
Hughes, C. E. (2016). The tropical Andean plant diversity powerhouse. N. Phytol. 210, 1152–1154. doi: 10.1111/nph.13958
Kessler, M., Kluge, J., Hemp, A., and Ohlemüller, R. (2011). A global comparative analysis of elevational species richness patterns of ferns. Glob. Ecol. Biogeogr. 20, 868–880. doi: 10.1111/j.1466-8238.2011.00653.x
Khuroo, A. A., Weber, E., Malik, A. H., Reshi, Z. A., and Dar, G. H. (2011). Altitudinal distribution patterns of the native and alien woody flora in Kashmir Himalaya, India. Environ. Res. 111, 967–977. doi: 10.1016/j.envres.2011.05.006
Kluge, J., Worm, S., Lange, S., Long, D., Böhner, J., Yangzom, R., et al. (2017). Elevational seed plants richness patterns in Bhutan, Eastern Himalaya. J. Biogeogr. 44, 1711–1722. doi: 10.1111/jbi.12955
Legendre, P. (2014). Interpreting the replacement and richness difference components of beta diversity. Glob. Ecol. Biogeogr. 23, 1324–1334. doi: 10.1111/geb.12207
Manish, K., Pandit, M. K., and Sen, S. (2022). Inferring the factors for origin and diversifications of endemic Himalayan flora using phylogenetic models. Model. Earth Syst. Environ. 8, 2591–2598. doi: 10.1007/s40808-021-01251-z
Manish, K., Pandit, M. K., Telwala, Y., Nautiyal, D. C., Koh, L. P., and Tiwari, S. (2017). Elevational plant species richness patterns and their drivers across non-endemics, endemics and growth forms in the Eastern Himalaya. J. Plant Res. 130, 829–844. doi: 10.1007/s10265-017-0946-0
Miehe, G., Pendry, C. A., and Chaudary, R. (2015). Nepal: An Introduction to the Natural History, Ecology and Human Environment of the Himalayas. Edinburgh: Royal Botanic Garden Edinburgh.
Noltie, H. J. (1994). Flora of Bhutan: Including a Record of Plants from SIKKIM and Darjeeling, Volume 3, Part 1. Edinburgh: Royal Botanic Garden Edinburgh.
Noltie, H. J. (2000). Flora of Bhutan: Including a Record of Plants from Sikkim and Darjeeling, Volume 3, Part 2. The Grasses of Bhutan. Edinburgh: Royal Botanic Garden Edinburgh.
Oommen, M. A., and Shanker, K. (2005). Elevational species richness patterns emerge from multiple local mechanisms in Himalayan woody plants. Ecology 86, 3029–3047. doi: 10.1890/04-1837
Pearce, N. R., and Cribb, P. J. (2002). Flora of Bhutan, Including a Record of Plants from Sikkim and Darjeeling. Volume 3. Part 3. The orchids of Bhutan. Edinburgh: Royal Botanic Garden Edinburgh.
Podani, J., and Schmera, D. (2011). A new conceptual and methodological framework for exploring and explaining pattern in presence-absence data. Oikos 120, 1625–1638. doi: 10.1111/j.1600-0706.2011.19451.x
Pouteau, R., Bayle, É., Blanchard, É., Birnbaum, P., Cassan, J., Hequet, V., et al. (2015). Accounting for the indirect area effect in stacked species distribution models to map species richness in a montane biodiversity hotspot. Diversity Distrib. 21, 1329–1338. doi: 10.1111/ddi.12374
Rana, S. K., Gross, K., and Price, T. D. (2019). Drivers of elevational richness peaks, evaluated for trees in the east Himalaya. Ecology 100:e02548. doi: 10.1002/ecy.2548
Sharma, N., Behera, M. D., Das, A. P., and Panda, R. M. (2019). Plant richness pattern in an elevation gradient in the Eastern Himalaya. Biodivers. Conserv. 28, 2085–2104. doi: 10.1007/s10531-019-01699-7
Simran, S., Kumar, P., Furst, C., and Pandey, R. (2020). Mountain specific multi-hazard risk management framework (MSMRMF): Assessment and mitigation of multi-hazard and climate change risk in the Indian Himalayan Region. Ecol. Indic. 118:106700. doi: 10.1016/j.ecolind.2020.106700
Steinbauer, M. J., Grytnews, J., Jurasinki, G., Kulonen, A., Lenoir, J., Pauli, H., et al. (2018). Accelerated increase in plant species richness is linked to warming. Nature 556, 231–234. doi: 10.1038/s41586-018-0005-6
Tiwari, A. P., Sharma, C. M., and Rana, Y. S. (2020). Influence of altitude and slope-aspect on diversity, regeneration and structure of some moist temperate forests of Garhwal Himalaya. Trop. Ecol. 61, 278–289. doi: 10.1007/s42965-020-00088-4
Tomppo, E., Gschwantner, T., Lawrence, M., and McRoberts, R. E. (2010). National Forest Inventories, Pathways for Common Reporting. Dordrecht: Springer. doi: 10.1007/978-90-481-3233-1
Trew, B. T., and Maclean, I. M. D. (2021). Vulnerability of global biodiversity hotspots to climate change. Glob. Ecol. Biogeogr. 30, 768–783. doi: 10.1111/geb.13272
USFS (2017). Forest Inventory and Analysis National Core Field Guide. Volume I: Field Data Collection Procedures for Phase 2 Plots. Washington, DC: US Department of Agriculture.
Vetaas, O., and Grytnes, J. (2002). Distribution of vascular plant species richness and endemic richness along the Himalayan elevation gradient in Nepal. Glob. Ecol. Biogeogr. 11, 291–301. doi: 10.1046/j.1466-822X.2002.00297.x
Wang, Q., Zhang, Z., Du, R., Wang, S., Duan, J., Iler, A. M., et al. (2019). Richness of plant communities plays a larger role than climate in determining responses of species richness to climate change. J. Ecol. 107, 1944–1955. doi: 10.1111/1365-2745.13148
Keywords: species elevation distributions, species richness maxima, Himalayan Mountains, National Forest Inventory, Bhutan, gradient study, woody plants, temperate and tropical flora
Citation: Thorne JH, Choe H, Dorji L, Yangden K, Wangdi D, Phuntsho Y and Beardsley K (2022) Species richness and turnover patterns for tropical and temperate plants on the elevation gradient of the eastern Himalayan Mountains. Front. Ecol. Evol. 10:942759. doi: 10.3389/fevo.2022.942759
Received: 12 May 2022; Accepted: 28 July 2022;
Published: 12 August 2022.
Edited by:
Peter Convey, British Antarctic Survey (BAS), United KingdomReviewed by:
Paulo AV Borges, University of the Azores, PortugalRobbie Hart, Missouri Botanical Garden, United States
Copyright © 2022 Thorne, Choe, Dorji, Yangden, Wangdi, Phuntsho and Beardsley. This is an open-access article distributed under the terms of the Creative Commons Attribution License (CC BY). The use, distribution or reproduction in other forums is permitted, provided the original author(s) and the copyright owner(s) are credited and that the original publication in this journal is cited, in accordance with accepted academic practice. No use, distribution or reproduction is permitted which does not comply with these terms.
*Correspondence: Hyeyeong Choe, hy.choe@snu.ac.kr