Genomic insight into the population history and biological adaptations of high-altitude Tibetan highlanders in Nagqu
 Lifeng Ma1,2,3†
  Rui Wang4†
  Siwei Feng1,2†
  Xiaomin Yang5 Jing Li1,2 Zhiying Zhang1,2 Haoshuang Zhan1,2,3 Yao Wang3
  Ziyang Xia4
  Chuan-Chao Wang4,5,6,7*
  Longli Kang1,2,3*
- 1Key Laboratory for Molecular Genetic Mechanisms and Intervention Research on High Altitude Disease of Tibet Autonomous Region, School of Medicine, Xizang Minzu University, Xianyang, China
- 2Key Laboratory of High Altitude Environment and Genes Related to Diseases of Tibet Autonomous Region, School of Medicine, Xizang Minzu University, Xianyang, China
- 3Research Center for Tibetan Social Governance, Key Research Institute of Humanities and Social Sciences in Xizang Minzu University, State Ethnic Affairs Commission, Xizang Minzu University, Xianyang, China
- 4State Key Laboratory of Cellular Stress Biology, School of Life Sciences, Xiamen University, Xiamen, China
- 5Department of Anthropology and Ethnology, Institute of Anthropology, School of Sociology and Anthropology, Xiamen University, Xiamen, China
- 6State Key Laboratory of Marine Environmental Science, Xiamen University, Xiamen, China
- 7Institute of Artificial Intelligence, Xiamen University, Xiamen, China
Tibetan, one of the largest indigenous populations living in the high-altitude region of the Tibetan Plateau (TP), has developed a suite of physiological adaptation strategies to cope with the extreme highland environment in TP. Here, we reported genome-wide SNP data from 48 Kham-speaking Nagqu Tibetans and analyzed it with published data from 1,067 individuals in 167 modern and ancient populations to characterize the detailed Tibetan subgroup history and population substructure. Overall, the patterns of allele sharing and haplotype sharing suggested (1) the relatively genetic homogeny between the studied Nagqu Tibetans and ancient Nepalese as well as present-day core Tibetans from Lhasa, Nagqu, and Shigatse; and (2) the close relationship between our studied Kham-speaking Nagqu Tibetans and Kham-speaking Chamdo Tibetans. The fitted qpAdm models showed that the studied Nagqu Tibetans could be fitted as having the main ancestry from late Neolithic upper Yellow River millet farmers and deeply diverged lineages from Southern East Asians (represented by Upper Paleolithic Guangxi_Longlin and Laos_Hoabinhian), and a non-neglectable western Steppe herder-related ancestry (∼3%). We further scanned the candidate genomic regions of natural selection for our newly generated Nagqu Tibetans and the published core Tibetans via FST, iHS, and XP-EHH tests. The genes overlapping with these regions were associated with essential human biological functions such as immune response, enzyme activity, signal transduction, skin development, and energy metabolism. Together, our results shed light on the admixture and evolutionary history of Nagqu Tibetan populations.
Introduction
Tibetan Plateau (TP), one of the most challenging environments with perennial cold temperatures, hypobaric hypoxia, and high levels of ultraviolet radiation, is considered the last terrestrial environment occupied by humans (Beall, 2014). The limited archeological and paleogenetic discoveries shed light on an unexpected long-lasting peopling history of TP. The ∼160 thousand-year-old Xiahe Denisovan mandible and the Denisovan-type mtDNA extracted in sediments dated to ∼100–60 thousand years ago (ka) from Baishiya Karst Cave demonstrated the long-term colonization of the northeastern margin of the Tibetan Plateau by archaic hominins (Chen et al., 2019; Zhang et al., 2020). The existence of ∼40–30 ka blade technology at the Nwya Devu site showed evidence of the earliest modern human occupation in the hinterland of TP (Zhang et al., 2018). The co-analyses of archeological and high-resolution mtDNA genetic data revealed that the immigrations related to lowland millet farmers played a crucial role in the introduction of both millet farming (∼5.2 ka) and barley agriculture (∼3.6 ka) into high-altitude plateau areas that further facilitated the permanent settlement on the TP (Chen et al., 2015; Li Y.-C. et al., 2019). So far, only two ancient nuclear DNA-based paleogenomics studies have been reported. All ∼3.4–1.4 ka culture-diverse ancients from the Nepalese side of the Himalayas derived the predominant ancestry from lowland Neolithic Qijia culture-related upper Yellow River (YR) farmers and the rest from an uncertain deeply diverged East Eurasian-related ancestry, suggesting the massive migrations of lowlanders to TP might be more likely to occur before the advent of barley agriculture in TP (∼3.6 ka) (Jeong et al., 2016; Liu et al., 2022). Denser ancient nuclear DNA sampling from archeological sites in TP will lead to a more detailed human evolutionary history, including human dispersal, settlement, and adaptation in TP.
Recent genomic studies, focusing on genome-wide SNP data and lower resolution forensic genetic markers (e.g., Indels, STRs) in systematic sampling of present-day Tibetans and Sherpa highlanders (Yao et al., 2017; Zhang et al., 2017; He et al., 2019, 2021; Liu et al., 2021; Wang et al., 2021, 2022), repeatedly characterized (1) the genetic connection between TP highlanders and lowland Han Chinese/Neolithic upper YR millet farmers (Yao et al., 2017; He et al., 2021; Liu et al., 2021; Wang et al., 2021, 2022) that was in line with the linguistic phylogenetic evidence for the Northern China origin of Sino-Tibetan language (Zhang et al., 2019); (2) the genetic continuity in Himalayan region within at least 3,400 years (Liu et al., 2022); (3) the patterns of co-existence of both Paleolithic and Neolithic ancestries in present-day Tibetan highlanders’ gene pool from both uniparental and autosomal genetic markers perspectives, providing clues of the Upper Paleolithic colonization and Neolithic expansion of anatomically modern humans in TP (Shi et al., 2008; Lu et al., 2016; He et al., 2021; Liu et al., 2021, 2022; Wang et al., 2021, 2022); and (4) the population genetic structure strongly correlated to the culturally defined regions of historical Tibet (Zhang et al., 2017; He et al., 2021; Wang et al., 2021): Amdo Tibetan groups from northeast TP (Qinghai and Gansu) and Kham Tibetan groups from Tibetan-Yi corridor possessed amounts of Ü-Tsang Tibetan-related ancestry (denoted as core Tibetan-related ancestry in Wang et al., 2021) from central and western region of the Tibet Autonomous Region. Moreover, Amdo Tibetans and Kham Tibetans received additional gene flow from Western Eurasian Steppe Herder-related and lowland southeast Asian-related ancestry, respectively.
Tibetans and Sherpa have inhabited high elevations of TP for generations, representing a remarkable research topic for understanding the genetic basis of human adaptation to a high-altitude environment. Multiple variants have been identified as targets of positive selection based on SNP array genotyping and exome or whole-genome sequencing data (Beall et al., 2010; Simonson et al., 2010, 2012; Xu et al., 2011; Yang et al., 2017; Deng et al., 2019). EPAS1 and EGLN1 genes, the two well-established candidates with strong selection signals, contributed functionally to the high-altitude adaptive phenotype of present-day ethnic groups and prehistorical ancients in the Himalayan valley (Jeong et al., 2016; Liu et al., 2022). The adaptive introgression of Denisovan-like archaic humans also accelerated the adaptative process of present-day highlanders in the Himalayas (Huerta-Sánchez et al., 2014; Hackinger et al., 2016). The genetically estimated age of selection on EPAS1 and EGLN1 coincided with the two separate migration waves occurring in the Upper Paleolithic Age and early Neolithic Age, mirroring that Tibetan hunter-gatherers (HG) would have adapted to the harsh environments far before the introduction of the agropastoral subsistence strategy (Peng et al., 2011; Qi et al., 2013; Xiang et al., 2013).
Here, we genotyped 717,228 genome-wide SNPs for three Western Kham-speaking Tibetan groups from Baqing County, Nagqu prefecture. Our combined dataset harbored spatiotemporally diverse Eurasians, thus allowing us to investigate (1) the finer-scale population structure within Nagqu Tibetan inhabitants, and the genetic relationships between the studied Nagqu Tibetans and published ancient and present-day Eurasians via two different analysis strategies: allele-frequency sharing-based methods including principal component analysis (PCA), ADMIXTURE, f-statistics, FST, and haplotype sharing-based methods Refined IBD and fineSTRUCTURE; (2) the admixture history of the studied Nagqu Tibetans based on admixture f3-statistics, linkage disequilibrium-decay-based ALDER, and f statistics-based qpAdm; and (3) the genomic regions with natural-selection signals for our newly collected Nagqu Tibetans and the published Ü-Tsang Tibetans (Wang et al., 2021) via haplotype-based methods (iHS and XP-EHH) and allele-frequency-based method (FST).
Methods and materials
Sample collection, genotyping, quality control, and data merging
We collected saliva samples of 62 Nagqu Tibetan individuals with informed consent from three Western Kham-speaking Tibetan groups in Baqing County, Nagqu prefecture (Figure 1A). The studies involving human participants were reviewed and approved by Xizang Minzu University. We genotyped genome-wide SNP data (717,228 SNPs) via Illumina WeGene Arrays. We used PLINKv1.90 (Chang et al., 2015) for quality control based on Hardy–Weinberg exact test (–hwe 10–6), minor allele frequency (–maf 0.01), and missing rate (–geno 0.01 and –mind 0.01). Finally, the dataset remained 450,031 SNP sites. We used GCTA software (Yang et al., 2011) to estimate the genetic relationship matrix (GRM) and applied PLINKv1.9 (Chang et al., 2015) with the option “–remove” to exclude 14 samples who possessed close sibship with others within three generations (kinship coefficient > 0.125) (Supplementary Figure 1). We merged our data with published modern and ancient reference data from the Human Origin (HO) dataset and the 1240K dataset shared from Allen Ancient DNA Resource (AADR)1 to generate the “merged 1240K dataset (172,393 SNPs)” and “merged Human Origin dataset (64,018 SNPs)” via mergeit packages in EIGENSOFT (Patterson et al., 2012).
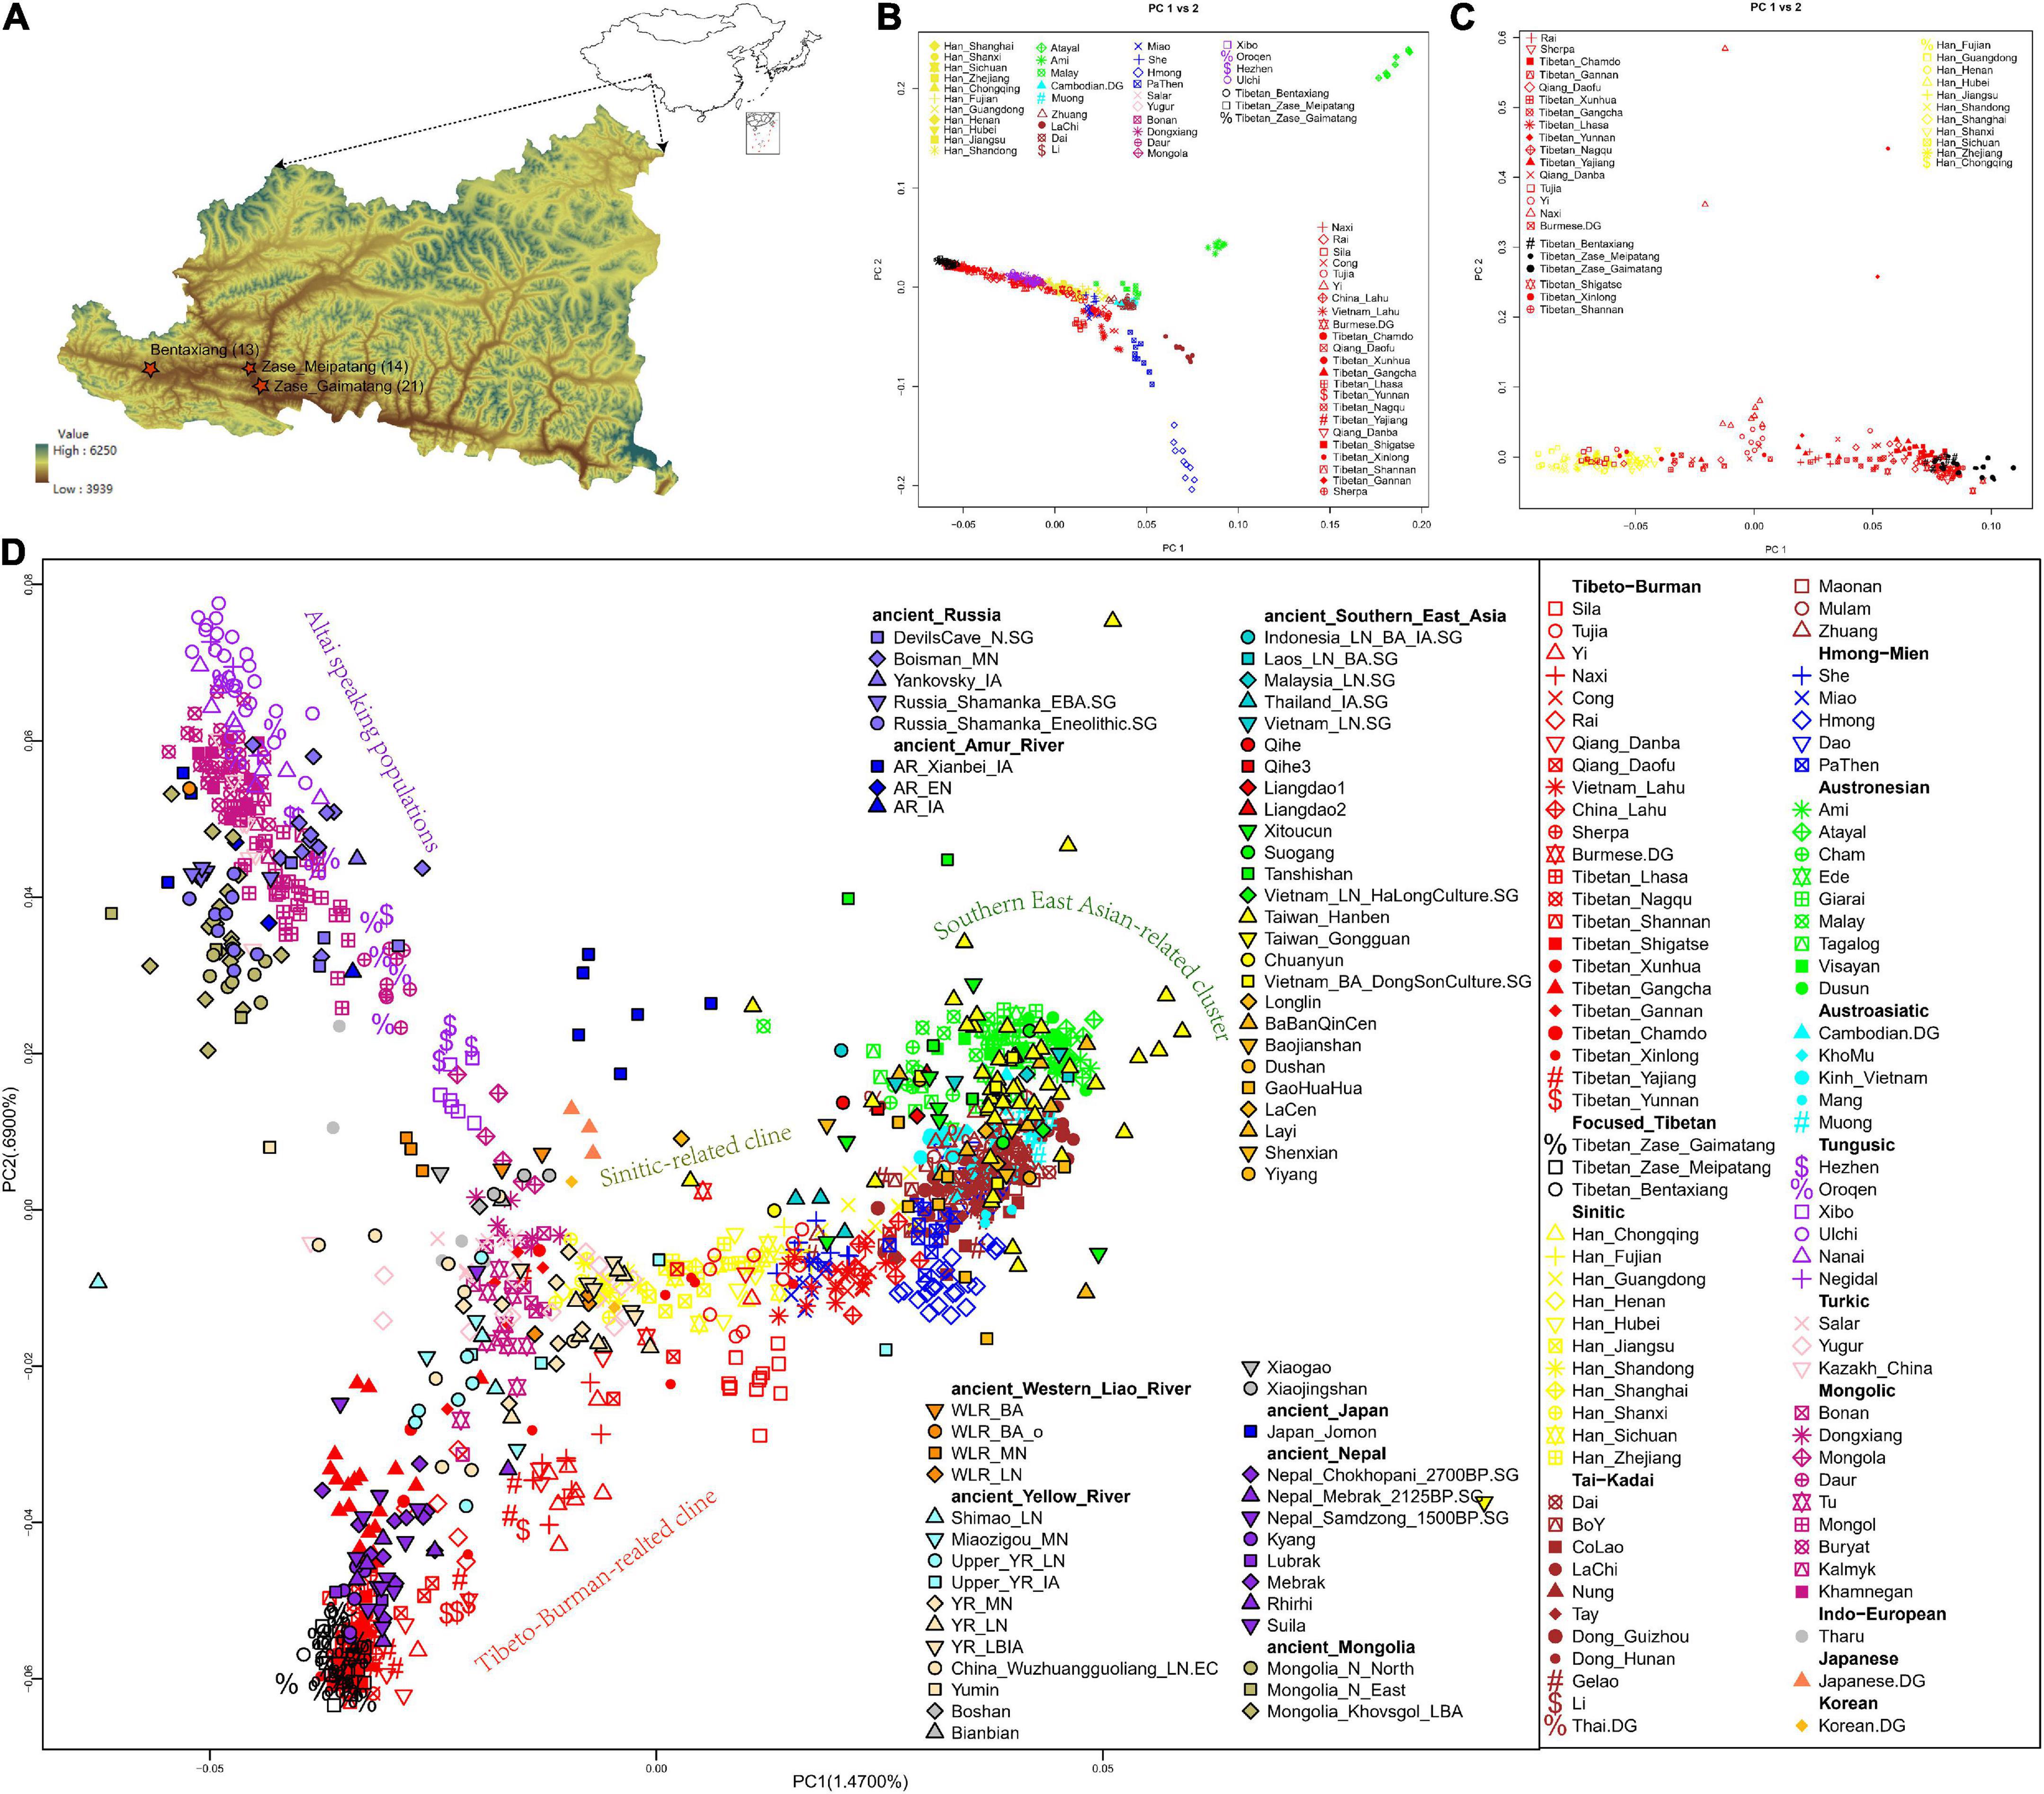
Figure 1. Geographical locations of our newly collected Nagqu Tibetan samples and genetic population structure of East Asians. (A) Map of our studied three Nagqu Tibetan populations. Sample sizes were indicated in parentheses. Map of East Asia was plotted via R package “map” (top-right), and the relief map of Baqing County was plotted using ArcGIS (bottom-left). (B,C) Haplotype sharing-based PCA that focused on (B) present-day East Asians and (C) Sino-Tibetan speaking populations were constructed based on the co-ancestry matrix via fineSTRUCTURE. (D) Allele-frequency-based PCA plot focused on present-day and ancient East Eurasians. Populations were color-coded according to the geographical and linguistic categories.
Principal component analysis
We applied the smartpca program (version: 16000) implemented in EIGENSOFT (Patterson et al., 2012) to conduct PCA with lsqproject: YES, shinkmode: YES, and numoutlieriter: 0.
ADMIXTURE
We pruned the SNPs with strong linkage disequilibrium in the “merged HO dataset” using “–indep-pairwise 200 25 0.4” option in PLINKv1.9 (Chang et al., 2015). The pruned HO dataset containing 53,692 SNPs was used for the unsupervised ADMIXTUREv1.3.0 (Alexander et al., 2009) analysis to explore the individual genetic compositions with the predefined K ancestral components ranging from 2 to 12. We estimated the cross-validation (CV) error with the option “–cv 10.” The best-fitted model possessed the lowest CV error.
Pairwise FST
We measured FST index (Weir and Cockerham, 1984) via smartpca (version: 16000) package in EIGENSOFT (Patterson et al., 2012) with parameters “inbreed: YES; fstonly: YES” to estimate the genetic distance between the studied Nagqu highland Tibetans and 75 present-day East Eurasian populations that composed of at least five sampled individuals. We built a neighboring joining (NJ) tree based on FST genetic distance via the Molecular Evolutionary Genetic Analysis v.7.0 (MEGA 7.0) (Kumar et al., 2008).
f3 statistics
We used the qp3Pop (version 600) program in ADMIXTOOLS (Patterson et al., 2012) to calculate two forms of f3 statistics. (1) outgroup-f3 (X, Y; Yoruba) assessed the sharing genetic drift between the studied Nagqu Tibetans (X) and reference Eurasians (Y) since their divergence from the outgroup Yoruba. The high outgroup-f3 values suggested the close genetic relationships; (2) admixture f3-statistics in the form of f3 (source1, source2; studied Nagqu Tibetans) were used to identify the potential admixture signals for the focused Nagqu Tibetans. The significant negative admixture f3 values (Z < −3) denoted the possible admixture signals.
Estimating gene flow based on f4-statistics
We applied f4-statistics in the form of f4 (Yoruba, W; X, Y) to detect the admixture events across four populations via qpDstat (version 600) package in ADMIXTOOLS software (Patterson et al., 2012). The significant negative f4 (Z < −3) denoted W shared excess derived alleles with X than with Y; the significant positive f4 (Z > 3) suggested that W shared more alleles with Y than with X; the non-statistically significant f4 (−3 < Z < 3) indicated that W shared the equal loci with X and Y.
Pairwise qpWave
We applied qpWave (version 600) in ADMIXTOOLS (Patterson et al., 2012) to test whether the two left populations were genetic homogeny relative to a set of outgroup populations (sample sizes were indicated in parentheses): Mbuti (4), Loschbour_HG (1), Russia_Afanasievo (23), Tianyuan (1), Onge (2), Papuan (15), Xiaojingshan (3), Mongolia_N_East (2), Qihe3 (1), Ami.DG (2), Upper_YR_LN (7), and YR_MN (3).
qpAdm
We used qpAdm (version: 1000) in ADMIXTOOLS (Patterson et al., 2012) to infer the admixture proportions for the studied Nagqu Tibetans (as well as the reference Tibetans published in Wang et al., 2021) with the parameter “allsnps: YES.” We only accepted the admixture models fitting three criteria: (1) p-value > 0.05; (2) nested p-value < 0.05; and (3) all the ancestral coefficients were within the range [0, 1]. We used the following 11 populations as outgroups (sample sizes were indicated in parentheses): Mbuti (4), Loschbour_HG (1), Onge (2), Papuan (15), Russia_EHG (1), Yana_UP (2), Tianyuan (1), Qihe3 (1), DevilsCave_N (4), Japan_Jomon (6), and Anatolia_N (22).
ALDER
To infer the admixture date, we conducted ALDER v1.03 (Loh et al., 2013) with parameters: mindis: 0.005 and jackknife: YES. We exhausted all pairs of the present-day Eurasian populations in the “merged HO dataset” as reference populations and each studied Nagqu Tibetan population as target population. We reported results with 2-ref Z-score > 3 and p-value < 0.001. We assumed 29 years per generation to scale the time.
Phasing data
We used PLINKv1.9 (Chang et al., 2015) to split the bPLINK form data (.bed, .bim, .fam) based on the chromosome and ran SHAPEIT2 (Delaneau et al., 2012) software with 1000 Genomes Phase 3 genetic maps (1000 Genomes Project Consortium et al., 2015) released by the HapMap Consortium2 to infer haplotypes of each present-day individuals from three genotype datasets, respectively: (1) HO dataset (597,573 SNPs); (2) newly generated dataset (harbored three studied Nagqu populations with 450,031 SNPs); and (3) the “merged HO dataset” with 64,018 SNPs. We ran impute2chromopainter.pl to convert SHAPEIT2-type files into the Chromopainterv2 phase format. We ran convertrecfile.pl to generate recombination files.
FineSTRUCTURE
We ran the haplotype-based method fineSTRUCTUREv4 (Lawson et al., 2012) to cluster individuals into genetic homogeny groups based on automatic mode (“fs”) following four stages: (1) estimate the switch rate Ne and global mutation rate mu; (2) chrome painting; (3) fine structure MCMC inference; and (4) fine structure tree inference.
Inferring the identity by descent segments and effective population size (Ne)
We used Refined IBD software (Browning and Browning, 2013) with option “length = 1” to infer the sharing IBD between each pair of individuals and then used the program merge-ibd-segments from BEAGLE utilities (Browning and Browning, 2007; Browning et al., 2018) to remove gaps between IBD segments that had at most one discordant homozygote and were less than 0.6 cM in length. The IBD sharing within each individual population = , the pairwise population-level shared IBD = , whereNAandNB represented the sample size of populations A and B. Effective population size was estimated using the IBDNe software (Browning and Browning, 2015) based on the shared IBD of at least 2 cM within each newly collected Nagqu Tibetan population.
Detecting natural-selection signals based on haplotype-based and allele-frequency-based methods
The iHS scores (Voight et al., 2006) and XP-EHH scores (Sabeti et al., 2007) for autosomal SNPs with minor allele frequency > 5% were calculated via the R package of “rehh” (Gautier et al., 2017). We split the genome into non-overlapping segments of 200 kb as described in Pickrell et al. (2009). The regions that harbored more than 20 SNPs with | iHS scores/XP-EHH scores| > 2 were considered candidates for containing selective sweeps. The size of the signal in each region was quantified by the proportion of SNPs with | iHS scores/XP-EHH scores| > 2.
For FST analysis (Weir and Cockerham, 1984), we divided the whole genome into 200 kb non-overlapping windows. Autosomal SNPs with minor allele frequency > 5% were used for FST calculation. We computed the weighted and mean FST via vcftools software (Danecek et al., 2011) for windows with more than five SNPs. We defined that the windows with FST scores in the top 1% of the distribution were the candidate regions under positive selection.
All genes that overlapped with the window of 50 kb on either side of each candidate region are reported in Supplementary Table 10. We then conducted Gene Ontology (GO) analysis via R packages “Clusterprofiler v3.18.1” (Wu et al., 2021) with default options. Enriched pathways with an adjusted p-value of < 0.05 after Bonferroni correction were considered statistically significant. Gene function was determined using National Center for Biotechnology Information Gene (NCBI)3 and literature searches.
Results
Genetic affinity of the studied Nagqu Tibetans in the context of East Asians
After quality control and removal of biologically related individuals, we obtained 450,031 SNPs typed on 48 individuals in three Kham-speaking Nagqu Tibetan subpopulations (Figure 1A). East Asian-specific haplotype sharing-based PCA (Figures 1B,C) and allele-frequency-based PCA (Figure 1D) showed the geographically structured gene pools in Sino-Tibetan (ST) speaking populations: (1) Tibeto-Burman (TB) speakers from Southern East Asia (e.g., Lahu, Cong) displayed close relationships with Tai-Kadai (TK)/Austroasiatic (AA)/Austronesian (AN)/Hmong-Mien (HM) speaking populations from southern China and Southeast Asia; (2) Han Chinese formed a north-to-south genetic cline; TB speakers from central China such as Tujia clustered with geographically close Han Chinese; and (3) one genetic cline comprising TB-speaking highlanders from TP and Tibetan-Yi corridor. Our newly genotyped three Nagqu Tibetan populations formed a tight genetic cluster falling with previously published core Tibetans that at the end of TB-speaking highlander-related cline away from lowland TB-related cluster. Moreover, FST index-based neighboring-joining tree (Supplementary Figure 2A) and co-ancestry matric-based clustering patterns (Supplementary Figure 2B) described that the studied Nagqu Tibetans formed a clade with Ü-Tsang Tibetans and then with geographically close Amdo/Kham Tibetans, Han Chinese, and lowland TB in turn. The top high outgroup-f3 statistics in the form of f3 (studied Nagqu Tibetans, present-day reference pops; Yoruba) (Supplementary Figure 3A) and numerous negative f4-statistics in the form of f4 (Yoruba, studied Nagqu Tibetans; representative northern ST speaking populations, worldwide reference populations) (Supplementary Figure 3B) validated the closest relationship between the studied Nagqu Tibetans and geographically close ST speaking populations under the genetic background of Eurasians.
After projecting ancient reference populations in the PCA plot (Figure 1D), we replicated the previous findings of the genetic continuity across at least 3,400 years in the Himalaya region, as ancient Nepalese from Mustang and Manang districts (aMMD) aggregated with the present-day Tibetan-related cline. The studied Nagqu Tibetans also had relatively close relationships with the ancient Yellow River millet farmers from Qijia culture-related sites (upper_YR_LN), Miaozigou site in Inner Mongolia (Miaozigou_MN), Shimao site in Shannxi (Shimao_MN), Middle Neolithic Yangshao (YR_MN), and Late Neolithic Longshan (YR_LN) culture-related individuals and further validated via outgroup-f3 statistics (Supplementary Figure 4A). Moreover, the studied Nagqu Tibetans shared equal alleles with each pair of the aforementioned ancients as no significant f4 was observed in f4 (Yoruba, studied Nagqu Tibetans; YR_LN/upper_YR_LN/Miaozigou_MN/Shimao_LN/ancient Nepalese, YR_LN/upper_YR_LN/Miaozigou_MN/Shimao_LN/ancient Nepalese) (Supplementary Figure 4B).
The ancestry makeup of the studied Nagqu Tibetans
We then applied the unsupervised model-based ADMIXTURE analysis to infer the genetic makeup of the studied Nagqu Tibetans and the clustering patterns with reference Eurasians. The lowest CV error (Supplementary Figure 5) was obtained when assuming six predefined sources (i.e., K = 6, CV error = 0.62120). At K = 6 clusters (Figure 2), one genetic component (purple in the plot) was maximized in published core Tibetans, as well as the studied Nagqu Tibetans, Sherpa, and ancient Nepalese, illuminating either their sharing common evolutionary history or recent admixture events. In addition, core Tibetan-related ancestry acted as one ancestry component in the ADMIXTURE models for K ranging from 4 to 12, mirroring its genetic uniqueness in the context of East Asians (Supplementary Figure 6).
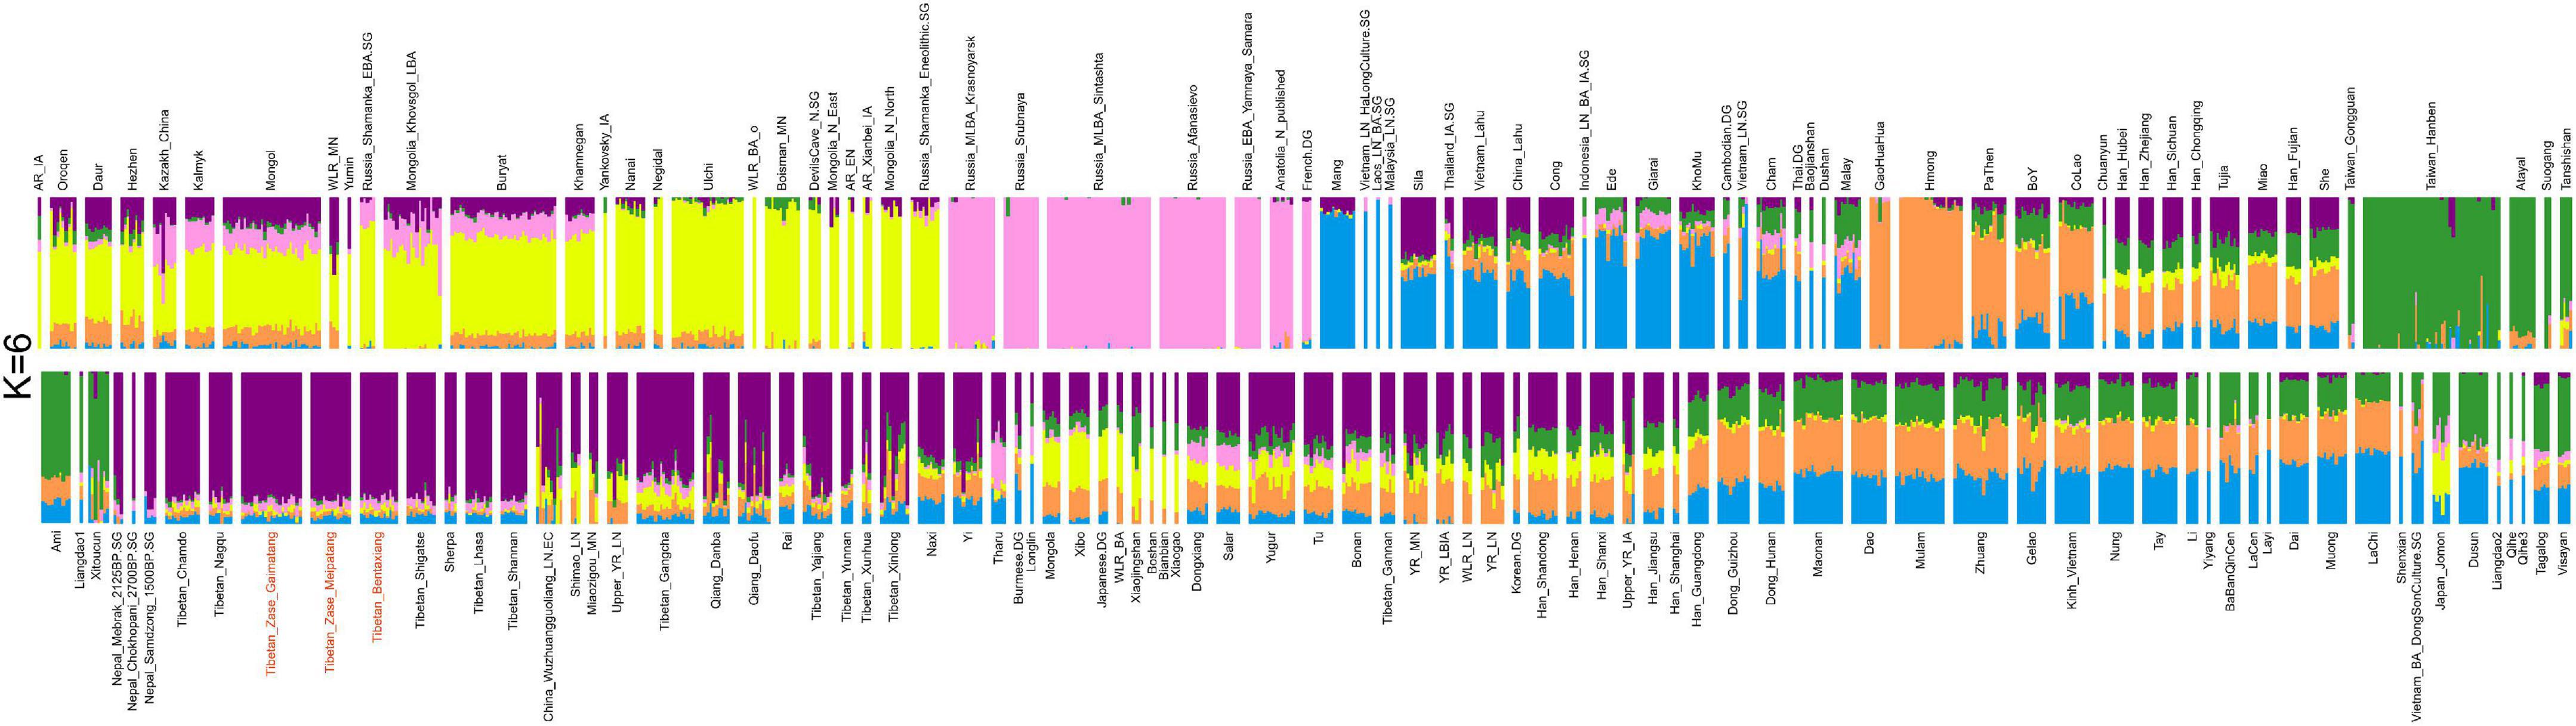
Figure 2. Unsupervised model-based ADMIXTURE analysis for six predefined ancestral sources (K = 6) based on the LD-pruned dataset (50,194 SNPs). We observed that our studied Nagqu Tibetans clustered with the published core Tibetans (Purple in the plot).
To quantitatively explore the prominent ancestry of the studied Nagqu Tibetans, we calculated f4 (Yoruba, X; targeted Nagqu Tibetans, Y) (Supplementary Figure 7) based on the merged HO database (64,130 SNPs). The studied Nagqu Tibetans expectedly harbored significant amounts of X people-related ancestry if we observed significant negative f4 values (Z < −3) for most Y. We identified that ancient Nepalese-related ancestry (represented by Nepals_Samdzong_1500BP, Nepals_Mebrak_2125BP, Nepals_Chokhopani_2700BP) shared excess alleles with the studied Nagqu Tibetans than with most East Asians except for published core Tibetans from Shannan (3.078 < Z < 4.505). Inland ancient NEAs represented by Yellow River millet farmers from Shimao site (Shimao_LN), Miaozigou site (Miaozigou_MN), and Qijia culture (upper_YR_LN) were more related to the studied Nagqu Tibetans than to most East Asians except for northern Chinese Han populations (3.689 < Z < 5.095). Moreover, Western Steppe Herd (WSH) (represented by steppe pastoralist-related ancestry EBA_Afanasievo, MLBA_Sintashta) shared similar amounts of genetic drift with the studied Nagqu Tibetan highlanders and Han Chinese except for coastal Han_Fujian from Southern China (−3.078 < Z < −2.713). The studied Nagqu Tibetans exhibited excess WSH-related ancestry than most present-day Southern East Asians, that is, Z-scores of f4 (Yoruba, WSH representatives; targeted Nagqu Tibetans, southern East Asians) < −3.
Collectively, the studied Nagqu Tibetans derived most of their ancestry from ancient Nepals and upper Yellow River farmer-related lineages. To explore whether the studied Nagqu Tibetans received additional gene flow from worldwide reference Eurasians compared with the assumed ancestors, we calculated f4 (Yoruba, HO modern East Asians/1240K ancient Eurasians; targeted Nagqu Tibetans, the assumed ancestors) (Supplementary Figure 8). We observed the genetic homogeny between the studied Nagqu Tibetans and ancient Nepalese (all f4 values∼0), suggesting that they might be most likely to derive from a common ancestral population. There were numerous significant positive f4 but no significant negative results found in f4 (Yoruba, reference Eurasians; the studied Nagqu Tibetans, ancients from upper YR regions), suggested that Shimao_LN, Miaozigou_MN, and upper_YR_LN individuals might harbor more coastal/Inland Northern and Southern East Asian-related ancestry than our studied Nagqu Tibetans. It could also be explained by the studied Nagqu Tibetans receiving the gene flow from an unknown deeply branching ancestry that might split off before the differentiation of northern East Asian and southern East Asian lineages. In addition, we identified that the studied Nagqu Tibetans harbored more Western Eurasian-related ancestry relative to upper_YR_LN (2 < Z < 3).
The demographic history of the studied Nagqu Tibetans
To explore the recent admixture signals for the studied Nagqu Tibetans, we exhausted all pairs of modern/ancient Eurasian populations in the merged HO and the merged 1240K datasets to generate 5,050 and 2,278 pairs of reference sources and then carried out admixture f3-statistics in the form of f3 (source1, source2; studied Nagqu Tibetan) (Supplementary Tables 1–6). The statistically negative f3 values (Z < −3) suggested that the allele frequency of the studied Nagqu Tibetan intermediated between that of source1 and source2, indicating the potential admixture signatures. Only one pair of source populations in f3 (Mongolic-speaking Bonan, Tibetan_Zase_Gaimatang; Tibetan_Zase_Meipatang) gave a significant negative result (−3.123 × SE) for Tibetan_Zase_Meipatang. We did not detect any other significant admixture signals, which might be explained by (1) the strong post-admixture genetic drift; and (2) the true source populations experienced extreme genetic drift following the divergence with the reference sources. Focused on the lowest admixture f3 values (though the corresponding Z-scores fall within [−3,0]), we summarized that (1) one source from the present-day western European (WE)/South Asian (SA) population and the other source from TB-speaking populations could generate weak signals for the other two studied Nagqu Tibetans, for example, f3 (English, Qiang_Danba; Tibetan_Bentaxiang) = −2.833 × SE; f3 (French, Tibetan_Meipatang; Tibetan_Zase_Gaimatang) = −1.178 × SE; (2) ancient Nepalese combined with ancient southeast Asians could also produce marginal signals for all three studied Nagqu Tibetans, for example, f3 (Chokhopani, Indonesia_LN_BA_IA; Tibetan_Bentaxiang/Tibetan_Gaimatang/Tibetan_Meipatang) = −2.315 × SE/−1.669 × SE/−1.643 × SE, but the low coverage of Indonesia_LN_BA_IA should be cautioned. We then applied ALDER to estimate the date of these admixture events for three studied Nagqu Tibetan populations. The combinations of one WE/SA and one EA can give significant admixture signals dating to ∼20–50 generations ago (Supplementary Table 7).
Next, we calculated the normalized length and count of shared IBD segments within each ST group to infer the population demographic history (Figure 3A). We found that studied Zase_Gaimatang Tibetan (21 samples), studied Zase_Meipatang Tibetan (14 samples), Cong (12 samples), Yunnan Tibetan (4 samples), Vietnam Lahu (12 samples), and Sila (12 samples) showed an upward trend of within-population IBD sharing relative to other ST speaking references, suggesting their possible strong genetic drift experience; Han Chinese and other Tibetans displayed relatively low levels of within-population IBD sharing, indicating either population expansion or admixture. Then, we applied IBDNe software to estimate the effective population size (Ne) of three studied Nagqu Tibetans. We found that targeted Nagqu Tibetans have undergone a decreased population size ∼10–20 generations ago, followed by a recent population expansion with different levels: The Ne of studied Bentaxiang Tibetans was relatively larger than that of the studied Zase Tibetans (Figure 3B). Finally, we estimated the normalized length of shared IBD blocks between populations (Figure 3C). Our three studied Nagqu Tibetans shared more than 10 cM IBD with each other and shared 4–6 cM IBD with the published Ü-Tsang Tibetans. The results from f4 (Yoruba, reference Eurasians, studied Nagqu Tibetans, published Ü-Tsang Tibetans) showed the relatively genetic homogenous between the studied Nagqu Tibetans and published Ü-Tsang Tibetans except that Shannan Tibetans harbored more ancestry associated with present-day Qiang, ancient Nepals_Samdzong_1500BP, and ancient Nepals_Mebrak_2125BP individuals (2.113 < Z < 4.505) than the studied Nagqu highlanders (Supplementary Figure 9). The recent contact and/or shared ancestry was also evidenced via the long IBD fragment sharing (>5 cM) between Kham-speaking Nagqu Tibetans and Kham-speaking Chamdo Tibetans. Outgroup-f3 statistics also suggested that our studied Kham-speaking Nagqu Tibetans shared the highest genetic drift with Kham-speaking Chamdo Tibetans (Supplementary Figure 3A). f4-statistics showed that Chamdo Tibetans harbored more studied Nagqu Tibetan-related ancestry as no significant positive f4 results were observed in f4 (Yoruba, studied Nagqu Tibetans; Chamdo Tibetans, worldwide references) (Supplementary Figure 3B).
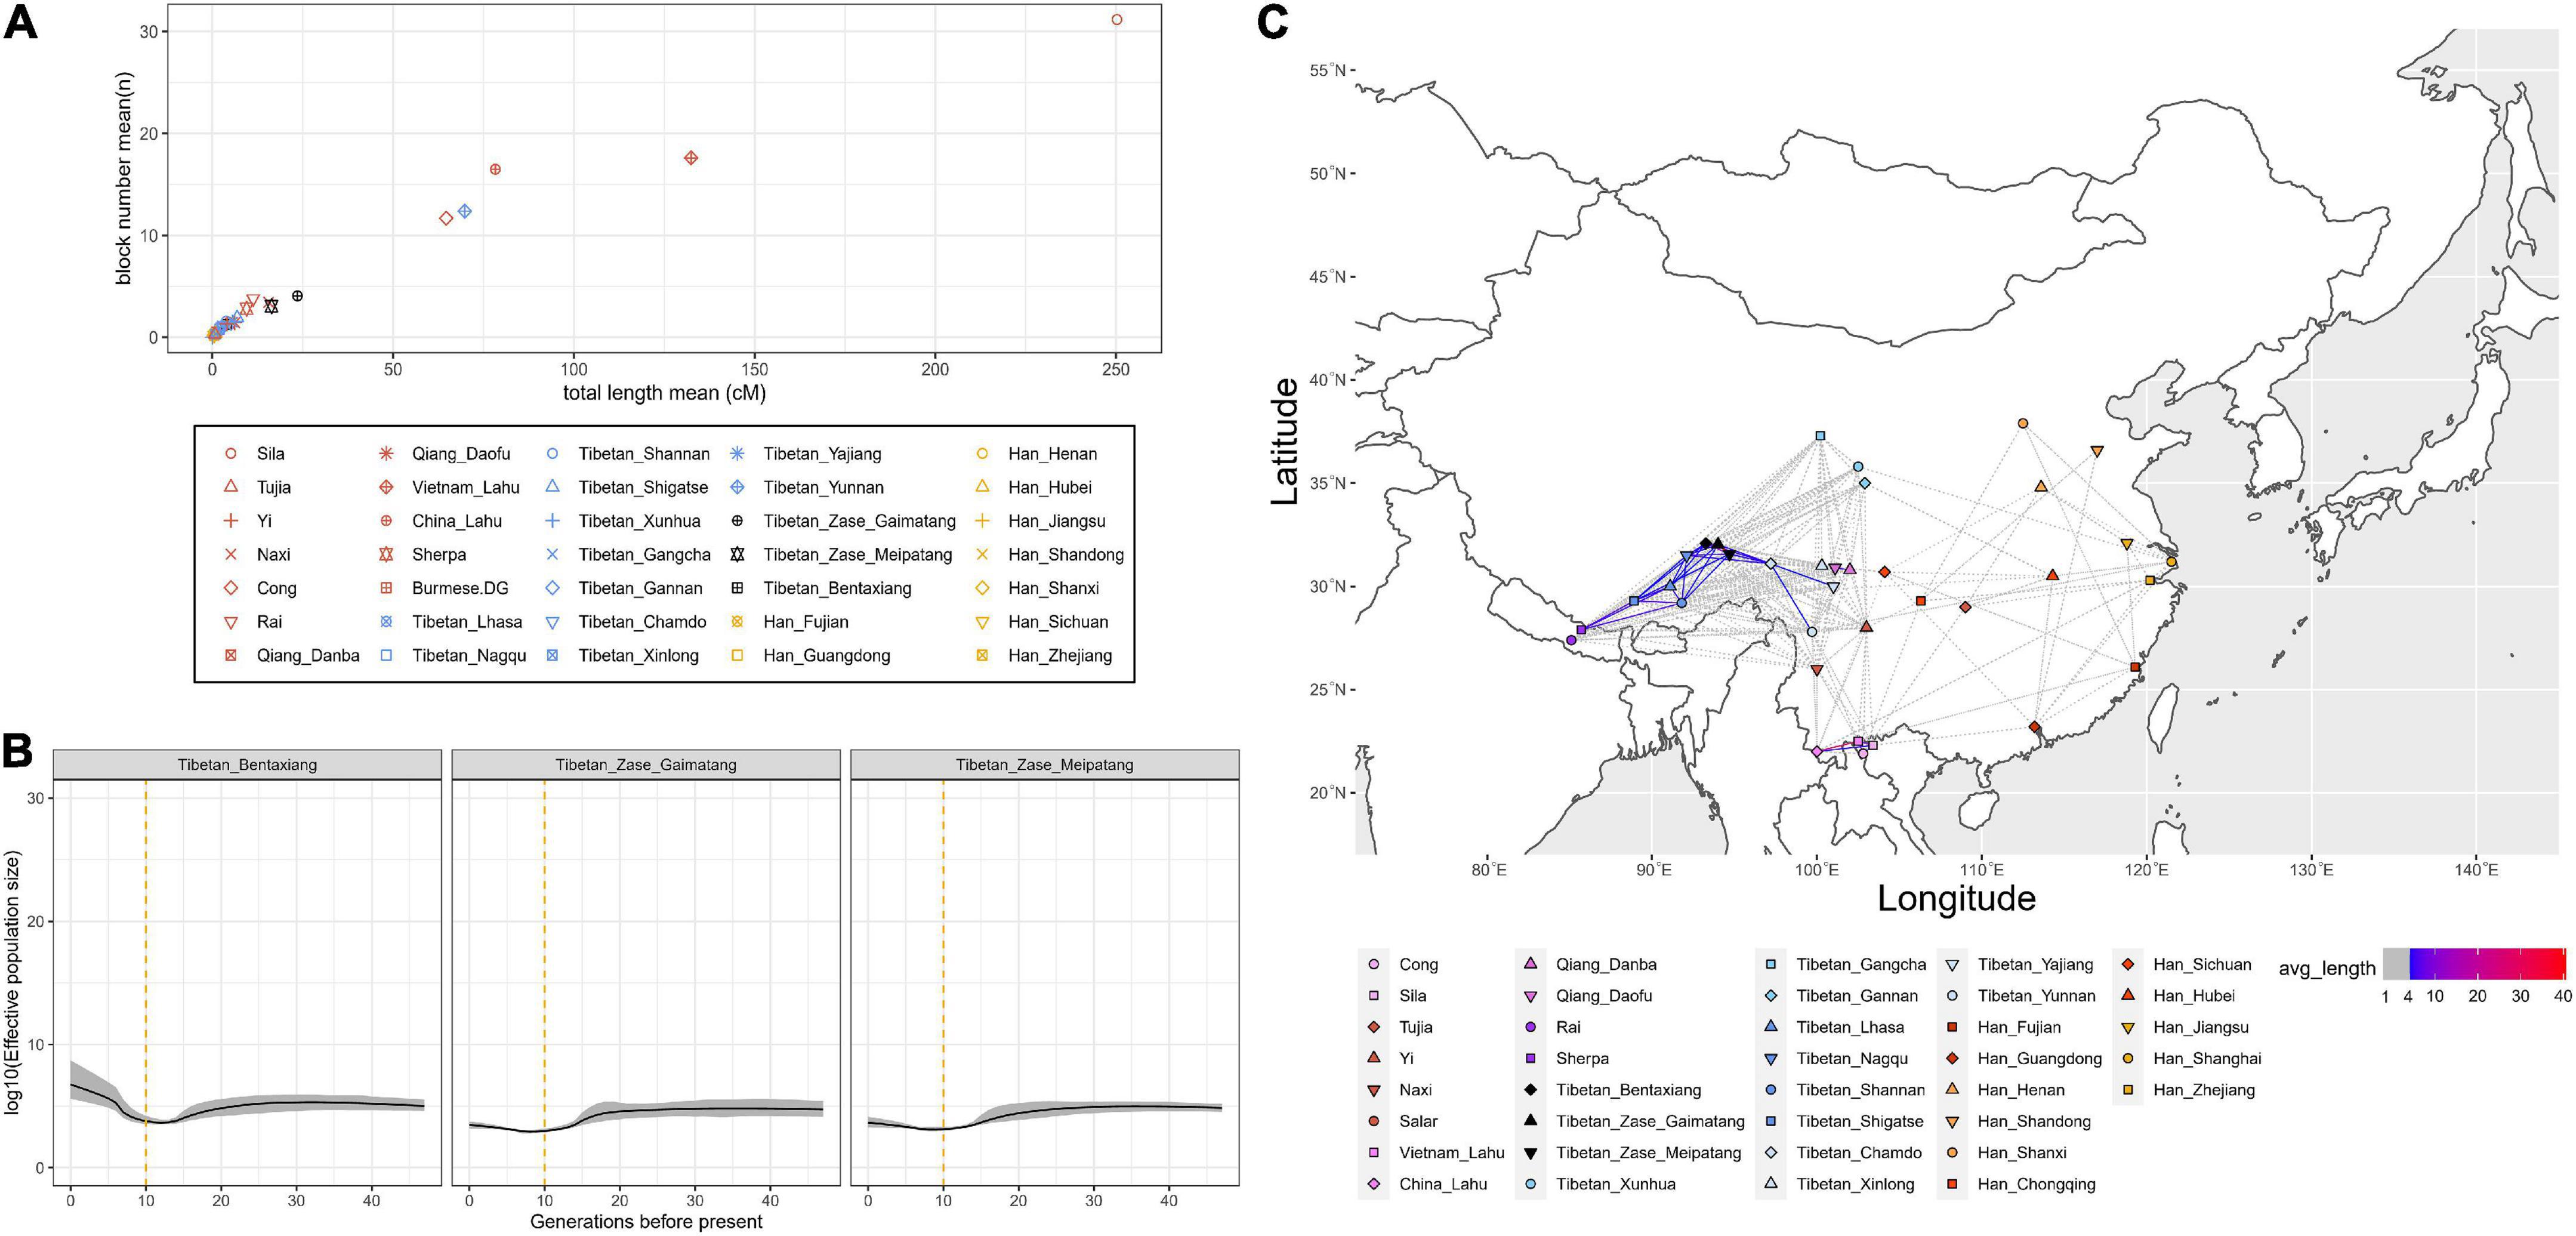
Figure 3. Identity-by-descent (IBD) sharing-based analysis. (A) The normalized number and length (unit: cM) of IBD blocks sharing within a population. (B) Effective population size (Ne) of three studied Nagqu Tibetan populations within 30 generations before the present. (C) The normalized length (unit: cM) of IBD sharing between Sino-Tibetan populations.
Constructing qpAdm-based admixture models
Pairwise qpWave suggested the cladality between the studied Nagqu Tibetans and ancient Nepalese from Chokhopani and Mebrak-related cultures as well as present-day Tibetan populations from Lhasa, Shigatse, and Nagqu relative to a series of outgroups (Figure 4A). To better understand the genetic origin of the studied Nagqu Tibetan, here, we used (1) Neolithic upper Yellow River farmers (represented by upper_YR_LN) as the representatives of northern East Asians; (2) Hunter-gatherers (HG) from Southern East Asia (represented by Upper Paleolithic Guangxi_Longlin and Laos_Hoabinhian) and present-day South Asia populations (Mala/PaThan) as the southern surrogates; (3) western Steppe pastoralist (represented by Russia_EBA_Afanasievo and Russia_MLBA_Sintashita) as Western Eurasians surrogate to conduct qpAdm-based two-way and three-way admixture model (Figure 4B; Supplementary Table 8). The studied Nagqu Tibetans could be modeled as the mixture of ∼90% upper_YR_LN+ ∼10% present-day South Asian Mala/PaThan adequately. However, upper_YR_LN + Guangxi_Longlin/Laos_Hoabinhian individuals failed to describe the ancestry of the studied Nagqu Tibetans. Only studied Tibetan_Zase_Gaimatang could be successfully fitted as the mixture of upper_YR_LN+ Western Steppe pastoralist (p-value = 0.53323). However, this two-way model was worse than the well-fitted three-way admixture model that used Upper_YR_LN + Laos_Hoabinhian/Guangxi_Longlin + Steppe pastoralist as ancestry proxies (p-value of > 0.190328; nested p-value of < 0.00245 for pattern 010) for all three studied Nagqu Tibetans in the merged HO dataset (64,018 SNPs) and the published Tibetan_Nagqu, Tibetan_Shigatse, Tibetan_Shannan, and Tibetan_Lhasa in the HO dataset (597,573 SNP sites) (Supplementary Table 9). In addition, f4 values of f4 (Yoruba, Denisovan; Han, studied Nagqu Tibetan) were non-significant (−1.154 < Z < 0.388), suggesting that our newly collected Nagqu Tibetans did not harbor more Denisovan-related genetic heritage than Han Chinese.
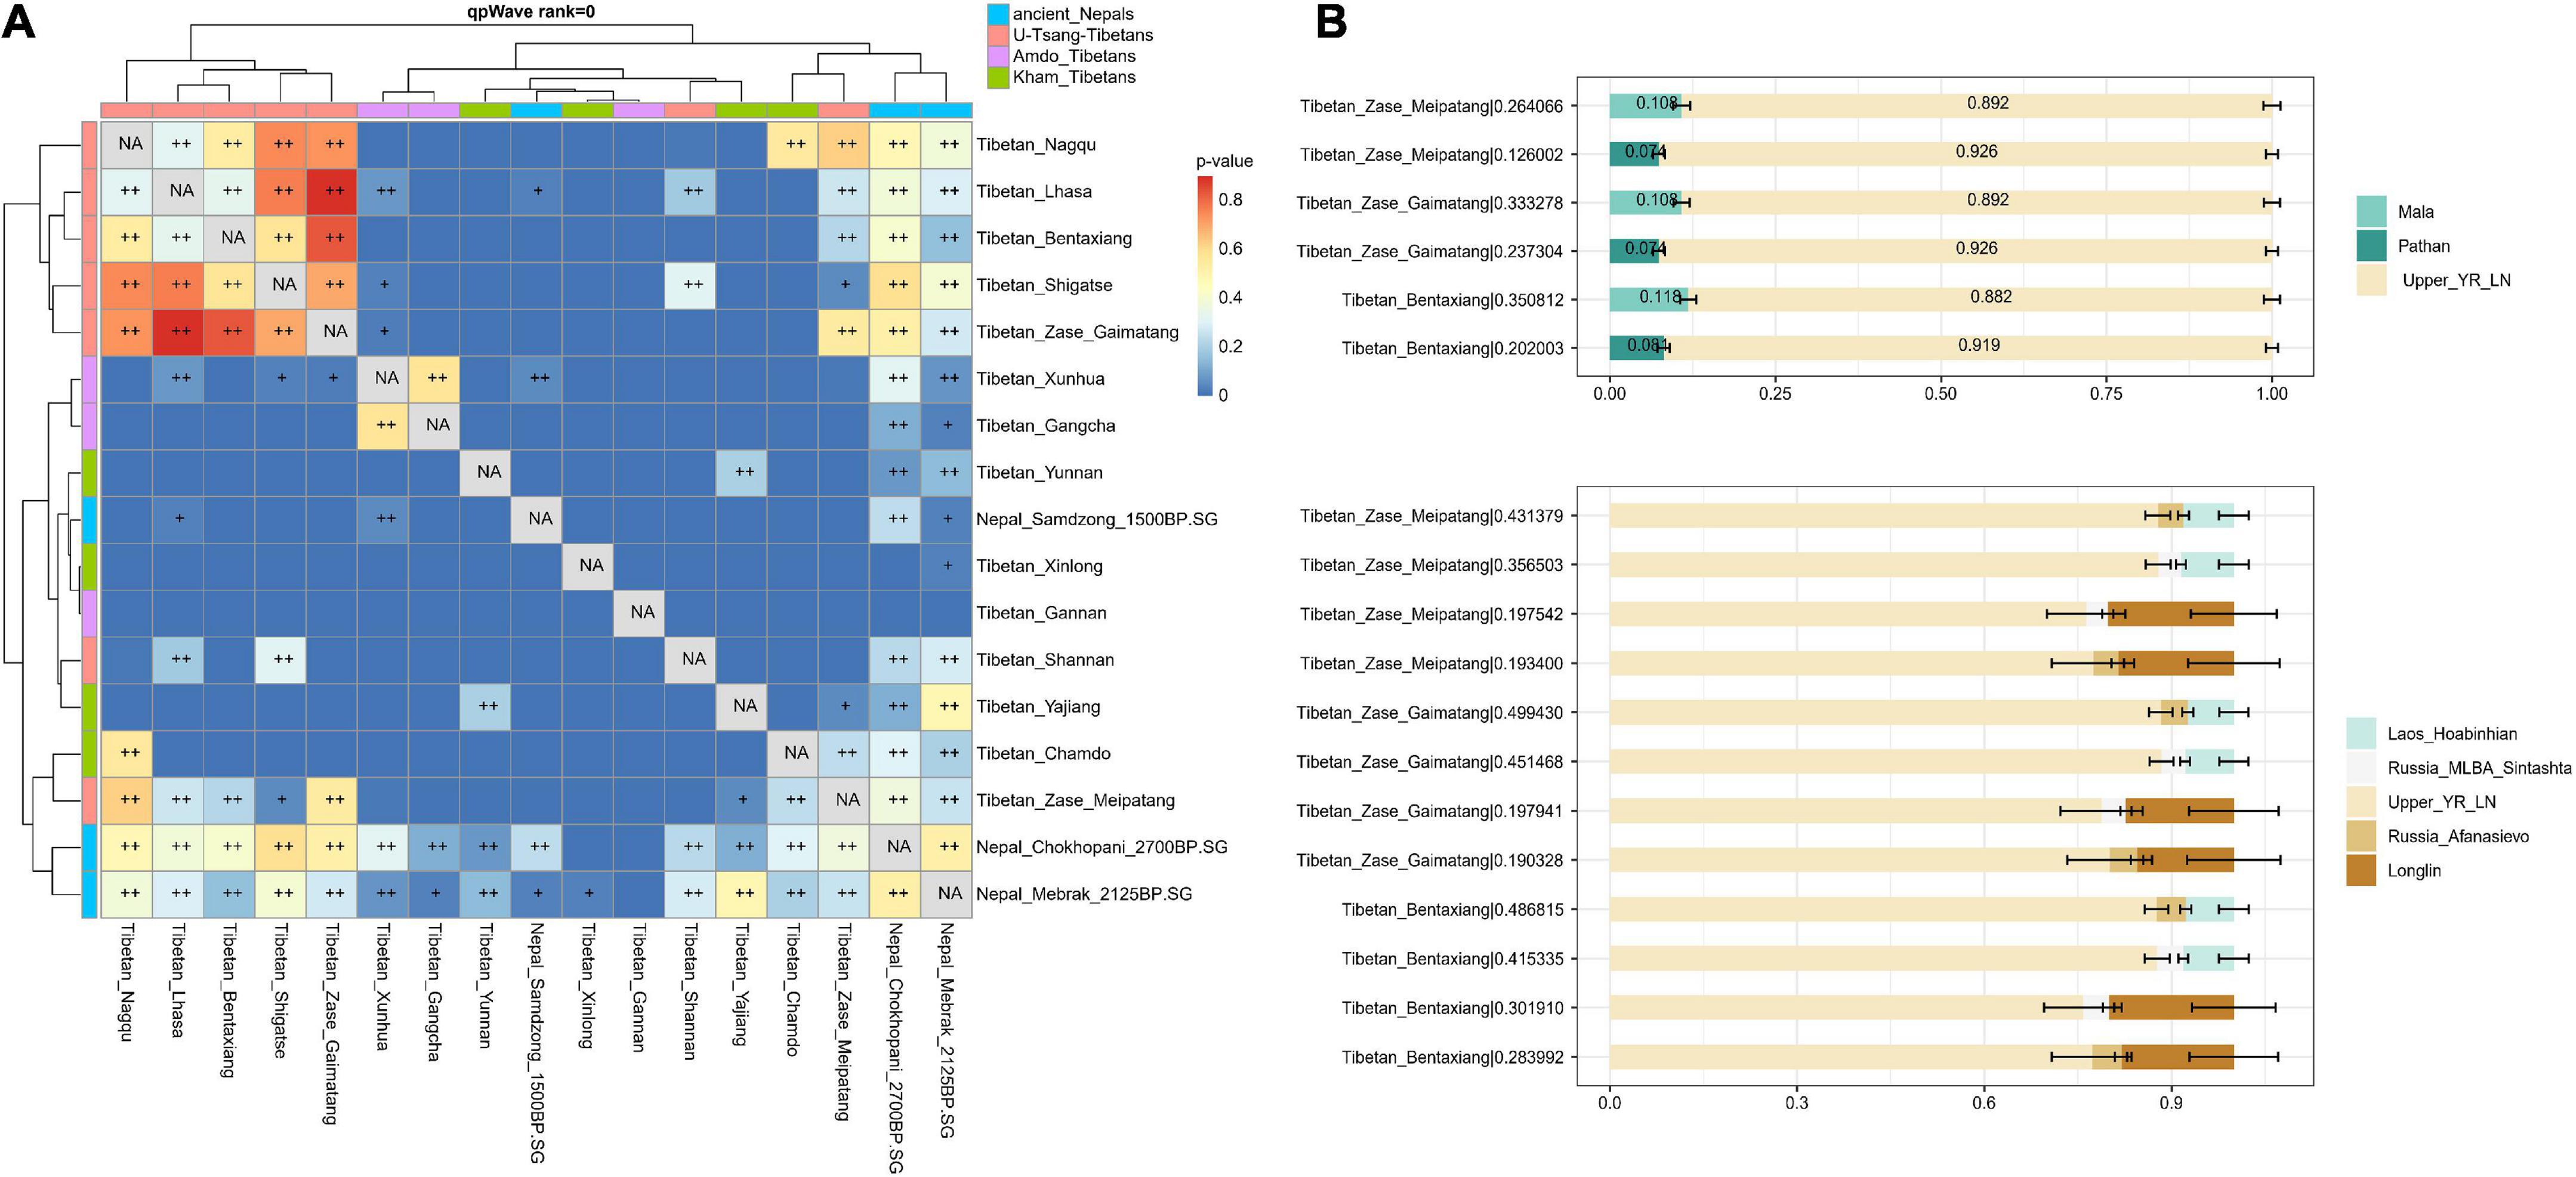
Figure 4. Inferring the demographic history of our studied Nagqu Tibetans. (A) Pairwise qpWave analysis suggested the genetic homogeny between the studied Nagqu Tibetans and ancient Nepalese from Chokhopani and Mebrak-related cultures as well as published present-day Tibetan populations from Nagqu, Lhasa, and Shigatse (0.01 < p-value < 0.05 was noted as +, p-value > 0.05 was noted as ++) and (B) the fitted two-way and three-way qpAdm-based admixture model for three studied Nagqu Tibetan populations. For each target population, we reported the p-value for rank = 1 behind the corresponding population name in the form of “population name| p-value.” The error bars showed the standard errors of the estimated ancestry proportions. Details of the modeling are provided in Supplementary Table 8.
Y-chromosomal and mtDNA diversity in the studied Nagqu highlanders
We assigned all 48 individuals to 26 maternal haplogroups (Supplementary Figure 10A). The most frequent maternal haplogroup was D4, which accounted for 16.6%, followed by F1, A15, A11, M6, A10, Z, C4, B4, G2, M9, and M13; haplogroups D5, D6, and U were observed once, respectively. In addition, we identified five paternal haplogroups in 29 males (Supplementary Figure 10B). The most frequent paternal lineages in the studied Nagqu Tibetans were D1 (65.5%), one of the most dominant haplogroups in published Tibetans (Shi et al., 2008), followed by O2a, N1b, and R1b; haplotype J2 was observed only once. Overall, the great majority of paternal and maternal haplogroups in the studied Nagqu Tibetans were the founding lineages of northern East Asians. We observed that one individual belonged to the U1a1c1 mtDNA haplogroup, and two individuals belonged to West Eurasian-specific Y haplogroup R1b, which indicated the minor gene flows.
Identifying signals of positive selection on a genome-wide scale
Our analysis applied three metrics: haplotype-based iHS and XP-EHH, and the allele-frequency-based method FST. The “integrated haplotype score” (iHS) is useful for detecting the potential selection signals within populations but loses its power when the selected allele is at or near fixation (Voight et al., 2006). The complementary approach, “cross-population extended haplotype homogeneity” (XP-EHH), is particularly suitable for identifying SNPs that were under strong selection and at or near fixation in one population but still polymorphic in another (Sabeti et al., 2002). FST measured the between-population allele-frequency differences; the candidate regions under natural selection expectedly harbored continuous stretches of large FST scores. The merged HO dataset covered only 64,018 SNPs, which is inadequate for calculating the selection signals. Thus, our analysis is based on two datasets, that is, the newly genotyped dataset (450,031 SNPs for three studied Nagqu populations) and the HO dataset (597,573 SNPs for published present-day worldwide Eurasians). We first calculated the iHS scores for each SNP based on the phased newly genotyped data for the studied Nagqu Tibetans and scanned the candidate windows under positive selection. Then, we applied the same iHS approach to identify the target regions of selection in published Ü-Tsang, Amdo, Kham Tibetans, and Han Chinese populations in the HO dataset (Wang et al., 2021); for the FST and XP-EHH analysis, present-day Han Chinese, Amdo, and Kham Tibetans were used as the references, respectively, to explore the selection signals that were specific to the published Ü-Tsang Tibetans.
We identified obvious iHS-based candidate regions of the studied Nagqu Tibetans in chromosomes 2, 6, and 12 (Supplementary Table 10A). Chromosome 6 showed selection signals in human leukocyte antigen genes that were enriched in the immune response-related pathways; four candidate genes on Chromosome 2 (SULT1C2; SULT1C2P1; SULT1C3; and SULT1C4) involved in the metabolic process were also identified in other Asian populations (Fagny et al., 2014), and a gene named DLEU1 on Chromosome 13 encoded the long-non-coding RNA and involved in various biological processes, especially tumorigenesis (Li Y. et al., 2019).
The iHS analysis based on the HO dataset showed that the HLA region on Chromosome 6 was also under positive selection in published Ü-Tsang Tibetans, Kham Tibetans, Amdo Tibetans, Han Chinese, and French (Supplementary Tables 10B–D). The iHS analysis for published core Tibetans (Supplementary Table 10B) showed the selection signals for genes EPHB1 and DLG2: EPHB1 located on chromosome 3 encoded Ephrin type-B receptor 1 which participated in contact-dependent bidirectional signaling into neighboring cells; the over-expression of EPHB1 might promote the migration and invasion of lung cancer cells (Wang et al., 2020); DLG2 on chromosome 11 involved in the susceptibility of schizophrenia (Yoo et al., 2020).
Next, we focused on the Gene Ontology enrichment results of the genes falling within the candidate regions identified by XP-EHH analysis (Supplementary Table 10E). When published Amdo Tibetans were used as the reference population (Supplementary Figure 11A), the enrichment of genes was responsible for the monooxygenase activity (GO:0004497), oxidoreductase activity (GO:0016709; GO:0047555), and 3′5′-cyclic-GMP phosphodiesterase activity (GO:0016705) that were related to energy metabolism and may contribute to the adaptation of Ü-Tsang Tibetans to hypoxia conditions. When published Kham Tibetans were used as the reference population (Supplementary Figure 11B), we identified 11 enriched GO terms involved in the development of skin. When Han Chinese was used as the reference population, there were no enriched GO terms.
Previously reported high-altitude adaptation locus such as EPAS1, EGLN1, and HMOX2 genes (Peng et al., 2011) did not fit as the candidate genomic region for the involved Tibetans based on the iHS and XP-EHH analysis. Moreover, we observed that rs4953342, rs12613519, and rs6756667 in the EPAS1 gene exhibited significant iHS scores in published Ü-Tsang and Kham Tibetan populations but not in Amdo Tibetans and Han Chinese; we also detected that Ü-Tsang Tibetans showed the significant allele-frequency differentiation of these three SNP sites with Amdo Tibetans, Kham Tibetans, and Han Chinese (Supplementary Tables 10F–H).
FST statistics quantified the allele-frequency differences between published Ü-Tsang Tibetans and published Amdo and Kham Tibetans. We listed the top 1% significant regions identified via FST in Supplementary Table 10I. However, there were no GO terms enriched when published Amdo and Kham Tibetans were used as reference populations. The most significant region detected by the FST metric between published Ü-Tsang Tibetans and Amdo Tibetans encapsulated genes associated with skin development: CRNN; FLG; FLG-AS1; FLG2; HRNR (regional FST value = 0.132204). When published Kham Tibetans were used as reference populations, the most significant selection region that covered LIPE-AS1, CEACAM1, CIC, CNFN, CXCL17, ERF, LIPE, MEGF8, MIR8077, PAFAH1B3, PRR19, and TMEM145 genes on chromosome 19 (regional FST value = 0.211566) involved in various biological processes such as immune response, keratinization, antimicrobial activity, protooncogene develop, post-transcriptional regulation, and enzyme activity. When Han Chinese was used as reference populations, genes falling within the top 1% FST-based candidate regions were enriched in ethanol oxidation, ethanol metabolic process, and alcohol dehydrogenase [NAD(P)+] activity. We noticed that high-altitude adaptation locus including EPAS1, EGLN1, and HMOX2 genes (Peng et al., 2011) was detected as candidate regions for the published Ü-Tsang Tibetans when Han Chinese was used as the reference population. Interestingly, we identified that EPAS1 was selected as a candidate region via FST statistics for published Ü-Tsang Tibetans when published Amdo or Kham Tibetans were used as reference.
Discussion
For East Eurasia, recent ancient DNA studies have revealed that migrations, admixtures, or replacements played a pivotal role in the formation of spatiotemporal East Eurasian populations (Jeong et al., 2020; Ning et al., 2020; Yang et al., 2020; Kılınç et al., 2021; Wang et al., 2021; Zhang et al., 2021; Kumar et al., 2022). For Tibet Plateau, long-term genetic stability was observed for at least ∼3,400 years (Liu et al., 2022). However, the peopling history of TP is still in its fancy largely due to the lack of data for interdisciplinary studies, including well-excavated archeological sites, the ancient nuclear DNA extracted from human remains, and genome-wide SNP array data/deep-genome sequencing data of present-day TP highlanders. In this study, we reported genome-wide SNP data of 48 samples from three geographically close Nagqu Tibetan populations. Our analysis revealed the demographic history of Nagqu Tibetans based on both the patterns of allele sharing and haplotype sharing.
First, we uncovered the genetic substructure and admixture history of the studied Nagqu Tibetans. Our studied Nagqu Tibetan highlanders who resided in Ü-Tsang regions were genetically indistinguishable from ancient Nepalese and published Ü-Tsang Tibetans from Nagqu, Shigatse, and Lhasa supported via allele-sharing-based outgroup f3, f4, and qpWave analysis. Therefore, our studied Nagqu Tibetans could be classified as “core Tibetans” (He et al., 2021; Wang et al., 2021). The remarkable differences in the genetic makeup between the studied Nagqu Tibetans and lowland Neolithic Qijia culture millet farmer-related ancestry were attributed to the deeply diverged Southern East Eurasian-related ancestry and the Western Eurasian-related ancestry in Tibetans inferred via qpAdm, consistent with the alternative two-way admixture fitted model in which we used the present-day South Asians as one proximal source who harbored a great amount of Andamanese Hunter gatherer-related ancestry and Western Steppe Herder-related ancestry (de Barros Damgaard et al., 2018). Kham-speaking Chamdo Tibetans who lived in the Kham region harbored more Nagqu Tibetan-related ancestry than other published non-core Tibetans from the allele-sharing perspective, in agreement with that Chamdo Tibetans had the more extended sharing of IBD length with Nagqu Tibetans than other non-core Tibetans, suggested the more recent interactions between the Chamdo Tibetans and Nagqu Tibetans within the past few hundred years.
Second, we searched for the adaptation signatures of newly collected Nagqu Tibetans and published Ü-Tsang Tibetan highlanders using FST, iHS, and XP-EHH scores. Different methodologies utilized different patterns of genetic variation to identify the target regions of selection, thus producing quite different results when applied to the same genotyped data (Weir and Cockerham, 1984; Voight et al., 2006; Sabeti et al., 2007; Cadzow et al., 2014). Based on our iHS analysis, the only overlapping candidate regions between published geographically different Tibetans and our newly collected Nagqu Tibetans were the immunity-related genes HLA that were previously reported as candidate genes under natural selection in worldwide populations via the adaptively introgressed from archaic human to modern humans (Abi-Rached et al., 2011). However, our newly genotyped data consisted of only 60,000 overlapping SNPs with the published HO dataset. The vastly different SNP density between Human Origin-type and illumine-type SNP chips might cause the number of overlapping windows to be underestimated. In the XP-EHH and FST analysis, we detected the specific selection signal associated with highland altitude adaptation, skin development, and metabolism in published Ü-Tsang Tibetans compared with Amdo and Kham Tibetans, reflecting the differentiation in the evolutionary histories of geographically different samples caused by diverse selective evolutionary forces such as diet, climate, and pathogen, required confirmation from high-resolution research data of sampling. We note that in addition to natural selection, another possible reason for the observed signal is that Amdo and Kham Tibetans have, respectively, received more gene flow from West Eurasians and lowland East Asians including Han Chinese than the Ü-Tsang Tibetans.
In this study, we enrolled only four Nagqu Tibetan subgroups with limited overlapping SNP sites after the data merging. The complete landscape of genetic diversity in Tibetans required further investigation by increasing the number of Tibetan subgroups, the sample sizes, and the overlapping SNP sites. The whole-genome sequencing with systematic sampling in the future will shed more light on the finer-grained profile of Tibetan populations.
Data availability statement
The datasets presented in this study can be found in online repositories. The names of the repository/repositories and accession number(s) can be found below: https://zenodo.org/record/6500418, 10.5281/zenodo.6500418.
Ethics statement
The studies involving human participants were reviewed and approved by Ethics Committee of Xizang Minzu University. The patients/participants provided their written informed consent to participate in this study.
Author contributions
LK and C-CW designed and coordinated the study and revised the manuscript. SF, HZ, and YW collected the samples. LM, SF, JL, and ZZ carried out the experiments. RW, XY, and ZX performed the analyses. RW wrote the first draft of the manuscript. All authors reviewed and approved the final manuscript.
Funding
This research was supported by the National Natural Science Foundation of China (U20A20395 and 81860329), the Science and Technology Department Project of Tibet Autonomous Region (Nos. XZ201801-GB-03 and XZ2021JR0003G), the “Peak Scholars Program” of Xizang Minzu University, the Major Project of National Social Science Foundation of China granted to C-CW (21&ZD285), the “Double First-Class University Plan” key construction project of Xiamen University (the origin and evolution of East Asian populations and the spread of Chinese civilization, 0310/X2106027), the Nanqiang Outstanding Young Talents Program of Xiamen University (X2123302), the Major Project of National Social Science Foundation of China (2021MZD014), and the European Research Council (ERC) grant (ERC-2019-ADG-883700-TRAM).
Acknowledgments
We sincerely thank all volunteers who provided samples and the editors and reviewers for their contributions and suggestions. SF and ZX from the Information and Network Center of Xiamen University are acknowledged for their help with high-performance computing.
Conflict of interest
The authors declare that the research was conducted in the absence of any commercial or financial relationships that could be construed as a potential conflict of interest.
Publisher’s note
All claims expressed in this article are solely those of the authors and do not necessarily represent those of their affiliated organizations, or those of the publisher, the editors and the reviewers. Any product that may be evaluated in this article, or claim that may be made by its manufacturer, is not guaranteed or endorsed by the publisher.
Supplementary material
The Supplementary Material for this article can be found online at: https://www.frontiersin.org/articles/10.3389/fevo.2022.930840/full#supplementary-material
Supplementary Figure 1 | Kinship. (A) The visualization of the genetic relationship matrix (GRM). “+” denoted that the corresponding pair of individuals were in the kinship up to the third degree. (B) The GRM based on the data that removed the putative kinship.
Supplementary Figure 2 | Phylogenetic relationship between the studied Nagqu Tibetans and present-day reference East Asians. (A) Neighbor Joining (NJ) tree based on pairwise FST genetic distance; (B) the pairwise coincidence matrix constructed via the haplotype sharing-based fineSTURCTURE.
Supplementary Figure 3 | Applying f-statistics to quantitatively measure the genetic relationships between our targeted Nagqu Tibetans and present-day reference East Eurasians based on the merged Human Origin dataset (64,018 SNPs). (A) The outgroup-f3 statistics measured the shared genetic drift between the studied Nagqu Tibetans and present-day reference East Eurasians in the form of f3 (studied Nagqu Tibetan, HO modern populations; Yoruba). The larger outgroup f3 indicated the more sharing genetic drift between the studied Nagqu Tibetans and reference HO populations. (B) Heatmap of Z-scores in f4 (Yoruba, studied Nagqu Tibetans; HO modern pop1, HO modern pop2). Statistically positive f4 values (Z > 3) suggested the higher affinity of HO modern pop2 than HO modern pop1 to the studied Nagqu Tibetans, while negative f4 values (Z < −3) suggested a closer relationship of HO modern pop1 than HO modern pop2 to the studied Nagqu Tibetans. −3 < Z < 3 suggested that the studied Nagqu Tibetans shared as many alleles with HO modern pop1 as with HO modern pop2.
Supplementary Figure 4 | Applying f-statistics to quantitatively measure the genetic relationships between our targeted Nagqu Tibetans and ancient reference populations based on the merged 1240K dataset (172,393 SNPs). (A) The outgroup-f3 statistics measured the sharing genetic drift between the studied Nagqu Tibetans and ancient reference populations in the form of f3 (studied Nagqu Tibetan, 1240K ancients; Yoruba). The larger outgroup f3 indicated the more shared genetic drift between the studied Nagqu Tibetans and reference populations. (B) Heatmap of Z-scores in f4 (Yoruba, studied Nagqu Tibetans; 1240K ancient pop1, 1240K ancient pop2). Statistically positive f4 values (Z > 3) suggested the higher affinity of 1240K ancient pop2 than 1240K ancient pop1 to the studied Nagqu Tibetans, while the negative f4 values (Z < −3) suggested a closer relationship of 1240K ancient pop1 than 1240K ancient pop2 to the studied Nagqu Tibetans. −3 < Z < 3 suggested that the studied Nagqu Tibetans shared as many alleles with 1240K ancient pop1 as with 1240K ancient pop2.
Supplementary Figure 5 | ADMIXTURE cross-validation (CV) for K = 2–12 with 5-fold. K = 6 showed the lowest CV error.
Supplementary Figure 6 | Model−based ADMIXTURE results (K = 2–12) based on the LD-pruned dataset (50,194 SNPs).
Supplementary Figure 7 | Inferring the prominent ancestry of the studied Nagqu Tibetans via f4 (Yoruba, HO ancient Eurasians; studied Nagqu Tibetans, HO modern East Asians) based on the merged Human Origin dataset (64,018 SNPs). We expectedly observed numerous significant negative f4 values (Z < −3) for most reference modern East Asians if the studied Nagqu Tibetans harbored great amounts of reference ancient Eurasian-related ancestry.
Supplementary Figure 8 | Inferring the admixture history of the studied Nagqu Tibetans via (A) f4 (Yoruba, HO modern Eurasians; studied Nagqu Tibetans, assumed ancestor) based on the merged Human Origin dataset (64,018 SNPs) and (B) f4 (Yoruba, 1240K ancient Eurasians; studied Nagqu Tibetans, assumed ancient ancestors) based on the merged 1240K dataset (172,393 SNPs).
Supplementary Figure 9 | Inferring admixture history of the studied Nagqu Tibetans via pairwise f4-statistics in the form of f4 (Yoruba, HO present-day and ancient Eurasians; Kham speaking studied Nagqu Tibetans; published Ü-Tsang Tibetans/Amdo Tibetans/Kham Tibetans) based on the merged HO dataset (64,018 SNPs).
Supplementary Figure 10 | Distribution of Mitochondrial and Y chromosomal haplogroups of studied Nagqu Tibetans. We obtained (A) maternal and (B) paternal haplogroups for 48 individuals and 29 males respectively. The number of samples assigned to a specific haplogroup is denoted as N. For each Mitochondrial haplogroup, we reported “N” and the corresponding proportion (i.e., N/48) in the form of “haplogroup (N, N/48).” For each Y chromosomal haplogroup, we reported “N” and the corresponding proportion (i.e., N/29) in the form of “haplogroup (N, N/29).”
Supplementary Figure 11 | Gene enrichment analysis for candidate genes identified via XP-EHH analysis in the studied Nagqu Tibetans when using (A) published Amdo Tibetans (i.e., Gangcha Tibetans, Xunhua Tibetans, and Gannan Tibetans) and (B) published Kham Tibetans (i.e., Chamdo Tibetans, Xinlong Tibetans, Yajiang Tibetans, and Yunnan Tibetans) as the reference population (Wang et al., 2021). GO terms were represented by circles and were plotted according to the gene ratio on the X-axis. The size was proportional to the count of the GO terms. The color of the circle defined the adjusted p-value.
Abbreviations
TP, Tibetan Plateau; SNP, single-nucleotide polymorphism; HO, Human Origin; N, Neolithic; EN, Early Neolithic; MN, Middle Neolithic; LN, Late Neolithic; BA, Bronze Age; IA, Iron Age; H, Historical; SEA, Southeast Asian; EA, East Asian; WE, Western Eurasian; SA, South Asian; ST, Sino-Tibetan; TB, Tibeto-Burman; TK, Tai-Kadai; AN, Austronesian; AA, Austroasiatic; HM, Hmong-Mien; YR, Yellow River; HG, hunter-gatherer; Ne, effective population size; ka, thousand years ago.
Footnotes
- ^ https://reich.hms.harvard.edu/allen-ancient-dna-resource-aadr-downloadable-genotypes-present-day-and-ancient-dna-data
- ^ www.hapmap.org
- ^ http://www.ncbi.nlm.nih.gov/gene/
References
1000 Genomes Project Consortium, Auton, A., Brooks, L. D., Durbin, R. M., Garrison, E. P., Kang, H. M., et al. (2015). A global reference for human genetic variation. Nature 526, 68–74. doi: 10.1038/nature15393
Abi-Rached, L., Jobin, M. J., Kulkarni, S., McWhinnie, A., Dalva, K., Gragert, L., et al. (2011). The shaping of modern human immune systems by multiregional admixture with archaic humans. Science 334, 89–94. doi: 10.1126/science.1209202
Alexander, D. H., Novembre, J., and Lange, K. (2009). Fast model-based estimation of ancestry in unrelated individuals. Genome Res. 19, 1655–1664. doi: 10.1101/gr.094052.109
Beall, C. M. (2014). Adaptation to high altitude: Phenotypes and genotypes. Annu. Rev. Anthropol. 43, 251–272. doi: 10.1146/annurev-anthro-102313-030000
Beall, C. M., Cavalleri, G. L., Deng, L., Elston, R. C., Gao, Y., Knight, J., et al. (2010). Natural selection on EPAS1 (HIF2) associated with low hemoglobin concentration in Tibetan highlanders. Proc. Natl. Acad. Sci. U.S.A. 107, 11459–11464. doi: 10.1073/pnas.1002443107
Browning, B. L., and Browning, S. R. (2013). Improving the accuracy and efficiency of identity-by-descent detection in population data. Genetics 194, 459–471.
Browning, S. R., and Browning, B. L. (2007). Rapid and accurate haplotype phasing and missing-data inference for whole-genome association studies by use of localized haplotype clustering. Am. J. Hum. Genet. 81, 1084–1097. doi: 10.1086/521987
Browning, S. R., and Browning, B. L. (2015). Accurate non-parametric estimation of recent effective population size from segments of identity by descent. Am. J. Hum. Genet. 97, 404–418. doi: 10.1016/j.ajhg.2015.07.012
Browning, S. R., Browning, B. L., Daviglus, M. L., Durazo-Arvizu, R. A., Schneiderman, N., Kaplan, R. C., et al. (2018). Ancestry-specific recent effective population size in the Americas. PLoS Genet. 14:e1007385. doi: 10.1371/journal.pgen.1007385
Cadzow, M., Boocock, J., Nguyen, H. T., Wilcox, P., Merriman, T. R., and Black, M. A. (2014). A bioinformatics workflow for detecting signatures of selection in genomic data. Front. Genet. 5:293. doi: 10.3389/fgene.2014.00293
Chang, C. C., Chow, C. C., Tellier, L. C., Vattikuti, S., Purcell, S. M., and Lee, J. J. (2015). Second-generation PLINK: Rising to the challenge of larger and richer datasets. Gigascience 4:7. doi: 10.1186/s13742-015-0047-8
Chen, F. H., Dong, G. H., Zhang, D. J., Liu, X. Y., Jia, X., An, C. B., et al. (2015). Agriculture facilitated permanent human occupation of the Tibetan Plateau after 3600 B.P. Science 347, 248–250. doi: 10.1126/science.1259172
Chen, F., Welker, F., Shen, C.-C., Bailey, S. E., Bergmann, I., Davis, S., et al. (2019). A late middle pleistocene denisovan mandible from the Tibetan Plateau. Nature 569, 409–412. doi: 10.1038/s41586-019-1139-x
Danecek, P., Auton, A., Abecasis, G., Albers, C. A., Banks, E., DePristo, M. A., et al. (2011). The variant call format and VCFtools. Bioinformatics 27, 2156–2158. doi: 10.1093/bioinformatics/btr330
de Barros Damgaard, P., Martiniano, R., Kamm, J., Moreno-Mayar, J. V., Kroonen, G., Peyrot, M., et al. (2018). The first horse herders and the impact of early Bronze Age steppe expansions into Asia. Science 360:eaar7711. doi: 10.1126/science.aar7711
Delaneau, O., Marchini, J., and Zagury, J.-F. (2012). a linear complexity phasing method for thousands of genomes. Nat. Methods 9, 179–181. doi: 10.1038/nmeth.1785
Deng, L., Zhang, C., Yuan, K., Gao, Y., Pan, Y., Ge, X., et al. (2019). Prioritizing natural-selection signals from the deep-sequencing genomic data suggests multi-variant adaptation in Tibetan highlanders. Nat. Sci. Rev. 6, 1201–1222. doi: 10.1093/nsr/nwz108
Fagny, M., Patin, E., Enard, D., Barreiro, L. B., Quintana-Murci, L., and Laval, G. (2014). Exploring the occurrence of classic selective sweeps in humans using whole-genome sequencing data sets. Mol. Biol. Evol. 31, 1850–1868. doi: 10.1093/molbev/msu118
Gautier, M., Klassmann, A., and Vitalis, R. (2017). REHH 2.0: A reimplementation of the R package REHH to detect positive selection from haplotype structure. Mol. Ecol. Resour. 17, 78–90. doi: 10.1111/1755-0998.12634
Hackinger, S., Kraaijenbrink, T., Xue, Y., Mezzavilla, M., Asan, van Driem, G., et al. (2016). Wide distribution and altitude correlation of an archaic high-altitude-adaptive EPAS1 haplotype in the Himalayas. Hum. Genet. 135, 393–402. doi: 10.1007/s00439-016-1641-2
He, G., Wang, M., Zou, X., Chen, P., Wang, Z., Liu, Y., et al. (2021). Peopling history of the Tibetan Plateau and multiple waves of admixture of tibetans inferred from both ancient and modern genome-wide data. Front. Genet. 12:725243. doi: 10.3389/fgene.2021.725243
He, G., Wang, Z., Su, Y., Zou, X., Wang, M., Chen, X., et al. (2019). Genetic structure and forensic characteristics of tibeto-burman-speaking Ü-tsang and kham Tibetan highlanders revealed by 27 Y-chromosomal STRs. Sci. Rep. 9:7739. doi: 10.1038/s41598-019-44230-2
Lawson, D. J., Hellenthal, G, Myers, S., and Falush, D. (2012). Inference of population structure using dense haplotype data. PLoS Genet 8, e1002453. doi: 10.1371/journal.pgen.1002453
Huerta-Sánchez, E., Jin, X., Asan, Bianba, Z., Peter, B. M., Vinckenbosch, N., et al. (2014). Altitude adaptation in Tibetans caused by introgression of denisovan-like DNA. Nature 512, 194–197. doi: 10.1038/nature13408
Jeong, C., Ozga, A. T., Witonsky, D. B., Malmström, H., Edlund, H., Hofman, C. A., et al. (2016). Long-term genetic stability and a high-altitude East Asian origin for the peoples of the high valleys of the Himalayan arc. Proc. Natl. Acad. Sci. U.S.A. 113, 7485–7490. doi: 10.1073/pnas.1520844113
Jeong, C., Wang, K., Wilkin, S., Taylor, W. T. T., Miller, B. K., Bemmann, J. H., et al. (2020). A dynamic 6,000-year genetic history of Eurasia’s eastern steppe. Cell 183, 890–904.e29.
Kılınç, G. M., Kashuba, N., Koptekin, D., Bergfeldt, N., Dönertaş, H. M., Rodríguez-Varela, R., et al. (2021). Human population dynamics and Yersinia pestis in ancient northeast Asia. Sci. Adv. 7:eabc4587. doi: 10.1126/sciadv.abc4587.Lawson
Kumar, S., Nei, M., Dudley, J., and Tamura, K. (2008). MEGA: A biologist-centric software for evolutionary analysis of DNA and protein sequences. Brief Bioinform. 9, 299–306. doi: 10.1093/bib/bbn017
Kumar, V., Wang, W., Zhang, J., Wang, Y., Ruan, Q., Yu, J., et al. (2022). Bronze and Iron Age population movements underlie Xinjiang population history. Science 376, 62–69. doi: 10.1126/science.abk1534
Li, Y., Shi, B., Dong, F., Zhu, X., Liu, B., and Liu, Y. (2019). Long non-coding RNA DLEU1 promotes cell proliferation, invasion, and confers cisplatin resistance in bladder cancer by regulating the miR-99b/HS3ST3B1 Axis. Front. Genet. 10:280. doi: 10.3389/fgene.2019.00280
Li, Y.-C., Tian, J.-Y., Liu, F.-W., Yang, B.-Y., Gu, K.-S.-Y., Rahman, Z. U., et al. (2019). Neolithic millet farmers contributed to the permanent settlement of the Tibetan Plateau by adopting barley agriculture. Nat. Sci. Rev. 6, 1005–1013. doi: 10.1093/nsr/nwz080
Liu, C.-C., Witonsky, D., Gosling, A., Lee, J. H., Ringbauer, H., Hagan, R., et al. (2022). Ancient genomes from the Himalayas illuminate the genetic history of Tibetans and their Tibeto-Burman speaking neighbors. Nat. Commun. 13, 1203. doi: 10.1038/s41467-022-28827-2
Liu, Y., Wang, M., Chen, P., Wang, Z., Liu, J., Yao, L., et al. (2021). Combined low-/high-density modern and ancient genome-wide data document genomic admixture history of high-altitude East Asians. Front. Genet. 12:582357. doi: 10.3389/fgene.2021.582357
Loh, P.-R., Lipson, M., Patterson, N., Moorjani, P., Pickrell, J. K., Reich, D., et al. (2013). Inferring admixture histories of human populations using linkage disequilibrium. Genetics 193, 1233–1254. doi: 10.1534/genetics.112.147330
Lu, D., Lou, H., Yuan, K., Wang, X., Wang, Y., Zhang, C., et al. (2016). Ancestral origins and genetic history of Tibetan highlanders. Am. J. Hum. Genet. 99, 580–594. doi: 10.1016/j.ajhg.2016.07.002
Ning, C., Li, T., Wang, K., Zhang, F., Li, T., Wu, X., et al. (2020). Ancient genomes from northern China suggest links between subsistence changes and human migration. Nat. Commun. 11:2700. doi: 10.1038/s41467-020-16557-2
Patterson, N., Moorjani, P., Luo, Y., Mallick, S., Rohland, N., Zhan, Y., et al. (2012). Ancient admixture in human history. Genetics 192, 1065–1093.
Peng, Y., Yang, Z., Zhang, H., Cui, C., Qi, X., Luo, X., et al. (2011). Genetic variations in Tibetan populations and high-altitude adaptation at the himalayas. Mol. Biol. Evol. 28, 1075–1081. doi: 10.1093/molbev/msq290
Pickrell, J. K., Coop, G., Novembre, J., Kudaravalli, S., Li, J. Z., Absher, D., et al. (2009). Signals of recent positive selection in a worldwide sample of human populations. Genome Res. 19, 826–837. doi: 10.1101/gr.087577.108
Qi, X., Cui, C., Peng, Y., Zhang, X., Yang, Z., Zhong, H., et al. (2013). Genetic evidence of paleolithic colonization and neolithic expansion of modern humans on the Tibetan Plateau. Mol. Biol. Evol. 30, 1761–1778. doi: 10.1093/molbev/mst093
Sabeti, P. C., Reich, D. E., Higgins, J. M., Levine, H. Z. P., Richter, D. J., Schaffner, S. F., et al. (2002). Detecting recent positive selection in the human genome from haplotype structure. Nature 419, 832–837. doi: 10.1038/nature01140
Sabeti, P. C., Varilly, P., Fry, B., Lohmueller, J., Hostetter, E., et al. (2007). Genome-wide detection and characterization of positive selection in human populations. Nature 449, 913–918. doi: 10.1038/nature06250
Shi, H., Zhong, H., Peng, Y., Dong, Y.-L., Qi, X.-B., Zhang, F., et al. (2008). Y chromosome evidence of earliest modern human settlement in East Asia and multiple origins of Tibetan and Japanese populations. BMC Biol. 6:45. doi: 10.1186/1741-7007-6-45
Simonson, T. S., McClain, D. A., Jorde, L. B., and Prchal, J. T. (2012). Genetic determinants of Tibetan high-altitude adaptation. Hum. Genet. 131, 527–533. doi: 10.1007/s00439-011-1109-3
Simonson, T. S., Yang, Y., Huff, C. D., Yun, H., Qin, G., Witherspoon, D. J., et al. (2010). Genetic evidence for high-altitude adaptation in tibet. Science 329:5.
Voight, B. F., Kudaravalli, S., Wen, X., and Pritchard, J. K. (2006). A map of recent positive selection in the human genome. PLoS Biol. 4:e72. doi: 10.1371/journal.pbio.0040072
Wang, C.-C., Yeh, H.-Y., Popov, A. N., Zhang, H.-Q., Matsumura, H., Sirak, K., et al. (2021). Genomic insights into the formation of human populations in East Asia. Nature 591, 413–419. doi: 10.1038/s41586-021-03336-2
Wang, L., Peng, Q., Sai, B., Zheng, L., Xu, J., Yin, N., et al. (2020). Ligand-independent EphB1 signaling mediates TGF-β-activated CDH2 and promotes lung cancer cell invasion and migration. J. Cancer 11, 4123–4131. doi: 10.7150/jca.44576
Wang, M., Du, W., Tang, R., Liu, Y., Zou, X., Yuan, D., et al. (2022). Genomic history and forensic characteristics of Sherpa highlanders on the Tibetan Plateau inferred from high-resolution InDel panel and genome-wide SNPs. Forensic Sci. Int. 56:102633. doi: 10.1016/j.fsigen.2021.102633
Weir, B. S., and Cockerham, C. C. (1984). Estimating F-statistics for the analysis of population structure. Evolution 38, 1358–1370. doi: 10.1111/j.1558-5646.1984.tb05657.x
Wu, T., Hu, E., Xu, S., Chen, M., Guo, P., Dai, Z., et al. (2021). clusterProfiler 4.0: A universal enrichment tool for interpreting omics data. Innovation (Camb) 2:100141. doi: 10.1016/j.xinn.2021.100141
Xiang, K., Ouzhuluobu, Peng, Y., Yang, Z., Zhang, X., Cui, C., et al. (2013). Identification of a Tibetan-specific mutation in the hypoxic gene EGLN1 and its contribution to high-altitude adaptation. Mol. Biol. Evol. 30, 1889–1898. doi: 10.1093/molbev/mst090
Xu, S., Li, S., Yang, Y., Tan, J., Lou, H., Jin, W., et al. (2011). A genome-wide search for signals of high-altitude adaptation in Tibetans. Mol. Biol. Evol. 28, 1003–1011. doi: 10.1093/molbev/msq277
Yang, J., Jin, Z. B., Chen, J., Huang, X. F., Li, X. M., Liang, Y. B., et al. (2017). Genetic signatures of high-altitude adaptation in Tibetans. Proc. Natl. Acad. Sci. U.S.A. 114, 4189–4194.
Yang, J., Lee, S. H., Goddard, M. E., and Visscher, P. M. (2011). GCTA: A tool for genome-wide complex trait analysis. Am. J. Hum. Genet. 88, 76–82.
Yang, M. A., Fan, X., Sun, B., Chen, C., Lang, J., Ko, Y.-C., et al. (2020). Ancient DNA indicates human population shifts and admixture in northern and southern China. Science 369, 282–288. doi: 10.1126/science.aba0909
Yao, H.-B., Tang, S., Yao, X., Yeh, H.-Y., Zhang, W., Xie, Z., et al. (2017). The genetic admixture in Tibetan-Yi Corridor. Am. J. Phys. Anthropol. 164, 522–532. doi: 10.1002/ajpa.23291
Yoo, T., Kim, S.-G., Yang, S. H., Kim, H., Kim, E., and Kim, S. Y. (2020). A DLG2 deficiency in mice leads to reduced sociability and increased repetitive behavior accompanied by aberrant synaptic transmission in the dorsal striatum. Mol. Autism 11:19. doi: 10.1186/s13229-020-00324-7
Zhang, C., Lu, Y., Feng, Q., Wang, X., Lou, H., Liu, J., et al. (2017). Differentiated demographic histories and local adaptations between Sherpas and Tibetans. Genome Biol. 18:115. doi: 10.1186/s13059-017-1242-y
Zhang, D., Xia, H., Chen, F., Li, B., Slon, V., Cheng, T., et al. (2020). Denisovan DNA in late pleistocene sediments from baishiya karst cave on the Tibetan Plateau. Science 370, 584–587. doi: 10.1126/science.abb6320
Zhang, F., Ning, C., Scott, A., Fu, Q., Bjørn, R., Li, W., et al. (2021). The genomic origins of the bronze age tarim basin mummies. Nature 599, 256–261. doi: 10.1038/s41586-021-04052-7
Zhang, M., Yan, S., Pan, W., and Jin, L. (2019). Phylogenetic evidence for Sino-Tibetan origin in northern China in the Late Neolithic. Nature 569, 112–115. doi: 10.1038/s41586-019-1153-z
Keywords: Tibetan, population substructure, demographic history, genetic admixture, positive selection signals
Citation: Ma L, Wang R, Feng S, Yang X, Li J, Zhang Z, Zhan H, Wang Y, Xia Z, Wang C-C and Kang L (2022) Genomic insight into the population history and biological adaptations of high-altitude Tibetan highlanders in Nagqu. Front. Ecol. Evol. 10:930840. doi: 10.3389/fevo.2022.930840
Received: 28 April 2022; Accepted: 25 July 2022;
Published: 17 August 2022.
Edited by:
Cemal Gurkan, Turkish Cypriot DNA Laboratory (TCDL), CyprusReviewed by:
Dmitrii Gavrilievich Tikhonov, North-Eastern Federal University, RussiaOzlem Bulbul, Istanbul University-Cerrahpasa, Turkey
Chao Zhang, University of Pennsylvania, United States
Copyright © 2022 Ma, Wang, Feng, Yang, Li, Zhang, Zhan, Wang, Xia, Wang and Kang. This is an open-access article distributed under the terms of the Creative Commons Attribution License (CC BY). The use, distribution or reproduction in other forums is permitted, provided the original author(s) and the copyright owner(s) are credited and that the original publication in this journal is cited, in accordance with accepted academic practice. No use, distribution or reproduction is permitted which does not comply with these terms.
*Correspondence: Longli Kang, longli_kang@163.com; Chuan-Chao Wang, wang@xmu.edu.cn
†These authors have contributed equally to this work