Relative Importance of Ecological, Evolutionary and Anthropogenic Pressures on Extinction Risk in Chinese Angiosperm Genera
 Haibin Yu
 Xinghua Sui
 Miao Sun
 Xue Yin4
 - 1School of Life Sciences, Guangzhou University, Guangzhou, China
- 2School of Pharmaceutical Sciences (Shenzhen), Sun Yat-sen University, Shenzhen, China
- 3College of Horticulture and Forestry Sciences, Huazhong Agricultural University, Wuhan, China
- 4State Key Laboratory of Biocontrol and School of Life Sciences, Sun Yat-sen University, Guangzhou, China
- 5School of Agriculture, Biomedicine and Environment, La Trobe University, Bundoora, VIC, Australia
China has many threatened plant species, which are exposed to environmental degradation and other anthropogenic pressures. We assessed support for potential extinction pathways in Chinese angiosperm genera and quantified possible threats to phylogenetic diversity. We compiled a database and phylogeny for 27,409 Chinese angiosperm species in 2,453 genera. For each genus, we used the International Union for Conservation of Nature (IUCN) Red List classifications to quantify extinction risk and calculated predictors corresponding to their ecological, evolutionary characteristics and exposure to human pressures. We first tested for phylogenetic clustering in extinction risk among genera and then tested support for direct and indirect causal pathways involving our predictors using piecewise structural equation models. Finally, we quantified the potential loss of phylogenetic diversity under different extinction scenarios. We found that extinction risk is non-randomly distributed among Chinese angiosperm genera, with the proportion of threatened species higher in range-limited and species-rich taxa. Habitat loss had a significant positive effect on threatened species richness. Phylogenetic diversity loss under scenarios: the decreasing habitat loss and relative extinction rate were high. Thus, genera would suffer from high extinction risk, if species in these genera occupy similar niches and overlapping ranges. While diversification or speciation via niche divergence might increase range-limited species vulnerable to stochastic extinction, this could reduce extinction risk of the whole clade by expanding its range and climatic niche tolerance. Endemic genera with higher extinction rates, less climatic niche divergence, and lower range segregation are especially vulnerable to anthropogenic disturbances.
Introduction
Biodiversity loss is among the most serious threats of global change, but the risk of extinction is non-randomly distributed across the tree of life (Vamosi and Wilson, 2008; Vamosi et al., 2018; Davies, 2019). Identifying those species most at risk could, therefore, help to inform effective interventions, helping to ameliorate the worst impacts. Two common methods for quantifying risk of extinction are: (i) to predict changes to available habitat area and use any resulting change in potential range size as a proxy for risk (Purvis et al., 2000b) or (ii) to use a functional approach, where the relative risk among species is determined via their characteristic traits (Chichorro et al., 2019). However, both the geographical ranges and functional traits retain some imprint of evolutionary history. A more nuanced view of extinction risk emerges when both the ecological and evolutionary aspects of the target taxa are considered, including resulting changes in phylogenetic diversity (PD) (Gumbs et al., 2020). If our goal is to conserve evolutionary potential, large clades with many threatened species are particularly important, since these clades may be where most speciation is occurring. On the other hand, environmental change could have a disproportionate effect on some closely related species or clades because clade-specific characteristics associated with elevated rates of speciation may also promote extinction, if these characteristics are conserved through time (sensu phylogenetic niche conservatism) (Hadly et al., 2009). Moreover, human development pressure tends not to be randomly distributed, adding a third source of uncertainty (Di Marco et al., 2018). Here, we consider ecological, evolutionary, and anthropogenic predictors to predict extinction risk among Chinese angiosperms.
Methods to predict extinction risk as a function of changes to geographical range size invoke the concept of niche (sensu Hutchinson, see Holt, 2009), where the potential range in climatic conditions within which a species can persist (its climatic niche) is based on its current or historical geographical range. This climatic niche can then be used to maps the performance and endurance of species and clades onto environmental space under future climate projections. Under this approach, species with high vulnerability to extinction are those that have narrow climatic niches (Foden et al., 2009), lack potential for range expansion (Zhu et al., 2012), or are unable to evolve their climatic tolerances (Holt, 1990). Geographic range size is consistently the most useful predictor of both the historical and contemporary extinction risk (IUCN Species Survival Commission, 2001; Gaston and Fuller, 2009; Humphreys et al., 2019). However, this is not universal, as geographically restricted species that are more specialized and better adapted locally can have high local abundances (Lesica et al., 2006), while species with wider niche (and geographical) range may suffer from gene flow across suboptimal environments resulting in low abundance (Williams et al., 2009). Moreover, climate is more often found to have indirect influences on extinction risk, through its influence on other ecological and evolutionary processes, such as geographic range shifts, biotic interactions, and lineage diversification (Davies et al., 2011; Cahill et al., 2013).
Functional approaches to quantify extinction risk instead seek to identify specific traits that predispose species to persist or become extinct for a given environmental change. For example, prior review of the fossil records has identified numerous reproductive, physiological, and behavioral traits that enable small plant populations to persist and speciate in the face of extreme environmental changes during the Cretaceous–Paleogene extinction event (McElwain and Punyasena, 2007; Rieseberg and Willis, 2007). Several recent studies have also found significant correlations between biological and functional traits and extinction risk in studied groups of plants (Nic Lughadha et al., 2017, 2020; Chichorro et al., 2019; Humphreys et al., 2019). However, biological traits alone do not adequately explain the observed variation in contemporary extinction risk (Fréville et al., 2007; Leao et al., 2014). For example, plant functional traits associated with elevated extinction risk in continental and global-scale studies (Sakai et al., 2002; Vamosi and Vamosi, 2005) are often found to be non-significant or even show opposite trends in other regions or clades (Sjöström and Gross, 2006).
While most assessments have focused on extinction risk at species level within a specific taxonomic grouping (Powers and Jetz, 2019), studies on extinction risk at higher taxonomic levels (e.g., for genera) are required to bring evolutionary and ecological insights to conservation practice. From the climatic niche viewpoint, if we define the niche of a clade as the climate conditions across all the localities for all the congeners in that clade (Gómez-Rodríguez et al., 2014), then clades in which climatic tolerances can evolve rapidly may diversify by expanding their ranges into different environments. At the level of the clade, this could buffer them from extinction by reducing niche overlap (Holt, 1990; Kozak and Wiens, 2010). This might well explain why rapidly diversifying clades can contain more threatened plant species, but still be relatively species rich (Lozano and Schwartz, 2005; Davies et al., 2011).
Clearly, different human pressures interact with different ecological and evolutionary factors to promote extinction in the Anthropocene (Steffen et al., 2011; Di Marco et al., 2018). Even if elevated speciation rates of more specialized clades can, to a certain extent, buffer them from being lost to extinction (Heard and Mooers, 2000), pressure from human encroachment throughout their range could still make them vulnerable (Di Virgilio et al., 2017). If extinction operates disproportionately upon lineages that represent survivors of once more diverse clades, the loss of a few species might have large effects on future phylodiversity. By contrast, if extinction risk was clustered on more recently derived lineages of species, we may risk losing entire clades from some regions due to spatially structured anthropogenic pressures such as habitat transformation, pollution, and climate change. Placing studies evaluating extinction risk are critical to improve our understanding of the potential consequences of biodiversity loss and to avoid worst-case loss of natural heritage (Verde Arregoitia et al., 2015; Bohm et al., 2016).
Flowering plants (i.e., angiosperms) dominate modern terrestrial ecosystems and play essential roles in ecosystem services provision. Although, only around 5% of all the plants have been received global conservation assessments (Knapp, 2011), it has been estimated more than 20% of species would fall within the International Union for Conservation of Nature (IUCN) Red List “threatened” categories (Brummitt et al., 2015). Climate change over the past 30 years has produced significant changes in species’ phenologies, range margins, and abundances (Pimm et al., 2014). However, the paucity of conservation assessments for plant species limits our understanding of the most critical extinction risks required to improve conservation practice.
Here, we combing recent evaluation of the conservation status of Chinese higher plants with a comprehensive molecular phylogeny (Lu et al., 2018) to conduct a regional study of angiosperm extinction risk at the level of genera. China is home to around 35,000 vascular plant species and many are threatened by serious environmental degradation. Previous studies have identified geographical biodiversity hotspots for Chinese plant species (Sui et al., 2018), but their exposure to different predictors of extinction risk is largely unknown, especially in a phylogenetic context. Our aim here is to identify ecological, evolutionary, and anthropogenic drivers of the observed extinction risk distribution patterns among Chinese angiosperm genera.
Materials and Methods
Overview of Approach
We first tested whether the evolutionary relatedness of angiosperm genera in China was correlated with their extinction risk by analyzing whether the proportion of threatened species in each genus differed from expectation. We then developed a causal path model linking present-day extinction risk among genera to hypothesized direct and indirect effects of ecological, evolutionary, and anthropogenic factors. We used piecewise structural equation modeling (SEM) to quantify support for the hypothesized path model, allowing us to control for phylogenetic relatedness. We tested the path model for all the genera and for those genera endemic to China. Finally, we assessed the potential loss of PD under different extinction scenarios to predict the consequences of future biodiversity loss with different conservation prioritizations.
Steps in the analysis are described below.
Species Data and Phylogeny
The most recent IUCN Red List of Chinese Plants (2013)1 evaluated extinction risk for 29,530 (13,446 endemic) angiosperm species and infraspecific taxa in 2,793 genera and 249 families. Following the criteria of the IUCN (IUCN Species Survival Commission, 2001), species were assigned to one of seven conservation categories: least concern (LC), near-threatened (NT), vulnerable (VU), endangered (EN), critically endangered (CR), extinct in the wild (EW), and extinct (EX). For our purposes, species falling in the categories of CR, EN, or VU were classified as threatened. We validated records in the Red List of Chinese Plants correcting synonyms and removing introduced and cultivated species using the latest version of Flora of China (Wu et al., 1994–2013) and an online taxonomic name validation application.2
We collected the distribution data for Chinese plant species. We first compiled a county-level distribution dataset by combining 925,195 county-level distribution records in the Chinese Vascular Plant Distribution Database (CVPDD) and 9,166,930 specimen records retrieved from the National Specimen Information Infrastructure (NSII) (accessed on September 2017).3 As the CVPDD database was compiled from the Flora Reipublicae Popularis Sinicae (FRPS), provincial and regional floras in China, we further validated and corrected the distributional information obtained from the CVPDD using 1,903,030 NSII records with valid county-level observation since the 1980s to allow for possible extinction risk considering the intensified human activities in recent decades. The final dataset consisted of 27,409 species in 2,453 genera (158 angiosperm genera endemic to China; Wu et al., 2007) of 257 families.
A mega-dated phylogeny was obtained from Lu et al. (2018), including 2,909 angiosperm genera in 257 families as recorded in Flora of China (FOC). Since (1) several genera were not monophyletic in the original tree, we pruned the younger clades of those genera, retaining the older clade to represent the corresponding genus and (2) the Red List of Chinese Plants (2013) adopted a mixed classification system based on the FOC and FRPS, we pruned the phylogeny to retain only the 2,453 genera common to both the databases (provided in Supplementary Appendix 1) to facilitate downstream analyses.
Evolutionary Predictors of Extinction Risk
For each of the 2,453 genera in the pruned phylogeny, we calculated three evolutionary predictors of extinction risk. We extracted genus age (stem-group age) from the phylogeny and calculated net diversification rate (DivRate) (i.e., speciation rate minus the rate of extinction) and relative extinction rate (ExtRate) (i.e., the ratio of extinction rate to speciation rate) (Supplementary Appendix 2), using an improved version of Modeling Evolutionary Diversification Using Stepwise AIC (turboMEDUSA4; Alfaro et al., 2009; Pennell et al., 2014), incorporating species richness into each genus based on FOC (Supplementary Figure 1).
Ecological Predictors of Extinction Risk
As predictors of ecological risk, we calculated four predictors related to the current distribution of the genus and three predictors associated with the climatic niche. For each genus, its range size (range) was estimated by merging all the species in the genus to form a single genus distribution map (Hadly et al., 2009). Range position was represented by latitudinal range position (RngLat) and longitudinal range position (RngLon) midpoint of the genus distribution map. As an index of range segregation (RngSeg), we used the residuals from a linear regression of genus range size on the mean range size of all the species in the genus.
Climatic Niches
Environmental variables including contemporary bioclimatic variables were extracted from the WorldClim Database (grid size: 30 s, ∼1 km) (Hijmans et al., 2005) and the data of annual actual evapotranspiration (AET) and annual potential evapotranspiration (PET) were compiled from the Global Evapotranspiration and Water Balance Data Sets (Ahn and Tateishi, 1994). All the data layers were rescaled to a 50-km resolution grid with the Albers equal-area projection to make computation feasible.
We then performed a principal component analysis (PCA) on the correlation matrix of all the 19 climatic variables together with AET, PET, and moisture index (AET/PET, MI) after excluding one of any pair of variables having pairwise Pearson’s correlation coefficients > 0.7. We used the first two principal components (explaining 78.5% of the total variation) as each explained more variation than expected under a broken stick model. The full name and abbreviation of each climatic variable along with its loading on the first two PC axes are shown in Table 1. A mean PC score for each species was obtained by averaging PC scores across its distribution range on each PC axis. The mean PC score was used as a continuous character to quantify climatic niche position (NichP) and niche width (NichW) for each of the Chinese angiosperm genera and species. Specifically, genus/species NichP was calculated as the product of the mean PC1 and PC2 scores in each cell across its distribution range. The NichW for a species or genus was calculated by multiplying the ranges of PC1 and PC2 scores in each cell in the range of the taxon to obtain the niche hypervolume. The mean species NichW was the average NichW of all the species within the genus. Genus NichW regressed on mean species NichWs was used as an index of genus niche divergence (NichDiv) (i.e., non-overlap of species niches within genera) with zero residuals implying perfect niche conservatism (Gómez-Rodríguez et al., 2014).
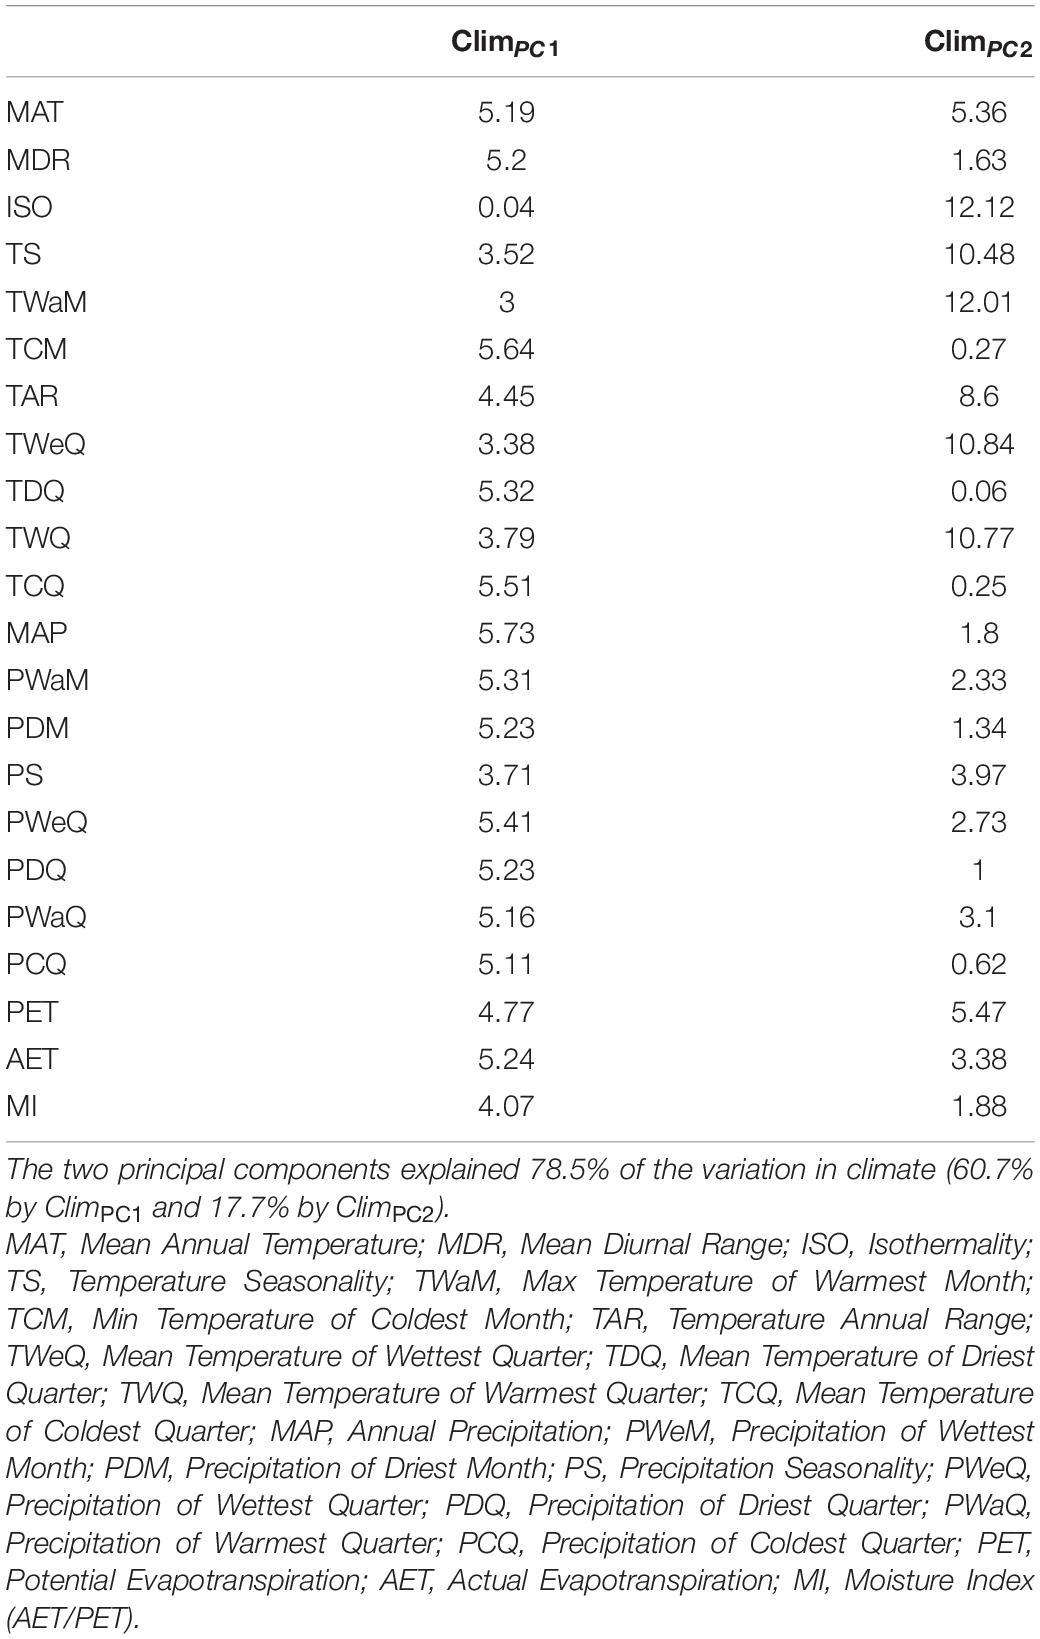
Table 1. Percentage contribution (%) of individual climatic variable to the first two principal components (ClimPC1 and ClimPC2).
Anthropogenic Predictors of Extinction Risk
Land cover/land-use data were compiled from Ran et al. (2010). Original data contained percentage area cover of corresponding vegetation types at 1 km resolution, which was aggregated to 50 km × 50 km equal area projected grids to match the species distribution maps. Historical habitat loss (HL) (before 2,000) was estimated as the sum of land area of urban settlements, crops, and two-thirds of the area of pasture cover, under the assumption that pasture lands were incompletely cultivated and less intensively used than croplands or urban areas (Lee and Jetz, 2011). Recent HL (2000–2014) was aggregated and projected from forest cover data at 30 m resolution (Hansen et al., 2013). The final HL predictor was the sum of historical and recent HL across species and genera ranges. We further estimated annual net primary productivity (NPP) values in the study area using MODIS gridded 1 km annual NPP product after excluding cropland and urban settlements for the period of 2000–2015 (Zhao and Running, 2010). A predictor of habitat quality (HQ) was estimated by averaging annual mean NPP across species and genera range maps.
Quantifying Taxonomic Extinction Risk
As a simple measure of the role of evolutionary history in extinction risk, we compared the proportion of threatened species within each genus against a random expectation. If extinctions occur independently of relatedness, the probability of extinction within a family (or genus) will be constant and equal to the global probability (Vamosi and Wilson, 2008). A reference distribution against which to test the observed value within a family (or genus) can be obtained using random draws (here 10,000) from binomial distribution with the probability of success (i.e., being a threatened species) in each draw calculated from the overall value across all the species (Vamosi and Wilson, 2008). Relevant global values in this study were 0.07 at the family level and 0.11 at the genus level. This approach should remove bias associated with the statistical analysis of proportions for varying species richness, especially for monotypic families or genera, which have either 0 or 100% of their species at-risk. However, in this case, we found this method failed to identify any of the monotypic families or genera as being at-risk, which may be of particular concern in regional conservation (Figure 1).
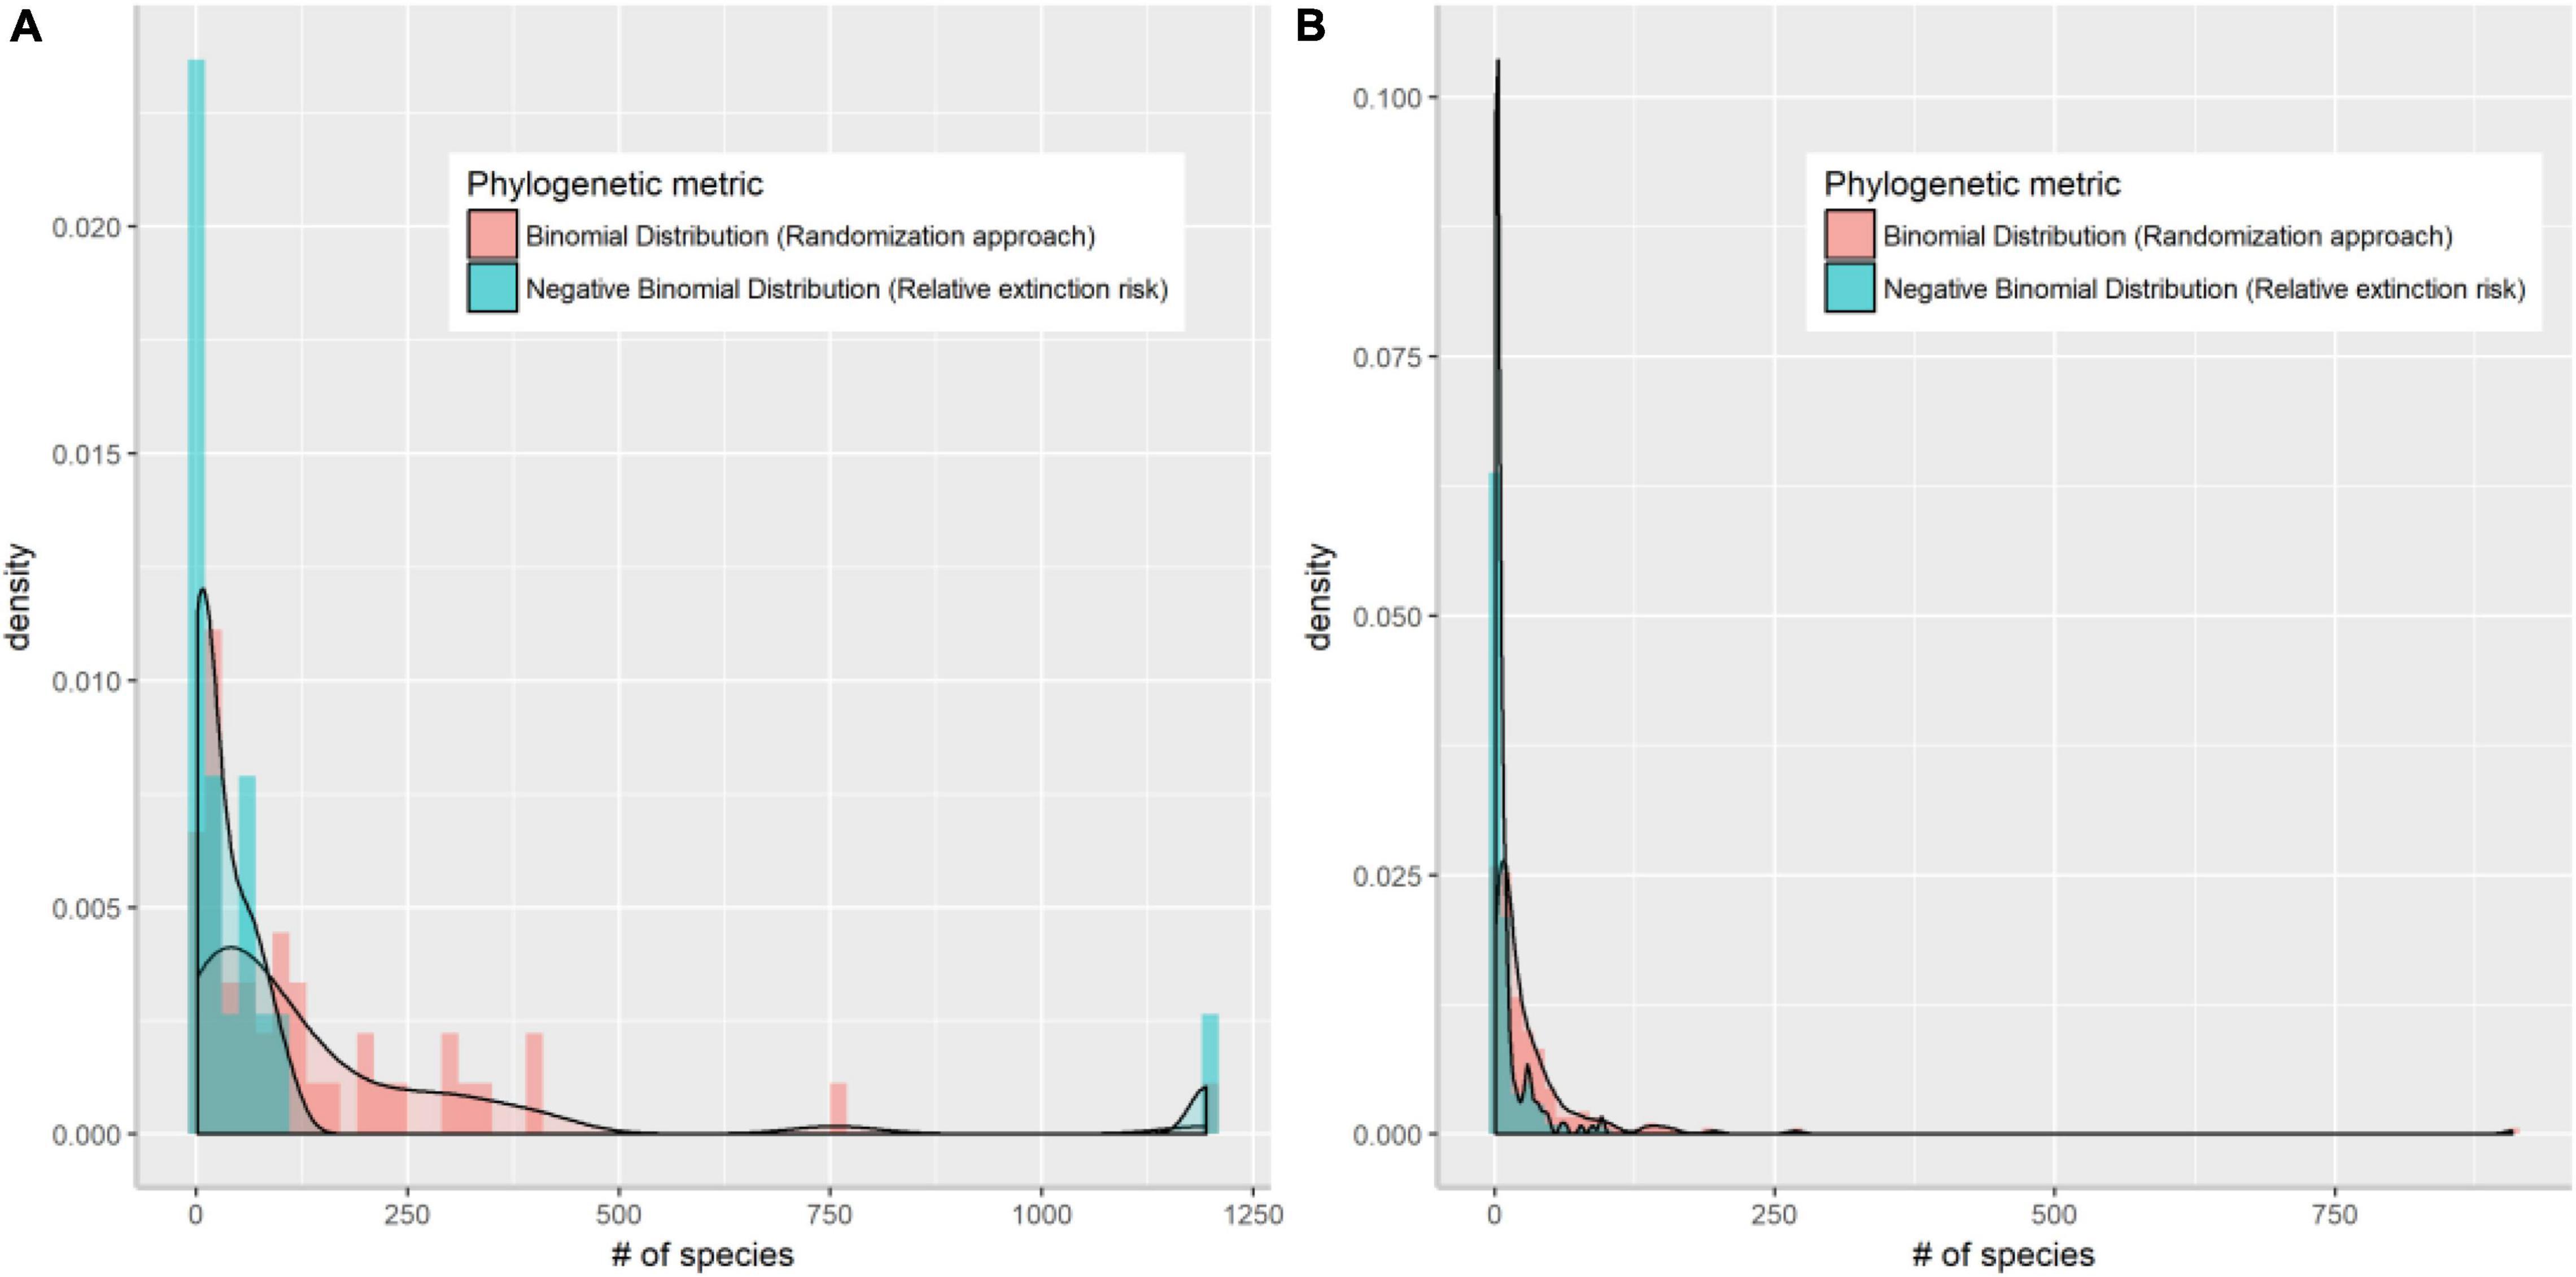
Figure 1. Density plot of Chinese angiosperm families (A) and genera (B) that are identified as threatened by randomization method assuming binomial distribution (red bars) and by extinction risk assuming negative binomial distribution (blue bars).
We, therefore, used Pagel’s lambda as an alternative test of whether evolutionary relatedness of Chinese angiosperm genera was correlated with their extinction risk (i.e., that it had a phylogenetic signal). We also estimated the phylogenetic signal in each predictor using both the Blomberg’s K and Pagel’s lambda. A lambda or K-value of 1 indicates a magnitude of the phylogenetic signal that is consistent with that produced by a Brownian evolutionary model, while a value of 0 indicates the absence of any phylogenetic signal. The estimation of these parameters and the test of their significance relative to 0 and 1 (based on likelihood ratio test) were done using the R package ‘‘phytools’’.5
Structural Equation Modeling
To determine the most important predictors of extinction risk, we first built a conceptual model describing potential causal pathways linking threatened species (or genus) richness with the ecological, evolutionary, and anthropogenic factors described above. Our final hypothesized causal path model included six ecological predictors (NichW, NichP, NichDiv, RngLat, RngLon, and RngSeg), three evolutionary predictors (Age, DivRate, and ExtRate), and two anthropogenic variables (HL and HQ). To overcome any circularity introduced by including range size and range segregation, we included both the climatic NichDiv and climatic NichW in the model framework (Supplementary Figure 3). We used ordinary least squares (OLS) linear regression and locally weighted regression (LOESS) to assess probable bivariate forms for the relationships between threatened species richness (TSR) [or genus species richness (GSR)] and ecological, evolutionary, and anthropogenic predictors (abovementioned 12 variables) using the R package ggplot2 (Wickham, 2016). GSR, genus TSR, genus range size (range), RngLat, and RngLon were subsequently log-transformed, with other variables standardized to 0–1 by (x- xmin)/(xmax -xmin) prior to analysis.
To test support for the hypothesized pathways, we used SEM (Grace et al., 2012). We implemented this with the piecewise SEM framework (Lefcheck, 2015) to allow us to fit component models using phylogenetic generalized least squares. Branch lengths in the phylogenetic tree were transformed based on estimated Pagel’s lambda values.
We stepwise optimized the constructed SEM model by considering “missing pathways” and comparing with other possible models with alternative pathways to explain the same dataset. The overall fit of the piecewise SEM was evaluated using Shipley’s d-separation test, Fisher’s C statistic, and the Akaike Information Criterion (AIC). Only statistically significant (p < 0.05) pathways generating the lower AIC score were retained in the model for further optimization (Shipley, 2013). We quantified the indirect effects of predictors on response variables (GSR and genus TSR in this study) by multiplying path coefficients along the pathway.
Given our primary interest was to identify pathways that influence the distribution of TSR among Chinese angiosperm genera, we summarize only significant variables with supported direct or indirect path coefficients. We reported the standardized coefficient for each path and explained variance (R2) for each of the component models based on methods proposed by Nakagawa and Schielzeth (2013). All the statistical analyses were performed with R software version 3.6.2 (R Core Team, 2016), with piecewise SEM implemented using the R package “piecewiseSEM”(Lefcheck, 2015). Final data are given in Supplementary Appendix 2.
Potential Loss of Phylogenetic Diversity
To explore the potential loss of PD under contrasting extinction scenarios, we used simulations where loss of genera was based on their relative ranking under various predictors of extinction risk. We sequentially pruned genera from the phylogeny after ordering all the genera according to their: (1) decreasing relative extinction rate, (2) increasing range size, (3) decreasing area of HL, and (4) decreasing relative extinction risk. The simulation proceeded by removing genera sequentially according to the different orderings based on the scenario of interest. Following the removal of each genus, the overall PD was recalculated. So, using relative extinction risk as an example, the genus predicted to have the largest extinction risk was dropped from the tree in the first pruning event, then the two genera predicted to have the largest and second largest extinction risk were dropped from the tree in the second pruning event and so on. For each simulated extinction scenario, we calculated the PD (Faith, 1992) loss with the results presented as a cumulative curve showing the loss of PD for a given number of genera.
As a point of comparison for the scenarios, we also generated a random PD loss curve. This proceeded first randomly sampling one genus from the Chinese angiosperm database and calculating the PD loss after pruning the genus. We continued this procedure by random sampling of two genera, and so on, until all the genera were pruned. We repeated this sampling 1,000 times to create a reference distribution and used the median and the 2.5 and 97.5% quantiles to quantify uncertainty in random PD loss of a given number of genera. As the scenarios contained only one possible ordering of genera removal resulted in only one possible value of phylogenetic loss as each tip is removed. This allowed us to determine whether the extinction rates resulted in a greater or lesser loss of PD that would occur from the random extinction of the same number of genera.
Results
Extinction Risk Is Not Randomly Distributed Among Chinese Angiosperms
Randomization identified 45 families (15.6% of total) that contain more threatened species than expected, excluding families with only one species (Figures 1A, 2). No family contained significantly fewer threatened species than expected. At the genus level, 210 genera (8.6% of total) contained more threatened species than expected (red bars in Supplementary Figure 1), while randomization identified 152 monospecific genera (Figure 1B). Extinction risks had a significant phylogenetic signal (Pagel’s lambda = 0.276, likelihood ratio test P < 0.001, Blomberg’s K = 0.121, P < 0.01) indicating that it was generally more similar between closely related genera. As measured by Pagel’s lambda, all the genus-level variables exhibited a significant amount of phylogenetic signal (climatic NichW λ = 0.225, NichP λ = 0.695, NichDiv λ = 0.185, HL λ = 0.650, range size λ = 0.200, and range segregation λ = 0.094; all P < 0.001). Blomberg’s K gave a more conservative estimate of phylogenetic signal, with only three variables proving statistically significant (NichP K = 0.160, P < 0.01; HL K = 0.170, P < 0.01, and range, K = 0.152, P < 0.001), although NichW was marginally so (K = 0.079, P = 0.056). Highly threatened genera were phylogenetically clumped (D = 0.593) and departed significantly from Brownian [P (D > 0) < 0.001] and random expectation [P (D < 1) < 0.001].
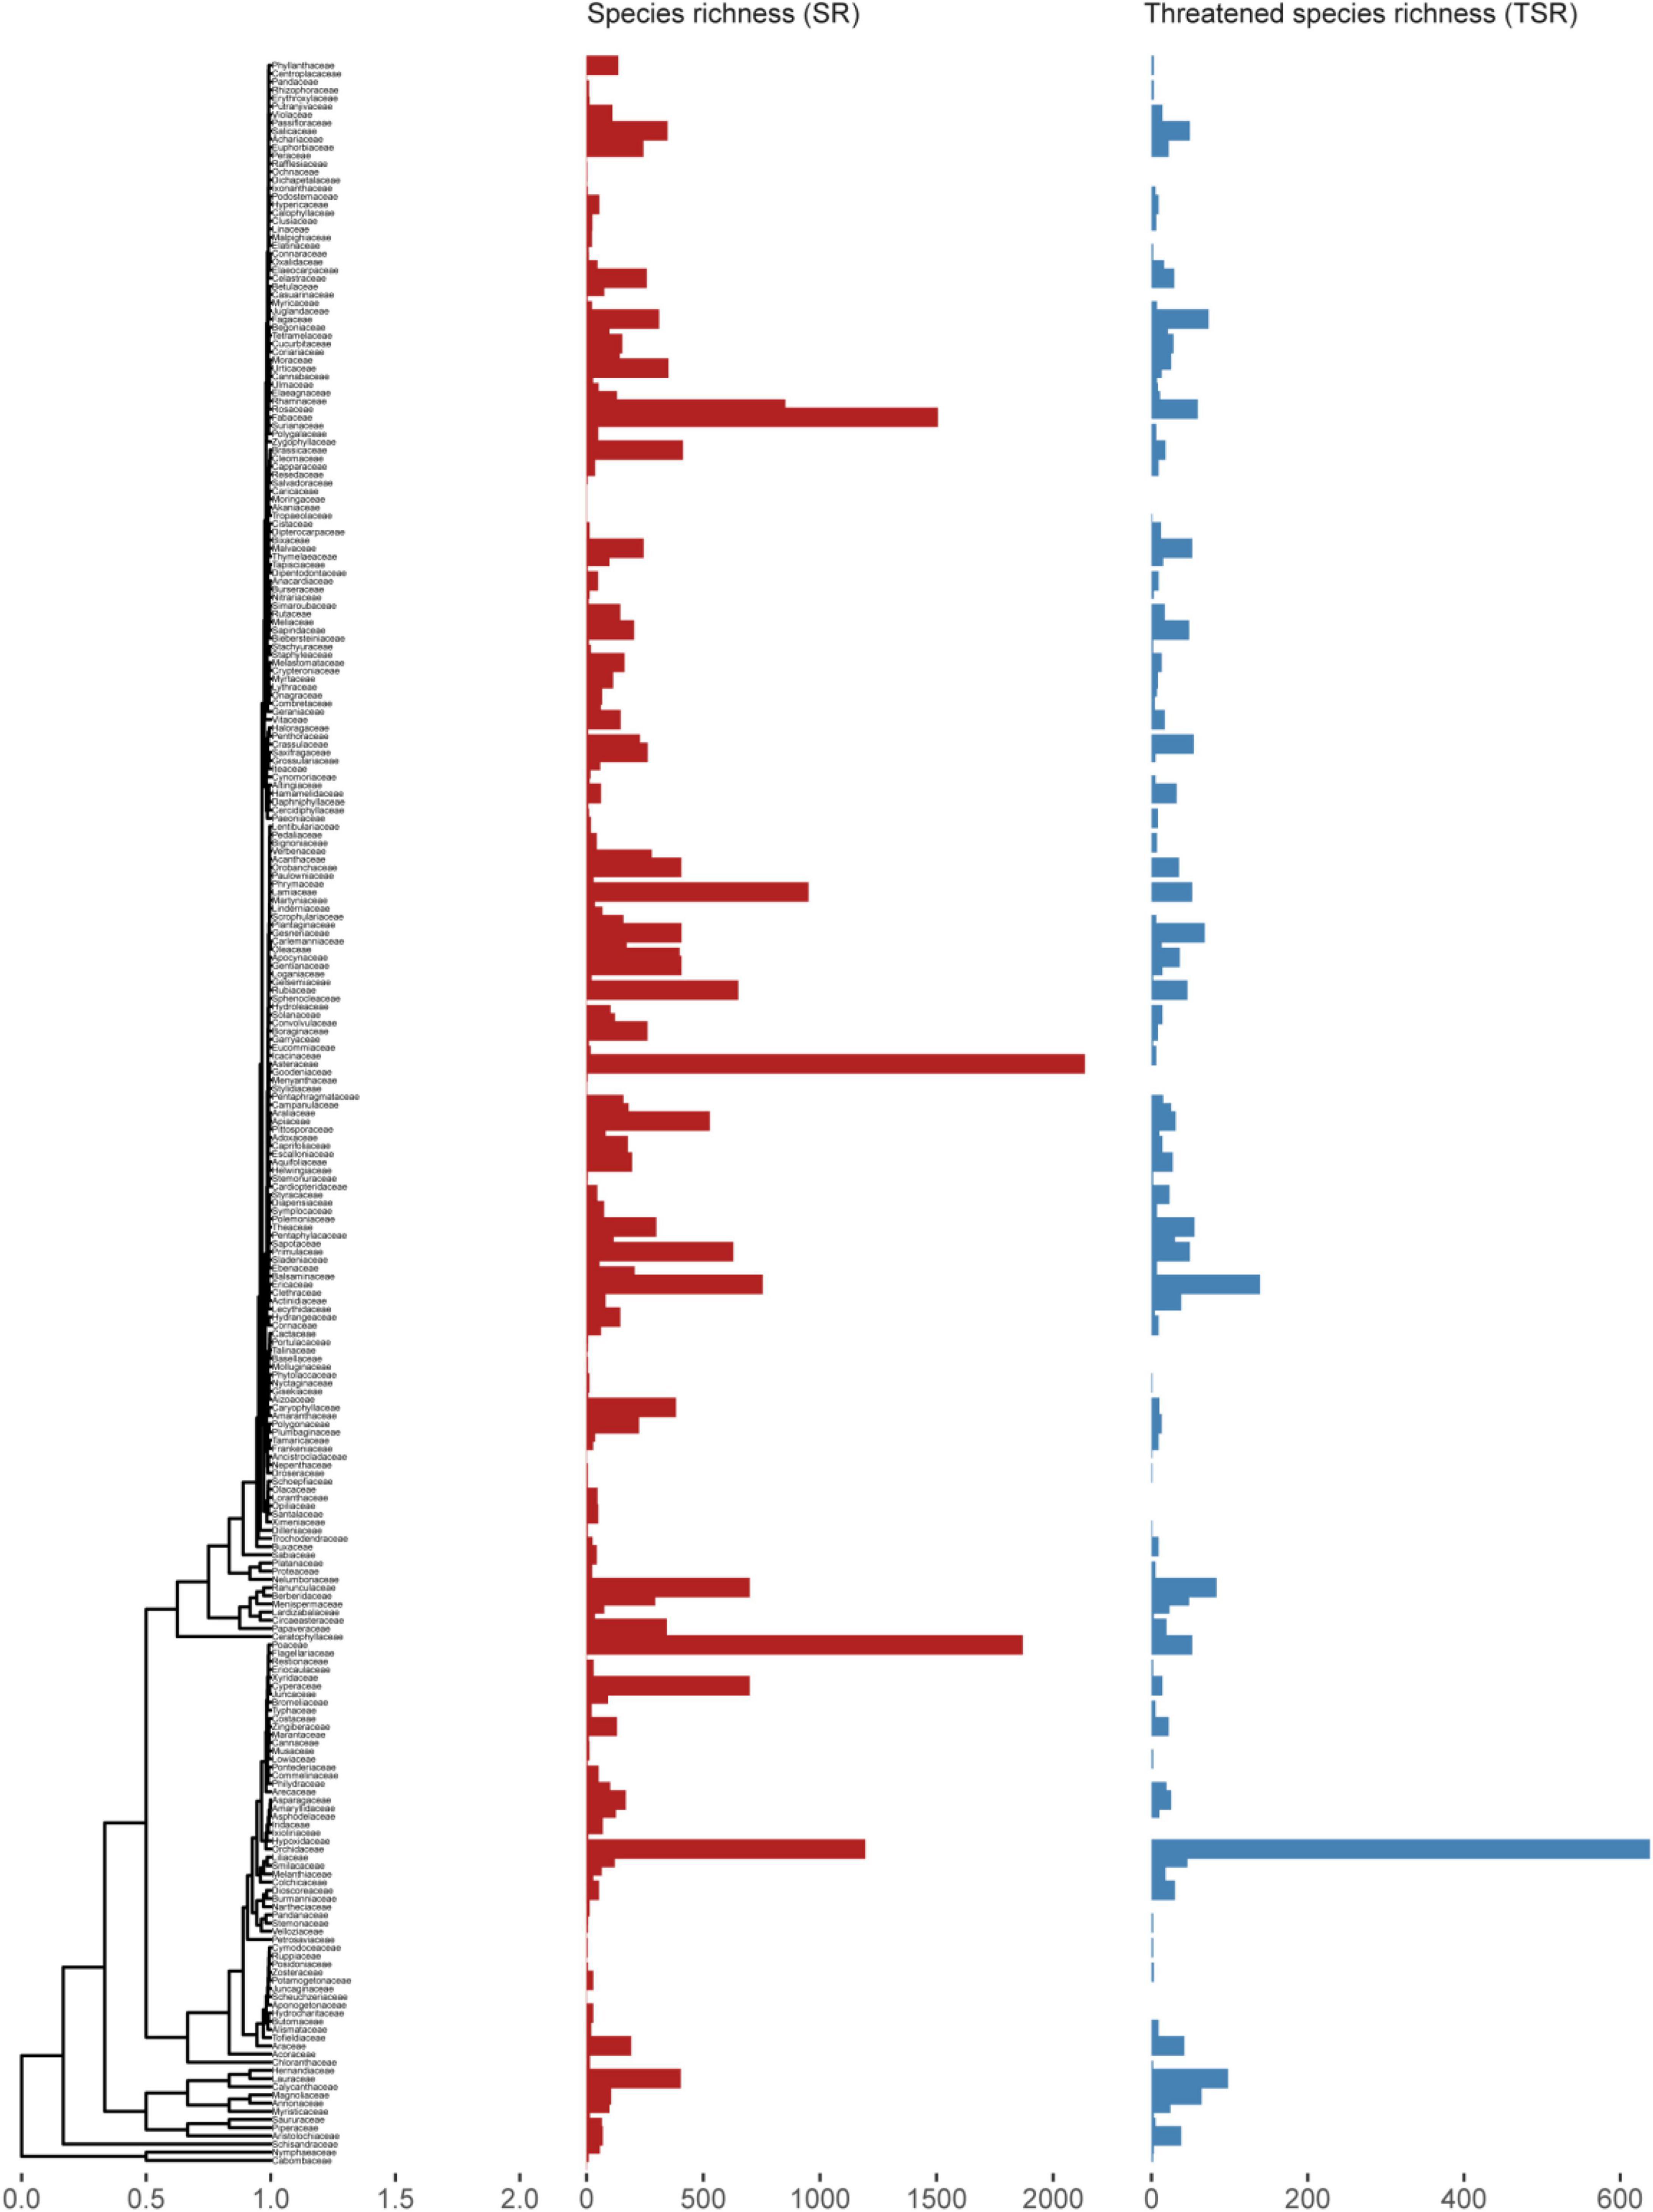
Figure 2. Time-calibrated phylogeny of Chinese angiosperms families used in this study. Red bars represent genus species richness (GSR) in each family and blue bars represent threatened species richness (TSR) in each family.
Genus-Level Species Richness Dominated Explained Variation in Extinction Risk for Chinese Angiosperms
Statistically significant bivariate relationships were identified between all the ecological and anthropogenic factors and GSR (P < 0.05; Supplementary Figure 2), but only four ecological variables (climatic NichW, NichDiv, range, range segregation) have significance to TSR (P < 0.001; Figure 3).
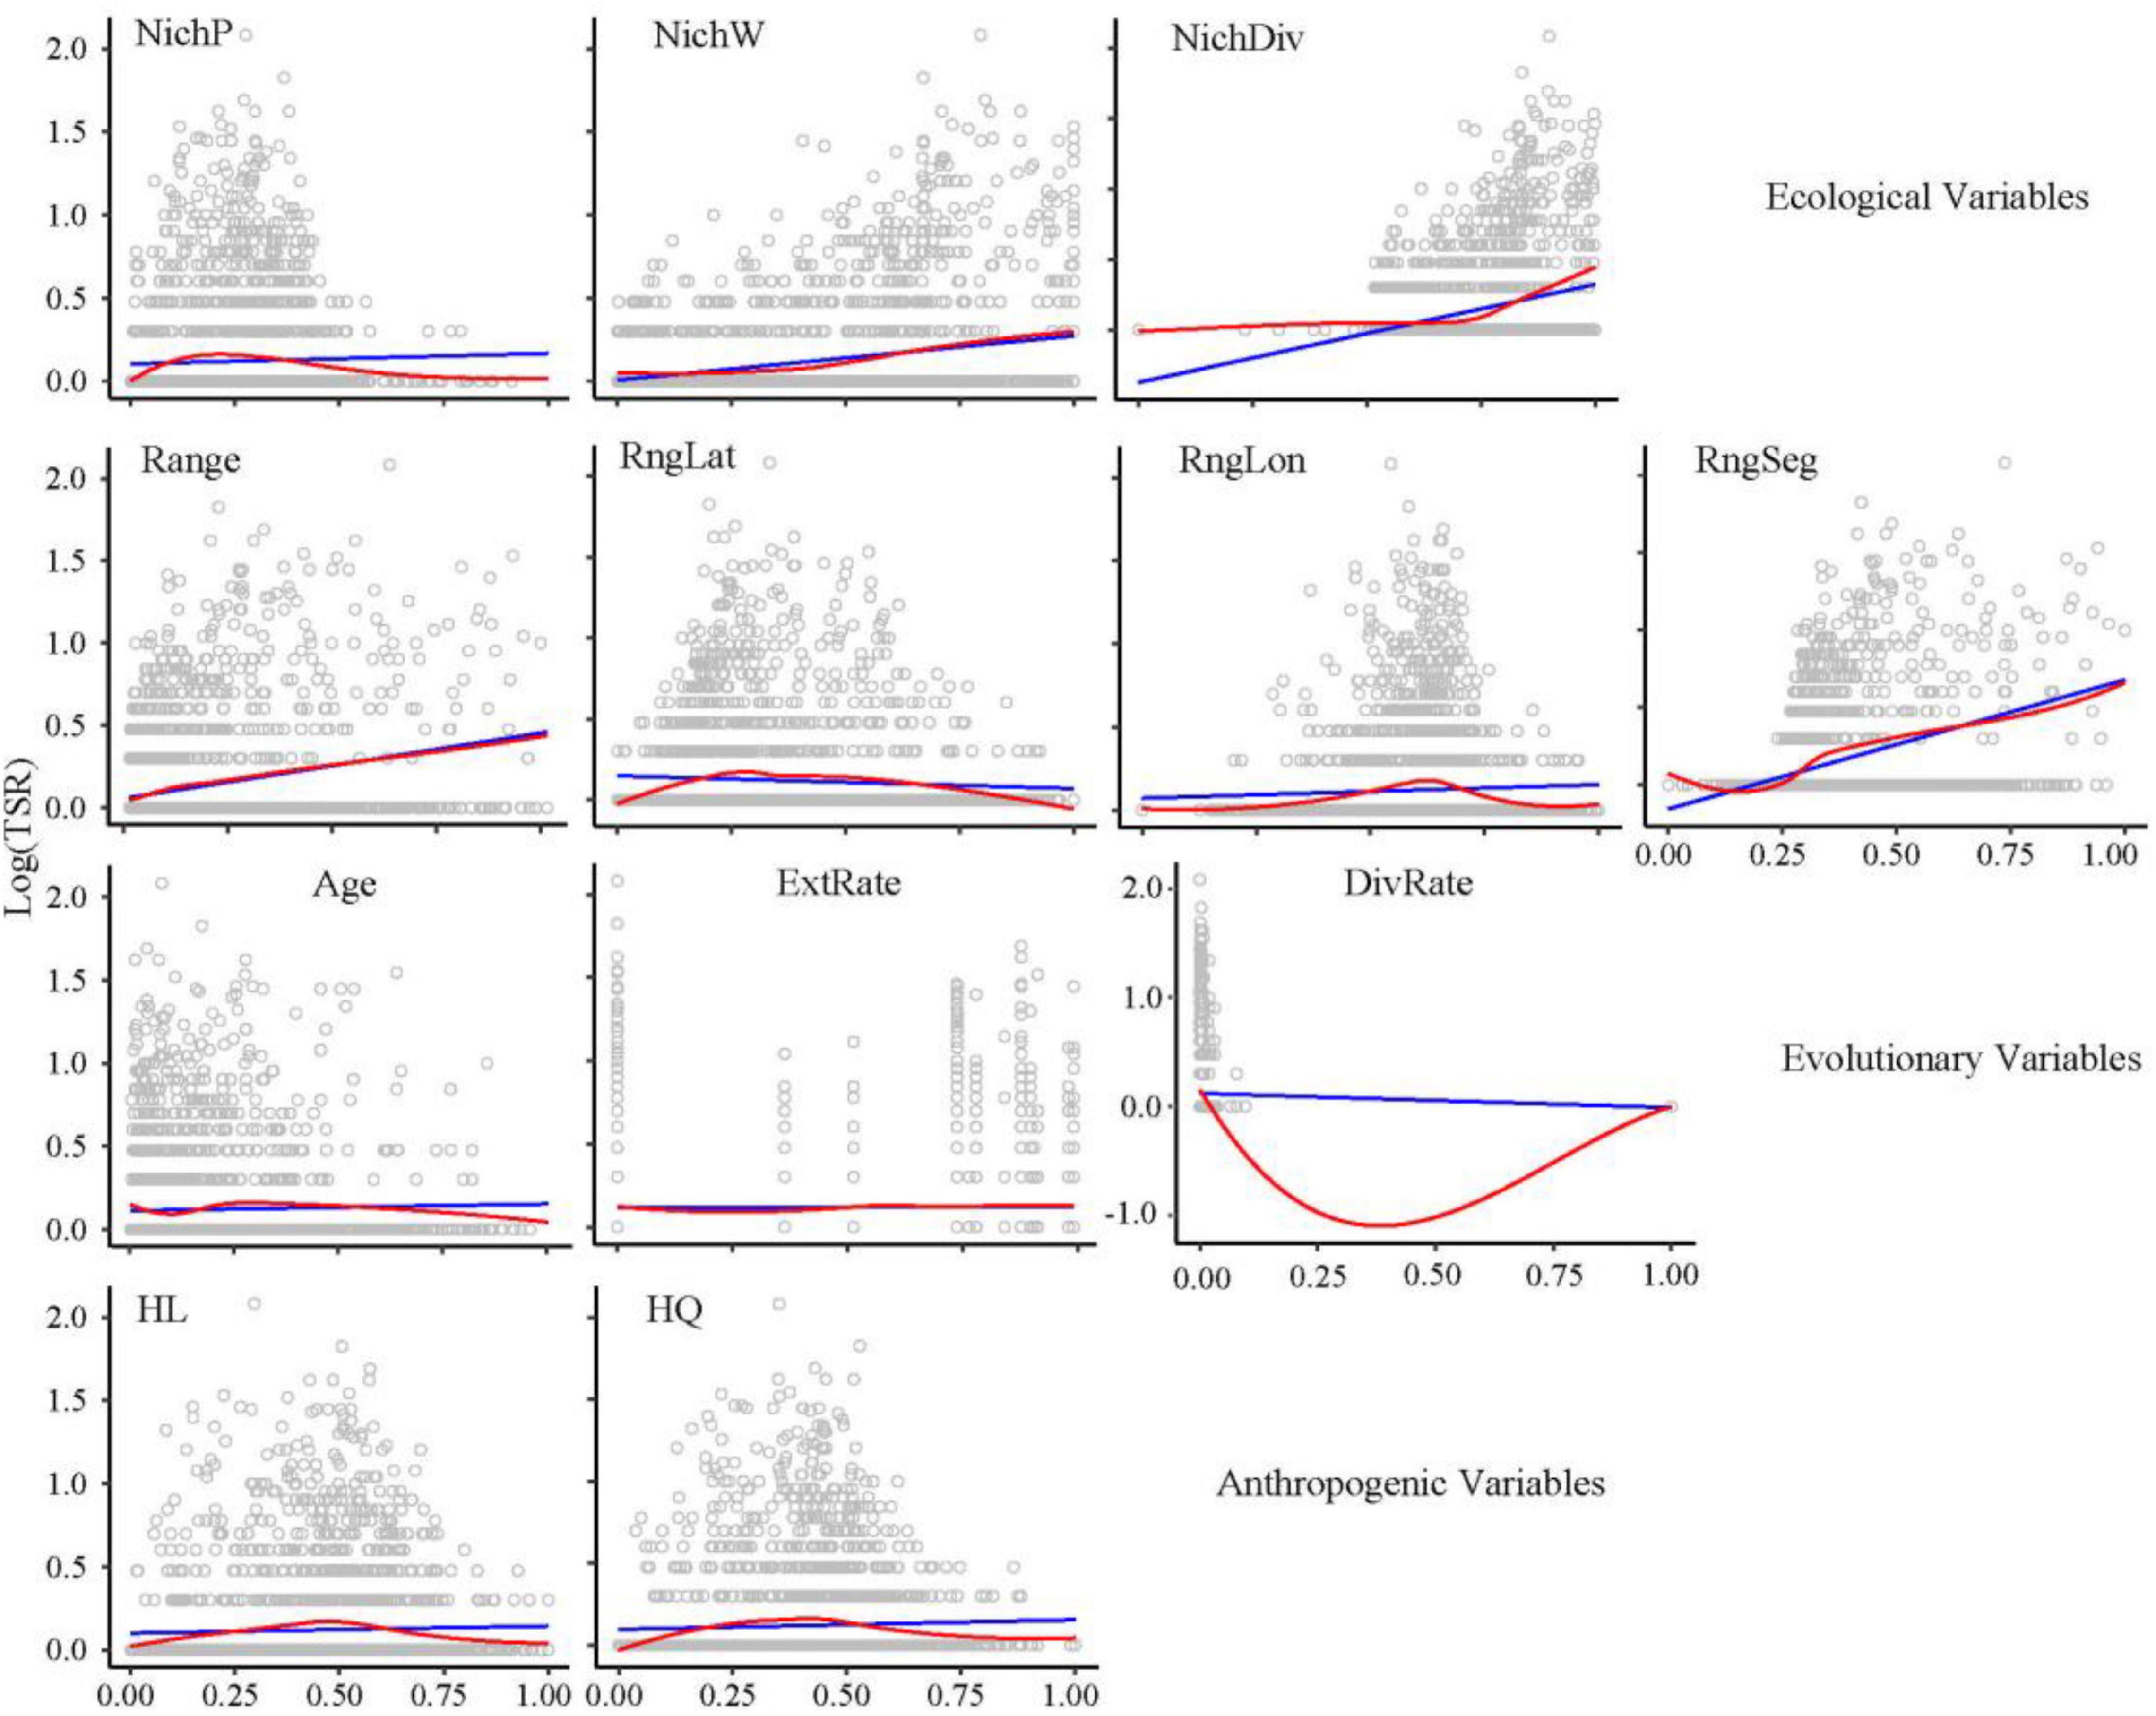
Figure 3. Bivariate relationships of ecological, evolutionary, and anthropogenic predictors to TSR (log-transformed). Ordinary least squares linear regression (blue line) and locally weighted regression (red line) were fitted for all the maps. NichP, nich position; NichW, nich width; NichDiv, genus niche divergence; RngLat, range position (latitude); RngLon, range position (longitude); RngSeg, range segregation; ExtRate, relative extinction rate; DivRate, net diversification rate; HL, habitat loss; HQ, habitat quality.
The final SEMs for TSR had an acceptable fit to the data (C14 = 19.05, P = 0.163). Easily the strongest relationship identified was the positive direct effects of genus-level species richness (path coefficient = 0.615, P < 0.0001) (Figure 4A). Genus-level species richness also mediated the indirect effects of range size, range segregation, and NichDiv on TSR (–0.06, P < 0.0001; 0.42, P < 0.0001; 0.26, P < 0.0001, respectively). Other direct effects on TSR identified were a negative influence of range (–0.16, P < 0.0001) and HL (0.09, P < 0.0001). Relative extinction rate had no significant effect on TSR, but a significant negative effect on NichDiv (–0.09, P < 0.01). After controlling for phylogeny, causal paths for evolutionary age, climatic NichP, climatic NichW, range position, diversification rate, and HQ were not supported, indicating that these had no significant effect on either GSR or TSR.
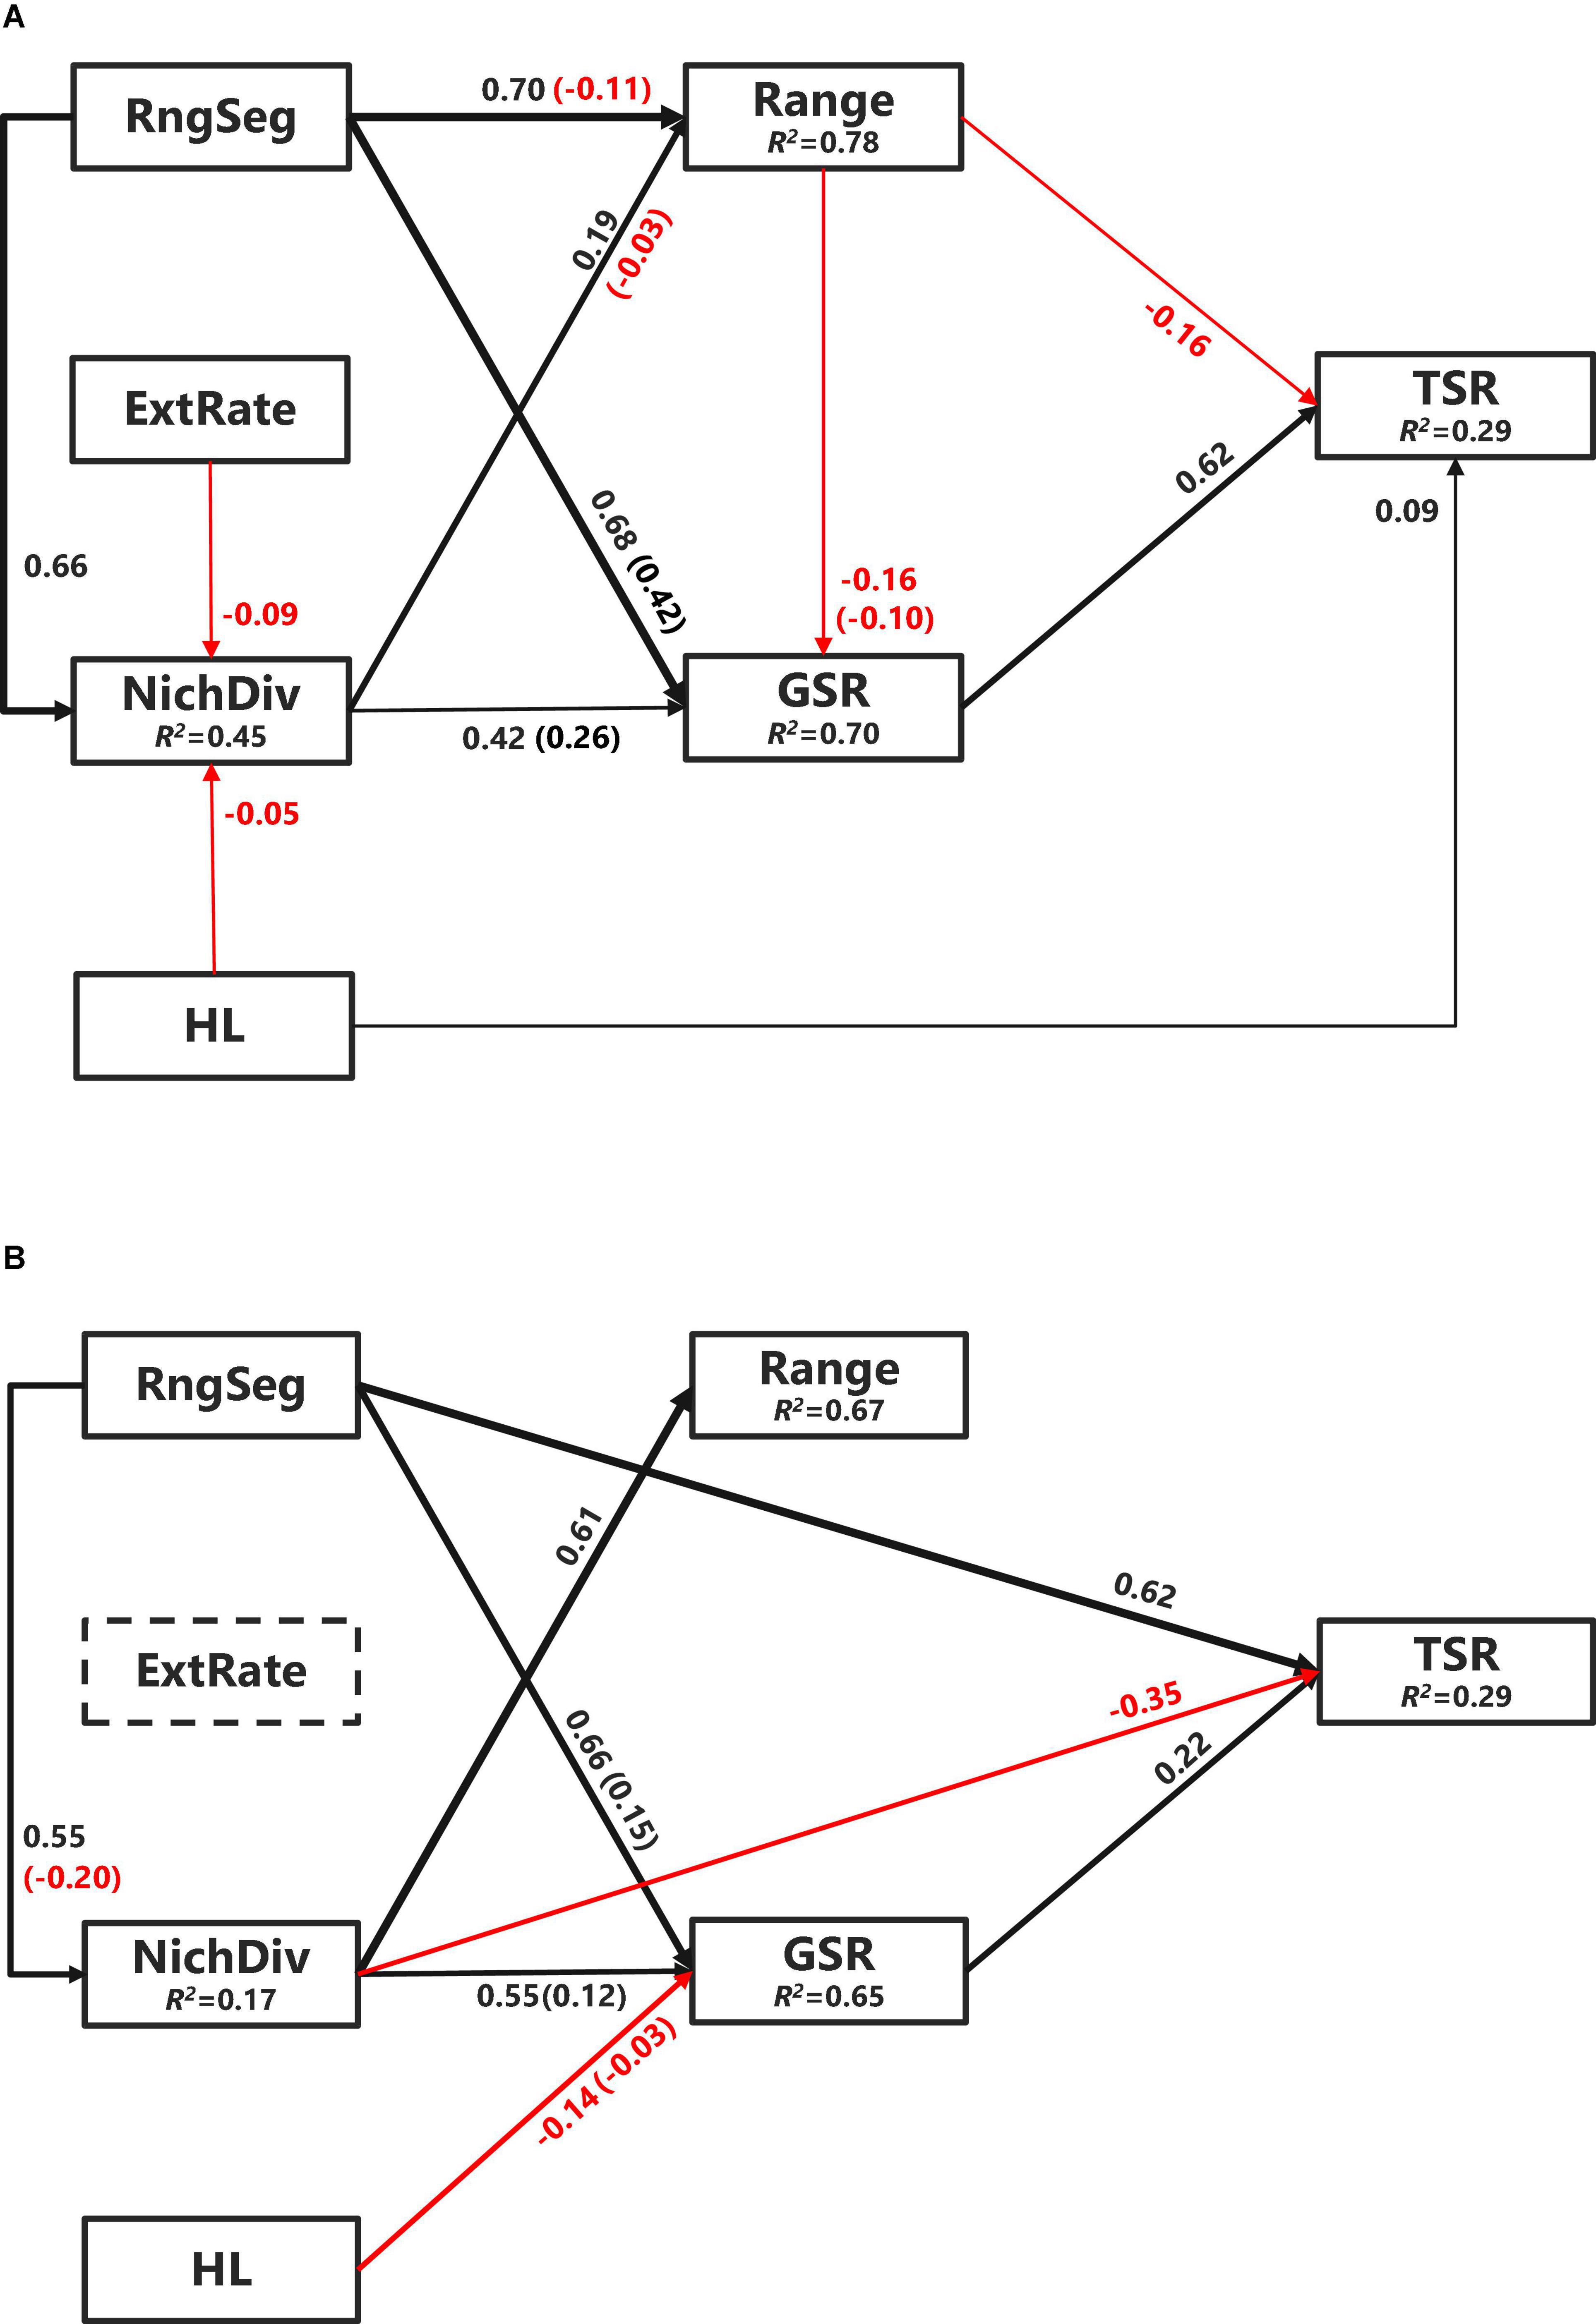
Figure 4. Piecewise structural equation modeling (SEM) models of TSR of Chinese angiosperm genera (A) and endemic genera (B). Black arrows denote positive relationships and red arrows denote negative relationships. Non-significant paths (P ≥ 0.05) are not shown to keep simplicity. The thickness of the significant paths has been scaled based on the magnitude of the standardized regression coefficient. R2s for component models are given in the boxes of response variables. Values in parentheses are the indirect effects strength on TSR. NichDiv, genus niche divergence; RngSeg, range segregation; ExtRate, relative extinction rate; HL, habitat loss; GSR, genus species richness.
Extinction Risk in Endemic Genera Dominated by Range Segregation
The final SEM models for TSR applied only to the Chinese endemic angiosperm genera dataset that also had an acceptable fit to the data (C12 = 18.16, P = 0.111). However, it identified strikingly different pathways to that for all the Chinese genera (Figure 4B). Although genus-level species richness again had a direct positive effect (0.22, P < 0.05), range segregation, which had no direct effect for all the Chinese genera, was the most important direct effect (0.62, P < 0.0001). Also, contrasting with the all the Chinese genera model (Figure 4A), NichDiv had a direct negative effect on threatened endemic species richness (–0.35, P < 0.001). Consistent with the all the genera model, however, genus-level species richness again mediated the indirect effects for range segregation (0.15, P < 0.001) and NichDiv (0.12, P < 0.0001), but for endemic genera, it also mediated the effect of HL (–0.03, P < 0.001) on threatened endemic species richness. Surprisingly, neither range nor HL had significant effects on threatened endemic species richness (Figure 4B).
Loss of the Highest Relative Extinction Rate Genera Would Result in Worst-Case Initial Loss of Phylogenetic Diversity
All the extinction scenarios resulted in non-random loss of PD, but the trajectory varied markedly among them (Figure 5). For a 50% loss of genera, the random extinction scenario predicted the loss of nearly 40% of total PD [mean (95% confidence limits) = 38.5 (36.9, 39.8)%]. Selective removal of those genera with the highest relative extinction rate clearly resulted in the greatest initial loss of PD. For example, extinction of only 0.2% of those genera with the highest extinction rate would remove 3% of total PD. Predicted PD loss in order of increasing range size was most similar to that of random loss, but was still significantly higher for the first 25% and last 22% of genera. When genera were pruned according to decreasing order of HL, predicted PD loss was similar in broad trajectory, but consistently above that for random loss of genera. After the first 1.3% genera are lost, 67.5% of the predicted PD loss occurs in the decreasing HL scenario. PD loss for HL was not higher than that for decreasing extinction risk or increasing range size until 9 of the 13 most threatened genera and the 29 most range-limited genera were pruned. In the decreasing extinction risk scenario, predicted PD loss is greater than random for loss of the first 19.1% genera and the last 57.3% genera.
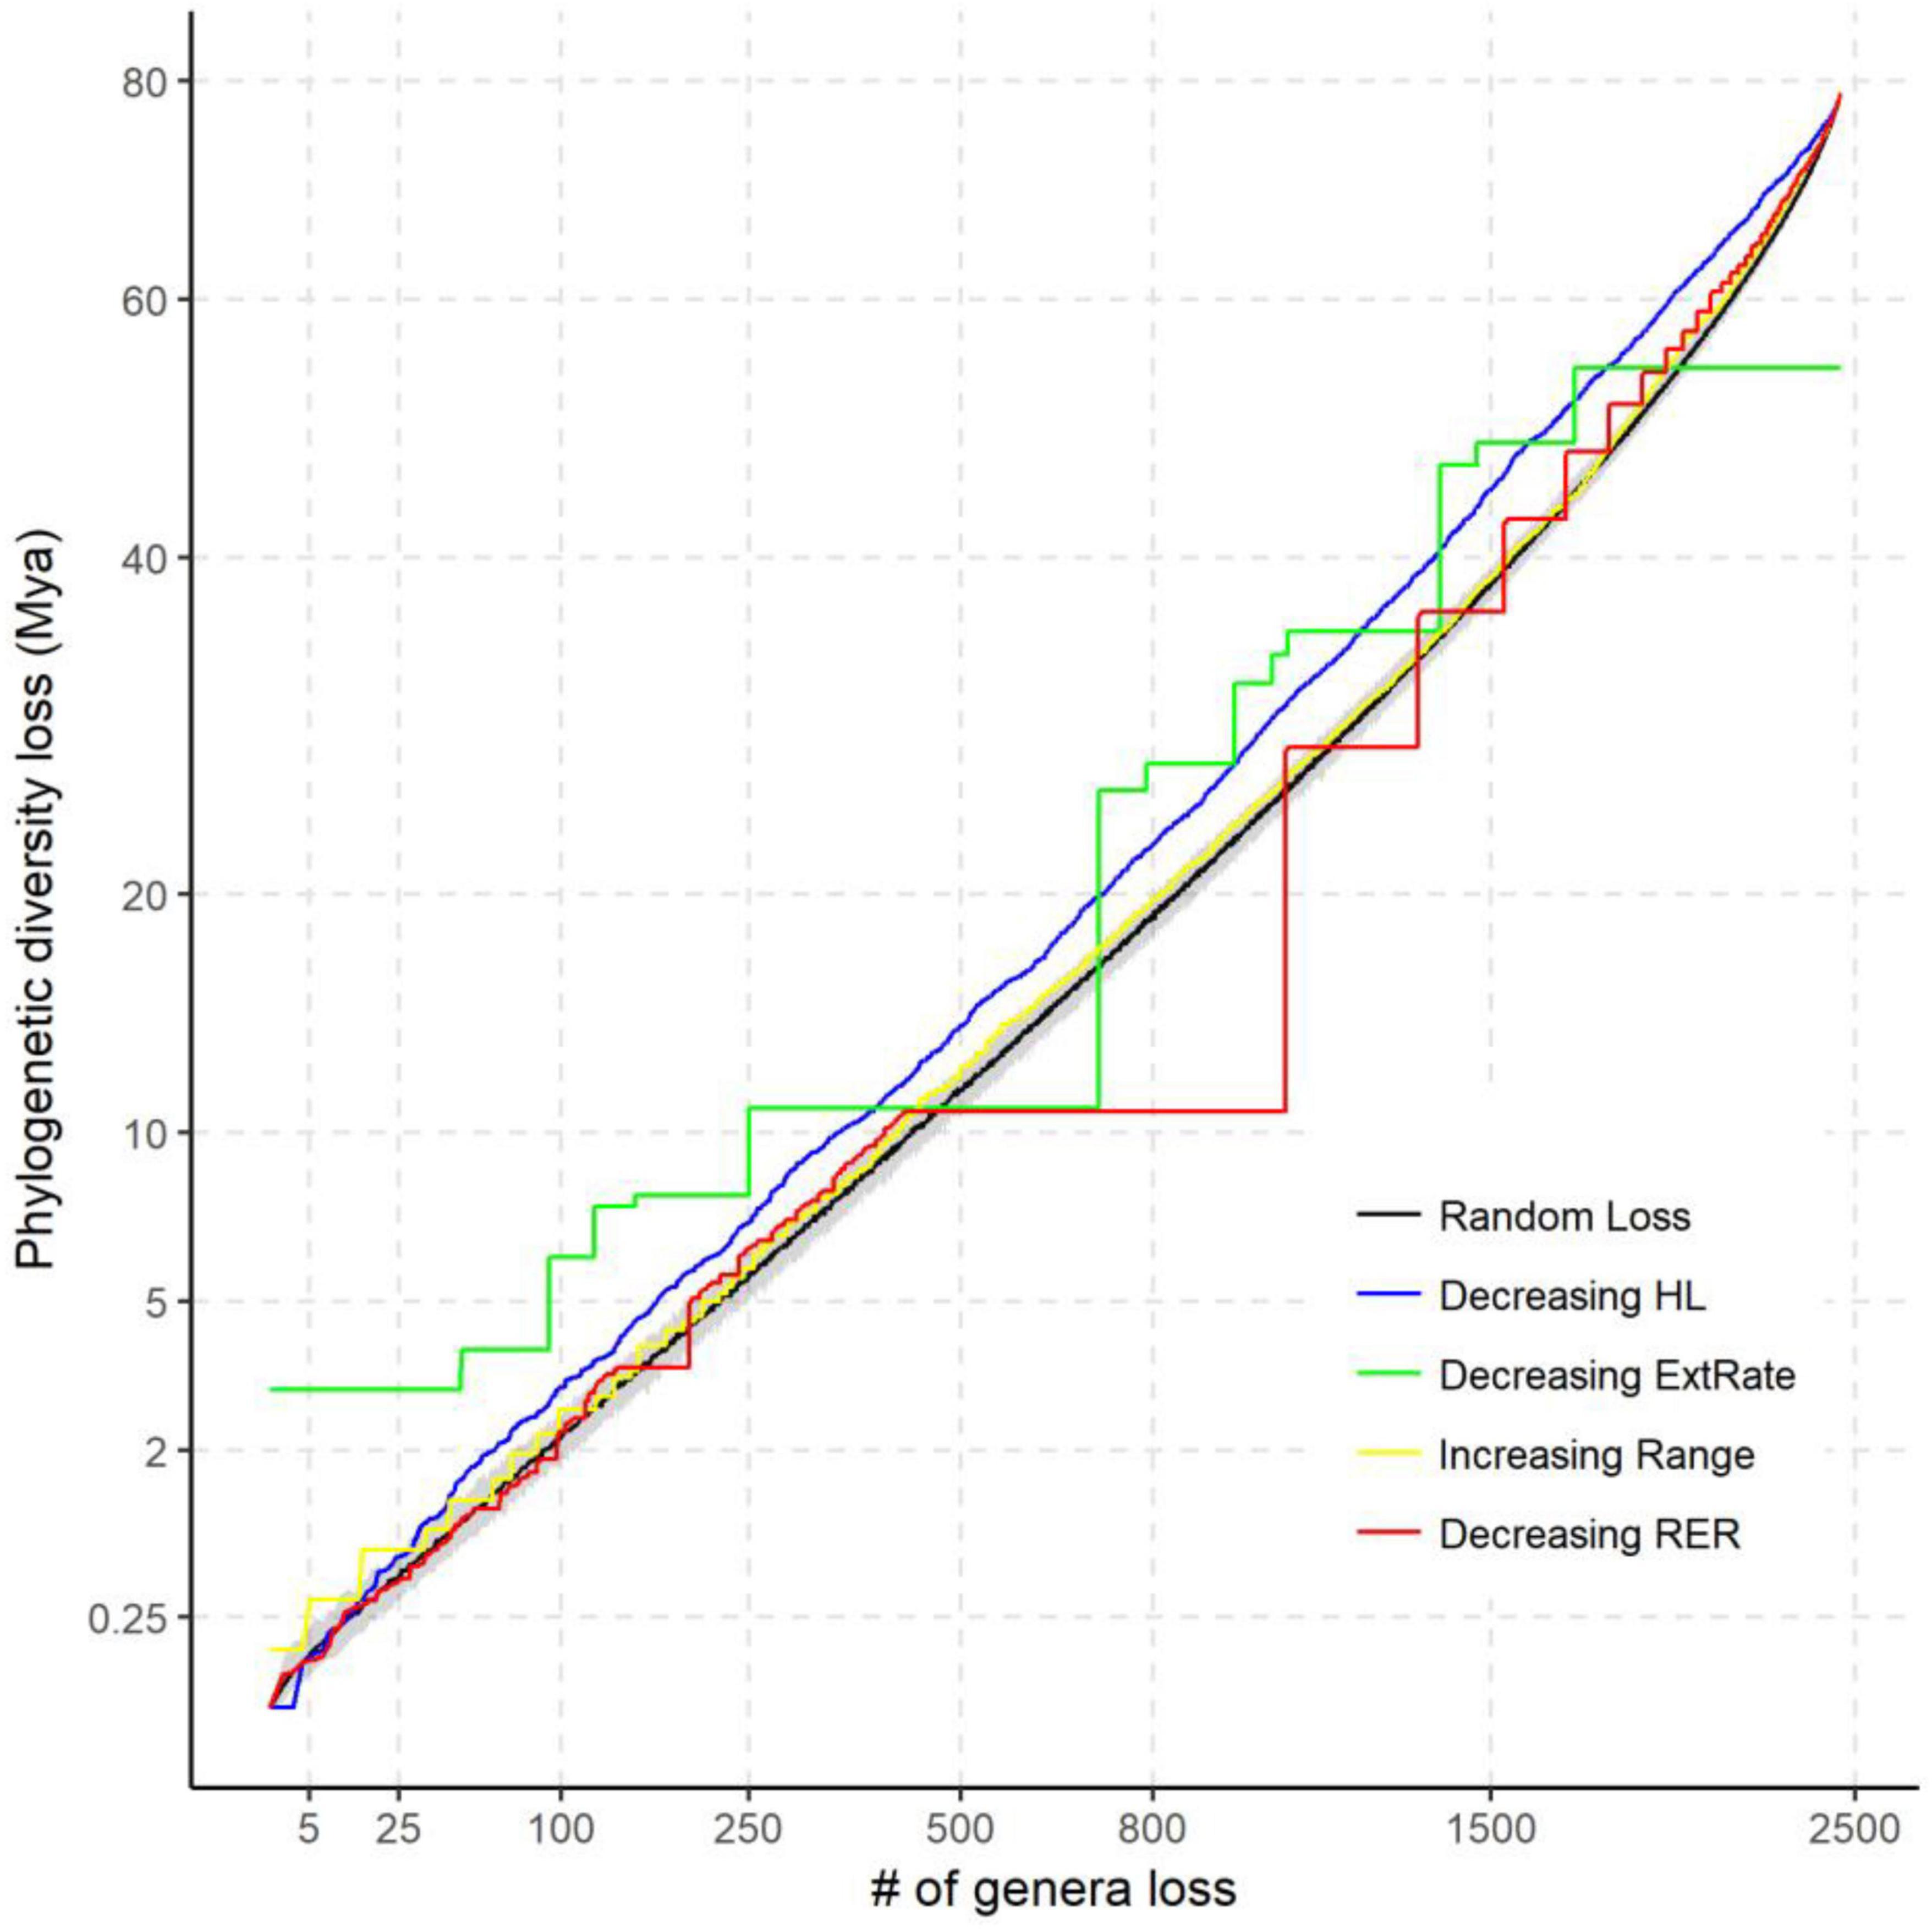
Figure 5. The potential loss of phylogenetic diversity (PD) under different extinction scenarios compared with random extinction on the tree of life for Chinese angiosperms. The black solid line shows the median of expected PD loss by randomly pruning the same number of genera from the genera phylogeny 1,000 times. The gray area is the quantile range (2.5–97.5%) of the null model. The extinction scenarios include: decreasing habitat loss (HL) (blue line), decreasing relative extinction rate (green line), increasing range size (yellow line), and decreasing reduction of extinction risk (RER) (red line). Axes are square-transformed to facilitate interpretation.
Discussion
Distributions of Extinction Risk Among Chinese Angiosperm Genera
Compared with estimates based on randomization alone, extinction risk quantified under a log-normal distribution better addressed the large species richness variation among clades by successfully identifying species-poor (especially monotypic) families and genera (Figure 1). When the same number of species are threatened, these clades would risk a higher level of extinction, whereas this is rarely the case for large families and genera. Extinction risk also correctly identified species-rich families harboring high proportions of species being threatened such as the Magnoliaceae and Orchidaceae. Twenty of the 88 genera identified as highly threatened according to extinction risk are endemic to China, but none of the 50 genera identified by randomization are endemic. These high-risk families and genera are also of particular importance to regional biodiversity conservation due to their distinct evolutionary history (Purvis et al., 2000a).
In agreement with previous studies (Sjöström and Gross, 2006; Thuiller et al., 2011; Pio et al., 2014; Zhang et al., 2017), we found that extinction risk of Chinese angiosperms is non-randomly clumped and this was broadly consistent across the two phylogenetic metrics (i.e., Pagel’s lambda and D statistics). Species in some families and genera tended to have a higher risk of extinction than expected by chance (Figure 2). The significant phylogenetic signal of extinction risk suggests that phylogenetic measures (such as evolutionary age, clade size, and diversification rate), which are associated with extinction-biasing traits, may be predictive of extinction risk. The low phylogenetic signal among the climatic niche variables suggests that the higher phylogenetic signal of extinction risk may stem from the selectivity of extrinsic threats such as human activities (Di Marco and Santini, 2015).
Causes of Extinction Risk Among Chinese Angiosperm Genera
The use of piecewise structural equation models enabled us to disentangle the direct and indirect causes of extinction risk variation among Chinese angiosperm genera while controlling confounding effects of their shared evolutionary history.
The consistent and positive effect of genus-level species richness on TSR for all the Chinese species and endemic species only (Figure 4) is in line with previous findings that species-rich taxa contain more rare/threatened species (Lozano and Schwartz, 2005). The negative relationship between range size and TSR across all the genera (Figure 4A) reflects the concentration of threatened species in range-limited genera. Although details on the factors used to assign conservation classifications in the 2013 Red List of Chinese plant species are somewhat opaque, the strong effect of range size may reflect the high frequency of plant species assessed under the range-based IUCN criteria, as is the case for reptiles (Bohm et al., 2016). The effect of range size on TSR was not significant among endemic genera (Figure 4B), which might simply reflect lower variation among these species, as median range size in endemic species (23.4 × 10⁴ km2) is less than half that of overall genera (59.2 × 10⁴ km2).
Niche divergence should promote higher genus-level species richness, but this had no direct effect on TSR for all the Chinese genera after controlling for other ecological and evolutional factors (Figure 4A). We suggest this is because most species-rich genera (e.g., Rhododendron, Pedicularis, Carex, and Gentiana) are distributed in mountainous regions, such as the Hengduan Mountains, eastern Yunnan and western Guangxi provinces with intense orogeny and complex terrain, which increase dispersal limitation and vicariance (Xing and Ree, 2017). The positive direct effect of range segregation on TSR of endemic-/range-limited genera supports the idea that further segregation of these already range-limited genera increased the number of VU species with extremely small range size. This is especially likely when the species in these highly range segregated genera tend to occupy similar climatic niches (i.e., low niche lability) due to phylogenetic niche conservatism.
For the effects of human activity variables on TSR, the positive effect of HL (Figure 4A) supports previous findings that genera with ranges intensely encroached upon by human development, such as agriculture or urban expansion that would include a higher number of threatened species (Lee and Jetz, 2011). In contrast, HL showed no direct effect on TSR in endemic Chinese genera, albeit despite an indirect negative effect on genus-level species richness (Figure 4B). This too may be because endemic genera are mainly distributed in mountainous areas that are not suitable and less encroached by human development (Huang et al., 2012).
We found some important predictors such as range size or HL that had no significant effects on TSR, which is probably related to the use of a coarse scale of ecological, evolutionary, and anthropogenic predictors and distribution data (a resolution of 50 km × 50 km grid). They could create some errors when estimating climatic niches of narrowly distributed taxa. A higher resolution of distribution data (e.g., occurrence data) for these species should be considered in future studies.
Loss of Phylogenetic Diversity Under Contrasting Scenarios
Phylogenetically clustered extinction risks do not necessarily lead to substantially elevated losses of evolutionary history, but depend on the topology of the phylogeny, relative depth of the clades, and on the order in which clades become extinct (Maliet et al., 2018). The phylogeny of Chinese angiosperm genera is highly imbalanced, as measured by the Colless index (P < 0.001) (Heard and Mooers, 2000). Here, we found that PD loss in the decreasing HL and relative extinction rate scenarios were mostly higher than in other scenarios (Figure 5). The “worst-case” scenario of HL is possible when some genera (e.g., Arisaema, Dioscorea, and Ulmus) that are successful in filling the geographic extent of their fundamental tolerances also suffer more from human disturbance. We should, however, note that this difference is not significantly above a random expectation, until the 9 most threatened genera (decreasing extinction risk scenario) and the 29 most range-limited genera (increasing range scenario) are pruned. The results of predicted PD loss of the latter two scenarios are also significantly higher than random when the last 57.3 and 22% genera are pruned. This suggests that high extinction risk genera both contain the lineages that are isolated clades representing a unique evolutionary history (e.g., Cypripedium, Syndiclis, and Sarcoglyphis) and retain less adaptive strategies that increase the overall extinction risk, such as a low degree of NichDiv or higher proportions of specialists (Day et al., 2016). Range-limited plant genera might also be disproportionately vulnerable to HL and climate change due to synergistic effects of a narrow climatic niche and higher dispersal limitations (Estrada et al., 2015).
Conclusion
While speciation via niche divergence may increase the stochastic extinction risk for range-limited species, this cost is necessary to reduce the overall extinction risk of a clade by expanding its range and climatic niche tolerance. Genera with higher extinction rates, less climatic NichDiv, and lower range segregation suffered from higher extinction risk even with little anthropogenic disturbances such as HL and exploitation. Although the effects of habitat encroachment are mostly indirect and significantly mediated by NichDiv and TSR, it is vital to prevent further habitat encroachment to avoid worst-case loss of PD.
Data Availability Statement
The original contributions presented in the study are included in the article/Supplementary Material, further inquiries can be directed to the corresponding author/s.
Author Contributions
HY and XS conceived the idea and led data analysis and writing. HY, XS, and XY collected and organized the distribution data. MS managed phylogenetic data and conducted the diversification analysis. DD contributed to the writing. This study was a collaboration of scientists with a shared interest in the evolution and conservation of angiosperm flora in China. All authors contributed critically to the drafts and gave final approval for publication.
Funding
This study was supported by the National Natural Science Foundation of China (31901212 and 31770214) and the Talent Start-up Foundation of Guangzhou University (RP2020079).
Conflict of Interest
The authors declare that the research was conducted in the absence of any commercial or financial relationships that could be construed as a potential conflict of interest.
Publisher’s Note
All claims expressed in this article are solely those of the authors and do not necessarily represent those of their affiliated organizations, or those of the publisher, the editors and the reviewers. Any product that may be evaluated in this article, or claim that may be made by its manufacturer, is not guaranteed or endorsed by the publisher.
Acknowledgments
We thank the contributors of the Chinese Vascular Plant Distribution Database. We thank the members of the “SNP Network” for comments on an earlier draft of the manuscript.
Supplementary Material
The Supplementary Material for this article can be found online at: https://www.frontiersin.org/articles/10.3389/fevo.2022.844509/full#supplementary-material
Supplementary Appendix 1 | Chinese angiosperm genera phylogeny.
Supplementary Appendix 2 | Values of predictors for each genus.
Footnotes
- ^ http://www.mee.gov.cn/gkml/hbb/bgg/201309/W020130912562095920726.pdf
- ^ http://www.nsii.org.cn/2017/namesautocheck.php
- ^ http://www.nsii.org.cn
- ^ https://github.com/josephwb/turboMEDUSA
- ^ https://github.com/liamrevell/phytools
References
Ahn, C. H., and Tateishi, R. (1994). Development of a global 30-minute grid potential evapotranspiration data set. J. Jpn. Soc. Photogramm. Remote Sens. 33, 12–21. doi: 10.4287/jsprs.33.2_12
Alfaro, M. E., Santini, F., Brock, C., Alamillo, H., Dornburg, A., Rabosky, D. L., et al. (2009). Nine exceptional radiations plus high turnover explain species diversity in jawed vertebrates. Proc. Natl. Acad. Sci. U.S.A. 106, 13410–13414. doi: 10.1073/pnas.0811087106
Bohm, M., Williams, R., Bramhall, H. R., McMillan, K. M., Davidson, A. D., Garcia, A., et al. (2016). Correlates of extinction risk in squamate reptiles: the relative importance of biology, geography, threat and range size. Glob. Ecol. Biogeogr. 25, 391–405. doi: 10.1111/geb.12419
Brummitt, N. A., Bachman, S. P., Griffiths-Lee, J., Lutz, M., Moat, J. F., Farjon, A., et al. (2015). Green plants in the red: a baseline global assessment for the IUCN sampled Red List Index for plants. PLoS One 10:e0135152. doi: 10.1371/journal.pone.0135152
Cahill, A. E., Aiello-Lammens, M. E., Fisher-Reid, M. C., Hua, X., Karanewsky, C. J., Yeong Ryu, H., et al. (2013). How does climate change cause extinction? Proc. R. Soc. B Biol. Sci. 280:20121890.
Chichorro, F., Juslén, A., and Cardoso, P. (2019). A review of the relation between species traits and extinction risk. Biol. Conserv. 237, 220–229. doi: 10.1016/j.biocon.2019.07.001
Davies, T. J. (2019). The macroecology and macroevolution of plant species at risk. New Phytol. 222, 708–713. doi: 10.1111/nph.15612
Davies, T. J., Smith, G. F., Bellstedt, D. U., Boatwright, J. S., Bytebier, B., Cowling, R. M., et al. (2011). Extinction risk and diversification are linked in a plant biodiversity hotspot. PLoS Biol. 9:e1000620. doi: 10.1371/journal.pbio.1000620
Day, E. H., Hua, X., and Bromham, L. (2016). Is specialization an evolutionary dead end? Testing for differences in speciation, extinction and trait transition rates across diverse phylogenies of specialists and generalists. J. Evol. Biol. 29, 1257–1267. doi: 10.1111/jeb.12867
Di Marco, M., and Santini, L. (2015). Human pressures predict species’ geographic range size better than biological traits. Glob. Chang. Biol. 21, 2169–2178. doi: 10.1111/gcb.12834
Di Marco, M., Venter, O., Possingham, H. P., and Watson, J. E. M. (2018). Changes in human footprint drive changes in species extinction risk. Nat. Commun. 9:4621. doi: 10.1038/s41467-018-07049-5
Di Virgilio, G., Laffan, S. W., Nielsen, S. V., and Chapple, D. G. (2017). Does range-restricted evolutionary history predict extinction risk? A case study in lizards. J. Biogeogr. 44, 605–614. doi: 10.1111/jbi.12875
Estrada, A., Meireles, C., Morales-Castilla, I., Poschlod, P., Vieites, D., Araújo, M. B., et al. (2015). Species’ intrinsic traits inform their range limitations and vulnerability under environmental change. Glob. Ecol. Biogeogr. 24, 849–858. doi: 10.1111/geb.12306
Faith, D. P. (1992). Conservation evaluation and phylogenetic diversity. Biol. Conserv. 61, 1–10. doi: 10.1016/0006-3207(92)91201-3
Foden, W., Mace, G. M., Vié, J. C., Angulo, A., Butchart, S. H., DeVantier, L., et al. (2009). “Species susceptibility to climate change impacts,” in Wildlife in a Changing World–An Analysis of the 2008 IUCN Red List of Threatened Species, eds J.-C. Vié, C. Hilton-Taylor, and S. N. Stuart (Gland: IUCN), 77.
Fréville, H., McConway, K., Dodd, M., and Silvertown, J. (2007). Prediction of extinction in plants: interaction of extrinsic threats and life history. Ecology 88, 2662–2672. doi: 10.1890/06-1453.1
Gaston, K. J., and Fuller, R. A. (2009). The sizes of species’ geographic ranges. J. Appl. Ecol. 46, 1–9. doi: 10.1111/j.1365-2664.2008.01596.x
Gómez-Rodríguez, C., Baselga, A., and Wiens, J. J. (2014). Is diversification rate related to climatic niche width? Glob. Ecol. Biogeogr. 24, 383–395. doi: 10.1111/jbi.13411
Grace, J. B., Schoolmaster, D. R., Guntenspergen, G. R., Little, A. M., Mitchell, B. R., Miller, K. M., et al. (2012). Guidelines for a graph-theoretic implementation of structural equation modeling. Ecosphere 3, 1–44.
Gumbs, R., Gray, C. L., Böhm, M., Hoffmann, M., Grenyer, R., Jetz, W., et al. (2020). Global priorities for conservation of reptilian phylogenetic diversity in the face of human impacts. Nat. Commun. 11:2616. doi: 10.1038/s41467-020-16410-6
Hadly, E. A., Spaeth, P. A., and Li, C. (2009). Niche conservatism above the species level. Proc. Natl. Acad. Sci. U.S.A. 106, 19707–19714. doi: 10.1073/pnas.0901648106
Hansen, M. C., Potapov, P. V., Moore, R., Hancher, M., Turubanova, S. A., Tyukavina, A., et al. (2013). High-resolution global maps of 21st-century forest cover change. Science 342, 850–853. doi: 10.1126/science.1244693
Heard, S. B., and Mooers, A. O. (2000). Phylogenetically patterned speciation rates and extinction risks change the loss of evolutionary history during extinctions. Proc. R. Soc. B Biol. Sci. 267, 613–620. doi: 10.1098/rspb.2000.1046
Hijmans, R. J., Cameron, S. E., Parra, J. L., Jones, P. G., and Jarvis, A. (2005). Very high resolution interpolated climate surfaces for global land areas. Int. J. Climatol. 25, 1965–1978.
Holt, R. D. (1990). The microevolutionary consequences of climate change. Trends Ecol. Evol. 5, 311–315. doi: 10.1016/0169-5347(90)90088-U
Holt, R. D. (2009). Bringing the Hutchinsonian niche into the 21st century: ecological and evolutionary perspectives. Proc. Natl. Acad. Sci. U.S.A. 106, 19659–19665. doi: 10.1073/pnas.0905137106
Huang, J., Chen, B., Liu, C., Lai, J., Zhang, J., and Ma, K. (2012). Identifying hotspots of endemic woody seed plant diversity in China. Divers. Distrib. 18, 673–688. doi: 10.1016/j.pld.2016.11.011
Humphreys, A. M., Govaerts, R., Ficinski, S. Z., Nic Lughadha, E., and Vorontsova, M. S. (2019). Global dataset shows geography and life form predict modern plant extinction and rediscovery. Nat. Ecol. Evol. 3, 1043–1047. doi: 10.1038/s41559-019-0906-2
IUCN Species Survival Commission (2001). IUCN Red List Categories and Criteria: Version 3.1. Gland: IUCN Species Survival Commission.
Knapp, S. (2011). Rarity, species richness, and the threat of extinction-are plants the same as animals? PLoS Biol. 9:e1001067. doi: 10.1371/journal.pbio.1001067
Kozak, K. H., and Wiens, J. J. (2010). Accelerated rates of climatic-niche evolution underlie rapid species diversification. Ecol. Lett. 13, 1378–1389. doi: 10.1111/j.1461-0248.2010.01530.x
Leao, T. C. C., Fonseca, C. R., Peres, C. A., and Tabarelli, M. (2014). Predicting extinction risk of Brazilian Atlantic forest angiosperms. Conserv. Biol. 28, 1349–1359. doi: 10.1111/cobi.12286
Lee, T. M., and Jetz, W. (2011). Unravelling the structure of species extinction risk for predictive conservation science. Proc. R. Soc. B Biol. Sci. 278, 1329–1338. doi: 10.1098/rspb.2010.1877
Lefcheck, J. S. (2015). piecewiseSEM: piecewise structural equation modelling in r for ecology, evolution, and systematics. Methods Ecol. Evol. 7, 573–579.
Lesica, P., Yurkewycz, R., and Crone, E. E. (2006). Rare plants are common where you find them. Am. J. Bot. 93, 454–459. doi: 10.3732/ajb.93.3.454
Lozano, F. D., and Schwartz, M. W. (2005). Patterns of rarity and taxonomic group size in plants. Biol. Conserv. 126, 146–154.
Lu, L. M., Mao, L. F., Yang, T., Ye, J. F., Liu, B., Li, H. L., et al. (2018). Evolutionary history of the angiosperm flora of China. Nature 554, 234–238. doi: 10.1038/nature25485
Maliet, O., Gascuel, F., and Lambert, A. (2018). Ranked tree shapes, nonrandom extinctions, and the loss of phylogenetic diversity. Syst. Biol. 67, 1025–1040. doi: 10.1093/sysbio/syy030
McElwain, J. C., and Punyasena, S. W. (2007). Mass extinction events and the plant fossil record. Trends Ecol. Evol. 22, 548–557. doi: 10.1016/j.tree.2007.09.003
Nakagawa, S., and Schielzeth, H. (2013). A general and simple method for obtaining R2 from generalized linear mixed-effects models. Methods Ecol. Evol. 4, 133–142. doi: 10.1093/sysbio/syy060
Nic Lughadha, E., Bachman, S. P., Leão, T. C., Forest, F., Halley, J. M., Moat, J., et al. (2020). Extinction risk and threats to plants and fungi. Plants People Planet 2, 389–408.
Nic Lughadha, E., Canteiro, C., Bachman, S., Baines, D., Gardiner, L., Meagher, T. R., et al. (2017). “Extinction risk and threats to plants,” in State of the World’s Plants, ed. K. J. Willis (London: Royal Botanic Gardens Kew), 72–77.
Pennell, M. W., Eastman, J. M., Slater, G. J., Brown, J. W., Uyeda, J. C., FitzJohn, R. G., et al. (2014). geiger v2.0: an expanded suite of methods for fitting macroevolutionary models to phylogenetic trees. Bioinformatics 30, 2216–2218. doi: 10.1093/bioinformatics/btu181
Pimm, S. L., Jenkins, C. N., Abell, R., Brooks, T. M., Gittleman, J. L., Joppa, L. N., et al. (2014). The biodiversity of species and their rates of extinction, distribution, and protection. Science 344:1246752. doi: 10.1126/science.1246752
Pio, D. V., Engler, R., Linder, H. P., Monadjem, A., Cotterill, F. P., Taylor, P. J., et al. (2014). Climate change effects on animal and plant phylogenetic diversity in southern Africa. Glob. Chang. Biol. 20, 1538–1549. doi: 10.1111/j.1365-294X.2007.03328.x
Powers, R. P., and Jetz, W. (2019). Global habitat loss and extinction risk of terrestrial vertebrates under future land-use-change scenarios. Nat. Clim. Chang. 9, 323–329.
Purvis, A., Gittleman, J. L., Cowlishaw, G., and Mace, G. M. (2000b). Predicting extinction risk in declining species. Proc. R. Soc. B Biol. Sci. 267, 1947–1952. doi: 10.1098/rspb.2000.1234
Purvis, A., Agapow, P.-M., Gittleman, J. L., and Mace, G. M. (2000a). Nonrandom extinction and the loss of evolutionary history. Science 288, 328–330.
R Core Team (2016). R: A Language and Environment for Statistical Computing. Vienna: R Foundation for Statistical Computing.
Ran, Y., Li, X., and Lu, L. (2010). Evaluation of four remote sensing based land cover products over China. Int. J. Remote Sens. 31, 391–401. doi: 10.1080/01431160902893451
Sakai, A. K., Wagner, W. L., Mehrhoff, L. A., and Funk, V. (2002). Patterns of endangerment in the Hawaiian flora. Syst. Biol. 51, 276–302. doi: 10.1080/10635150252899770
Shipley, B. (2013). The AIC model selection method applied to path analytic models compared using a d-separation test. Ecology 94, 560–564. doi: 10.1890/12-0976.1
Sjöström, A., and Gross, C. L. (2006). Life-history characters and phylogeny are correlated with extinction risk in the Australian angiosperms. J. Biogeogr. 33, 271–290. doi: 10.1111/j.1365-2699.2005.01393.x
Steffen, W., Grinevald, J., Crutzen, P., and McNeill, J. (2011). The Anthropocene: conceptual and historical perspectives. Philos. Trans. R. Soc. A 369, 842–867. doi: 10.1098/rsta.2010.0327
Sui, X., Mao, L., Liu, Y., and He, F. (2018). Mapping relative extinction risk for biodiversity conservation. Biol. Conserv. 226, 168–176. doi: 10.1016/j.biocon.2018.07.012
Thuiller, W., Lavergne, S., Roquet, C., Boulangeat, I., Lafourcade, B., and Araujo, M. B. (2011). Consequences of climate change on the tree of life in Europe. Nature 470, 531–534. doi: 10.1038/nature09705
Vamosi, J. C., Magallón, S., Mayrose, I., Otto, S. P., and Sauquet, H. (2018). Macroevolutionary patterns of flowering plant speciation and extinction. Annu. Rev. Plant Biol. 69, 685–706. doi: 10.1146/annurev-arplant-042817-040348
Vamosi, J. C., and Vamosi, S. M. (2005). Present day risk of extinction may exacerbate the lower species richness of dioecious clades. Divers. Distrib. 11, 25–32.
Vamosi, J. C., and Wilson, J. R. U. (2008). Nonrandom extinction leads to elevated loss of angiosperm evolutionary history. Ecol. Lett. 11, 1047–1053. doi: 10.1111/j.1461-0248.2008.01215.x
Verde Arregoitia, L. D., Leach, K., Reid, N., and Fisher, D. O. (2015). Diversity, extinction, and threat status in Lagomorphs. Ecography 38, 1155–1165. doi: 10.1111/ecog.01063
Wickham, H. (2016). ggplot2: Elegant Graphics for Data Analysis. New York, NY: Springer-Verlag. doi: 10.1007/978-3-319-24277-4
Williams, S. E., Williams, Y. M., VanDerWal, J., Isaac, J. L., Shoo, L. P., and Johnson, C. N. (2009). Ecological specialization and population size in a biodiversity hotspot: how rare species avoid extinction. Proc. Natl. Acad. Sci. U.S.A. 106, 19737–19741. doi: 10.1073/pnas.0901640106
Wu, Z., Sun, H., Zhou, Z., Peng, H., and Li, D. (2007). Origin and differentiation of endemism in the flora of China. Front. Biol. China 2:125–143. doi: 10.1007/s11515-007-0020-8
Wu, Z., Raven, P. H., and Hong, D. (1994–2013). Flora of China. St. Louis, MO: Missouri Botanical Garden Press.
Xing, Y., and Ree, R. H. (2017). Uplift-driven diversification in the Hengduan Mountains, a temperate biodiversity hotspot. Proc. Natl. Acad. Sci. U.S.A. 114, E3444–E3451. doi: 10.1073/pnas.1616063114
Zhang, J., Nielsen, S. E., Chen, Y., Georges, D., Qin, Y., Wang, S. S., et al. (2017). Extinction risk of North American seed plants elevated by climate and land-use change. J. Appl. Ecol. 54, 303–312. doi: 10.1111/1365-2664.12701
Zhao, M., and Running, S. W. (2010). Drought-induced reduction in global terrestrial net primary production from 2000 through 2009. Science 329, 940–943. doi: 10.1126/science.1192666
Keywords: diversification rate, extinction risk, habitat loss, range size, structural equation models
Citation: Yu H, Sui X, Sun M, Yin X and Deane DC (2022) Relative Importance of Ecological, Evolutionary and Anthropogenic Pressures on Extinction Risk in Chinese Angiosperm Genera. Front. Ecol. Evol. 10:844509. doi: 10.3389/fevo.2022.844509
Received: 28 December 2021; Accepted: 14 February 2022;
Published: 15 March 2022.
Edited by:
Mauro Fois, University of Cagliari, ItalyReviewed by:
Simone Orsenigo, University of Pavia, ItalyDaniel Zhigila, University of Cape Town, South Africa
Copyright © 2022 Yu, Sui, Sun, Yin and Deane. This is an open-access article distributed under the terms of the Creative Commons Attribution License (CC BY). The use, distribution or reproduction in other forums is permitted, provided the original author(s) and the copyright owner(s) are credited and that the original publication in this journal is cited, in accordance with accepted academic practice. No use, distribution or reproduction is permitted which does not comply with these terms.
*Correspondence: Haibin Yu, yuhb.18b@gzhu.edu.cn