Correlations and dominant climatic factors among diversity patterns of plant families, genera, and species
 Yu Mo1†
  Tianyu Li2†
  Yajing Bao1* Jing Zhang1 Yu Zhao1 Jiaqi Ye3 Yilong Zhang1 Weize Wu3 Jizhe Tang1
  Zhenghai Li1*
- 1College of Environment and Resources, Dalian Minzu University, Dalian, China
- 2College of Information Engineering, Dalian University, Dalian, China
- 3School of Ecology and Environment, Inner Mongolia University, Hohhot, China
At present, the relationship between the diversity distribution patterns of different taxonomic levels of plants and climatic factors is still unclear. This paper explored the diversity pattern of vascular plant families, genera, and species in China at the municipal scale. It also studied the effects of accumulated temperature ≥ 10°C, annual precipitation, and hydrothermal base which reflect the effect of hydrothermal resources on the plant diversity pattern. The results showed that: There were extremely significant correlations among the diversities of plant families, genera, and species, and the interpretation degree of diversity between adjacent the taxonomic levels was more than 90%. The diversity pattern of plant families was mainly affected by dominant climatic state indicators such as the maximum value of accumulated temperature, annual precipitation, and hydrothermal base, and the gradient range of the hydrothermal base, which showed a clear latitudinal gradient law. The diversity pattern of plant species was found to be mainly dependent on the climatic heterogeneity indicators, being closely related to the heterogeneity indicators and sum indicators of the hydrothermal base. It was also affected by the range of precipitation gradient range. Plant genus and its diversity pattern are not only significantly affected by heterogeneity and sum indicators but also closely related to climate state indicators. In comparison with the humidity index in vegetation ecological studies, the related indicators of the hydrothermal base proposed in this paper excelled at revealing the relationship between climate and diversity patterns of plant families, genera, and species, and could effectively solve the species-area relationship issue in arid and low-temperature areas. The results of this paper have presented important theoretical and practical values for comprehensively understanding the correlation between climate and diversity of plant families, genera, and species, clarifying the impact of climate difference and climate change on plant diversity.
Introduction
The spatial distribution pattern of biodiversity and its causes are one of the research hotspots in regional ecology and biogeography (Guisan et al., 2013; Paquette et al., 2021). So far, more than 100 theoretical hypotheses have been proposed supporting the biodiversity pattern (Palmer, 1994). The fact that numerous hypotheses have been put forward, it highlights the complexity of the internal mechanism of biodiversity, and also, demonstrates that a general hypothesis has not yet been formed. The latitudinal gradients in species diversity, which is widely recognized by the academic community, explains the causes of biodiversity patterns from the perspective of heat. This hypothesis has been gradually developed into productivity hypothesis (Brown, 1981), ambient energy hypothesis (Turner, 2004), and water-energy dynamic hypothesis (O’Brien, 2006). To study the biodiversity distribution pattern, many long-term studies were conducted to reveal and verify the latitude gradient law of biodiversity, and the biological groups involved including insects, birds, and mammals (Xu et al., 2015; Zou et al., 2020; Barreto et al., 2021; Zhao et al., 2021; Parr and Bishop, 2022). Thereinto, many studies have focused on plants (He et al., 2020; Testolin et al., 2021; Qian et al., 2022).
Numerous studies have confirmed the close relationship between biodiversity and environmental factors in certain regions (Wang et al., 2007; Xu et al., 2019). However, the dominant environmental factors affecting the biodiversity distribution pattern in different regions are significantly different, among which temperature and precipitation play a dominant role in the spatial distribution pattern of plant diversity (Walck et al., 2011; McLaughlin et al., 2017; Chen and Su, 2020; Song et al., 2021). In most of the studies related to plant diversity patterns and climatic factors, many scholars have chosen the mean value of climatic factors in their research, such as annual mean temperature and annual mean precipitation (Chu et al., 2019; Gu et al., 2020). Some studies have also used indicators, such as maximum temperature of the warmest month and minimum temperature of the coldest month, and precipitation of the wettest month and driest month to study the effects of temperature and precipitation on plant diversity under extreme conditions (Shrestha et al., 2018). Chen selected the standard deviation of mean monthly temperature, the range of mean annual temperature, the standard deviation of mean monthly precipitation, and the range of annual precipitation on the time scale to study the impact of habitat heterogeneity on the diversity pattern (Chen et al., 2015). However, these studies all used point data of the survey areas, while biodiversity pattern is a regional ecological issue. According to Shelford’s law of tolerance and the latitudinal gradients in species diversity, the level of biodiversity in a region is closely related to its geographic location, hydrothermal gradient range, and spatial heterogeneity of the climate and environment (Shelford, 1931).
Due to the unique climatic conditions and topography, complex and diverse habitats have been formed in China, allowing a great wealth of species to survive and represent excellent materials for the study of large-scale geographic patterns of biodiversity (Ge et al., 2015; Zhang M. et al., 2017). Currently, most of the research focuses on the impact of climatic factors on the species-level diversity distribution of different floras. The distribution of seed plant diversity in China is mainly affected by temperature and precipitation seasonality, potential evapotranspiration, and humidity index, of which temperature seasonality is the most important factor (Li et al., 2015). In bryophytes, however, the effect of water is greater than that of the temperature (Qian and Chen, 2016). An investigation showed the use of woody plants as ideal taxa to study the relationship between diversity and climate. Wang believed that mean temperature of the coldest quarter was the most prominent predictor of woody species richness (Wang et al., 2010). Whereas Qian’s research on the provincial scale in China suggested that temperature seasonality was the optimal predictor of woody species richness in China (Qian, 2013). There are also some studies that focused on a certain family of plants, such as Orchidaceae and Primulaceae (Zhang et al., 2015; Bai et al., 2020), or a certain genus, or both plant families and genera (Huang et al., 2016) or plant families, genera, and species (Huang et al., 2021). In the above studies, the dominant climatic factors of different taxa are distinct, and there are few studies focusing on the correlations on the diversities at different taxonomic levels (Wang et al., 2012; Fang et al., 2022). Limited research has been conducted to reveal the dominant climatic factors that determine the diversity pattern of plant families, genera, and species in China and its consistencies. In this context, clarifying the dominant climatic factors of plant diversity facilitates a better understanding of latitudinal diversity patterns and the identification of priority areas for plant diversity conservation on a global or regional scale based on spatial and temporal patterns of climatic factors.
To study the distribution pattern of plant families, genera, and species and their relationship with climatic factors, plant data (335 families, 3326 genera, and 25,213 species) were collected to conduct research at the municipal-level in China. The study aimed at exploring two main aspects: (a) the diversity distribution patterns of plant families, genera, and species in China and their correlations, and (b) the dominant climatic factors restricting the diversity of plant families, genera, and species in China.
It was hypothesized that:
1. The diversity distribution patterns of plant families, genera, and species are closely related.
2. There are significant differences in terms of the dominant climatic factors affecting the diversity patterns of plant families, genera, and species.
3. The hydrothermal base reflecting the hydrothermal coupling effect has broad application prospects in the study of biodiversity patterns.
Materials and methods
Plant diversity data
To clarify the relationship between the distribution pattern of plant diversity and climate, vascular plant data in China were downloaded from the Global Biodiversity Information Facility (GBIF) database. First, in the basic records, preserved specimens were selected as the primary data source. Second, for mainland China data, data recorded by the Chinese Academy of Sciences (CAS) were selected to ensure the consistency of data sources. The data of Taiwan Province was sparse in the CAS data, and thus the data source was expanded. Finally, according to Hou’s vegetation map of China (1:1 million) (Hou, 2019), the areas with too little plant data were merged according to similar vegetation types, and the units with too small areas were merged. Among them, Taiwan Province and Hainan Province were counted separately because they are islands. Finally, 237 study units were counted, with a total of 335 families, 3326 genera, and 25,213 species of plants, and 1,364,986 events occurred. Details data is shown in Supplementary materials.
Environmental data
According to Shelford’s law of tolerance, based on the habitat heterogeneity hypothesis, and regional ecological connotation of biodiversity pattern, several regional climate indicators were designed and employed. Shelford’s law of tolerance (Shelford, 1931) states that the existence and reproduction of organisms depend on a variety of ecological factors, but when a certain factor is insufficient or excessive, it will exert a limiting effect on the organism. In other words, organisms have upper and lower limits of tolerance to each of the ecological factors, and the range between the upper and lower limits is the tolerance range of organisms to this ecological factor. This is referred to as the ecological amplitude of organisms. The latitudinal gradients in species diversity is of the opinion that biodiversity is closely related to the geographic location and climate status. Whereas the habitat heterogeneity hypothesis presumes that areas with higher heterogeneity often have higher biodiversity. Therefore, six regional climate indicators were proposed in this paper, including the ones that reflect the gradient variation range and intensity of hydrothermal climate factors in the region, and the maximum, minimum, and sum of climate factors that reflect the geographical location of the region. At the same time, this paper also proposed a factor reflecting the abundance of hydrothermal resources, the hydrothermal base, to study the effect of hydrothermal coupling and its effect on biodiversity. On this basis, the correlation between biodiversity patterns and climate was studied in depth. Firstly, the main climatic factors were spatially interpolated at a certain resolution, which enabled each geographic unit to contain a large number of basic units. Secondly, the maximum value (MAX), minimum value (MIN), mean value (MEAN), climate gradient range (RANGE), standard deviation (STD), sum value (SUM), and other indicators of various climate factors were extracted in each study unit. These indicators included not only the climatic mean indicators of the study unit used in the previous studies, but also represented the indicators reflecting the climatic state and geographical location of the study units (MAX, MIN, and MEAN), the climatic gradient range indicator (RANGE), the climate heterogeneity indicator (STD), and climate resource sum indicators (SUM). To facilitate a more comprehensive and in-depth exploration of the impact of climatic factors on plant diversity patterns, MAX and MIN of climatic factors were selected within the study area to represent the upper and lower limits of regional climatic factors. RANGE of the study unit was taken to indicate the ecological amplitude of plant families, genera, and species. STD and SUM indicate the fluctuation and total amount of climatic factors in the region, respectively. The above six indicators of different climatic factors could be divided into three categories according to their own attributes— (1) state indicators: MIN, MAX, and MEAN; (2) heterogeneity indicators: STD and RANGE; and (3) environmental sum indicator: SUM (Figure 1).
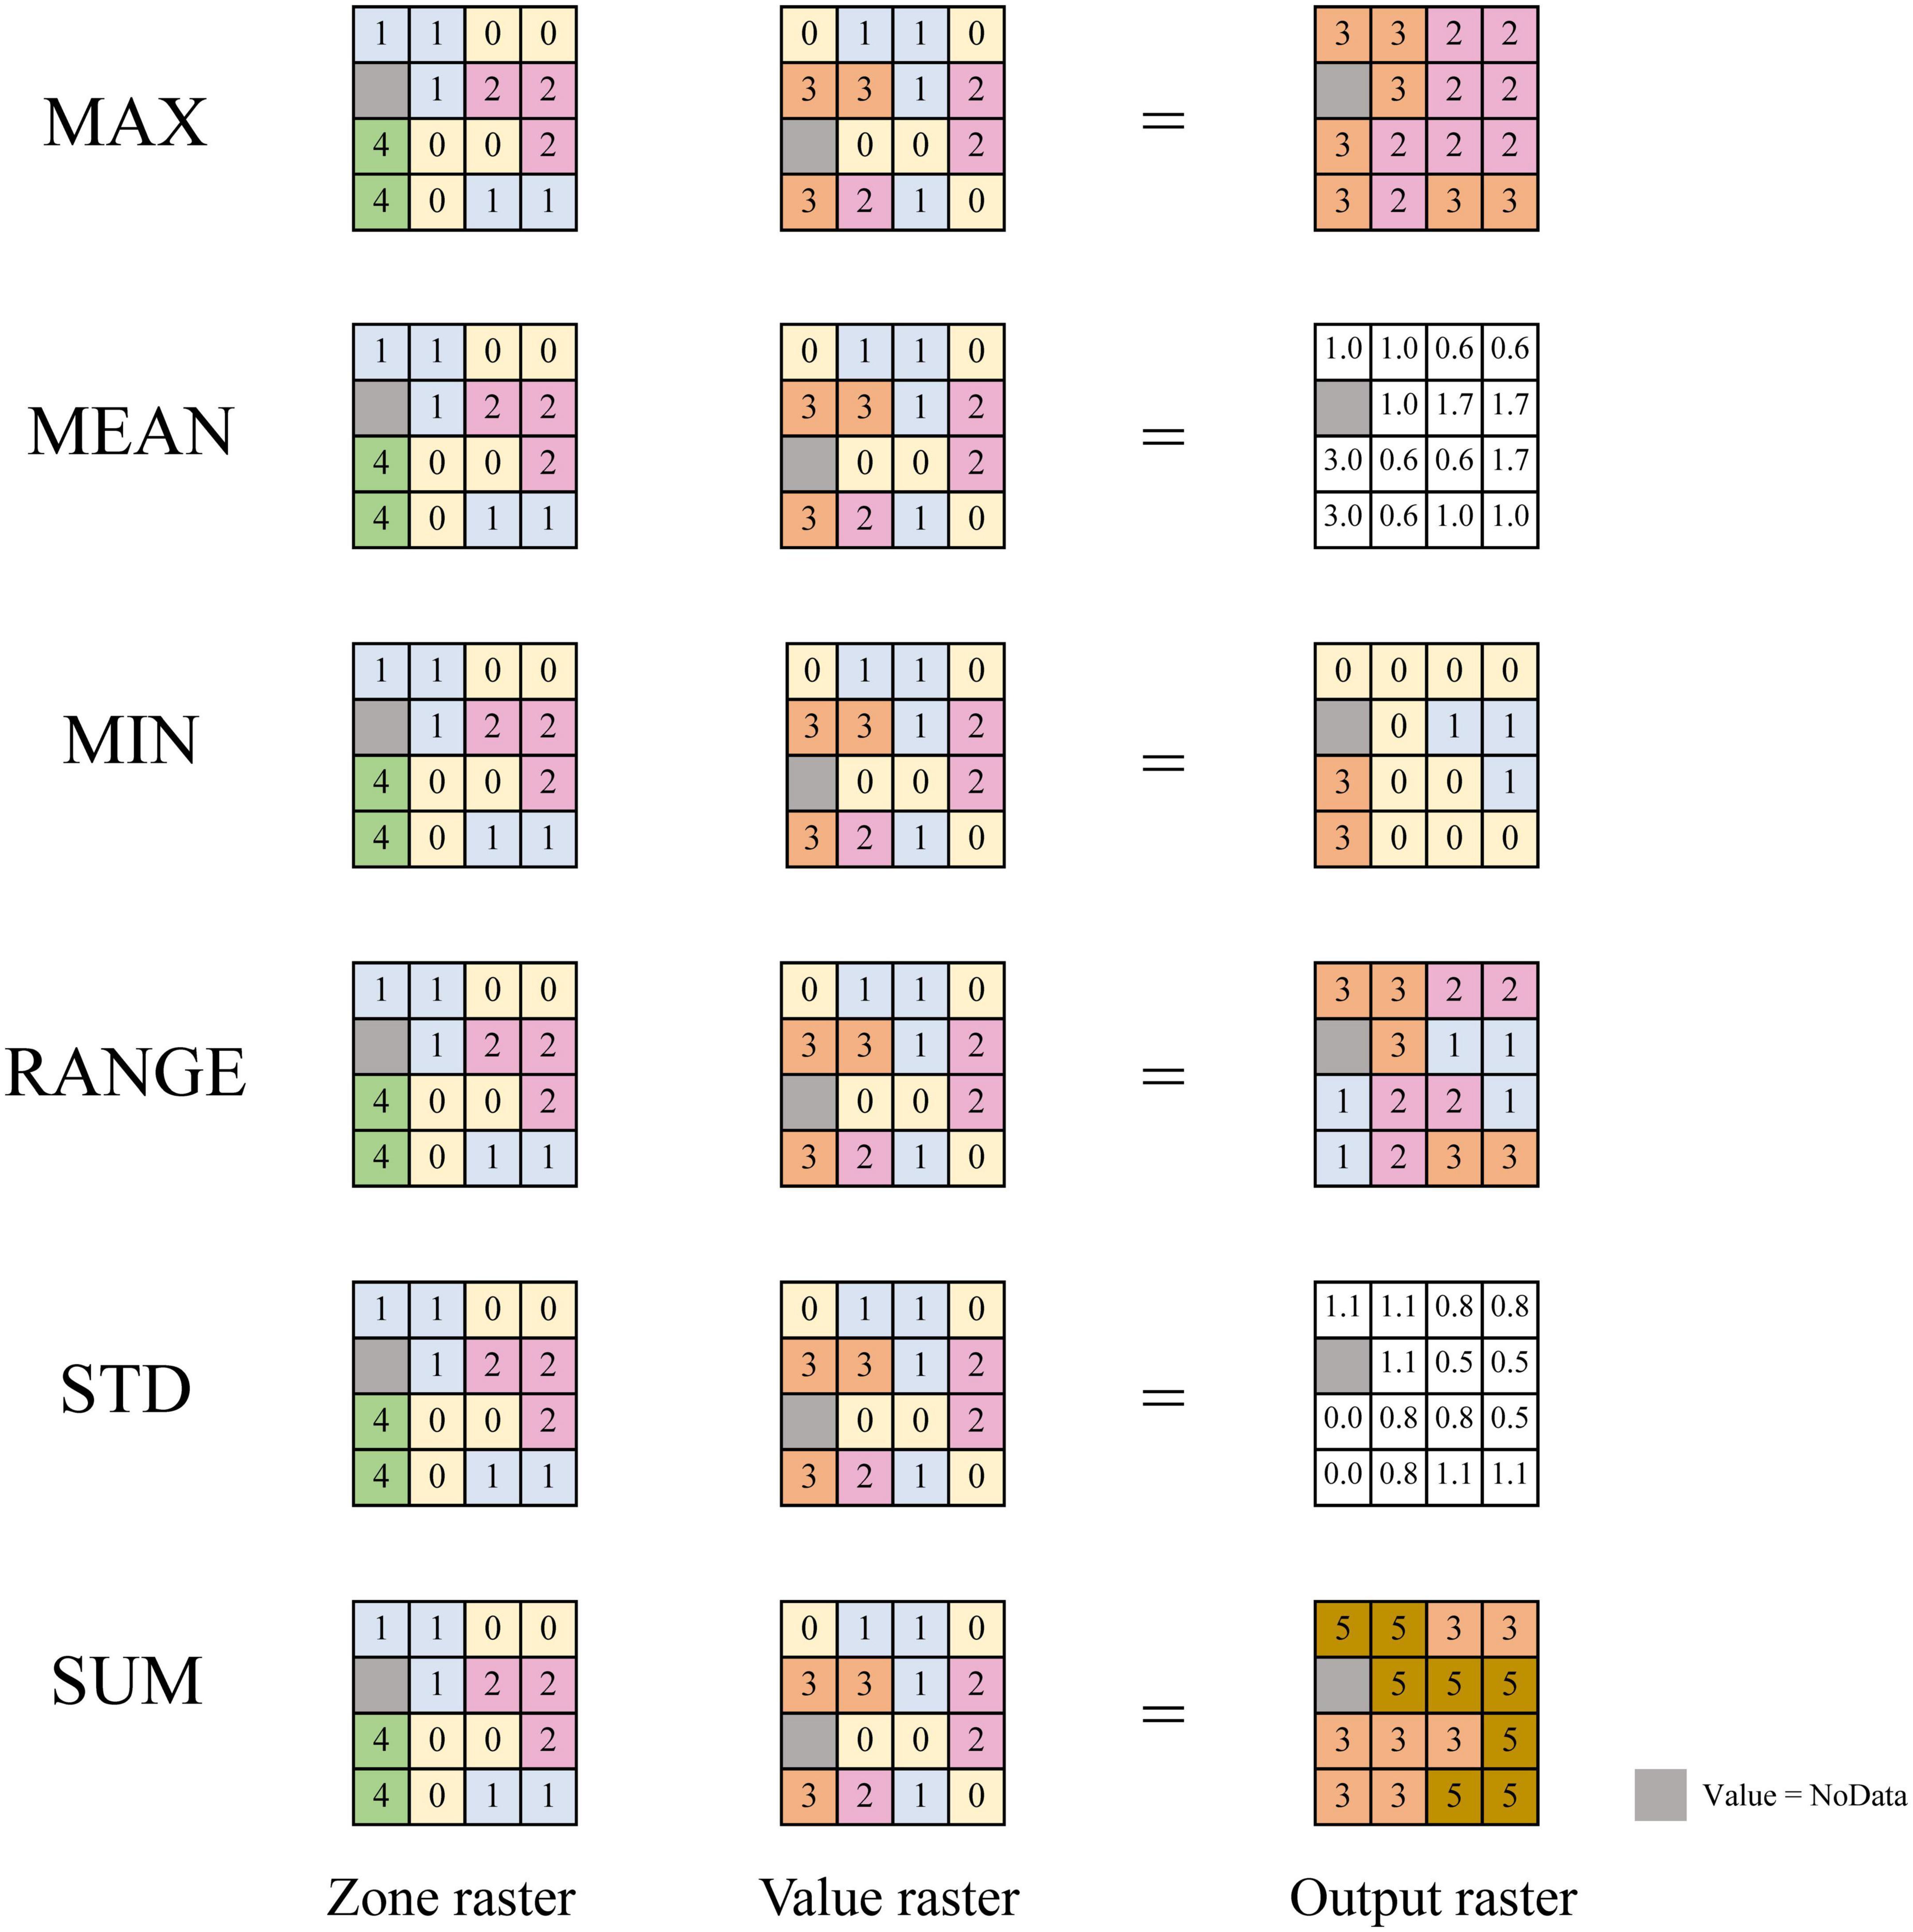
Figure 1. Regional climate indicator. Zone raster: defines the zones, same number for the same area, different numbers for different areas. Value raster: contains the climatic input values used in calculating the output for each zone. Output raster: the result of the statistic applied to the climatic value input. Refer to the zonal statistics description in ArcGIS. MAX, the largest value of all cells in the value raster that belong to the same zone as the output cell will be calculated; MEAN, the average of all cells in the value raster that belong to the same zone as the output cell will be calculated; MIN, the smallest value of all cells in the value raster that belong to the same zone as the output cell will be calculated; RANGE, the difference between the largest and smallest value of all cells in the value raster that belong to the same zone as the output cell will be calculated; STD, the standard deviation of all cells in the value raster that belong to the same zone as the output cell will be calculated; SUM, the total value of all cells in the value raster that belong to the same zone as the output cell will be calculated.
The core of plant diversity pattern research revealed the regional distribution pattern of the plant groups. Climate factors with regular distribution, such as heat (temperature and solar radiation) and precipitation, have significant impacts on plant growth, development, and distribution (Jiao et al., 2017; Öder et al., 2021). Three main climatic factors, the annual mean accumulated temperature ≥ 10°C, the mean annual precipitation, and the hydrothermal base reflecting the abundance and shortage of hydrothermal resources and the hydrothermal coupling effect, were selected in this study. The climates from a total of 825 meteorological stations, ranging a total of 70 years (1951–2020), were retrieved from China Surface Climate Data Daily Value Dataset (V3.0) on the China Meteorological Data Service Centre.1 Annual cumulative precipitation and annual accumulated temperature ≥ 10°C of each station were obtained. The layer of annual mean accumulated temperature ≥ 10°C, annual mean precipitation, and hydrothermal base were acquired [hereafter referred to as accumulated temperature (T), precipitation (P), and hydrothermal base (TP), respectively]. The cell size of accumulated temperature (T), precipitation (P), and hydrothermal base (TP) was 5 km.
Hydrothermal base and climate data processing
Firstly, the meteorological data were processed using SQL language in Access 2016 to obtain the annual accumulated precipitation and the annual ≥ 10°C accumulated temperature at each station. Secondly, a spatial resolution of 5 km was achieved using kriging interpolation in the spatial analysis module of ArcGIS 10.8. The layer of annual mean accumulated temperature ≥ 10°C, and annual mean precipitation, ranging a total of 70 years (1951–2020), were acquired, respectively. Since the hydrothermal base is the layer superposition (based on the pixel with a spatial resolution of 5 km) of the ≥ 10°C accumulated temperature and the annual precipitation, its value is the product of the two factors, and it is a new climatic factor indicating the coupled effect of water and heat. TP using the following equations:
Finally, using a raster calculator, the average value of both the ≥ 10°C accumulated temperature and the annual precipitation throughout the 70 years were obtained using the following equations:
where T10 represents the average annual ≥ 10°C accumulated temperature from 1951 to 2020; aTEMi represents the annual ≥ 10°C accumulated temperature in year i, n = 70; P represents the average annual precipitation between 1951 and 2020, and aPRCPi represents the cumulative value of precipitation in year i; TP represents the average hydrothermal base between 1951 and 2020, and aTPi represents the cumulative value of hydrothermal base in year i.
Data analyses
The “corr” package was used to analyze the correlation between climatic factors and the diversity patterns of plant families, genera, species, determining the main constraints corresponding to their diversity patterns. The random forest (RF) model can effectively deal with the collinearity problem between variables and does not require the data to follow strict assumptions, such as homoscedasticity and error normality. To solve the collinearity problem among climatic factors, climatic factors were used as predictors of plant diversity. The RF models for plant families, genera. and species were separately established. The importance of various climatic factors was estimated using “Inc Node Purity” (increase in node purity), where the sum of residual squares represents the effect of each variable on the heterogeneity of the observations on each node of the classification tree. The larger the value, the more important is the variable. At the same time, the significance of each predictor on the response variable was assessed using the “rfPermute” package (Breiman, 2001).
Results
Diversity distribution patterns and correlations of plant families, genera, and species in china
The diversity distribution patterns of plant families, genera, and species in China showed a higher trend in the south and lower in the north, which conformed the latitudinal gradients in species diversity. The Hengduan Mountains in southwestern China is the center for plant diversity. Plant species diversities were found to be higher in Shannan area of Tibet, Sichuan, Yunnan, Guangxi, Hainan, and Taiwan as compared to the northwest, north, and northeast regions (Figure 2C). Similar to the diversity of plant species, the diversities of plant families and genera both showed a clear overall trend of latitudinal gradient (Figures 2A,B). However, the actual distribution showed a decreasing distribution pattern from southwest to northeast and toward the central and eastern coastal areas. At the same time, the degree of disparity in plant diversity within each study unit increased rapidly as the taxonomic level decreased. The study unit with the highest plant family diversity was 9 times than that of the lowest study unit, and the difference in plant genus diversity was 16 times. The difference in species diversity could be as high as 36-fold.
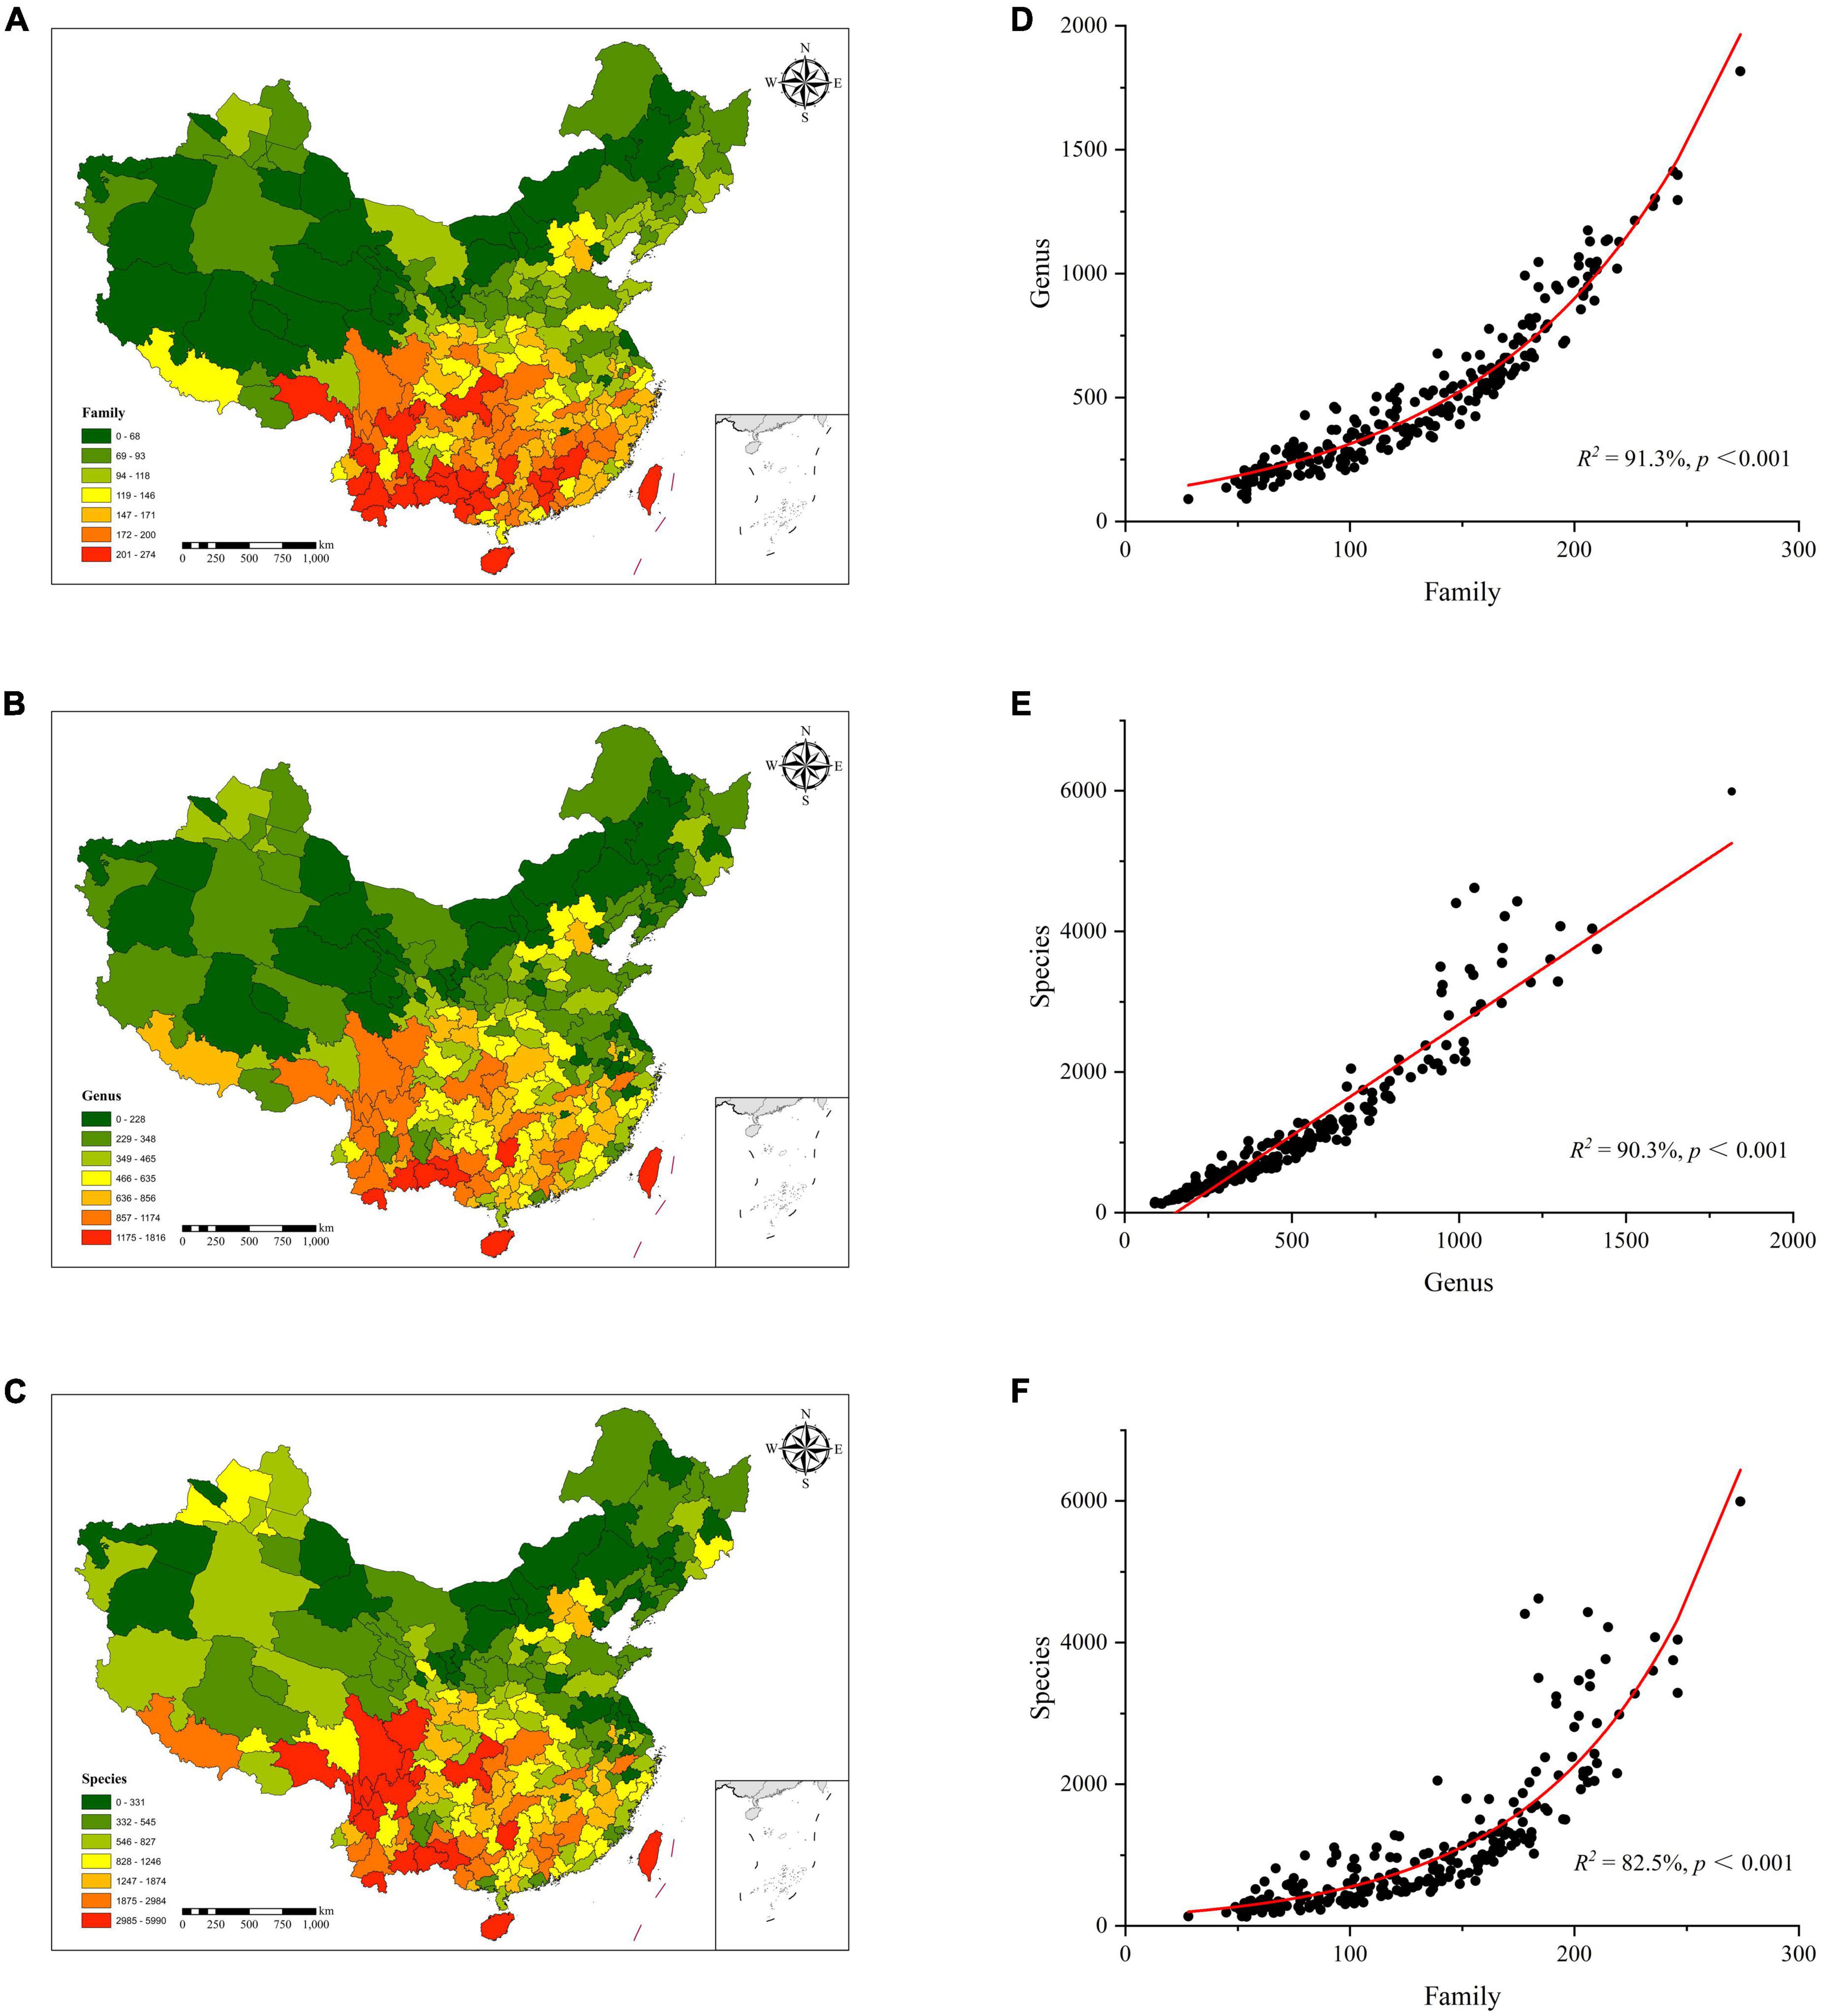
Figure 2. Plant diversity distribution patterns at family (A), genus (B), and species (C). (D) plant family diversity vs. plant genus diversity, (E) plant genus diversity vs. plant species diversity, (F) plant family diversity vs. plant species diversity.
There were clear relationships among plant families, genera, and species. Among them, there were obvious exponential relationships between the plant family diversity and genus diversity, and between plant family diversity and species diversity, which explained 91.3% and 82.5% of the changes in species diversity, respectively (Figures 2D,E). There was a significant linear relationship between plant genus diversity and species diversity, and plant genus diversity explained 90.3% of species variation (Figure 2F). The results showed that the correlation between the diversity of plant families and genera was the strongest, followed by plant genera and species, and plant families and species.
The diversity patterns of plant families, genera and species, and the correlation with climatic factors
Our correlation analysis revealed that the diversity of plant families in China was closely related to three state indicators (MAX, MEAN, and MIN), which reflected the annual accumulated temperature, annual precipitation, and hydrothermal base in the region. Among them, the maximum accumulated temperature (TMAX, r = 0.74, p < 0.001) had the greatest impact on plant family diversity patterns. The diversity of plant families was not significantly correlated with temperature heterogeneity indicators. The significance of its correlation with annual precipitation heterogeneity decreased. However, it showed a very significant correlation (p < 0.001) with heterogeneity indicator of the hydrothermal base reflecting the hydrothermal coupling effect, which was consistent with state indicators.
In contrast, the correlation between plant genus diversity and state indicators of climatic factors (MAX, MEAN, and MIN) in China were relatively higher, and the range of hydrothermal base (TPRANGE, r = 0.66, p < 0.001) had the greatest influence on the diversity pattern of plant genera. Meanwhile, the standard deviation and sum of the hydrothermal base (TPSTD, TPSUM) in the region also had an important influence on the diversity of plant genera.
Unlike the case of plant families and genera, in the correlation between plant species diversity and climate in China, the relationship between the diversity and state indicators (MAX, MEAN, and MIN), which reflect the regional climate factors, were significantly lower. While the correlation between diversity and indicators reflecting the climate and habitat heterogeneity showed significant improvement. The range of hydrothermal base (TPRANGE, r = 0.61, p < 0.001) was the optimal predictor of species diversity pattern.
As shown in Table 1, both plant family divert and genus diversity showed a negative correlation with the regional area indicator (COUNT), showing a high level of significance with family and genus diversities (p < 0.05). At the same time, there was a significantly negative correlation between the sum of accumulated temperature (TSUM) and family diversity (p < 0.05). However, no significant correlation was found between TSUM and genus diversity (r = -0.02) or species diversity (r = 0.03).
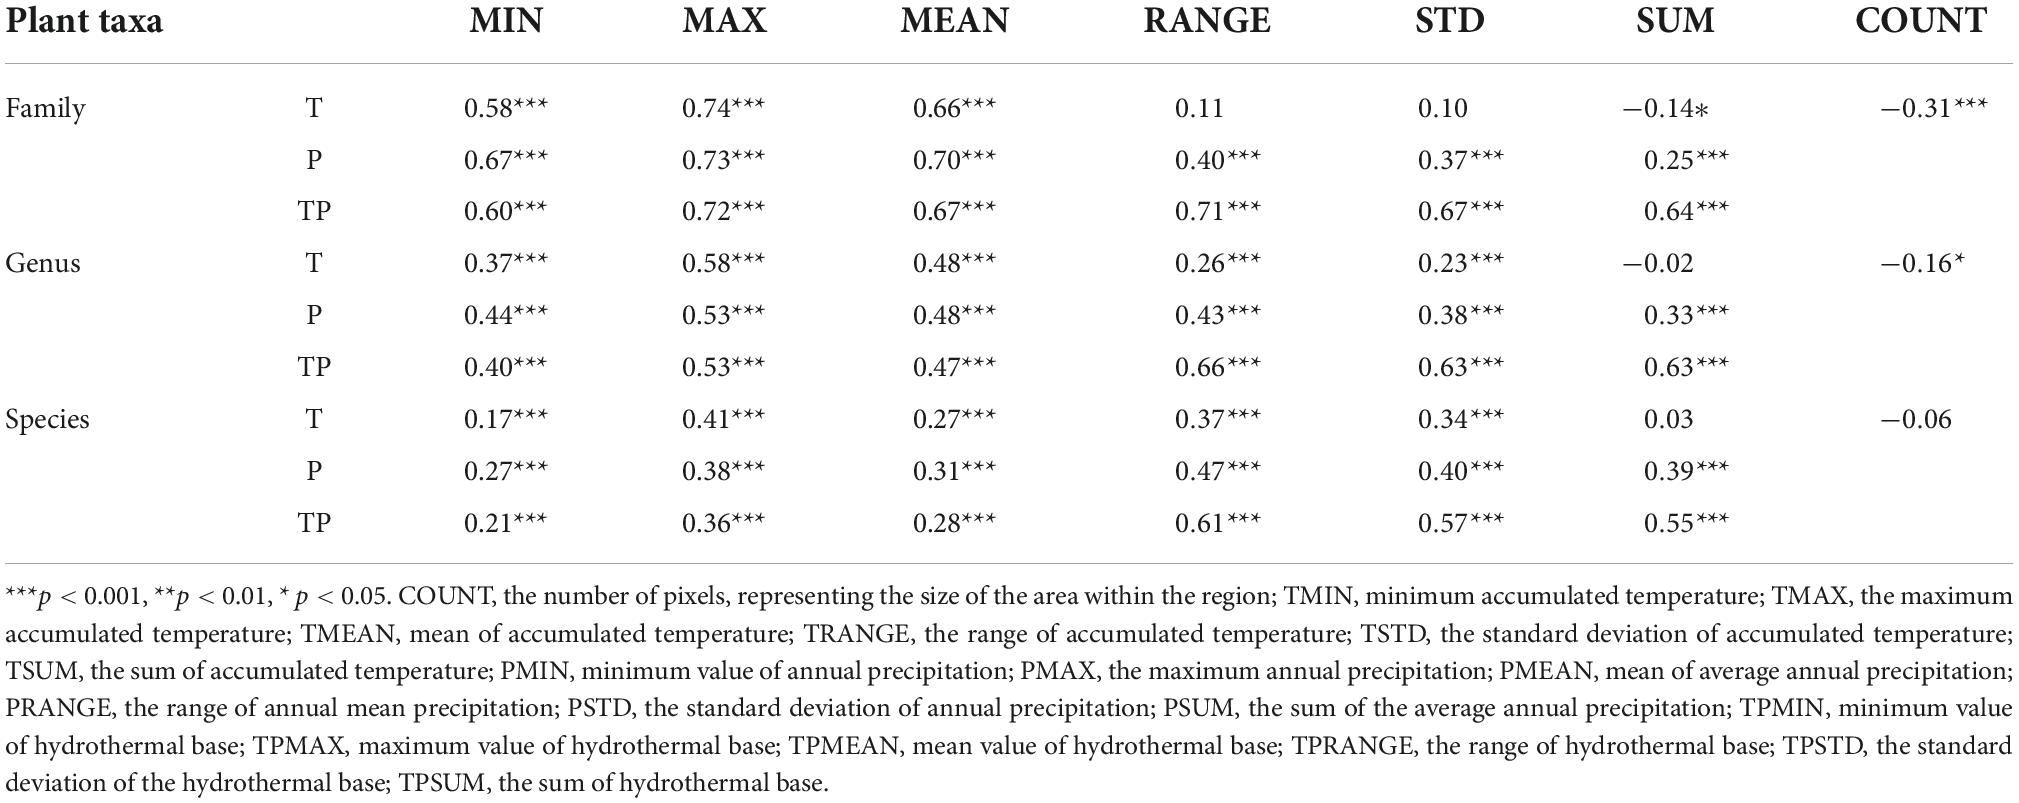
Table 1. Correlation between the diversity patterns of plant families, genus, and species and climatic factors.
Dominant climatic factors affecting the diversity patterns of plant families, genera, and species
To solve the collinearity problem among climatic factors, RF was used to analyze the effect of 18 climatic factors on the diversity patterns of plant families, genera, and species. The interpretation degrees of climatic factors to the diversity distribution of plant families, genera, and species were found to be 70.7, 52.5, and 46.0%, respectively. In general, climate was found to be the main environmental factor affecting plant distribution, and it was closely related to the diversity pattern of plant families. Among all the climatic factors, TMAX, TPRANGE, the maximum hydrothermal base (TPMAX), and the maximum precipitation (PMAX) were the most important ones affecting the distribution of plant families (Figure 3A). As the most basic taxonomic unit, plant species are affected by TPRANGE, TPSUM, TPSTD, and the range of precipitation (PRANGE) (Figure 3C). The climatic factors that restrict the distribution of plant genera are similar to the climatic indicators that affect the plant families. On the other hand, they are consistent with the climatic indicators that restrict plant species (Figure 3B). In general, the distribution pattern of plant family diversity was mainly affected by the state and heterogeneity indicators in the climatic factors, whereas the plant species were jointly restricted by heterogeneity and sum indicators. Plant genus was in between, affected by state, heterogeneity, and sum climatic factors.
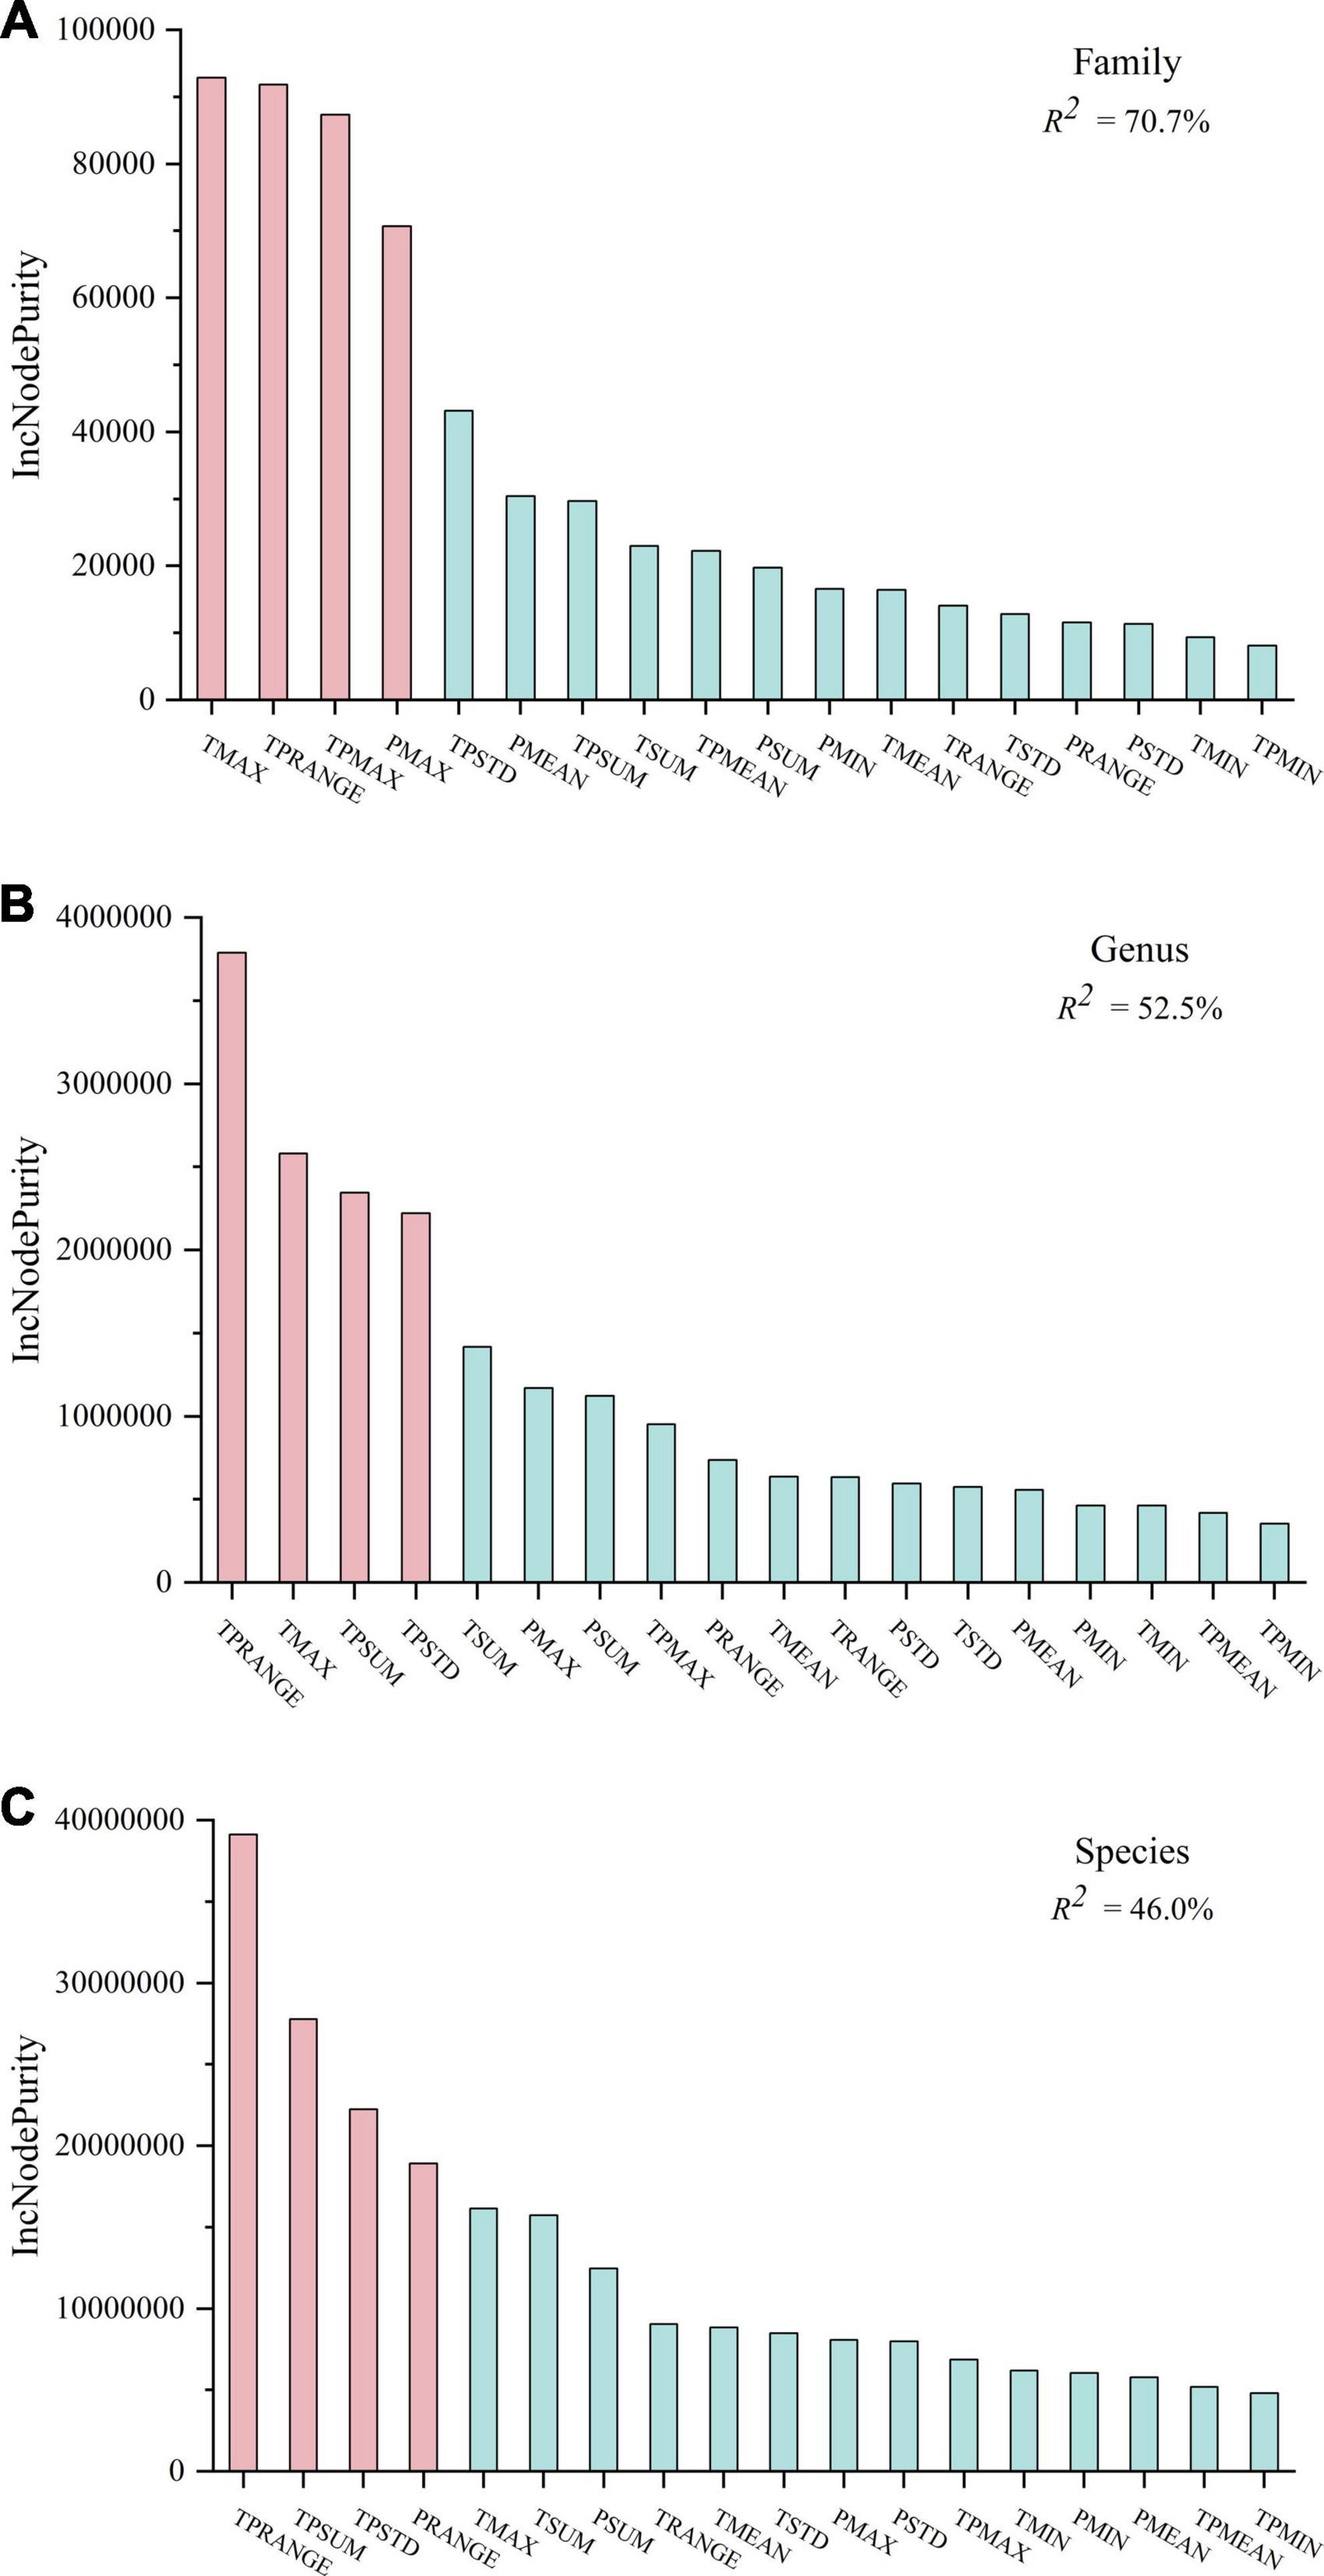
Figure 3. The random forest (RF) predictor importance of plant diversity distribution patterns at family (A), genus (B), and species (C). Significance levels are as follows: red represents P < 0.05 and blue represents P > 0.05. TMIN, minimum accumulated temperature; TMAX, the maximum accumulated temperature; TMEAN, mean of accumulated temperature; TRANGE, the range of accumulated temperature; TSTD, the standard deviation of accumulated temperature; TSUM, the sum of accumulated temperature. PMIN, minimum value of annual precipitation; PMAX, the maximum annual precipitation; PMEAN, mean of average annual precipitation; PRANGE, the range of annual mean precipitation; PSTD, the standard deviation of annual precipitation; PSUM: the sum of the average annual precipitation. TPMIN: minimum value of hydrothermal base; TPMAX: maximum value of hydrothermal base; TPMEAN: mean value of hydrothermal base; TPRANGE: The range of hydrothermal base; TPSTD: the standard deviation of the hydrothermal base; TPSUM: the sum of hydrothermal base.
Discussion
Accurate delineation of biodiversity patterns often requires detailed information on all plant species in the region. Although data acquisition is time-consuming, labor-intensive, and expensive (Balmford et al., 1996; Williams and Gaston, 1998), the gradual establishment and refinement of the correlation between the diversity of different plant taxa is conducive to a more comprehensive understanding of the distribution law of biodiversity (Mi et al., 2021). In this paper, 335 families, 3,326 genera, and 25,213 species of vascular plants with recorded specimens in China were analyzed which showed that there were very significant correlations among the diversities of plant families, genera, and species. The plant families and genera contained a large number of species with similar biological traits and ecological niches, as well as species with similar responses to energy and water (Huang et al., 2021). In the study of biodiversity, the use of high taxonomic ranks instead of species-level studies have yielded remarkable results in different biological groups (Negi and Gadgil, 2002). However, there are questions about the replacement of lower taxonomic ranks by high taxonomic ranks classes. For example, high taxonomic ranks does not accurately reflect species-level responses to environmental change (Rosser and Eggleton, 2012). Our results shown that diversity relationships between plant genera and plant families, species could be explained to over 90% and that the dominant climatic factors governing the diversity of plant genera are similar to those of plant families and species. This suggested that plant genera are used as a surrogate for plant species in the absence of sufficient sample data and detailed surveys.
China has a wide range of hydrothermal gradient range as well as a complex and diverse geographical environment, providing an ideal place to carry out research on the diversity patterns of plant families, genera, and species and their relationship with climate (Huang et al., 2011). In this study, the diversities of plant families, genera, and species all showed a very significant correlation with the mean value of each climatic factor. This result is consistent with the previous studies on plant diversity patterns using point data (Holger, 2007; Godoy-Bürki et al., 2017; Testolin et al., 2021). However, as shown in Table 1, from families to genera to species, with the decrease in the taxonomic level, the correlation and interpretation degree of the mean value of various climatic factors to the diversity rapidly decreased. It is possible that the ecological range of plant species is narrower, while the ecological range of plant families and genera is wider, which is consistent with a gradual decrease in plant threat levels with increasing latitude (Peng et al., 2021). Fluctuations in the external environment may allow plant species to acquire higher tolerance in order to cope with the effects of unfavorable conditions on themselves (Zhang and Tielbörger, 2019; Perez and Feeley, 2021).
Although plant families, genera, and species were closely related, the overall distribution pattern of plant diversity in China was in line with the latitudinal gradients in species diversity. However, the results presented in Table 1 and Figure 3 showed that without using the mean value alone, there were significant differences among the climate indicators that dominated the diversity distribution patterns of plant families, genera, and species. The plant family diversity pattern was mostly affected by the maximum accumulated temperature (TMAX) in the region, implying its abundancy in low latitude areas with high accumulated temperature, with an obvious latitudinal gradient of plant family diversity. This result is in line with ambient energy hypothesis (Turner, 2004). Studies on different regions and taxa also suggested that the diversity pattern is largely controlled by energy factors (Clarke and Gaston, 2006). On the global and regional scales, temperature seasonality is the main factor affecting the distribution of plant families (Huang et al., 2021), and some studies suggested that the daily maximum temperature might be more important (Vonlanthen et al., 2006). Plant genus was found to be closely related to climate state indicators (especially TMAX). At the same time, the diversity pattern of plant genera was more affected by climatic heterogeneity indicators and total precipitation.
The diversity pattern of plant species was mainly restricted by climatic heterogeneity, total amount of hydrothermal resources, and the range of precipitation gradient. Compared with families and genera that contain several plant types and have a wider distribution range, species-level taxa of plant species have a narrower range of physiological tolerance to climatic factors (Bruelheide et al., 2018; Gong and Gao, 2019). The growth of individual plants and the spread and distribution of populations require a more specialized and suitable climate and environment, which is often associated with topographical changes (Večeřa et al., 2019). The diversity distribution pattern of low-level plant taxa is more suitable for the habitat heterogeneity hypothesis (Shmida and Wilson, 1985). The results showed that the climatic temporal heterogeneity (annual temperature difference) in the study area played an important role in the distribution of Theaceae plants in southern China that indirectly supports the conclusions of this paper (Zhang et al., 2016). The three hotspot regions with abundant plant diversity (Hengduan range, C. China and Lingnan region) identified by Ying are all areas displaying high habitat heterogeneity with complex topography and diverse climate (Ying, 2001). The characteristics of topography and hydrothermal changes in China make the diversity pattern of plant species. In some cases, the diversity pattern of genera shows a gradual decrease in the distribution pattern from southwest to northeast.
Therefore, it was concluded that the dominant climatic factors affecting the diversities of plant families, genera, and species were different; As a result, it also showed a certain degree of difference. In this study, after introducing regional climate indicators (state, heterogeneity, and sum indicators), it was found that the climatic mean values were not the most suitable climate indicators for studying the diversities of plant families, genera, and species. At present, the research of biodiversity mainly focuses on plant species level (Wang et al., 2010). The biggest problem of selecting the average value of environmental factors is to weaken the spatial differences within the study area, and it is difficult to reflect the impact of environmental factors on biodiversity in the region. The biodiversity of the Hengduan Mountains in Yunnan Province of China is significantly higher than that of the surrounding areas due to terrain diversification and climate heterogeneity, but the average value of climatic factors is not much different between the Hengduan Mountains and the surrounding areas (Zhang et al., 2009; Cai et al., 2021). North Asia covers an area of about 3.5 million square kilometers more than China, but its plant species are only 6961 (Xue et al., 2020), while Chinese plant species are as high as 38,000 (Xie et al., 2021). The magnitude of the thermal gradient range is a major reason for the difference in plant diversity between China and North Asia. At the same time, RANGE is often used in altitudinal and precipitation to indicate the effect of heterogeneity on biodiversity (Kubota et al., 2007; Stein et al., 2014). Regional climate indicators can show the internal differences of climate factors in space, can better reflect the overall characteristics of the climate of the study unit and the impact of the total amount and area of climate resources on plant diversity, and can more accurately reflect the distribution pattern of biodiversity. The SUM can better reflect the same latitude or the same climate zone, and the number of climate resources in the research unit is difficult to reflect. For example, the climate types of China and the United States are similar in the same latitude zone, but the difference between China and the United States is difficult to reflect when using the average value (Qian et al., 2017; Yin et al., 2021). The SUM value is directly related to the total climate and area of the research unit. Climatic factors are often the main factors restricting the pattern of biodiversity (Zhang X. et al., 2017; Chu et al., 2019; Subedi et al., 2020). The data of annual average temperature, ≥ 10°C accumulated temperature and annual precipitation at global or regional scales can often be obtained by interpolation of climatic stations (Xu et al., 2022). Selecting different regional climate indicators to reveal the formation mechanism of biodiversity patterns on a larger scale can also determine the key protected areas of future biodiversity through future climate data. Regional climate indicators show the internal differences of climate factors in space, and more accurately reflect the distribution pattern of biodiversity.
Currently, the commonly used warmth index (WI) and moisture deficit (WD) reflect the dryness of a region and the Moisture index (MI) reflects the wetness of a region, but the combined effects of water and heat were not yet well explained (Fang and Yoda, 1989, 1990a,b). For annual actual evapotranspiration (AET) its numerical magnitude, although representing both energy and moisture, indirectly reflected the role of hydrothermal (Hawkins et al., 2003). The hydrothermal base proposed in this paper was derived from the product of the annual accumulated temperature and annual precipitation of each pixel, which was used to characterize the abundance of hydrothermal resources and the hydrothermal coupling bearing capacity of biodiversity for each pixel. Essentially, the hydrothermal base is a climatic factor that is independent of accumulated temperature and precipitation. For example, for a pixel located in a tropical desert area, although it has abundant heat and high accumulated temperature, its hydrothermal base will eventually become very low due to extreme drought and little rainfall. The objective manifestation is that the biodiversity in these areas is extremely scarce, which indicates that energy and water have a cumulative impact on plant diversity. In desert areas that has abundant energy but extremely dry climate and little rainfall, or wet and cold deserts with sufficient rainfall but extremely low temperature (e.g., the desert areas of Xinjiang and areas above the snow line of the Qinghai-Tibet Plateau in China), the vegetation development was extremely worse resulting in the deficiency of the plant species (Gao et al., 2012; Zhang et al., 2021). In a number of previous researches focusing on vegetation ecology, many scholars have used the humidity index (or Aridity index) (Hao and AghaKouchak, 2013; Kozlowski et al., 2015) reflecting the water-heat matching condition to carry out the research on the distribution law of vegetation based on the comprehensive effect of hydrothermal and climate factors (Coomes and Grubb, 2000). The natural zone theory proposed by V. V. Dokuchaiev, the distribution law of vegetation zone, and the ideal continental vegetation map proposed by H. Walter are all classic cases, effectively revealing the alternative distribution laws of the forest, grassland, and desert vegetation on the hydrothermal gradient (Richards et al., 1975; Simonson, 1995). Although rainy tropical rain forests with high-temperature and relatively drier cold temperate coniferous forests with low temperature are both forest vegetation, they display extremely significant differences in vegetation productivity, vegetation structure complexity, and plant species abundance. The hydrothermal base indicator reflecting the hydrothermal coupling bearing effect can effectively reveal this difference law.
Results in Table 1 and Figure 3 showed that among the 12 climate indicators dominating the diversity distribution patterns of plant families, genera, and species, hydrothermal base indicators accounted for 2/3. Among them, TMAX, which reflects the energy state of the study unit, was the main climatic indicator responsible of plant family and genus diversities. PMAX, which reflects the water state, had an important impact on the family diversity. PRANGE, which is a water heterogeneity indicator, had an important impact on the species diversity. According to these indicators, higher energy can speed up the plants’ metabolism, thereby increasing the rate of species evolution and higher diversity in the region (Gillooly et al., 2002; Allen and Gillooly, 2006). Moreover, these results also indicate the importance of precipitation factors, which are consistent with the water-energy dynamic hypothesis (O’Brien, 1998; Currie et al., 2004). In contrast, hydrothermal base indicators, which reflect the hydrothermal coupling effect, played a more important role in the diversity. TPRANGE, which reflects the abundance and shortage range of hydrothermal resource gradient, had an important impact on the diversity of plant families, genera, and species. At the same time, the hydrothermal resource state index TPMAX, heterogeneity index TPSTD and the sum index TPSUM were all identified as dominant climate indices. Finally, the introduction of hydrothermal base can effectively solve the numeric relationship between the level of plant diversity in the study unit and its area. For example, in Table 1, the diversities of plant families, genera, and species were inversely proportional to the area of the study unit, and were inversely proportional to or not correlated with TSUM of the study unit. This result contradicts the species-area relationship “S = CAZ” in island ecology, which was proposed by MacArthur and Wilson (2001), and it also differs from Wright’s “species-energy theory” (Wright, 1983) [area (A) is replaced by energy (E), S = kEz, where S denotes species diversity; E denotes the energy input of a certain trophic level in a given area; c, k, and z are constants]. This situation could be well avoided when the corresponding TPSUM indicator was used. Replacing regional area (A) or total energy (E) with TPSUM might be an effective option when investigating the diversity of primary producers at the lowest trophic level plants.
Conclusion
The diversities in plant families, genera, and species in China were correlated, showing a high distribution pattern in the south and low in the north. Among them, the correlation between plant family and genus diversities was the highest, followed by plant genus and species, and that of plant family and species being the lowest. The distribution of plant families was mainly affected by climatic state indicators, and had the highest correlations with the maximum value of climatic factors and the variation range of hydrothermal base, showing an obvious latitudinal gradient law. The distribution of plant species showed a decreasing trend from southwest to northeast, and the climatic heterogeneity indicators were the main predictors. Plant genera were between families and species, and climate state and heterogeneity indicators jointly affected the diversity pattern of plant genera. In this paper, the concept of the hydrothermal base was proposed to represent the hydrothermal coupling effect. The related indicators of the hydrothermal base performed well in revealing the climatic mechanism of biodiversity patterns, and can effectively solve the species-area relationship in arid areas with low temperature, which has broad application prospects in the studies of global biodiversity distribution law and its responsive mechanism to climate change.
Data availability statement
The original contributions presented in this study are included in this article/Supplementary material, further inquiries can be directed to the corresponding authors.
Author contributions
ZL and YB conceived the idea. ZL, YM, TL, JZ, and YLZ designed the methodology. TL and YM organized the plant database. YM, TL, ZL, WW, JY, and JT analyzed data. ZL, YM, and YB led the writing of the manuscript. All authors contributed to the article and approved the submitted version.
Funding
This study was supported by the National Natural Science Foundation of China (Grant Nos. 31971464 and 30970494) and Natural Science Foundation of Liaoning Province (2020-MZLH-11).
Conflict of interest
The authors declare that the research was conducted in the absence of any commercial or financial relationships that could be construed as a potential conflict of interest.
Publisher’s note
All claims expressed in this article are solely those of the authors and do not necessarily represent those of their affiliated organizations, or those of the publisher, the editors and the reviewers. Any product that may be evaluated in this article, or claim that may be made by its manufacturer, is not guaranteed or endorsed by the publisher.
Supplementary material
The Supplementary Material for this article can be found online at: https://www.frontiersin.org/articles/10.3389/fevo.2022.1010067/full#supplementary-material
Footnotes
References
Allen, A. P., and Gillooly, J. F. (2006). Assessing latitudinal gradients in speciation rates and biodiversity at the global scale. Ecol. Lett. 9, 947–954. doi: 10.1111/j.1461-0248.2006.00946.x
Bai, Y., Zhang, S., Guo, Y., and Tang, Z. (2020). Conservation status of Primulaceae, a plant family with high endemism, in China. Biol. Conserv. 248:108675. doi: 10.1016/j.biocon.2020.108675
Balmford, A., Green, M. J. B., and Murray, M. G. (1996). Using higher-taxon richness as a surrogate for species richness: I. Regional tests. Proc. R. Soc. Lond. B Biol. Sci. 263, 1267–1274. doi: 10.1098/rspb.1996.0186
Barreto, E., Rangel, T. F., Coelho, M. T. P., Cassemiro, F. A. S., Zimmermann, N. E., and Graham, C. H. (2021). Spatial variation in direct and indirect effects of climate and productivity on species richness of terrestrial tetrapods. Glob. Ecol. Biogeogr. 30, 1899–1908. doi: 10.1111/geb.13357
Brown, J. H. (1981). Two decades of homage to santa rosalia: Toward a general theory of diversity. Am. Zool. 21, 877–888.
Bruelheide, H., Dengler, J., Purschke, O., Lenoir, J., Jiménez-Alfaro, B., Hennekens, S. M., et al. (2018). Global trait–environment relationships of plant communities. Nat. Ecol. Evol. 2, 1906–1917. doi: 10.1038/s41559-018-0699-8
Cai, H., Lyu, L., Shrestha, N., Tang, Z., Su, X., Xu, X., et al. (2021). Geographical patterns in phylogenetic diversity of Chinese woody plants and its application for conservation planning. Divers. Distrib. 27, 179–194. doi: 10.1111/ddi.13180
Chen, S., Ferry Slik, J. W., Gao, J., Mao, L., Bi, M., Shen, M., et al. (2015). Latitudinal diversity gradients in bryophytes and woody plants: Roles of temperature and water availability. J. Syst. Evol. 53, 535–545. doi: 10.1111/jse.12158
Chen, W., and Su, T. (2020). Asian monsoon shaped the pattern of woody dicotyledon richness in humid regions of China. Plant Divers. 42, 148–154. doi: 10.1016/j.pld.2020.03.003
Chu, C., Lutz, J. A., Král, K., Vrška, T., Yin, X., Myers, J. A., et al. (2019). Direct and indirect effects of climate on richness drive the latitudinal diversity gradient in forest trees. Ecol. Lett. 22, 245–255. doi: 10.1111/ele.13175
Clarke, A., and Gaston, K. (2006). Climate, energy and diversity. Proc. Biol. Sci. 273, 2257–2266. doi: 10.1098/rspb.2006.3545
Coomes, D. A., and Grubb, P. J. (2000). Impacts of root competition in forests and woodlands: A theoretical framework and review of experiments. Ecol. Monogr. 70, 171–207.
Currie, D. J., Mittelbach, G. G., Cornell, H. V., Field, R., Guégan, J.-F., Hawkins, B. A., et al. (2004). Predictions and tests of climate-based hypotheses of broad-scale variation in taxonomic richness. Ecol. Lett. 7, 1121–1134. doi: 10.1111/j.1461-0248.2004.00671.x
Fang, J., and Yoda, K. (1989). Climate and vegetation in China II. Distribution of main vegetation types and thermal climate. Ecol. Res. 4, 71–83. doi: 10.1007/BF02346944
Fang, J., and Yoda, K. (1990a). Climate and vegetation in China III water balance and distribution of vegetation. Ecol. Res. 5, 9–23. doi: 10.1007/BF02348460
Fang, J., and Yoda, K. (1990b). Climate and vegetation in China IV. Distribution of tree species along the thermal gradient. Ecol. Res. 5, 291–302. doi: 10.1007/BF02347005
Fang, W.-J., Cai, Q., Zhao, Q., Ji, C.-J., Zhu, J.-L., Tang, Z.-Y., et al. (2022). Species richness patterns and the determinants of larch forests in China. Plant Divers. 44, 436–444. doi: 10.1016/j.pld.2022.05.002
Gao, Y., Huang, J., Li, S., and Li, S. (2012). Spatial pattern of non-stationarity and scale-dependent relationships between NDVI and climatic factors—A case study in Qinghai-Tibet Plateau, China. Ecol. Indic. 20, 170–176. doi: 10.1016/j.ecolind.2012.02.007
Ge, Q., Wang, H., Rutishauser, T., and Dai, J. (2015). Phenological response to climate change in China: A meta-analysis. Glob. Change Biol. 21, 265–274. doi: 10.1111/gcb.12648
Gillooly, J. F., Charnov, E. L., West, G. B., Savage, V. M., and Brown, J. H. (2002). Effects of size and temperature on developmental time. Nature 417, 70–73. doi: 10.1038/417070a
Godoy-Bürki, A. C., Biganzoli, F., Sajama, J. M., Ortega-Baes, P., and Aagesen, L. (2017). Tropical high Andean drylands: Species diversity and its environmental determinants in the Central Andes. Biodivers. Conserv. 26, 1257–1273. doi: 10.1007/s10531-017-1311-2
Gong, H., and Gao, J. (2019). Soil and climatic drivers of plant SLA (specific leaf area). Glob. Ecol. Conserv. 20:e00696. doi: 10.1016/j.gecco.2019.e00696
Gu, Y., Han, S., Zhang, J., Chen, Z., Wang, W., Feng, Y., et al. (2020). Temperature-dominated driving mechanisms of the plant diversity in temperate forests, Northeast China. Forests 11:227. doi: 10.3390/f11020227
Guisan, A., Tingley, R., Baumgartner, J. B., Naujokaitis-Lewis, I., Sutcliffe, P. R., Tulloch, A. I. T., et al. (2013). Predicting species distributions for conservation decisions. Ecol. Lett. 16, 1424–1435. doi: 10.1111/ele.12189
Hao, Z., and AghaKouchak, A. (2013). Multivariate standardized drought index: A parametric multi-index model. Adv. Water Resour. 57, 12–18. doi: 10.1016/j.advwatres.2013.03.009
Hawkins, B. A., Porter, E. E., and Felizola Diniz-Filho, J. A. (2003). Productivity and history as predictors of the latitudinal diversity gradient of terrestrial birds. Ecology 84, 1608–1623.
He, J., Lin, S., Kong, F., Yu, J., Zhu, H., and Jiang, H. (2020). Determinants of the beta diversity of tree species in tropical forests: Implications for biodiversity conservation. Sci. Total Environ. 704:135301. doi: 10.1016/j.scitotenv.2019.135301
Holger, K. (2007). Global patterns and determinants of vascular plant diversity. Proc. Natl. Acad. Sci. U.S.A. 104, 5925–5930. doi: 10.1073/pnas.0608361104
Hou, X. Y. (2019). 1:1 million vegetation map of China. Beijing: National Tibetan Plateau Data Center.
Huang, E., Chen, Y., Fang, M., Zheng, Y., and Yu, S. (2021). Environmental drivers of plant distributions at global and regional scales. Glob. Ecol. Biogeogr. 30, 697–709. doi: 10.1111/geb.13251
Huang, J., Chen, J., Ying, J., and Ma, K. (2011). Features and distribution patterns of Chinese endemic seed plant species. J. Syst. Evol. 49, 81–94. doi: 10.1111/j.1759-6831.2011.00119.x
Huang, J., Lu, X., Huang, J., and Ma, K. (2016). Conservation priority of endemic Chinese flora at family and genus levels. Biodivers. Conserv. 25, 23–35. doi: 10.1007/s10531-015-1027-0
Jiao, C., Yu, G., He, N., Ma, A., Ge, J., and Hu, Z. (2017). Spatial pattern of grassland aboveground biomass and its environmental controls in the Eurasian steppe. J. Geogr. Sci. 27, 3–22. doi: 10.1007/s11442-017-1361-0
Kozlowski, G., Sébastien, B., Cardinaux, L., and Mota, M. (2015). Hydrophobia of gymnosperms: Myth or reality: A global analysis. Ecohydrology 8, 105–112. doi: 10.1002/eco.1492
Kubota, U., Loyola, R. D., Almeida, A. M., Carvalho, D. A., and Lewinsohn, T. M. (2007). Body size and host range co-determine the altitudinal distribution of Neotropical tephritid flies. Glob. Ecol. Biogeogr. 16, 632–639. doi: 10.1111/j.1466-8238.2007.00319.x
Li, G., Guo, K., Liu, C., Liu, Y., Song, C., and Du, S. (2015). The relative influence of environmental and human factors on seed plant richness at the province scale in China. Pol. J. Ecol. 63, 184–197. doi: 10.3161/15052249PJE2015.63.2.003
MacArthur, R. H., and Wilson, E. O. (2001). The theory of island biogeography. Princeton, NJ: Princeton University Press. doi: 10.1515/9781400881376
McLaughlin, B. C., Ackerly, D. D., Klos, P. Z., Natali, J., Dawson, T. E., and Thompson, S. E. (2017). Hydrologic refugia, plants, and climate change. Glob. Change Biol. 23, 2941–2961. doi: 10.1111/gcb.13629
Mi, X., Feng, G., Hu, Y., Zhang, J., Chen, L., Corlett, R. T., et al. (2021). The global significance of biodiversity science in China: An overview. Natl. Sci. Rev. 8:nwab032. doi: 10.1093/nsr/nwab032
Negi, H. R., and Gadgil, M. (2002). Cross-taxon surrogacy of biodiversity in the Indian Garhwal Himalaya. Biol. Conserv. 105, 143–155. doi: 10.1016/S0006-3207(01)00158-6
O’Brien, E. (1998). Water-energy dynamics, climate, and prediction of woody plant species richness: An interim general model. J. Biogeogr. 25, 379–398. doi: 10.1046/j.1365-2699.1998.252166.x
O’Brien, E. M. (2006). Biological relativity to water–energy dynamics. J. Biogeogr. 33, 1868–1888. doi: 10.1111/j.1365-2699.2006.01534.x
Öder, V., Petritan, A. M., Schellenberg, J., Bergmeier, E., and Walentowski, H. (2021). Patterns and drivers of deadwood quantity and variation in mid-latitude deciduous forests. For. Ecol. Manag. 487:118977. doi: 10.1016/j.foreco.2021.118977
Palmer, M. W. (1994). Variation in species richness: Towards a unification of hypotheses. Folia Geobot. Phytotaxon. 29, 511–530. doi: 10.1007/BF02883148
Paquette, C., Gregory-Eaves, I., and Beisner, B. E. (2021). Multi-scale biodiversity analyses identify the importance of continental watersheds in shaping lake zooplankton biogeography. J. Biogeogr. 48, 2298–2311. doi: 10.1111/jbi.14153
Parr, C. L., and Bishop, T. R. (2022). The response of ants to climate change. Glob. Change Biol. 28, 3188–3205. doi: 10.1111/gcb.16140
Peng, S., Liu, Y., Lyu, T., Zhang, X., Li, Y., and Wang, Z. (2021). Towards an understanding of the latitudinal patterns in thermal tolerance and vulnerability of woody plants under climate warming. Ecography 44, 1797–1807. doi: 10.1111/ecog.05582
Perez, T. M., and Feeley, K. J. (2021). Weak phylogenetic and climatic signals in plant heat tolerance. J. Biogeogr. 48, 91–100. doi: 10.1111/jbi.13984
Qian, H. (2013). Environmental determinants of woody plant diversity at a regional scale in China. PLoS One 8:e75832. doi: 10.1371/journal.pone.0075832
Qian, H., and Chen, S. (2016). Reinvestigation on species richness and environmental correlates of bryophytes at a regional scale in China. J. Plant Ecol. 9, 734–741. doi: 10.1093/jpe/rtw001
Qian, H., Jin, Y., and Ricklefs, R. E. (2017). Phylogenetic diversity anomaly in angiosperms between eastern Asia and eastern North America. Proc. Natl. Acad. Sci. U.S.A. 114, 11452–11457. doi: 10.1073/pnas.1703985114
Qian, H., Zhang, J., and Jiang, M.-C. (2022). Global patterns of fern species diversity: An evaluation of fern data in GBIF. Plant Divers. 44, 135–140. doi: 10.1016/j.pld.2021.10.001
Richards, P., Walter, H., and Wieser, J. (1975). Vegetation of the earth in relation to climate and the eco-physiological conditions. J. Ecol. 63:1014. doi: 10.2307/2258632
Rosser, N., and Eggleton, P. (2012). Can higher taxa be used as a surrogate for species-level data in biodiversity surveys of litter/soil insects? J. Insect Conserv. 16, 87–92. doi: 10.1007/s10841-011-9395-6
Shmida, A., and Wilson, M. (1985). Biological determinants of species diversity. J. Biogeogr. 12, 1–20. doi: 10.2307/2845026
Shrestha, N., Su, X., Xu, X., and Wang, Z. (2018). The drivers of high Rhododendron diversity in south-west China: Does seasonality matter? J. Biogeogr. 45, 438–447. doi: 10.1111/jbi.13136
Simonson, R. W. (1995). Factors of soil formation. A system of quantitative pedology: By Hans Jenny. Dover Publications, New York, 1994. Paperback, 281 pp. Price: $9.95. ISBN 0-486-68128-9. Geoderma 68, 334–335. doi: 10.1016/0016-7061(95)90014-4
Song, X., Fang, W., Chi, X., Shao, X., and Wang, Q. (2021). Geographic pattern of bryophyte species richness in China: The influence of environment and evolutionary history. Front. Ecol. Evol. 9:680318. doi: 10.3389/fevo.2021.680318
Stein, A., Gerstner, K., and Kreft, H. (2014). Environmental heterogeneity as a universal driver of species richness across taxa, biomes and spatial scales. Ecol. Lett. 17, 866–880. doi: 10.1111/ele.12277
Subedi, C. K., Rokaya, M. B., Münzbergová, Z., Timsina, B., Gurung, J., Chettri, N., et al. (2020). Vascular plant diversity along an elevational gradient in the Central Himalayas, western Nepal. Folia Geobot. 55, 127–140. doi: 10.1007/s12224-020-09370-8
Testolin, R., Attorre, F., Borchardt, P., Brand, R. F., Bruelheide, H., Chytrý, M., et al. (2021). Global patterns and drivers of alpine plant species richness. Glob. Ecol. Biogeogr. 30, 1218–1231. doi: 10.1111/geb.13297
Turner, J. R. G. (2004). Explaining the global biodiversity gradient: Energy, area, history and natural selection. Basic Appl. Ecol. 5, 435–448. doi: 10.1016/j.baae.2004.08.004
Večeřa, M., Divíšek, J., Lenoir, J., Jiménez-Alfaro, B., Biurrun, I., Knollová, I., et al. (2019). Alpha diversity of vascular plants in European forests. J. Biogeogr. 46, 1919–1935. doi: 10.1111/jbi.13624
Vonlanthen, C. M., Kammer, P. M., Eugster, W., Bühler, A., and Veit, H. (2006). Alpine vascular plant species richness: The importance of daily maximum temperature and pH. Plant Ecol. 184, 13–25. doi: 10.1007/s11258-005-9048-5
Walck, J. L., Hidayati, S. N., Dixon, K. W., Thompson, K., and Poschlod, P. (2011). Climate change and plant regeneration from seed. Glob. Change Biol. 17, 2145–2161. doi: 10.1111/j.1365-2486.2010.02368.x
Wang, Z., Fang, J., Tang, Z., and Lin, X. (2010). Patterns, determinants and models of woody plant diversity in China. Proc. Biol. Sci. 278, 2122–2132. doi: 10.1098/rspb.2010.1897
Wang, Z., Fang, J., Tang, Z., and Shi, L. (2012). Geographical patterns in the beta diversity of China’s woody plants: The influence of space, environment and range size. Ecography 35, 1092–1102. doi: 10.1111/j.1600-0587.2012.06988.x
Wang, Z., Tang, Z., and Fang, J. (2007). Altitudinal patterns of seed plant richness in the Gaoligong Mountains, south-east Tibet, China. Divers. Distrib. 13, 845–854. doi: 10.1111/j.1472-4642.2007.00335.x
Williams, P. H., and Gaston, K. J. (1998). Biodiversity indicators: Graphical techniques, smoothing and searching for what makes relationships work. Ecography 21, 551–560.
Wright, D. H. (1983). Species-energy theory: An extension of species-area theory. Oikos 41, 496–506.
Xie, D., Liu, B., Zhao, L.-N., Pandey, T. R., Liu, H.-Y., Shan, Z.-J., et al. (2021). Diversity of higher plants in China. J. Syst. Evol. 59, 1111–1123. doi: 10.1111/jse.12758
Xu, H., Cao, M., Wu, J., Cai, L., Ding, H., Lei, J., et al. (2015). Determinants of mammal and bird species richness in China based on habitat groups. PLoS One 10:e0143996. doi: 10.1371/journal.pone.0143996
Xu, M., Zhang, J., Li, Z., and Mo, Y. (2022). Attribution analysis and multi-scenario prediction of NDVI drivers in the Xilin Gol grassland, China. J. Arid Land 14, 941–961. doi: 10.1007/s40333-022-0032-x
Xu, Y., Shen, Z., Ying, L., Zang, R., and Jiang, Y. (2019). Effects of current climate, paleo-climate, and habitat heterogeneity in determining biogeographical patterns of evergreen broad-leaved woody plants in China. J. Geogr. Sci. 29, 1142–1158. doi: 10.1007/s11442-019-1650-x
Xue, J., Chepinoga, V. V., Liu, Y., and Ma, K. (2020). Mapping Asia plants: Historical outline and review of sources on floristic diversity in North Asia (Asian Russia). Glob. Ecol. Conserv. 24:e01287. doi: 10.1016/j.gecco.2020.e01287
Yin, X., Jarvie, S., Guo, W.-Y., Deng, T., Mao, L., Zhang, M., et al. (2021). Niche overlap and divergence times support niche conservatism in eastern Asia–eastern North America disjunct plants. Glob. Ecol. Biogeogr. 30, 1990–2003. doi: 10.1111/geb.13360
Ying, T. S. (2001). Species diversity and distribution pattern of seed plants in China. Biodivers. Sci. 9, 393–398.
Zhang, C., Li, L., Guan, Y., Cai, D., Chen, H., Bian, X., et al. (2021). Impacts of vegetation properties and temperature characteristics on species richness patterns in drylands: Case study from Xinjiang. Ecol. Indic. 133:108417. doi: 10.1016/j.ecolind.2021.108417
Zhang, D.-C., Boufford, D. E., Ree, R. H., and Sun, H. (2009). The 29°N latitudinal line: An important division in the Hengduan Mountains, a biodiversity hotspot in southwest China. Nord. J. Bot. 27, 405–412. doi: 10.1111/j.1756-1051.2008.00235.x
Zhang, M., Huang, C., Rao, M., Chen, J., Wang, Y., and Mi, X. (2016). Detecting the richness and dissimilarity patterns of Theaceae species in southern China. Acta Ecol. Sin. 36, 464–468. doi: 10.1016/j.chnaes.2016.06.010
Zhang, M., Slik, J. W. F., and Ma, K.-P. (2017). Priority areas for the conservation of perennial plants in China. Biodivers. Conserv. 210, 56–63. doi: 10.1016/j.biocon.2016.06.007
Zhang, R., and Tielbörger, K. (2019). Facilitation from an intraspecific perspective – stress tolerance determines facilitative effect and response in plants. New Phytol. 221, 2203–2212. doi: 10.1111/nph.15528
Zhang, X., Wang, H., Wang, R., Wang, Y., and Liu, J. (2017). Relationships between plant species richness and environmental factors in nature reserves at different spatial scales. Pol. J. Environ. Stud. 26, 2375–2384. doi: 10.15244/pjoes/69032
Zhang, Z., Yan, Y., Tian, Y., Li, J., He, J.-S., and Tang, Z. (2015). Distribution and conservation of orchid species richness in China. Biol. Conserv. 181, 64–72. doi: 10.1016/j.biocon.2014.10.026
Zhao, Z., Yang, L., Long, J., Chang, Z., Zhou, Z., Zhi, Y., et al. (2021). Endemism patterns of planthoppers (Fulgoroidea) in China. Front. Ecol. Evol. 9:683722. doi: 10.3389/fevo.2021.683722
Keywords: biodiversity pattern, plant families genera and species, dominant climate factors, accumulated temperature, annual precipitation, hydrothermal base, regional climate indicator, hydrothermal coupling effect
Citation: Mo Y, Li T, Bao Y, Zhang J, Zhao Y, Ye J, Zhang Y, Wu W, Tang J and Li Z (2022) Correlations and dominant climatic factors among diversity patterns of plant families, genera, and species. Front. Ecol. Evol. 10:1010067. doi: 10.3389/fevo.2022.1010067
Received: 02 August 2022; Accepted: 16 November 2022;
Published: 30 November 2022.
Edited by:
Daniel de Paiva Silva, Goiano Federal Institute (IFGOIANO), BrazilReviewed by:
Karine Machado, State University of Goiás, BrazilRasme Hereme, University of Talca, Chile
Copyright © 2022 Mo, Li, Bao, Zhang, Zhao, Ye, Zhang, Wu, Tang and Li. This is an open-access article distributed under the terms of the Creative Commons Attribution License (CC BY). The use, distribution or reproduction in other forums is permitted, provided the original author(s) and the copyright owner(s) are credited and that the original publication in this journal is cited, in accordance with accepted academic practice. No use, distribution or reproduction is permitted which does not comply with these terms.
*Correspondence: Yajing Bao, byj@dlnu.edu.cn; Zhenghai Li, lzhh@dlnu.edu.cn
†These authors have contributed equally to this work and share first authorship