Sexual Dimorphism in Growth Rate and Gene Expression Throughout Immature Development in Wild Type Chrysomya rufifacies (Diptera: Calliphoridae) Macquart
 Meaghan L. Pimsler1,2,3*
  Carl E. Hjelmen1,4
  Michelle M. Jonika1,4
  Anika Sharma1,5
  Shuhua Fu1,6 Madhu Bala5
  Sing-Hoi Sze6,7
  Jeffery K. Tomberlin2
  Aaron M. Tarone1
- 1Tarone Lab, Department of Entomology, Texas A&M University, College Station, TX, United States
- 2FLIES Facility, Department of Entomology, Texas A&M University, College Station, TX, United States
- 3Lozier Lab, Department of Biological Science, University of Alabama, Tuscaloosa, AL, United States
- 4Blackmon Lab, Department of Biology, Texas A&M University, College Station, TX, United States
- 5MB Lab, Department of Zoology and Environmental Sciences, Punjabi University, Patiala, India
- 6Sze Lab, Department of Biochemistry and Biophysics, Texas A&M University, College Station, TX, United States
- 7Sze Lab, Department of Computer Science and Engineering, Texas A&M University, College Station, TX, United States
Reliability of forensic entomology analyses to produce relevant information to a given case requires an understanding of the underlying arthropod population(s) of interest and the factors contributing to variability. Common traits for analyses are affected by a variety of genetic and environmental factors. One trait of interest in forensic investigations has been species-specific temperature-dependent growth rates. Recent work indicates sexual dimorphism may be important in the analysis of such traits and related genetic markers of age. However, studying sexual dimorphic patterns of gene expression throughout immature development in wild-type insects can be difficult due to a lack of genetic tools, and the limits of most sex-determination mechanisms. Chrysomya rufifacies, however, is a particularly tractable system to address these issues as it has a monogenic sex determination system, meaning females have only a single-sex of offspring throughout their life. Using modified breeding procedures (to ensure single-female egg clutches) and transcriptomics, we investigated sexual dimorphism in development rate and gene expression. Females develop slower than males (9 h difference from egg to eclosion respectively) even at 30°C, with an average egg-to-eclosion time of 225 h for males and 234 h for females. Given that many key genes rely on sex-specific splicing for the development and maintenance of sexually dimorphic traits, we used a transcriptomic approach to identify different expression of gene splice variants. We find that 98.4% of assembled nodes exhibited sex-specific, stage-specific, to sex-by-stage specific patterns of expression. However, the greatest signal in the expression data is differentiation by developmental stage, indicating that sexual dimorphism in gene expression during development may not be investigatively important and that markers of age may be relatively independent of sex. Subtle differences in these gene expression patterns can be detected as early as 4 h post-oviposition, and 12 of these nodes demonstrate homology with key Drosophila sex determination genes, providing clues regarding the distinct sex determination mechanism of C. rufifacies. Finally, we validated the transcriptome analyses through qPCR and have identified five genes that are developmentally informative within and between sexes.
Introduction
Accuracy and precision in forensic science often rely upon advanced statistical analyses requiring a solid understanding of both underlying statistical distributions, as well as the factors that affect variation of measures of interest (National Research Council, 2009). These concerns apply to insect growth rates in forensic entomology, the application of the scientific study of arthropods to legal investigations. While some biologists may be focused on characterizing what is different between species, or populations of a given species, a biologist working in forensic science is generally focused on developing a model that balances broad applicability, ease of use, and accuracy and precision of predictions. Initial efforts in forensic entomology focused on the predictability of insect arrival and stability of temperature-dependent growth rates to estimate insect ages. These approaches are particularly relevant in the context of medico-legal forensic entomology, where immature insects are collected from humans or other vertebrates during death and neglect investigations. Therefore, initial efforts targeted the development of species-specific growth datasets at different stable temperatures (Byrd and Butler, 1996, 1997; Grassberger and Reiter, 2001, 2002). With technological advancements and more researchers with a broad array of backgrounds, other factors affecting temperature-dependent growth rates were identified, including stable versus fluctuating temperatures, diet, sex, presence of other species, and evidence for local adaptation (Tomberlin et al., 2009; Tarone et al., 2011; Yu et al., 2011; Picard et al., 2013; Flores et al., 2014; Yanmanee et al., 2016). However, sexual dimorphism has not historically received much attention in forensic entomology, though it is known to result in significant phenotype differences in many organisms (Hedrick and Temeles, 1989; Shine, 1989). Furthermore, many fly species (the most important group of insects in forensic entomology) demonstrate dimorphism in both final adult size and/or development rate (Stillwell et al., 2010). Both of these factors may be important in the refinement and precision of insect age estimates (Blanckenhorn et al., 2007; Zuha and Omar, 2014; Blanckenhorn et al., 2015; Frątczak-Łagiewska and Matuszewski, 2018; Matuszewski and Fratczak-Łagiewska, 2018; Patrício Macedo et al., 2018). Concerns about sexual dimorphism in forensically important species have generally focused on organismal phenotypes; however, the same consideration must be made for molecular markers of fly age (e.g., gene expression), which are gaining traction as additional information that can (but may not always, see Smith and Cook, 2020) improve precision in insect age estimates for forensic purposes (Picard et al., 2013; Jonika et al., 2020). For any sexually dimorphic trait in forensic entomology, determining if the effect of sex is functionally important for predictions is important (see Smith and Cook, 2020). Thus, some unknown proportion of genes used to predict fly age may be affected by sex, but they may be affected in ways that are relevant to fly age predictions or not.
Sexual dimorphism is a charismatic and ubiquitous example of phenotypic divergence and has been a fruitful avenue of research in evolutionary biology in understanding phenotype evolution. Focus on developmental patterns of sexually dimorphic characteristics has also yielded important insights on some of the causes of these traits (Shine, 1989; Blanckenhorn et al., 2007; Colgan et al., 2011). It is generally hypothesized that sex-specific selection pressures have led to differentiation in morphology, physiology, and behavior through sex-linked gene expression (Shearman, 2002; Mank et al., 2011; Scott et al., 2014). However, most research has focused on identifying the specific genetic or ontogenetic processes giving rise to particular characteristics, rather than transcriptome-wide patterns (Chang et al., 2011; Li et al., 2013) or relevance to predictions of insect age.
The development and maintenance of sexually dimorphic traits is ultimately controlled by the final products of the sex-determination gene cascade (Baker and Belote, 1983; Cline, 1993). Decades of research in flies, especially Drosophila melanogaster Meigen (Diptera: Drosophilidae), have revealed a complex hierarchy of sex-determination genes, an understanding of their modes of action and interaction, and some of the consequences of mutations at these loci (Baker et al., 1989). The most common sex determination system flies (e.g., Calliphoridae, Tephritidae, and Muscidae) is one of heteromorphic sex chromosomes and a presumed dominant male determiner (M) on the Y chromosome. The product of this M gene directs a positive feedback loop of sex-specific splicing of transformer (tra) and therefore doublesex (dsx), leading to a cascade of differential gene expression resulting in distinct adult sexes (Dubendorfer et al., 2002; Lagos et al., 2007; Scott et al., 2014; Sawanth et al., 2016). However, the downstream pathways leading to sexual dimorphism remain unclear in non-model organisms, limiting our ability to identify which mechanisms are conserved and which are species unique.
Genome-wide sexual dimorphism in gene expression has been extensively studied in only a few organisms, with most of the work in Diptera having been done in D. melanogaster (Parisi et al., 2004; Ellegren and Parsch, 2007; Morrow et al., 2008; Ghiselli et al., 2011; Grath and Parsch, 2016). Microarray and next generation sequencing approaches have identified thousands of genes differentially expressed between the sexes in adults, not only between reproductive tissue types (Small et al., 2009), but also in somatic tissues such as the brain (Chang et al., 2011). Generally, approximately 50% of genes are sexually dimorphic in expression in adult Drosophila, though almost all of these differences originate in the reproductive tissues (Ranz, 2003; Parisi et al., 2004; Connallon and Knowles, 2005; Zhang et al., 2007). In comparison, there are relatively few studies of sexual dimorphism in gene expression in immature insects.
Identifying the sex of immature insects morphologically is difficult (Van Emden, 1957) and therefore challenging to study sexual dimorphism in gene expression across all developmental stages. The limited work in D. melanogaster has therefore relied primarily on either late-stage immature development (third instar larvae and pupae) using developing adult features such as sex-combs (Arbeitman, 2002), or the use of inbred lines, sex-lethal mutations, and transgenics (Lebo et al., 2009). However, it is not possible to use developing adult characters in earlier developmental stages, and it is unclear how sexual dimorphism in gene expression operates against a true wild-type genetic background at these stages of development as well. It is possible to differentiate between male and female-fated immatures in most species of fly though karyotyping, detection of y-linked markers, or genome size measurement (Morrow et al., 2008, 2014a, b; Salvemini et al., 2014a). However, this is an expensive and labor-intensive process that requires prior identification of useful markers, an approach impossible in study systems lacking genetic tools or dimorphic sex chromosomes (Picard et al., 2013). Therefore, a tractable system with reliable sex-specific sorting of wild-type immatures across all stages of development would be a valuable tool for understanding the ontological and evolutionary processes governing sexual dimorphism, as well as potentially increasing precision in age estimates in forensic entomology analyses.
The hairy maggot blow fly, Chrysomya rufifacies Macquart (Diptera: Calliphoridae), has an unusual sex-determination system (monogeny) that makes it uniquely well suited to the study of sexual dimorphism throughout development (Wilton, 1954; Ullerich, 1977). In this species, females produce genetically pre-determined single-sex offspring clutches, independent of the zygotic genome of the offspring (Ullerich, 1963, 1973, 1975, 1977, 1980, 1984). Female-producing (thelygenic) females are hypothesized to be heterozygote dominant for a factor that they incorporate into their eggs that causes their offspring to develop into fertile females (Ullerich, 1963, 1973, 1975, 1977, 1980, 1984), while male-producing (arrhenogenic) females and males are hypothesized to be homozygous recessive for this same factor. Furthermore, as C. rufifacies has homomorphic sex chromosomes, maternally determined sex, and limited genetic data available, it is not currently possible to use karyotyping or genome-size for immature sex-identification (Ullerich, 1973, 1975; Picard et al., 2012; Andere et al., 2020). Given the atypical nature of the sex determination system, it is also unclear if expression of known sex determination factors will be useful (Scott et al., 2014; Andere et al., 2020), though preliminary work with doublesex has been promising (Sze et al., 2017; Jonika et al., 2020).
The purpose of this work was to leverage the monogenic sex determination of C. rufifacies to study sexual dimorphism in development and gene expression in wild-type, forensically important, flies throughout their life-history. The first aim of this work was to determine whether development rate of immatures is sexually dimorphic despite the lack of variation in genome size and karyotype. We demonstrated males and females exhibit differences in development rate in both larval and puparial stages. Next, we explored patterns of gene expression throughout immature development to identify whether patterns of gene expression change throughout immature development in concert with gross morphological changes. Our results show patterns consistent with other holometabolous species, with large shifts in gene expression throughout developmental stages and within puparial development. Then, sexual dimorphism in gene expression is assessed through the application of next generation sequencing and de novo transcriptomics, to determine when sexual dimorphism in gene expression begins and what the patterns of differential expression are within and between stages and sexes. Our results indicate subtle differences in gene expression can be detected as early as 4 h post-oviposition and increase over developmental time. Finally, we validated the transcriptome analyses through qPCR and identify several genes that are developmentally informative within and between sexes.
Materials and Methods
Colony Foundation and Maintenance
Larvae of C. rufifacies were collected from numerous carcasses in College Station, TX, United States between May and September of 2011 and eclosed adults were identified morphologically (Whitworth, 2010). Adult flies were released into a BugDorm-1 plastic cage (MegaView Science, Taiwan) and allowed to interbreed to found the laboratory colony. The colony was provided with fresh deionized water and refined sugar ad libitum, as well as fresh bovine blood daily as a protein source for oogenesis. Fly colonies were maintained at 28°C for a 16:8 light:dark (L:D) photoperiod for more than 10 generations before sample collection began. Sex-specific voucher specimens of this colony throughout immature development and the adult stage are at the Texas A&M University Insect Collection #716 and #717.
Sexually Dimorphic Development
To collect C. rufifacies larvae of a known age, flies in the colony were allowed access to an oviposition substrate of fresh beef liver in a 32.5 mL opaque plastic cup covered with a KimWipe®, (Kimberly-Clark, Irving, TX, United States) moistened with deionized water for a 3-h window. After oviposition, the eggs were placed in a Percival model I-36LLVL Incubator (Percival Scientific, Perry, IA, United States) at 30°C, 75% relative humidity (RH), and a 12:12 L:D. After hatching, aliquots of 100 first instars were then transferred by paintbrush to 50 g of fresh beef liver in a 32.5 mL opaque plastic cup covered with a moistened KimWipe® in a 1.1 L canning jar with approximately 100 g of playground sand and a Wype-All on the top to prevent escape but allow airflow. This method was replicated three times per egg collection, with a total of three biological replicates. These rearing jars were then placed in a Percival model I-36LLVL Incubator (Percival Scientific, Perry, IA, United States) at 30°C, 75% RH, and a 12:12 LD. This was repeated four times for a total of 1,200 larvae in 12 jars.
Observations were made every 3 h beginning 138 h after oviposition. All individuals from each jar observed to pupate at the time of observation was placed in a labeled, capped 30 mL plastic cup. Observations continued after pupariation, and the sex of each eclosed individual was recorded. This process continued until no eclosion had been observed for 4 days, after which daily observations were made for 2 weeks in which no flies eclosed. Data were analyzed in R 3.1.3 (R Core Team, 2010) to assess survival and sex ratios. Best fit models for development rates for egg to pupariation, egg to eclosion, and pupariation to eclosion was assessed in R using AIC (base R) and AICc (MuMIn v. 1.43.15; Bartoń, 2018) with nested random effects least squared regression models, where replicate (egg collection time) and trial (aliquots of 100 larvae) were treated as random effects (Table 1).
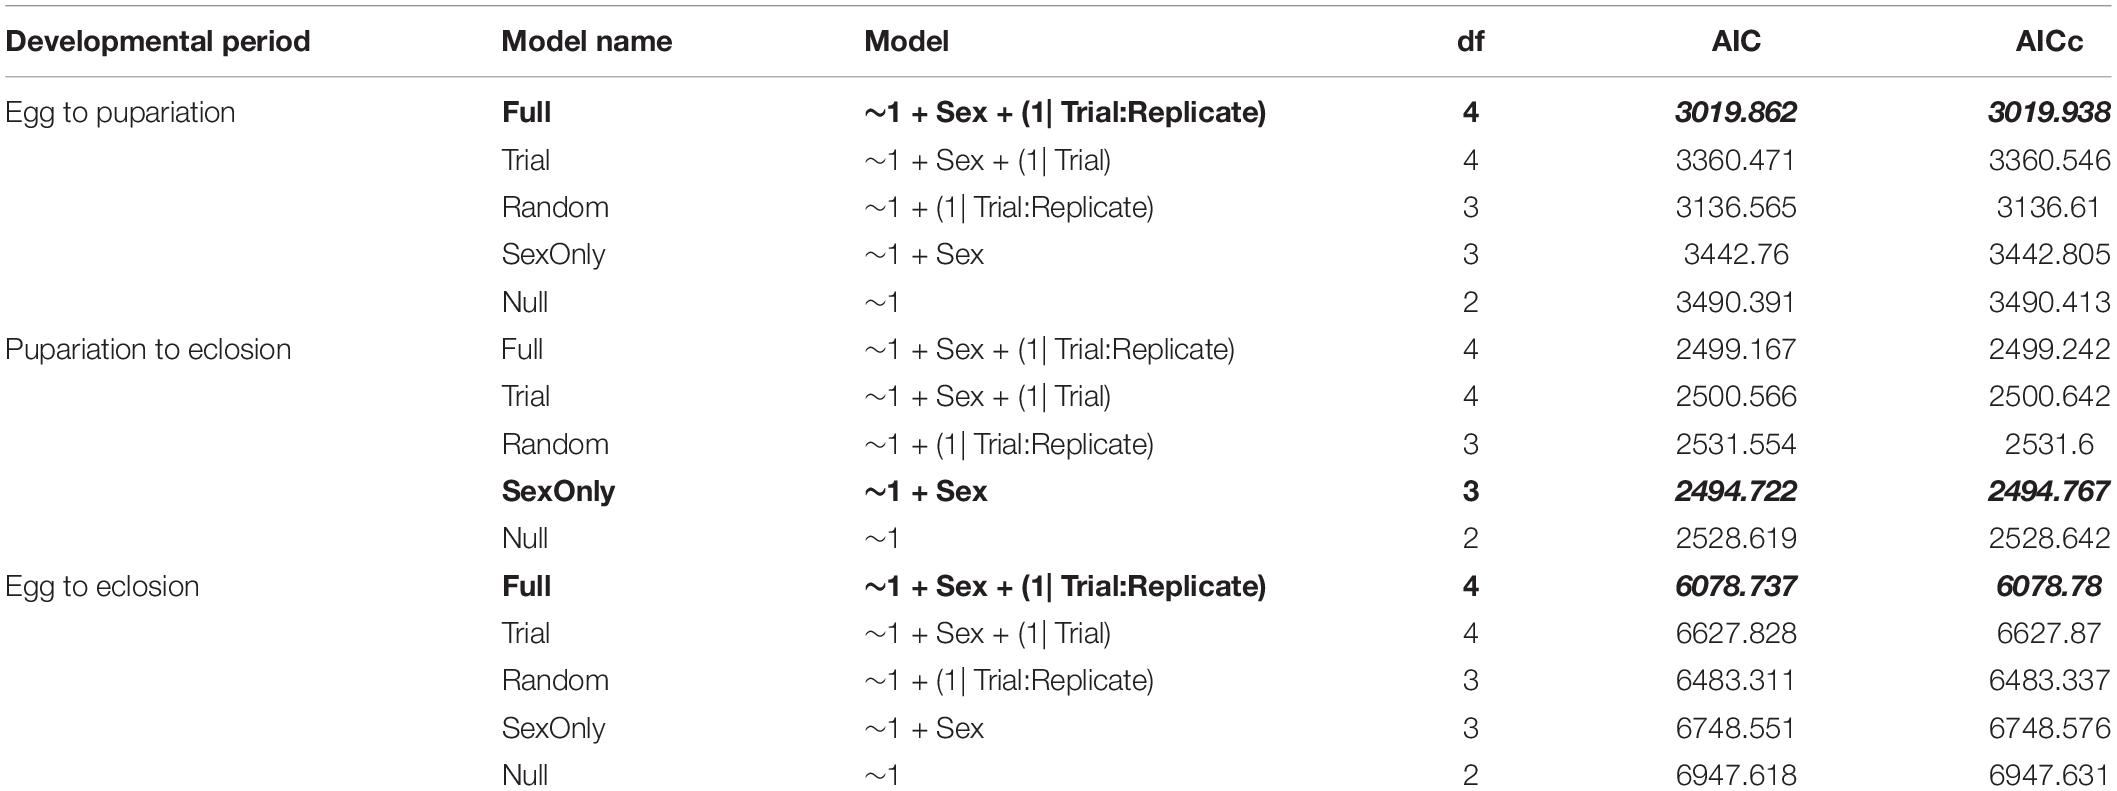
Table 1. Best fit model selection AIC and AICc results testing for sexual dimorphism in development rate at 30°C for Chrysomya rufifacies.
One often used method to estimate insect age in forensic entomology are thermal summation models based on the accumulation of degree hours (ADH) or degree days (ADD) (Amendt et al., 2004). These models rely on the assumption that for any given species or population, the relationship between temperature and development rate is linear within optimal temperature ranges. However, these models also require knowledge of the lower developmental temperature (LDT), below which the organism cannot develop. In the case of C. rufifacies, the LDT has not been experimentally determined, and it is therefore necessary to estimate the LDT. One common method is to regress the development rate (1/TDevTemp) on the Y-axis against the temperatures studied (Temp) on the X-axis (Gennard, 2007; Tarone and Benoit, 2019). Development data was extracted from two published studies using North American collected C. rufifacies, Byrd and Butler (1997) which used only one diet and five temperatures, and Flores et al. (2014) which used three diets and three temperatures. Linear regression models were calculated separately for each paper and diet, and the x-intercept (estimated LDT) calculated from the estimated coefficients (Figure 1). Sexual dimorphism in development time coefficients from the best fit models above were used in conjunction with estimated LDT to calculate the range of ADH differences between males and female for different developmental time periods.
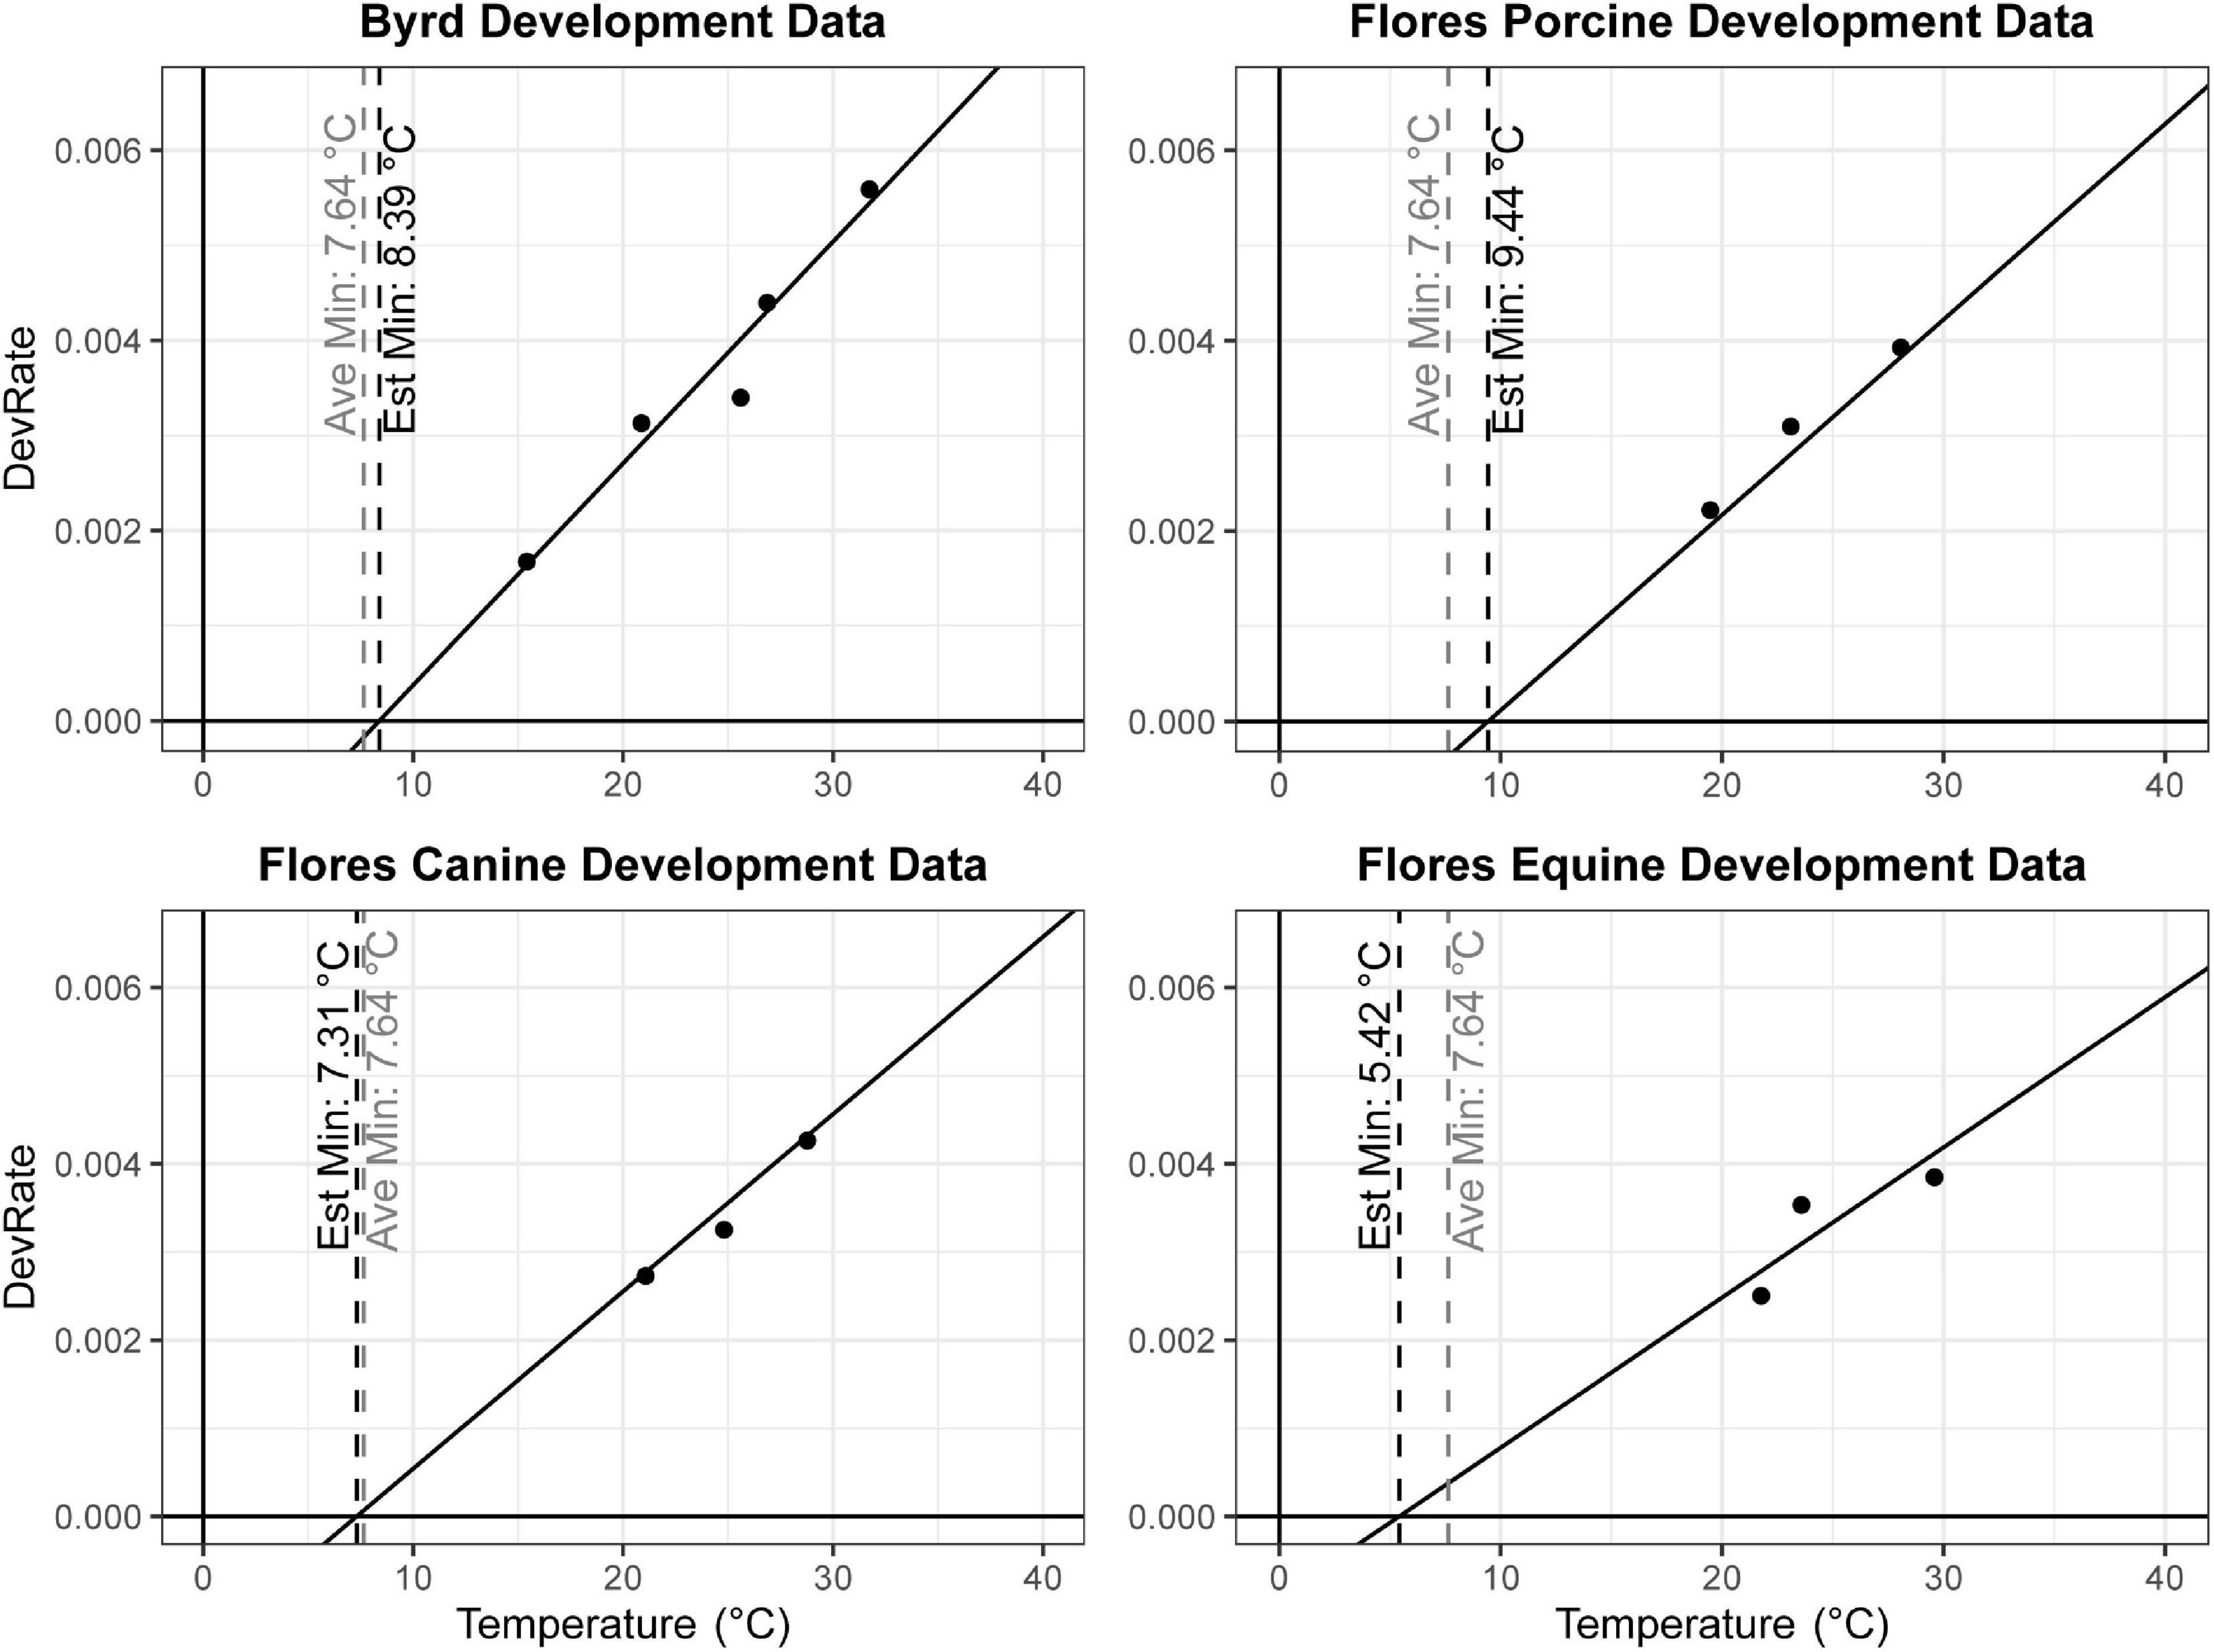
Figure 1. Linear regression models to estimate lower developmental threshold of North American collected Chrysomya rufifacies. The estimated LDT for each data set was identified individually by calculating the x-intercept (vertical black dashed line). These estimates were averaged together and also plotted (vertical gray dashed line at 7.64°C in all panels).
Gene Expression Sample Collection
For each sample, a single male and female C. rufifacies were isolated together in a 1.1 L canning jar with approximately 100 g of playground sand, a Wype-All on the top to prevent escape but allow airflow, and refined sugar and water ad libitum and a 10 mL glass beaker filled with one Kim-wipe® and approximately 1 mL of fresh beef liver blood. These were kept in the incubator conditions previously mentioned (30°C, 75% RH, and a 12:12 LD). An additional 1 mL of blood was added each following day up until the 6th day post eclosion as a source of protein for oogenesis. The protein source was then excluded for 24 h. Beginning on the 7th day post-eclosion, twice each day, a 35 mL plastic cup with approximately 25 g of fresh beef liver covered with a moistened Kim-wipe® was introduced to the jar as an oviposition medium for 4 h. If a female oviposited during this time, the females were removed and flash frozen for later RNA extraction, and the progeny were allowed to develop under the same conditions listed above in a separate incubator. From a total of six different females per sex of offspring for each stage, the following samples were collected: ∼100 eggs (max of 4 h old), ∼100 first instars (12 h post oviposition), ∼10 s instars (24 h post oviposition), 2 third instars (36 h post oviposition), early pupal development (0–1 into pupariation), mid-pupal development (2–3 days into pupariation), or late pupal development (4–5 days into pupariation) (Martín-Vega et al., 2016; Table 2). All samples were flash frozen and stored at −80°C until RNA extraction.
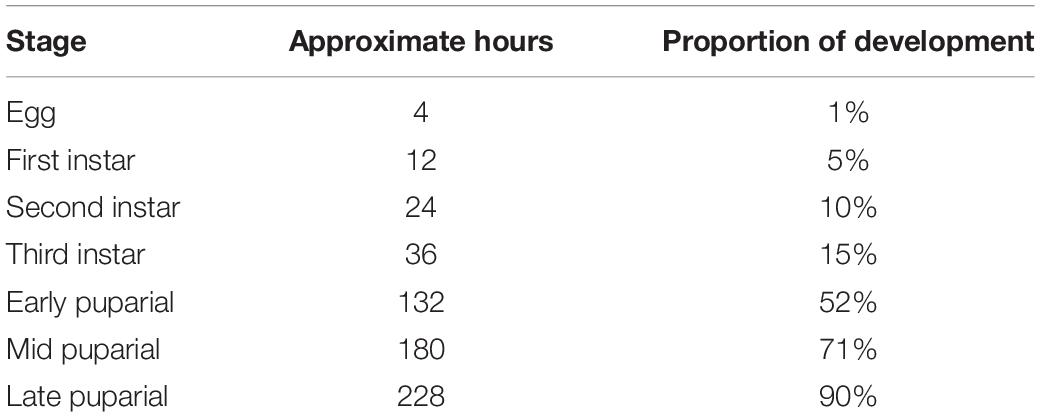
Table 2. Hours of development and proportion of development completed for each sampling group for transcriptomic analysis throughout immature development in Chrysomya rufifacies reared at 30°C.
RNA Preparation
RNA was extracted via TriReagent preparation according to manufacturer’s protocols. Briefly, one sample (i.e., ∼100 eggs, single pupa) was macerated in 1 mL of cold TriReagent (Sigma-Aldrich Corp., St. Louis, MO, United States) in a 1.5 mL RNAse-free microfuge tube. Following this, 50 mL of ice-cold 4-bromoanisole (BAN) reagent (Molecular Research Center, Inc., Cincinnati, OH, United States) was added and the solution was vigorously mixed. Next, the tubes centrifuged at 14,000 G at 4°C for 15 min to isolate the RNA from the DNA and proteins. Approximately 500 μL of the top, clear layer was carefully removed via pipet and added to 500 μL of ice-cold 100% isopropanol. The tubes were mixed via inversion three times and allowed to rest on ice for 10 min to precipitate the RNA. The precipitate was then centrifuged at 14,000 G at 4°C for 15 min. The supernatant was completely removed, 1 mL of cold 70% ethanol was used to wash the RNA pellet, and then the pellet centrifuged at 4°C for 5 min at 14,000 G. The ethanol was eluted, and any remaining ethanol was allowed to evaporate completely. The RNA was then dissolved in a 100 μL mixture of 99 μL of DNase/RNase/Nucleotide-free water and 1 μL of SUPERase•InTM (Invitrogen, Life Technologies Incorporated, Grand Island, NY, United States).
The extracted RNA was further purified using a Qiagen RNeasy Micro Kit and on-column DNase treatment following manufacturer protocols (Qiagen Inc., Valencia, CA, United States). Sample concentration and quality and control were assessed with NanoDrop (Thermo Fisher Scientific Inc., Wilmington, DE, United States) and an Agilent 2100 BioAnalyzer (Agilent Technologies Inc., Santa Clara, CA, United States). Two samples per sex and stage were pooled based on total RNA concentration into a single library, for three libraries per sex and stage. The exception was the third instar samples, which were collected to study both immature gene expression (this work) and the molecular ecology of predation (a separate analysis). Illumina libraries were prepared under standard protocols. In total, 66 libraries were sequenced on three separate RNA Illumina HiSeq flow cells. The libraries for the following stages were prepared as 100 bp paired end reads: adult, third instar, and mid pupariation. The rest of the libraries were prepared as 100 bp single-end reads. However, while the transcriptomes were assembled with all 66 of these libraries (PRJNA385184, PRJNA287123, PRJNA287124), the analysis presented here will focus on the 48 immature libraries (PRJNA287123, PRJNA287124).
Transcriptome Assembly
Prior to assembly, reads underwent trimming and quality control: reads were filtered to remove all sequences that contained adaptor sequences and known contaminants as defined by Illumina. The transcriptome was assembled with all 66 RNASeq libraries with ASplice (Sze et al., 2017) under a variety of k-mer (k) and k-mer coverage (c) parameters. Briefly, assemblies were generated with the ASplice algorithm on the Whole Systems Genome Initiative (WSGI) computing cluster1. These assemblies were then analyzed to identify potential alternative splicing patterns. This program assembles reads into splicing graphs, rather than predicted transcripts, similar to SOAPdenovo2 (Luo et al., 2012). Briefly, the program produces an output of nodes connected together by edges. Nodes are sections of unambiguously aligned k-mers, and edges are the connections between nodes in alternatively spliced transcripts. While the nodes are named with numbers only, the edges are indicated in the transcriptome fasta names after a colon; i.e., NODE_1234:2345,2346 means that NODE_1234 connects with NODE_2345 and 2346. To facilitate identification of nodes of interest in the reported transcriptomes, in this manuscript we will discuss node numbers with included edges.
Once the assembly was completed for a given parameter pair, the absolute count of reads which mapped to each nodes was calculated for each library. Transcriptome nodes were compared against known D. melanogaster proteins using a translated Basic Local Alignment Search Tool (BLAST) search (Altschul et al., 1990). For each node, only the top BLAST hit with an E-value below 10–7 was considered, and each of these nodes were assigned the GO term(s) associated with its fly ortholog in Ensembl 2018 (Zerbino et al., 2018) using biomartr v0.9.0 (Drost and Paszkowski, 2017).
Selection of Assembly for Analyses
A total of 66 RNAseq libraries were sequenced, 33 male and 33 female. Average read length after trimming and quality control was 86.3 bp, and there was an average of 6.3 × 10⁷ reads per library. These were assembled into 24 de novo transcriptome assemblies based on a range of k-mer sizes (21, 25, 31, 35, 41, and 45) and coverage cut-offs (50, 100, 200, and 500) (Supplementary Table 1). For the purpose of this study, the assembly with a k-mer of 31 and a coverage cutoff of 100 (31_100) was selected as the best candidate for analysis as it optimized completeness (high number of nodes, low number of single node splicing graphs) and quality (high N50, high number of D. melanogaster genes and transcripts detected, small “tangles”) (raw data in Supplementary Materials 1–4). Additional details about assembly can be found in Sze et al. (2017) and Pimsler et al. (2019).
Transcriptome Analysis
RNAseq analyses used edgeR v3.22.3 (R Core Team, 2010; Robinson et al., 2010) and edgeR v3.12.1/limma v3.36.2 (Robinson et al., 2010; Ritchie et al., 2015). Raw counts were transformed to counts per million (CPM), retaining nodes ≥ 100 bp in length with ≥1 CPM in ≥2 samples (filtered logCPM values in Supplementary 5). Analysis was then conducted in two stages: (1) model-based sub-setting and multidimensional scaling (MDS) to explore broad patterns; (2) individual node-by-node differential expression analyses; (3) cluster analysis.
First, using limma selectModel, a best fit general linear model for each modes was selected from alternative nested models (Region, Treatment, Region + Treatment, or Full model with an interaction) using the absolute lowest Akaike’s Information Criterion (AIC) score (Vuong, 1989) (results in Supplementary Material 6). MDS was also performed in limma, using all 81,205 nodes to investigate broad patterns of clustering of samples.
Second, we performed individual node-by-node analyses with a contrasts approach in edgeR to test for sex, stage, and sex-by-stage effects on node expression. Significance was assessed at a False Discovery Rate (FDR) ≤ 0.05, using Benjamini–Hochberg adjusted P-values of all nodes and contrasts on a per-factor basis (Benjamini and Hochberg, 1995). Of all nodes, 93,530/493,544 and 14,946/493,544 had a length of 100 bp or more or shared sequence homology with D. melanogaster, respectively. Of these (∼87%; 81,205/93,530), were expressed in two or more samples, and 4.5%; 3,631/81,205 of those nodes passing the cutoff were GO-annotated. GO enrichment analyses were performed with topGO v2.30.0 (Alexa and Rahnenführer, 2015) using classic method and Fisher’s Exact Test with default settings (Lewin and Grieve, 2006) for biological process (BP), molecular function (MF), and cellular component (CC). We consider enrichment significant at P ≤ 0.05, as we were primarily interested in examining functional information for nodes that were already stringently selected, and GO enrichment P-values do not conform to distributions typically required for FDR correction (Flight and Wentzell, 2009). For ease of visualizing GO terms in presented results, GO lists were simplified using ReViGO (Supek et al., 2011) (allowed similarity = small) (results in Supplementary Materials 7–9).
Finally, log counts per million (lcpm) values for all significantly differentially expressed nodes were clustered using average pairwise Pearson correlation coefficients with Cluster3.0 (de Hoon et al., 2004). Using TreeView v1.1.6r4 (Page, 1996), clusters with an average correlation of 0.85 and at least 100 nodes were included for further analysis (results in Supplementary Material 5). These clusters were analyzed for GO (see above), and inclusion of previously identified genes in D. melanogaster involved in sex determination, germline development (Lebo et al., 2009; dos Santos et al., 2015), and somatic sexual dimorphism (Lebo et al., 2009) (results in Supplementary Material 10).
Validation Fly Rearing
To initiate and maintain a laboratory colony, adult C. rufifacies (>500) were collected from decomposing animal remains in College Station, TX, United States from May to July 2017. Flies were identified using morphological features as above (TAMUIC #730) and held in a semi climate-controlled room (∼25°C, 50% RH, and a 14L:10D photoperiod) in 30 × 30 × 30 cm cages (BioQuip, Rancho Dominguez, CA, United States) at Texas A&M University, United States. To collect samples for the validation qPCR, between November 2017 and January 2018, four separate lumite screen collapsible cages (30 × 30 × 30 cm BioQuip® Rancho Dominguez, CA, United States) of adult C. rufifacies flies were established in walk-in incubators (Rheem Environmental Chamber, Asheville, NC, United States) at 29 ± 1°C temperature and 60% RH. Adults were provided sugar (as carbohydrate source), fresh deionized water, and bovine blood to ensure proper egg development. After 7 days as adults, a 35 mL plastic container containing 20 g of raw fresh beef liver covered with a folded Kimwipe was provided as an oviposition medium. Eggs were collected after 4 h of exposure to the oviposition substrate. Eggs were mixed gently with a brush and approximately 200-250 eggs (0.05 g) were transferred onto a Kimwipe.
Eggs were placed in a 1 L wide mouth mason jar containing 200 g of playground sand and 100 g of fresh beef liver and were covered with Wype-all. A total of 88 jars were prepared, labeled and randomized for developmental time point collection and placement in a Percival growth chamber set at 25.0°C, 75% RH and 14:10 LD (Percival model I-36LLVL incubator). An Onset® HOBO U12-006 data logger along with Onset® TMC6-HD air, water, and soil temperature sensors (Onset Co., Pocasset, MA, United States) were placed on each shelf of the growth chambers to determine consistency in abiotic factors. Jars were inspected to ensure hatching and progression to subsequent instar and intra-puparial (sensu Martín-Vega et al., 2016) stages. Samples (12 individuals each) were collected from third instar larvae to late puparial stage (i.e., third instar, post-feeding, early puparial, mid puparial and late puparial) (Martín-Vega et al., 2016). Larval and puparial samples were collected by placing them into 15 mL Falcon tubes and flash freezing in 200 proof ethanol and dry ice. Samples were stored at −80°C until RNA extraction. Hours of development and proportion of development completed for each age group can be found in Table 3.
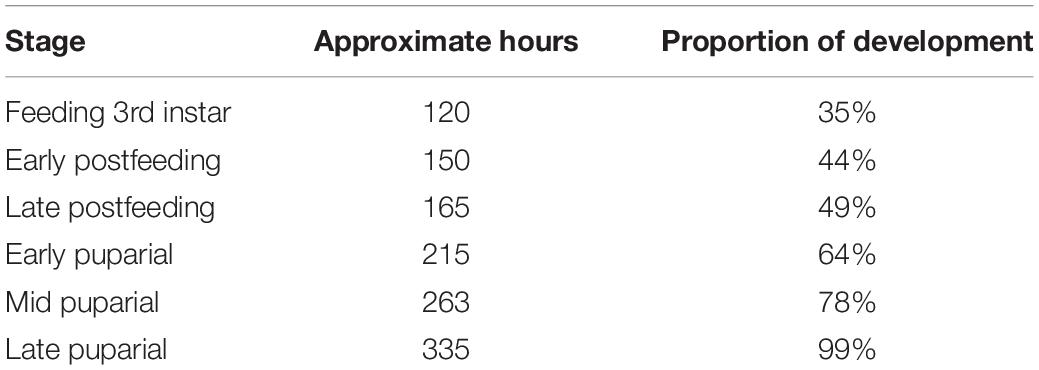
Table 3. Hours of development and proportion of development completed for each sampling group throughout immature development for gene expression validation in Chrysomya rufifacies reared at 25°C.
Gene Selection and Primer Design
Five target genes were selected from the 31_100 C. rufifacies de novo transcriptome assembly for their unique and high expression levels: Larval serum protein-1α (Lsp-1α), Transport and Golgi organization 5 (Tango5), a cytochrome p450 (Cyp28d2), Succinate dehydrogenase cytochrome B (SDCB), Juvenile hormone esterase binding protein (JHEBP). Three reference genes, Alpha Tubulin 84B (Alpha Tub84B), ribosomal protein 49 (rp49) and Glycerol 3 phosphate dehydrogenase (GPDH) were selected for expression normalization. Primers for these genes were designed and confirmed by BLAST primer design on NCBI, and node numbers (assembly 31_100) and candidate gene annotations for each of the five genes of interest can be found in Table 4.
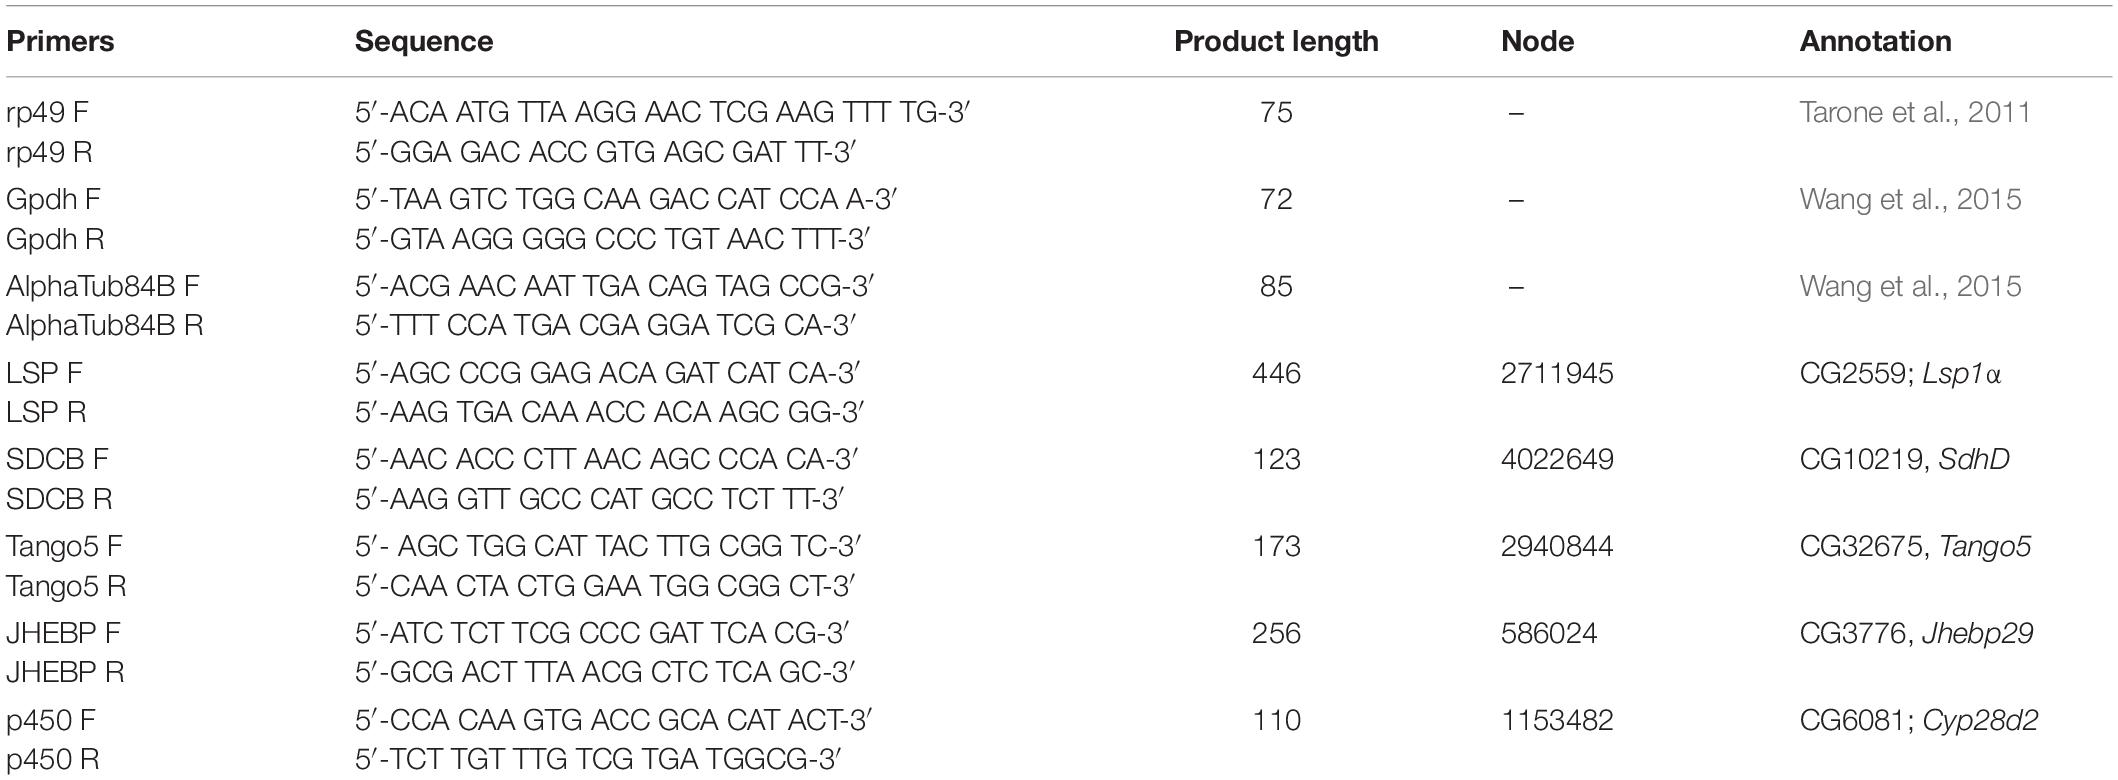
Table 4. Validation primer sequences and expected PCR product lengths.
RNA Extraction, cDNA Synthesis, and Quantitative PCR
Whole larval and puparial samples were homogenized in 1000 μl of TRI-Reagent (Molecular Research Center, Inc., Cincinnati, OH, United States) and total RNA was isolated per manufacturer’s instructions. BAN reagent (MRC) was used for phase separation and the RNA was precipitated in ice-cold isopropanol and washed with cold 70% ethanol. RNA was resuspended in 99 μl of DNase/RNase/Nucleotide-free water and 1 μl of SUPERase (Invitrogen). Quantification of RNA was performed using a NanoDrop 1000 Spectrophotometer (Thermo Fisher Scientific Inc, Wilmington, DE, United States). Prior to cDNA conversion, RNA extractions were treated with amplification grade DNase I (Invitrogen). RNA extractions were converted to cDNA using the High Capacity cDNA Reverse Transcriptase Kit (Applied Biosystems, Foster City, CA, United States) per manufacturer’s protocol. After cDNA conversion, samples were stored at −20°C. To corroborate the absence of genomic DNA, reverse transcriptase (RT) checks were performed on all samples. RT negative controls were assayed with rp49 primers. For Positive controls, rp49 primers along with cDNA samples derived from the RNA of each developmental stage were used. rp49 was selected for RT check because of consistent and stable expression level throughout the development in all the samples.
Quantitative PCR (Bio-Rad Laboratories, Inc., 248 Hercules, CA, United States) was performed and in order to measure CT values and relative gene expression for each sample. 20 μL reactions containing 10 μL SSoFastTM EvaGreen® Supermix (Bio-Rad Laboratories, Inc.), 2 μL cDNA, 2 μL primers, and 4 μL DNase/RNase/Nucleotide-free water were loaded onto 96-well plates and subjected to qPCR under following conditions: 40 cycles of denaturation at 94°C for 45 s, annealing and extension process at 72°C for 60 s followed by a 65°C – 95°C melt curve at increments of 0.5°C. Positive, negative, and no template controls were run on the same plate. Each sample reaction was carried out in duplicate, after which cycle threshold (CT) values were averaged per sample. Only PCR products with dissociated melt curves with single peaks were considered valid for final results. Three samples failed to pass qPCR expression cutoffs; one third instar library did not have an expression profile for any gene, and two samples (one early postfeeding third instar and one late pupariation sample) did not result in an expression profile for Tango5. Three libraries were excluded from analysis to balance the sampling design, randomly selected from each one in each of the other remaining developmental time points, resulting in 11 samples per sampling group.
In order to estimate relative gene expression for each gene of interest, 2–Δ Δ CT was calculated for each gene by using average CT values across the replicates. The CT value for each target gene was standardized against three reference genes (rp49, Gpdh, and AlphaTub84B) by subtracting the geometric mean of the reference genes CT from average CT of each target gene. Stability of reference genes was verified by measuring M values using the program geNorm. All reference genes had M-values ranging from 0.215 to 0.232, well within the recommended < 1.0 value.
Sex identification for each sample was performed as in Jonika et al. (2020). Briefly, cDNA conversion was performed on original RNA extractions, as above, for PCR amplification of the sex specific DSX gene product. Samples identified as female and male were used for sex specific analyses, whereas any samples without a confident sex identification were not included for sex specific analyses.
Statistical Analyses
Values of normalized relative gene expression were compared between developmental stages for each gene using ANOVA, where relative gene expression was the dependent variable and developmental stage was the independent variable. For sex specific comparison, gene expression was the dependent variable and sex and developmental stage were independent variables with an interaction effect included. Tukey HSD was performed as a post hoc test for both types of analyses with significance set at the p < 0.05 level.
Results
Males Develop Faster Than Females
A total of 937 flies survived to eclosion, with only one of four replicates of having significantly higher than average survival (replicate B), and survival rates for the four replicates were: 222/300, 261/300, 219/300, 235/300. All replicates had sex ratios that were significantly male skewed (t-test, p < 0.0001), which has been observed before (Pimsler et al., 2019), with replicates A and B, and C and D not being significantly different from each other (t-test, p > 0.05), exhibiting a M:F ratio of ∼ 2:1 overall. Female overall immature development from oviposition to eclosion was 9.74 h slower than males (REML, p < 0.0001), with a 4.41 h difference in oviposition to pupariation time (REML, p < 0.0001) and a 1.41 h difference in pupariation to eclosion times (LM, p < 0.0001) (Table 5 and Figure 2). Based on estimated lower developmental thresholds (Figure 1) and the model-estimated sexually dimorphic development times (Table 5), this represents ADH differences between males and females of 90–108 for egg hatch to pupariation, 27–32 for pupariation to eclosion, and 200–240 across all of immature development.
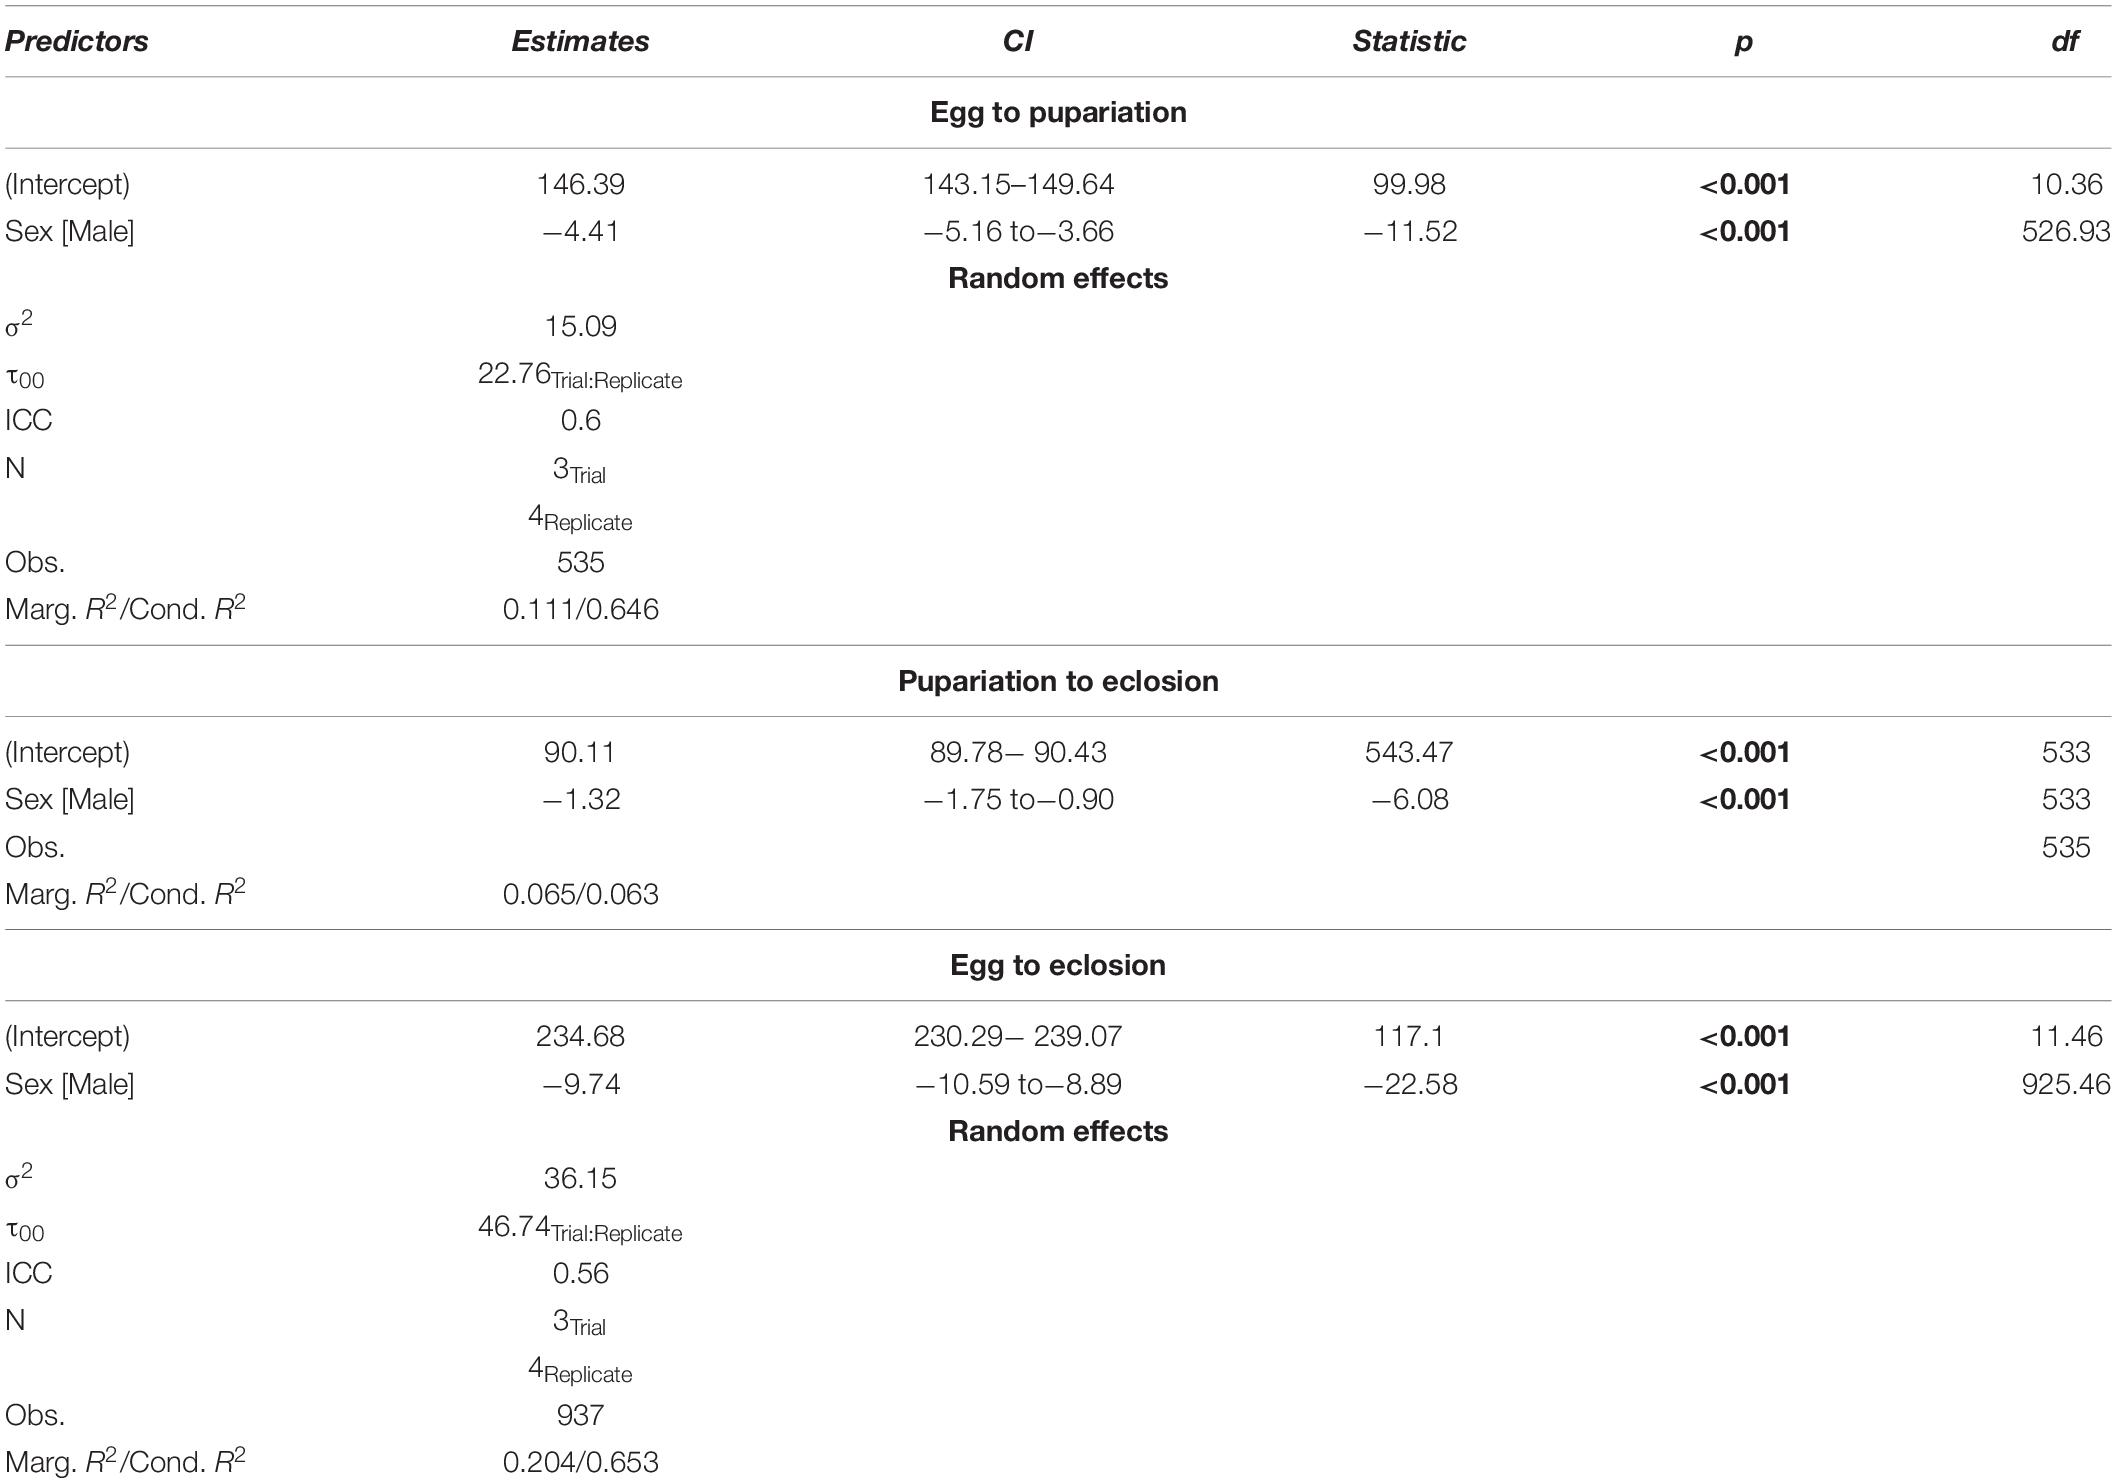
Table 5. Chrysomya rufifacies demonstrates significant sexual dimorphism in development rate in throughout immature development when reared at 30°C.
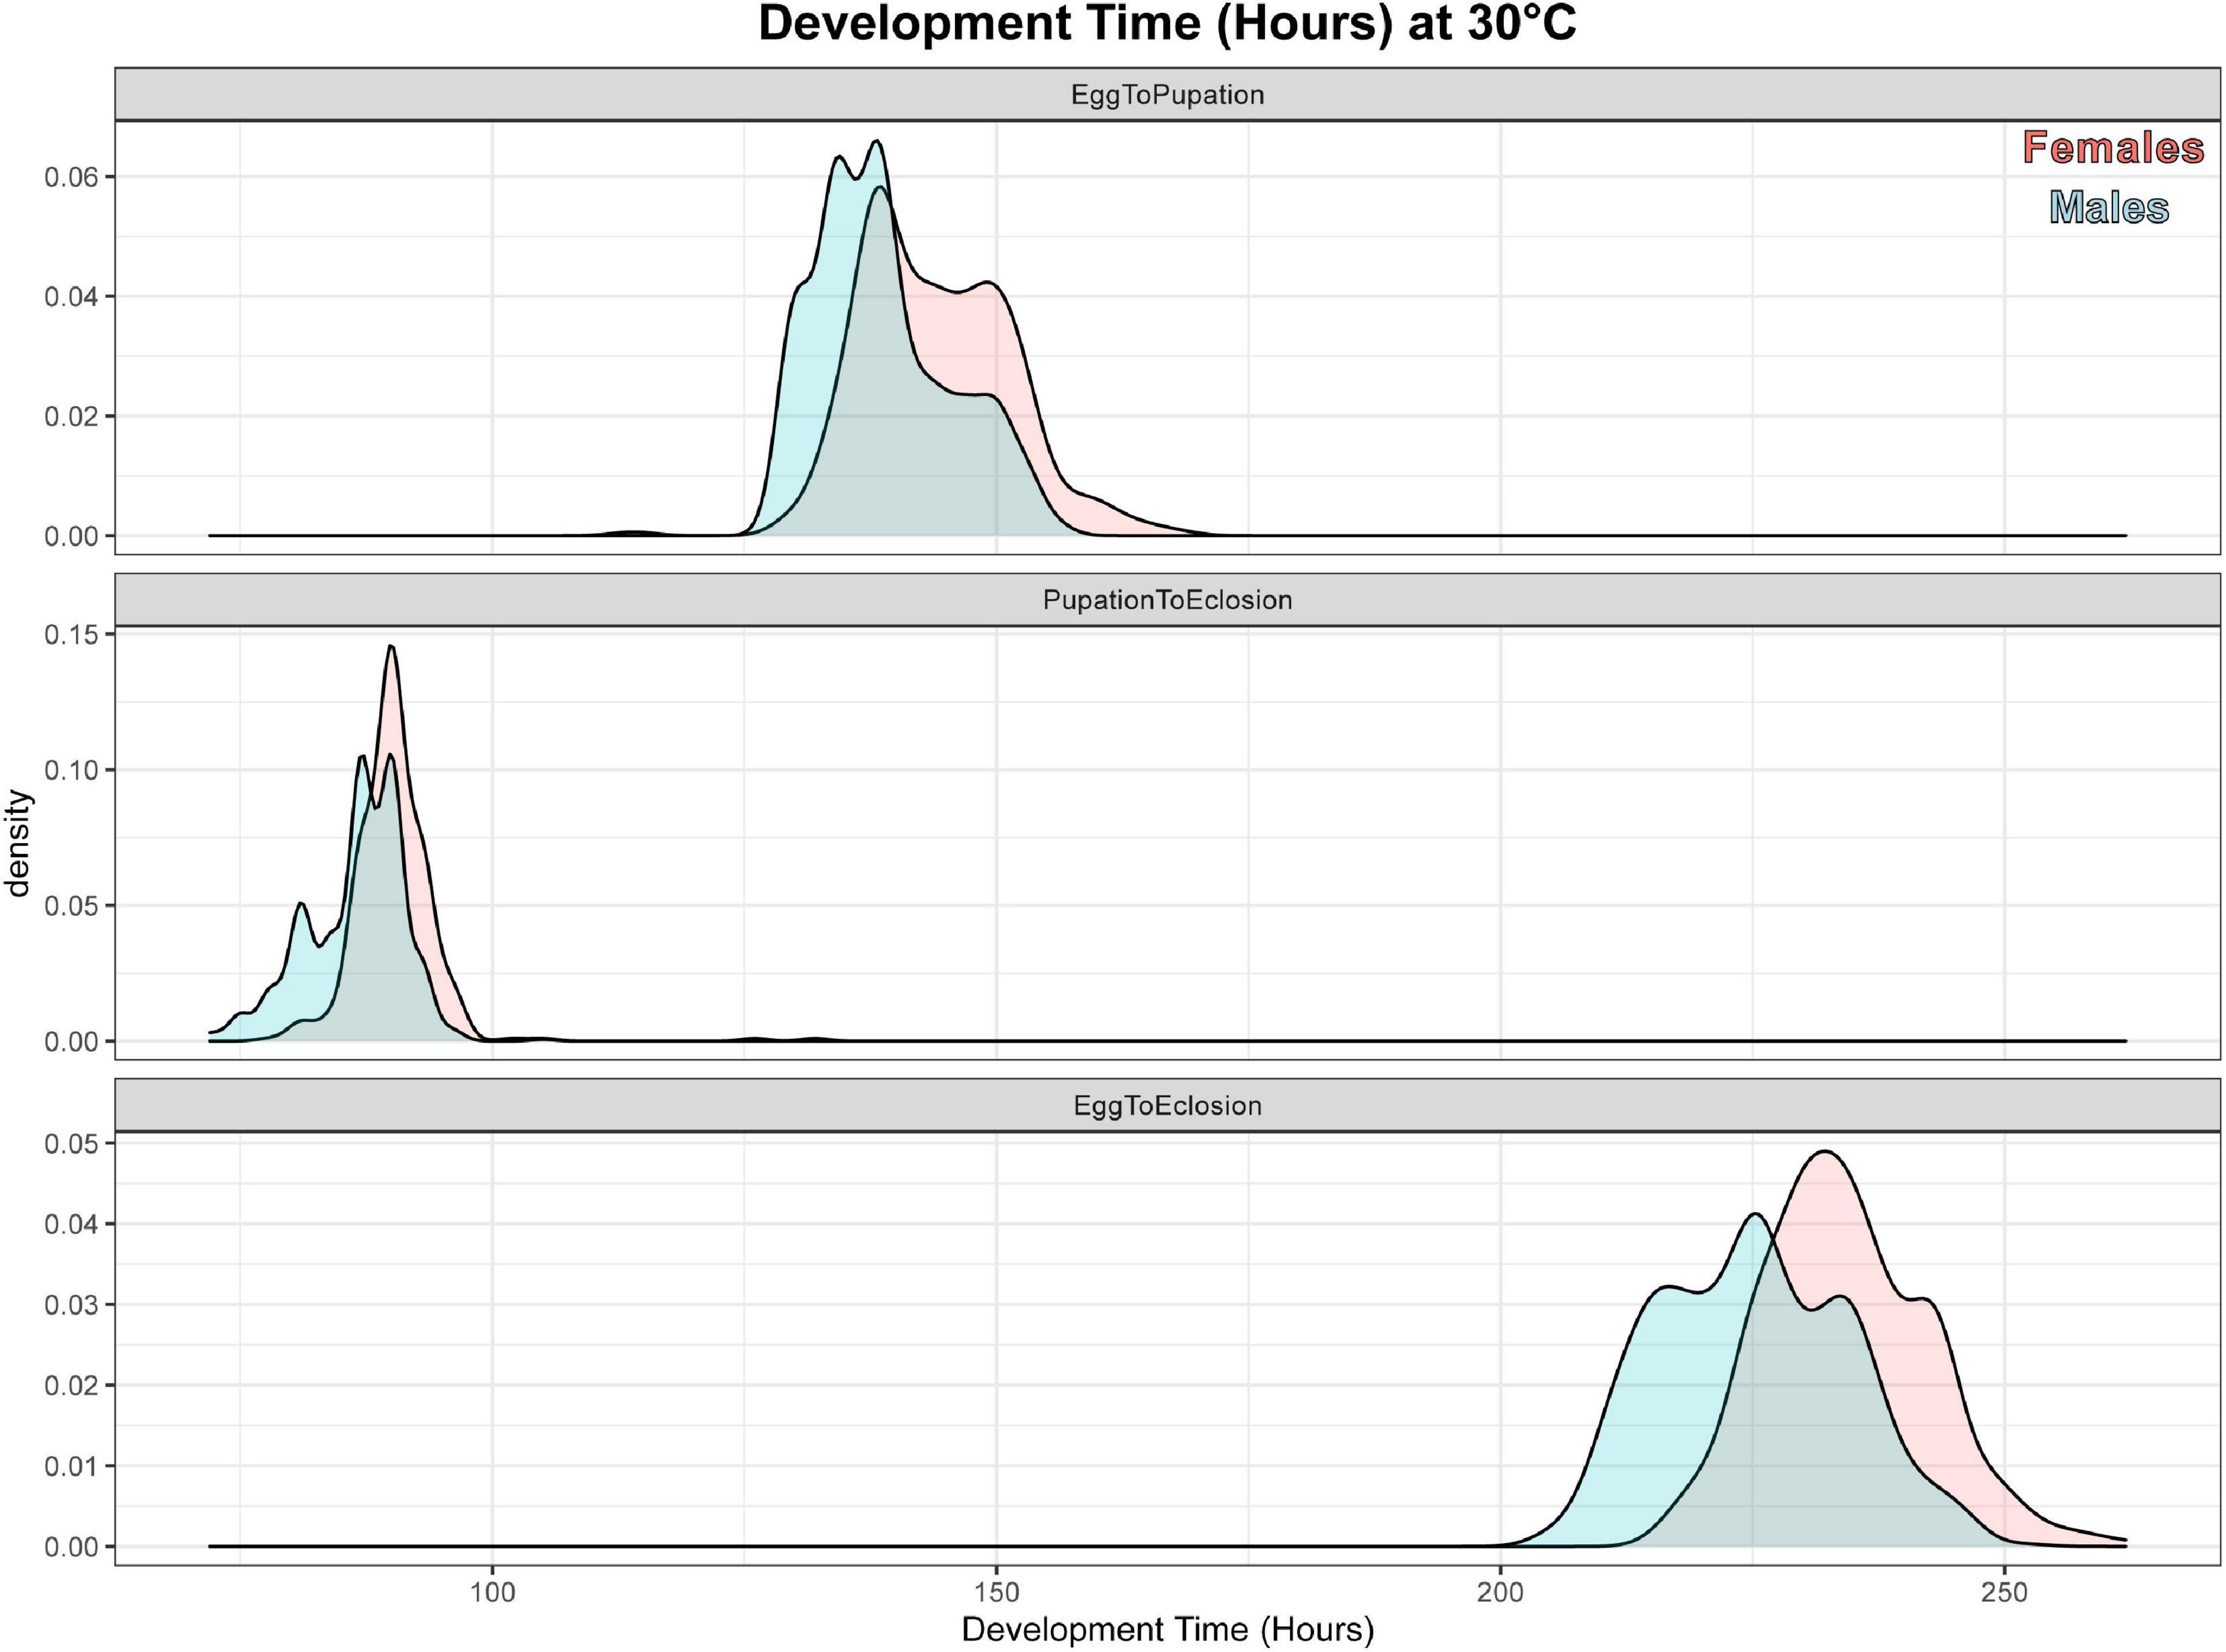
Figure 2. Density plot of sexual dimorphism in development rate for C. rufifacies at 30°C. These are density plots of hours elapsed (x-axis) for male (blue) and female (red) C. rufifacies reared at 30°C, 12:12 LD for time elapsed from egg to pupariation (top panel), pupariation to eclosion (middle panel), and egg to eclosion (bottom panel).
Most Nodes Are Differentially Expressed
We used RNAseq and a novel bioinformatic transcriptome approach that preserves splicing information to investigate ontological and sexually dimorphic patterns of gene expression throughout immature development (which depends on splicing). All analyses were conducted on a per-node basis, with a node representing an unambiguously assembled contig, where nodes are connected to each other through edges within a splicing graph. To simplify analyses and interpretation, we confined our analyses to nodes which assembled in to ≥100 bp in length and which were expressed in at least 2 samples, resulting in 81,205 nodes (with homology to 4,965 D. melanogaster genes at our conservative a priori BLAST cutoff).
In our preliminary approach, we explored the data by identifying best fit linear models for each node using Akaike Information Criterion (AIC) (McCarthy et al., 2012). Nearly all nodes (97.6%; 79,324/81,205 nodes; Table 6) were best fit by a model that included sex, developmental stage, or some combination of the two, suggesting broad genome-wide differences in gene expression throughout development. Most nodes and genes were best fit by models that included only stage. The MDS results further supported the results of the best-fit modeling, as developmental stage, rather than sex, was the primary factor affecting MDS axes 1 through 4 (see Figure 3).
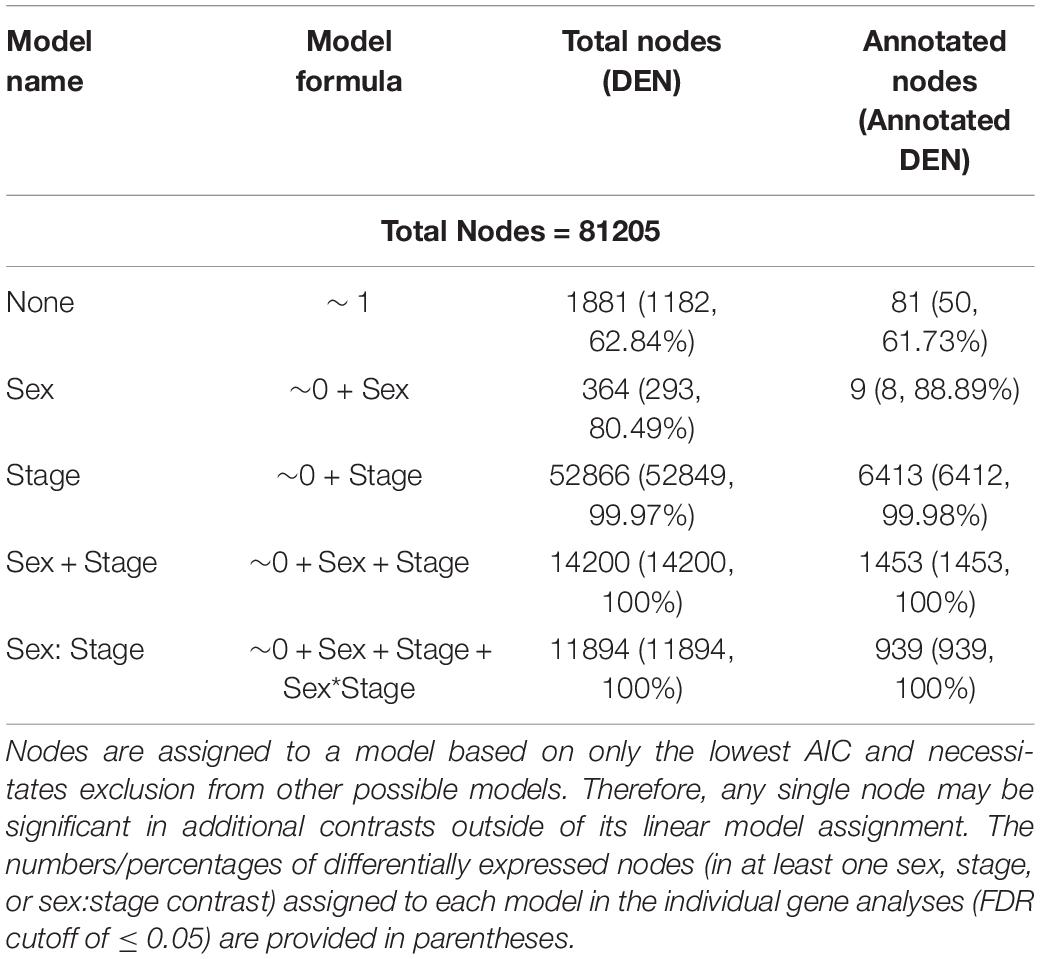
Table 6. Numbers of differentially expressed nodes (DEN) as a function of stage of development and/or sex from linear models in limma.
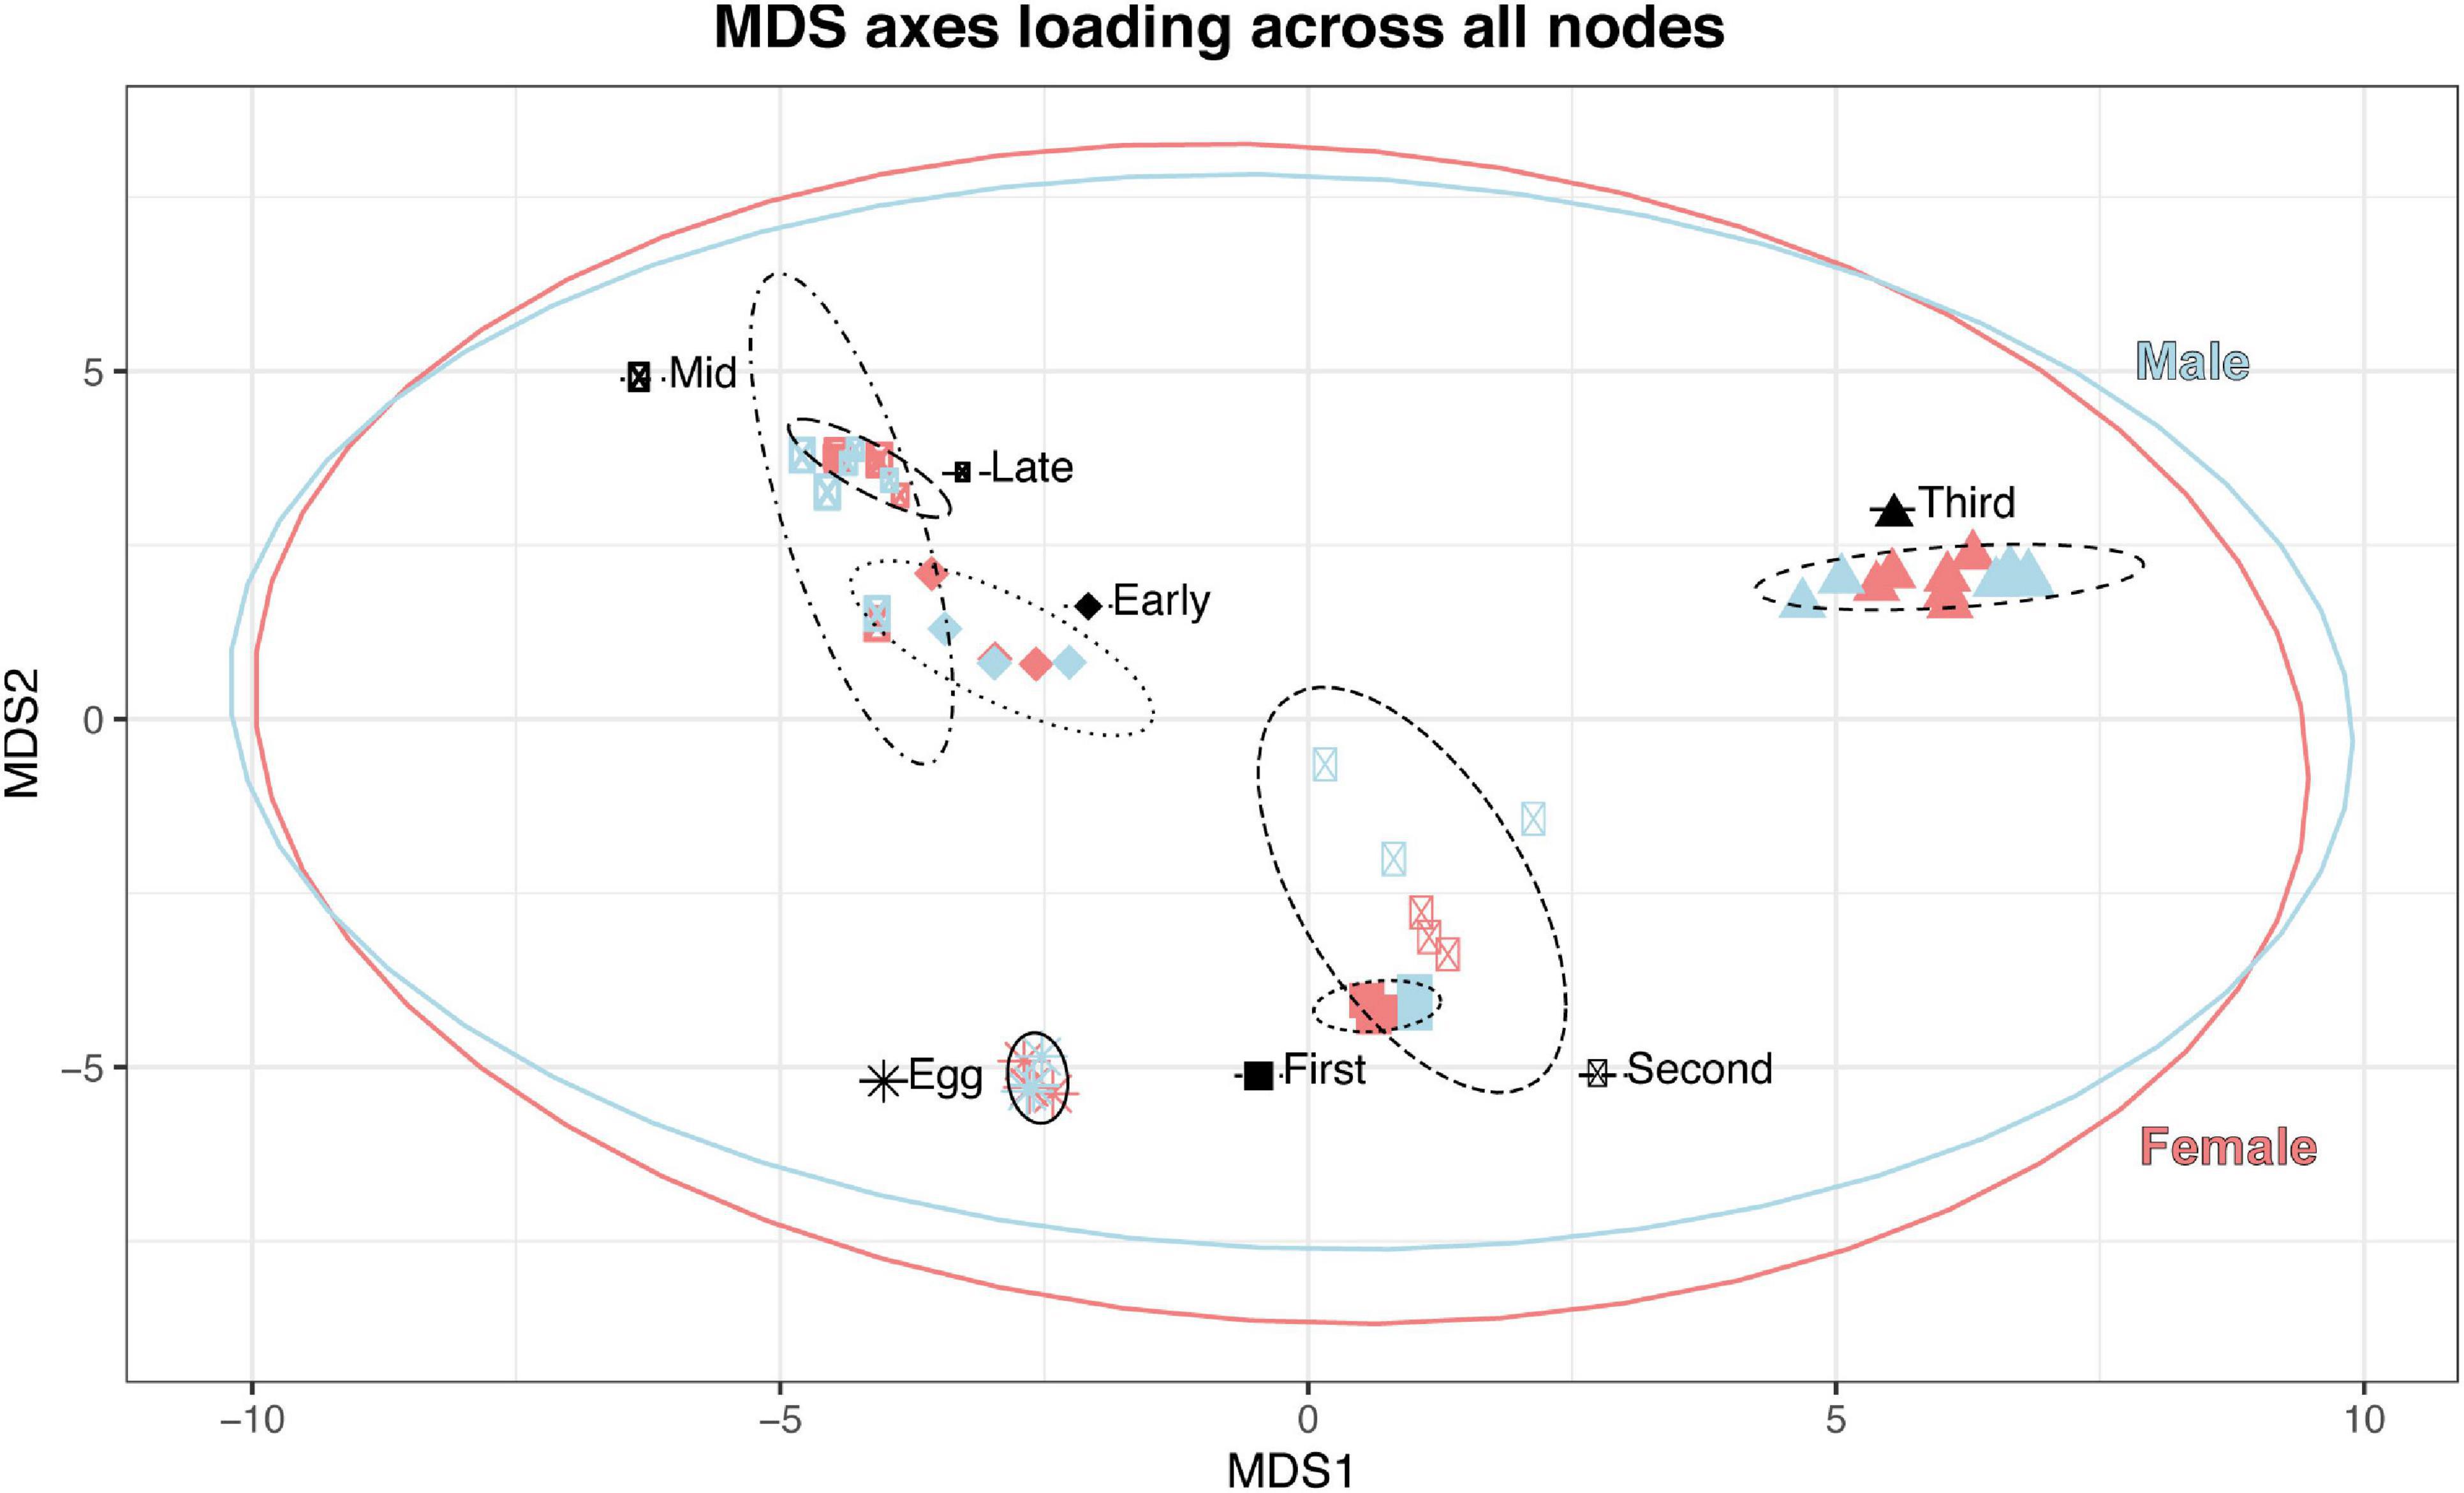
Figure 3. Stage (as indicated by shape and ellipse linetype) is the most significant factor in clustering on MDS axes 1 and 2; sex (color) exhibits a smaller effect on clustering of immature samples, and the summary ellipses overlap.
Next, we evaluated node-specific statistically significant patterns of gene expression (Benjamini and Hochberg, 1995) FDR ≤ 0.05) using edgeR (Robinson et al., 2010) and limma (Ritchie et al., 2015). First, we were interested in whether ontological gene expression patterns in C. rufifacies were similar to those observed in other holometabolous insects (21 pairwise comparisons, known as contrasts, between developmental time points). Second, we also looked for whether and when sexual dimorphism in gene expression was initiated through two approaches. We evaluated differences between the sexes within a stage (14 pairwise comparisons; e.g., male eggs versus female eggs, male mid-puparial development versus female mid-puparial development), as well as differences within development between the sexes (21 pairwise female-specific and 21 pairwise male-specific ontological gene expression patterns). Most nodes demonstrated significant differential expression in at least one pairwise contrast (98.4%; 79,922/81,205 nodes; Supplementary Material 6). Most of these nodes demonstrated both developmental and a sex:stage pattern of differential expression (97.6%, 78,067/79,922 nodes; Figure 4). All differences in node expression globally between males and females (all male samples versus all female samples) also demonstrated differential expression in other contrasts.
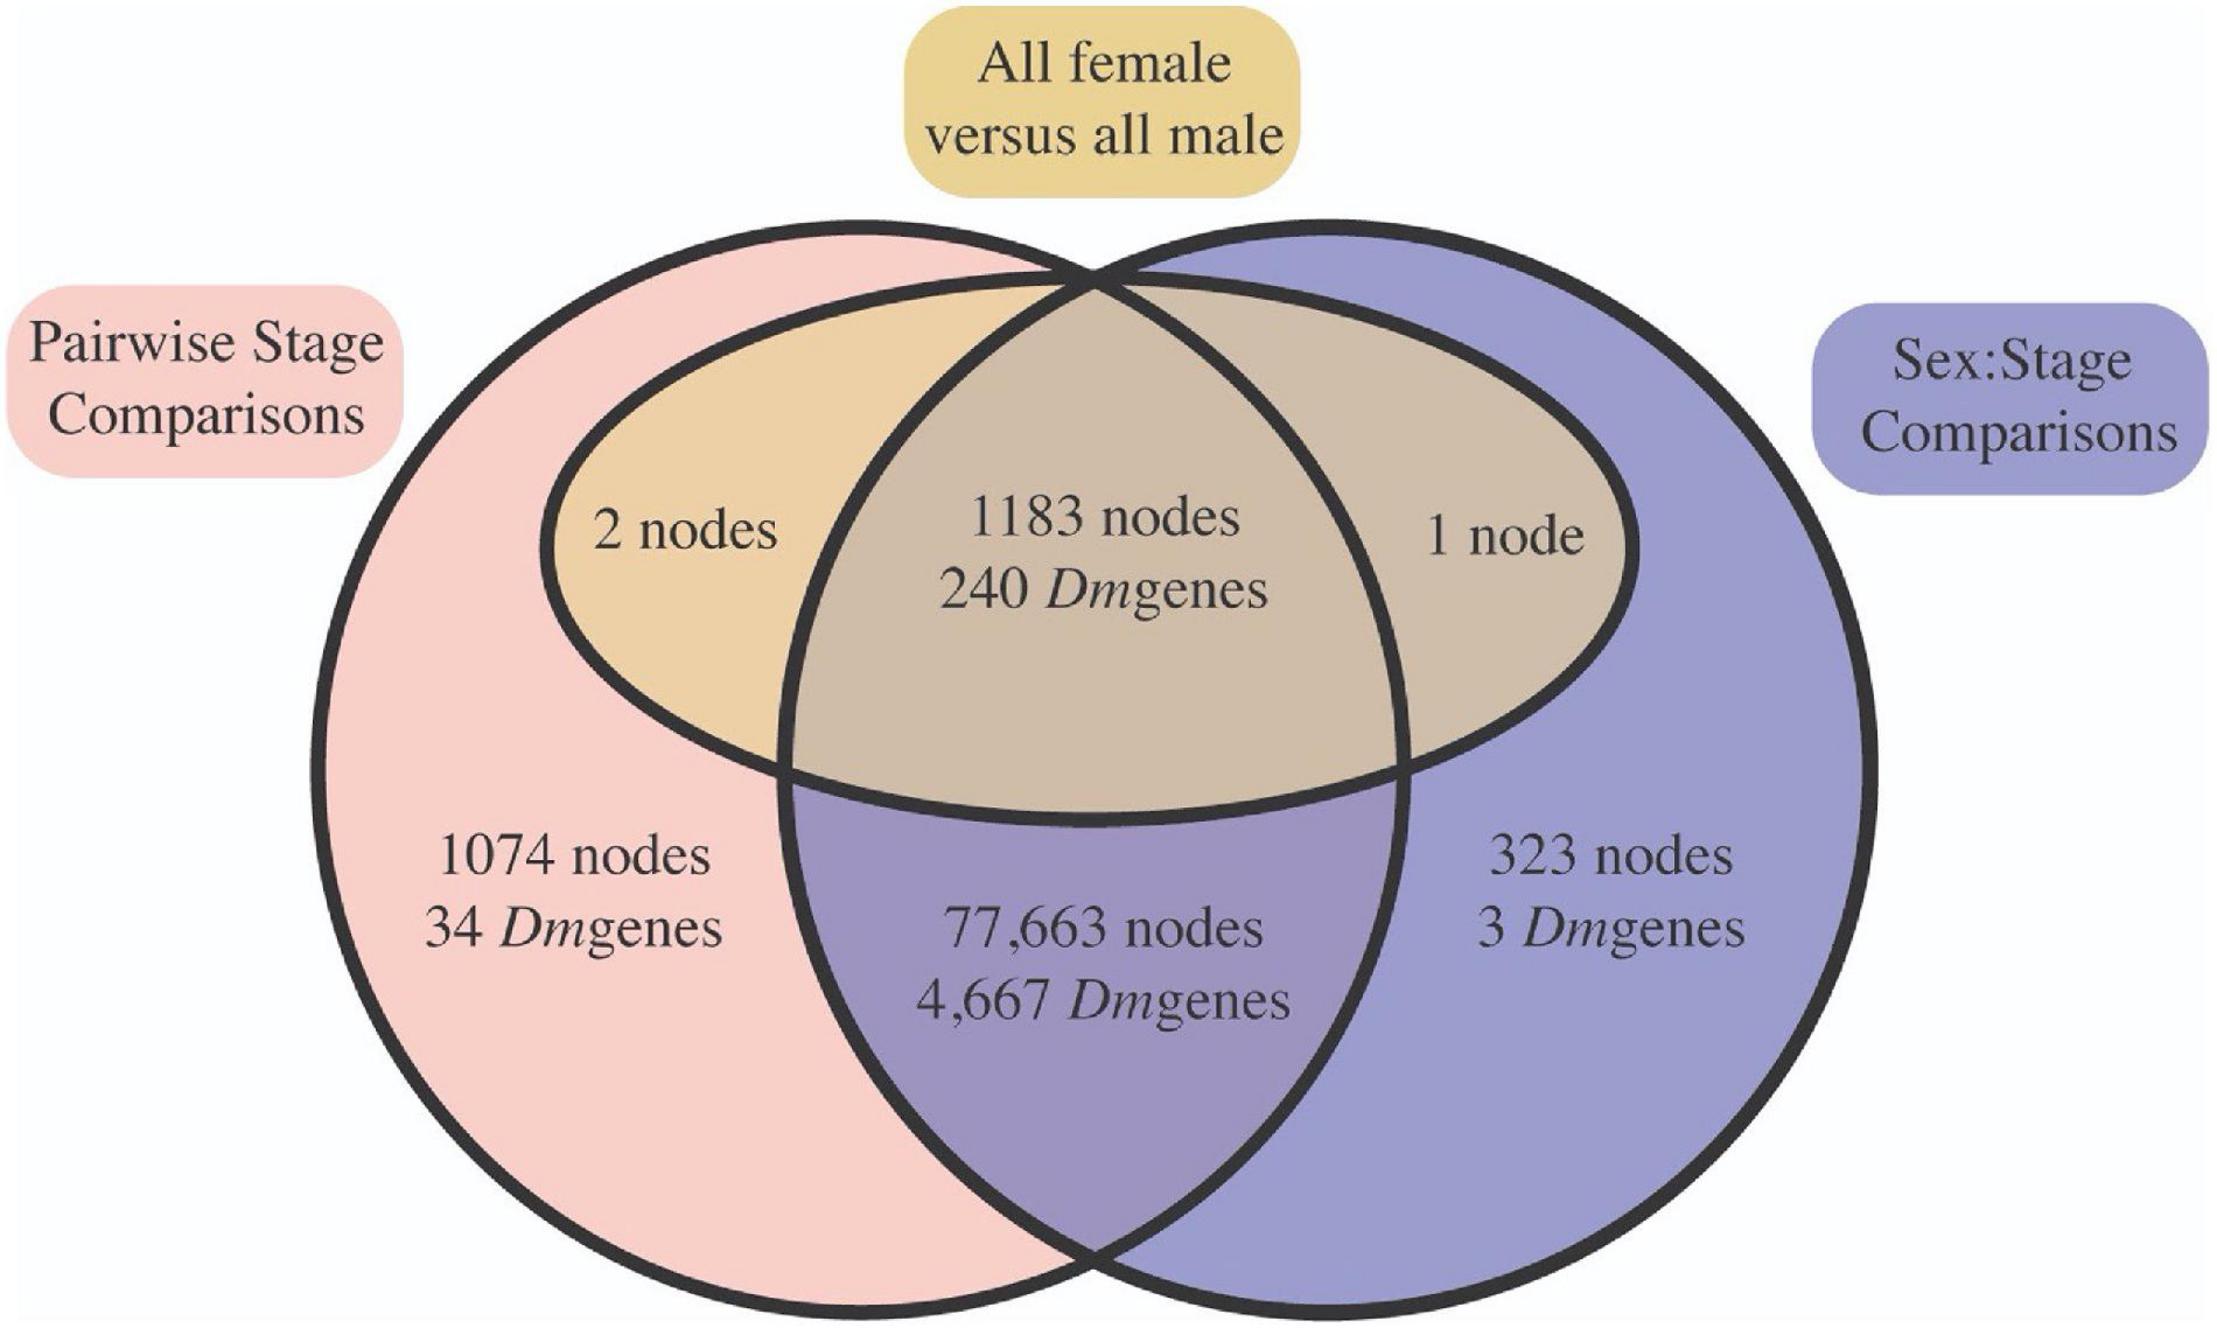
Figure 4. Most differentially expressed nodes were significant in both stage (red) and sex:stage interaction (blue) contrasts, suggesting that there is broad differential expression across both development and in a sex-significant manner. This is supported by the fact that most of the nodes significant between all male and all female samples pooled across immature development (yellow) were also significant in at least one stage specific contrast. Node identities can be found in Supplementary Material 6.
Immature Gene Expression
In total, 64,246 nodes were differentially expressed across all pairwise stage contrasts, representing 79.1% of all nodes passing quality and coverage cutoffs. Generally, most genes and gene ontology analyses exhibited patterns of expression consistent with those observed in D. melanogaster (Arbeitman, 2002). The egg stage demonstrated the most unique expression pattern, with 50,912 (6,408 annotated) nodes differentially expressed between eggs and all stages pooled together, although eggs had the second highest total number of differentially expressed nodes (62,358 nodes with 7,475 annotated compared to third instar larvae at 62,691 nodes with 7,490 annotated).
As there are simple, reliable morphological methods to identify eggs, first, second, and third instar larvae, we will limit our discussion of contrasts involving these four developmental stages. Overall, patterns of GO enrichment and dis-enrichment are in line with patterns that have been observed in other flies (Lebo et al., 2009; Supplementary Materials 7, 8). Eggs demonstrated increased expression of genes related to growth, cell division, and DNA replication relative to all other stages, including nodes with homology to Drosophila genes such as slam (Lecuit et al., 2002). Within and between larval stadia comparisons demonstrated enrichment of GO terms associated with vesicle transport, exocytosis, macromolecule metabolism, digestive tract, imaginal disk development, and locomotion.
A large number of nodes were differentially expressed over the course of pupariation. Early in the process, there was an enrichment of nodes related to endocytosis and the positive regulation of the Notch signaling pathway relative to mid and late pupariation. This is also the point in pupariation where male germline associated nodes became enriched, as well as regulation of gene silencing and small GTP mediated signal transduction, all of which continue until decreasing in expression late pupariation. Midway through pupariation saw the beginning of enrichment of eye morphogenesis and development, developmental programmed cell death, and the negative regulation of RAS protein signal transduction which continues through late pupariation. Mid pupariation also demonstrated an enrichment of cellular homeostasis and metabolic processes associated nodes relative to early and late pupariation. Furthermore, at the middle of pupariation, we see dis-enrichment of positive regulation of the WNT and smoothened (hedgehog) signaling pathways, as well as hormone biosynthetic processes, though nodes associated with these GO terms become enriched again in late pupariation. Late pupariation also demonstrated enrichment of nodes associated with antiporter activity, biological regulation, and anion transmembrane transporter activity.
Of particular interest is the identification of genes which can be used to estimate the age of an insect. We selected differentially expressed nodes based on whether they had D. melanogaster homology, were differentially expressed between puparial stages, and exhibited patterns observed in previous studies on developmental patterns of gene expression in flies. We also selected some nodes that were differentially expressed between third instar larvae and early puparial development, as these may be useful in quantifying another difficult to measure age-based phenotype, the transition from feeding to post-feeding third instar larvae. This putative list was further pruned after investigating sexual dimorphism in gene expression (below).
Differential Expression of Sex Related Genes
Eggs demonstrate differential expression of 21 sex-determination and dimorphism related genes relative to the other stages of development: three downregulated (dsx, fruitless [fru], and takeout [to]), one with mixed patterns (Trithorax-like [Trl]), and 11 upregulated (Supplementary Material 6). Of particular interest is the upregulation in eggs of daughterless (da), Sxl, groucho (go), and sisterless A (sisA), given past research in C. rufifacies (Clausen and Ullerich, 1990; Muller-Holtkamp, 1995; Andere et al., 2020) or their patterns of expression in eggs of other species (Morrow et al., 2014b; Salvemini et al., 2014b; Sawanth et al., 2016). Nodes from the gene dsx are not expressed until the third instar (Figure 5), and expression levels do not differ significantly throughout the rest of development. The expression of fru begins in the second instar, and remains high throughout the rest of development (Figure 6). The gene to shows two peaks, one in third instar larvae and then again late in pupariation (Figure 6). The gene tra is differentially expressed throughout development beginning in eggs and is discussed in more detail below (Figure 7).
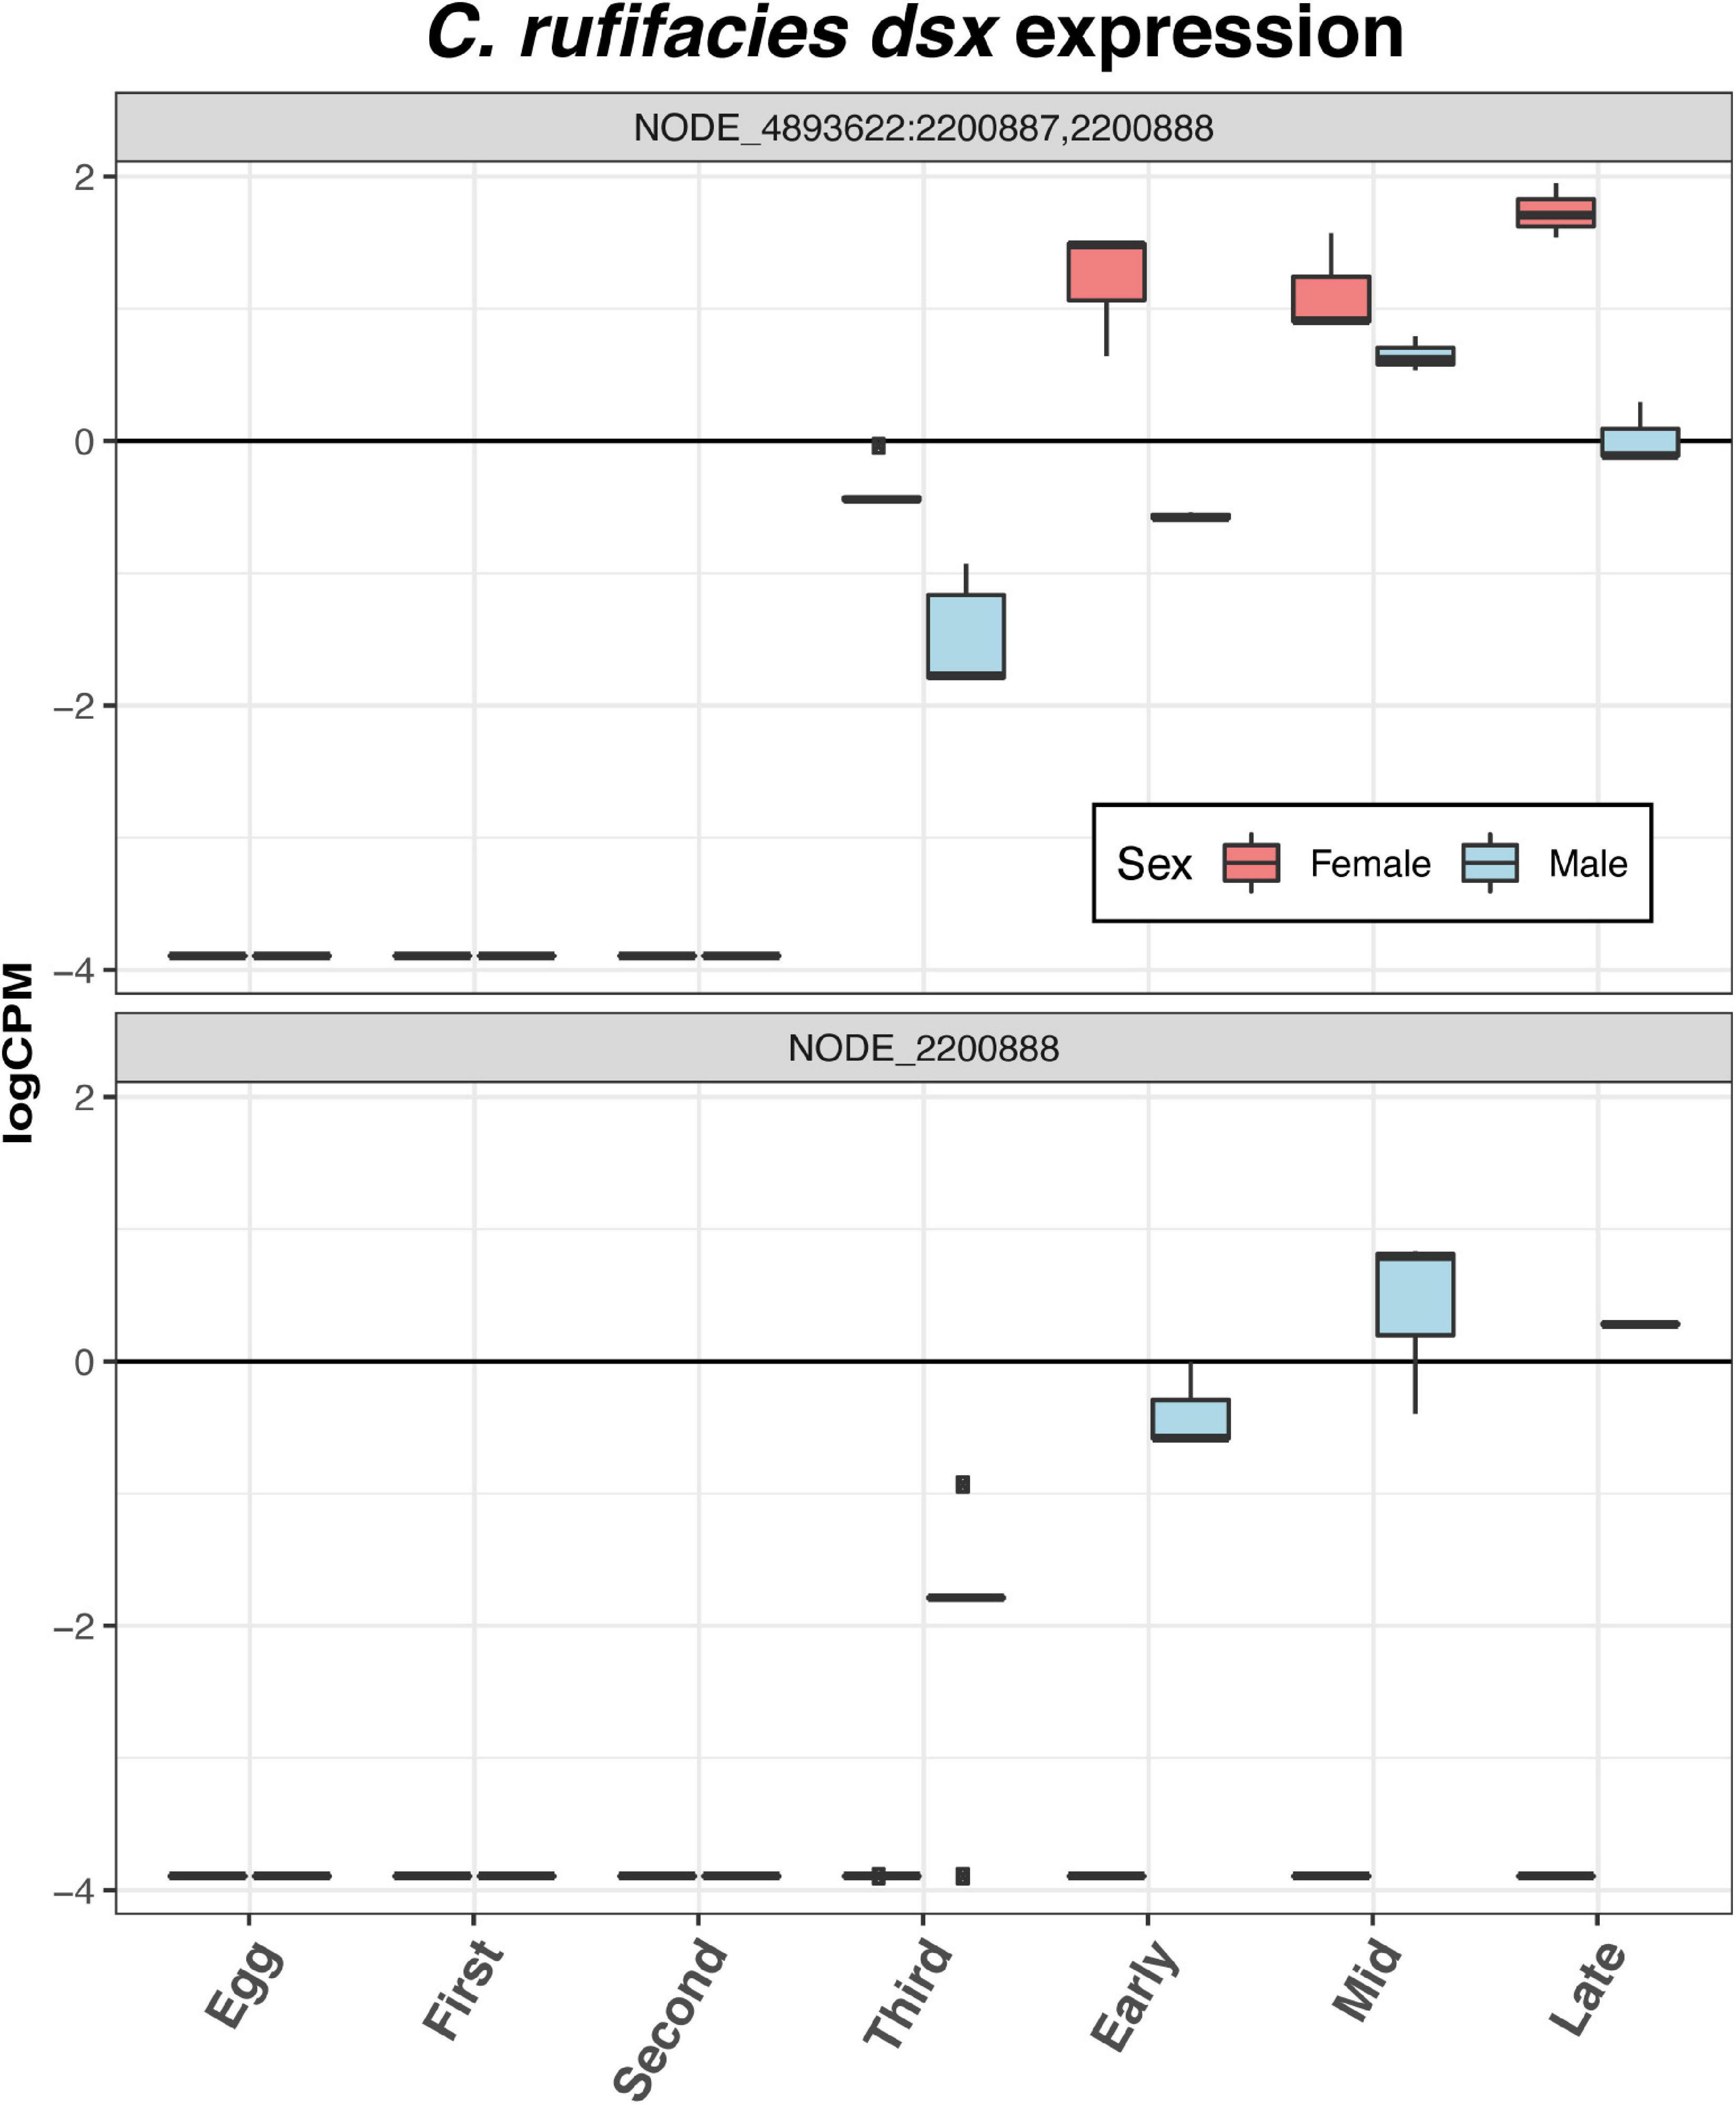
Figure 5. Both nodes with homology to D. melanogaster dsx that passed the filtering cutoffs demonstrate sexual dimorphism in expression. In both sexes, expression is initiated in the third instar, though one node is only expressed only in males.
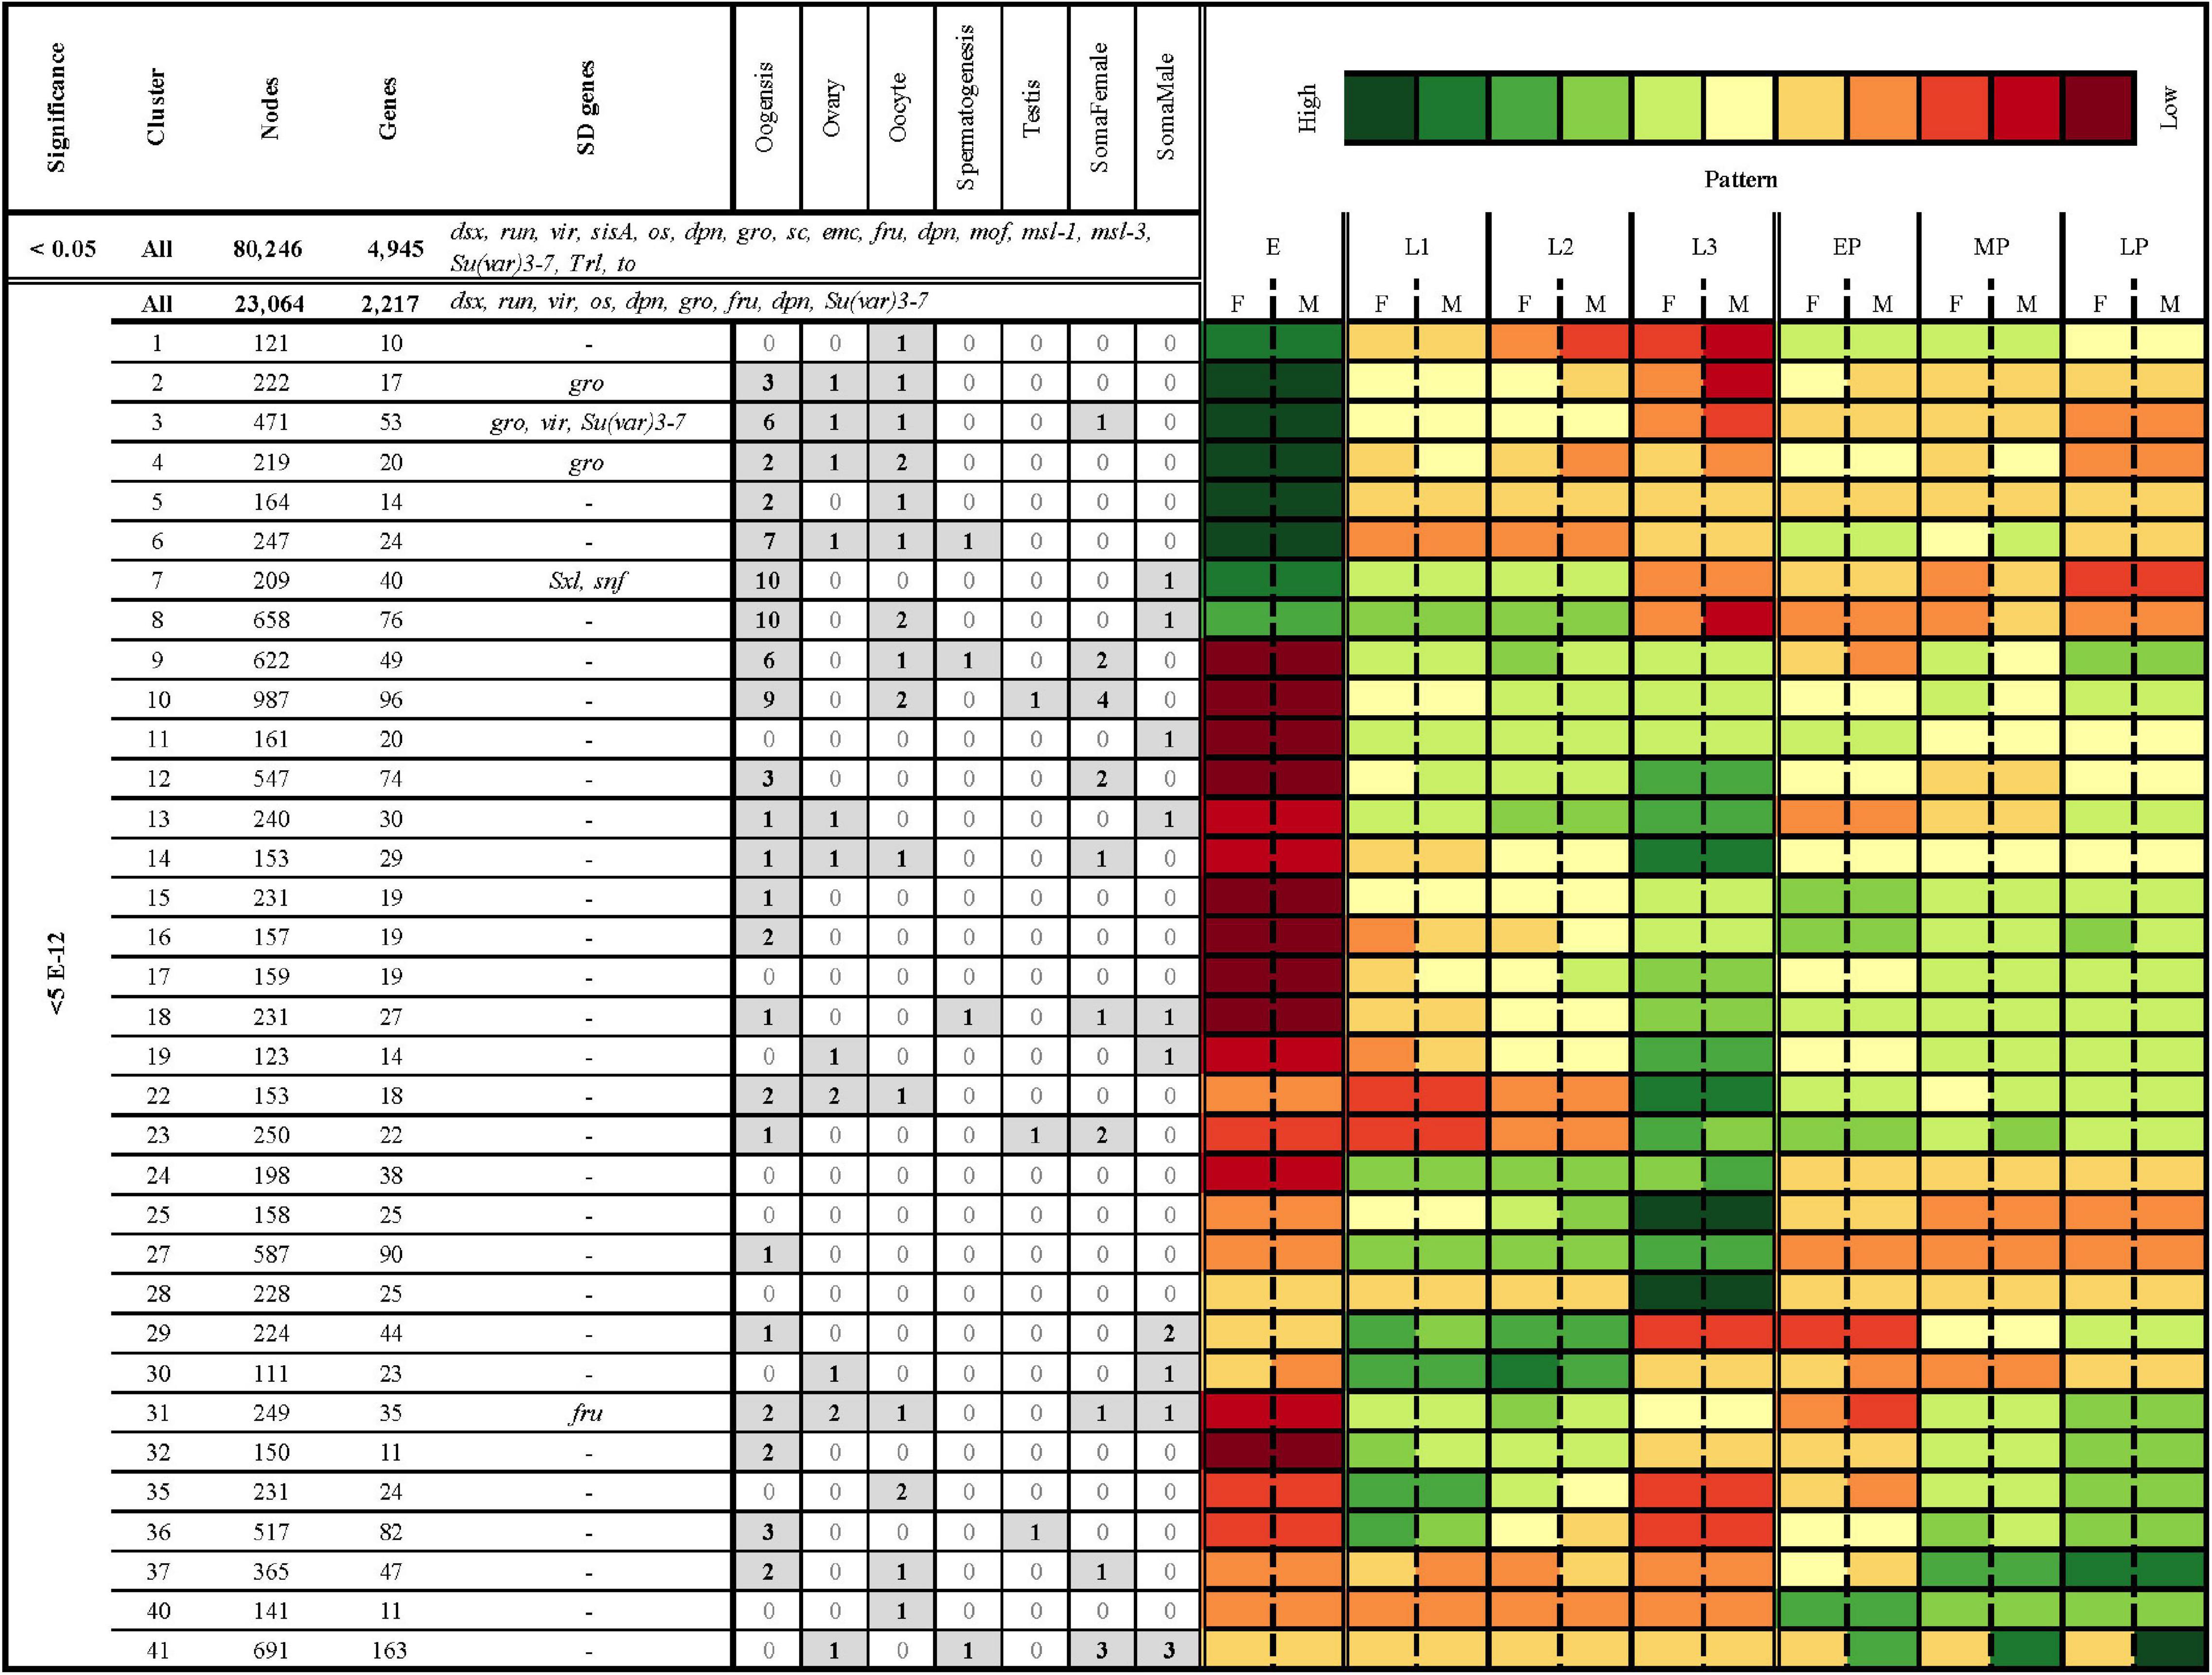
Figure 6. Clustering of all significantly differentially expressed genes (FDR < 5e-12) resulted in 41 clusters with an average Pearson correlation of 0.85 and 100 nodes or more. Columns from left to right: Level of significance (p-adjusted cut-off), cluster, number of nodes, number of D. melanogaster gene hits, D. melanogaster sex-related genes hits, number of hits to genes with tissue and/or sex specific patterns of expression from other species, and a heatmap of average logCPM expression in females (F) and males (M) in eggs (E), first instar (L1), second instar (L2), third instar (L3), early in pupariation (EP), mid pupariation (MP), and late in pupariation (LP). The sex-related gene hits are those genes which have been identified to play a crucial role in sex-determination and sexual-dimorphism in D. melanogaster (Baker et al., 1989; Erickson and Cline, 1998; Grath and Parsch, 2016). The tissue and sex-specific gene hit lists were identified a priori based on results from previous work in D. melanogaster studying somatic and gametic patterns of gene expression, including within tissues (ovaries, oocytes, and testis) and related to gametogenesis (spermatogenesis and oogenesis) (Lebo et al., 2009; Chang et al., 2011). There are three different nested sets of genes in this table. The top row (<0.05; All) represents all nodes identified as differentially expressed in the analyses. The second row represents all nodes differentially expressed in the analysis at a FDR cutoff of 5e-12. The remaining rows are all of the nodes in that set which are also in a cluster with an average Pearson correlation > 0.85 and 100 nodes or more (where to find data that produced this table).
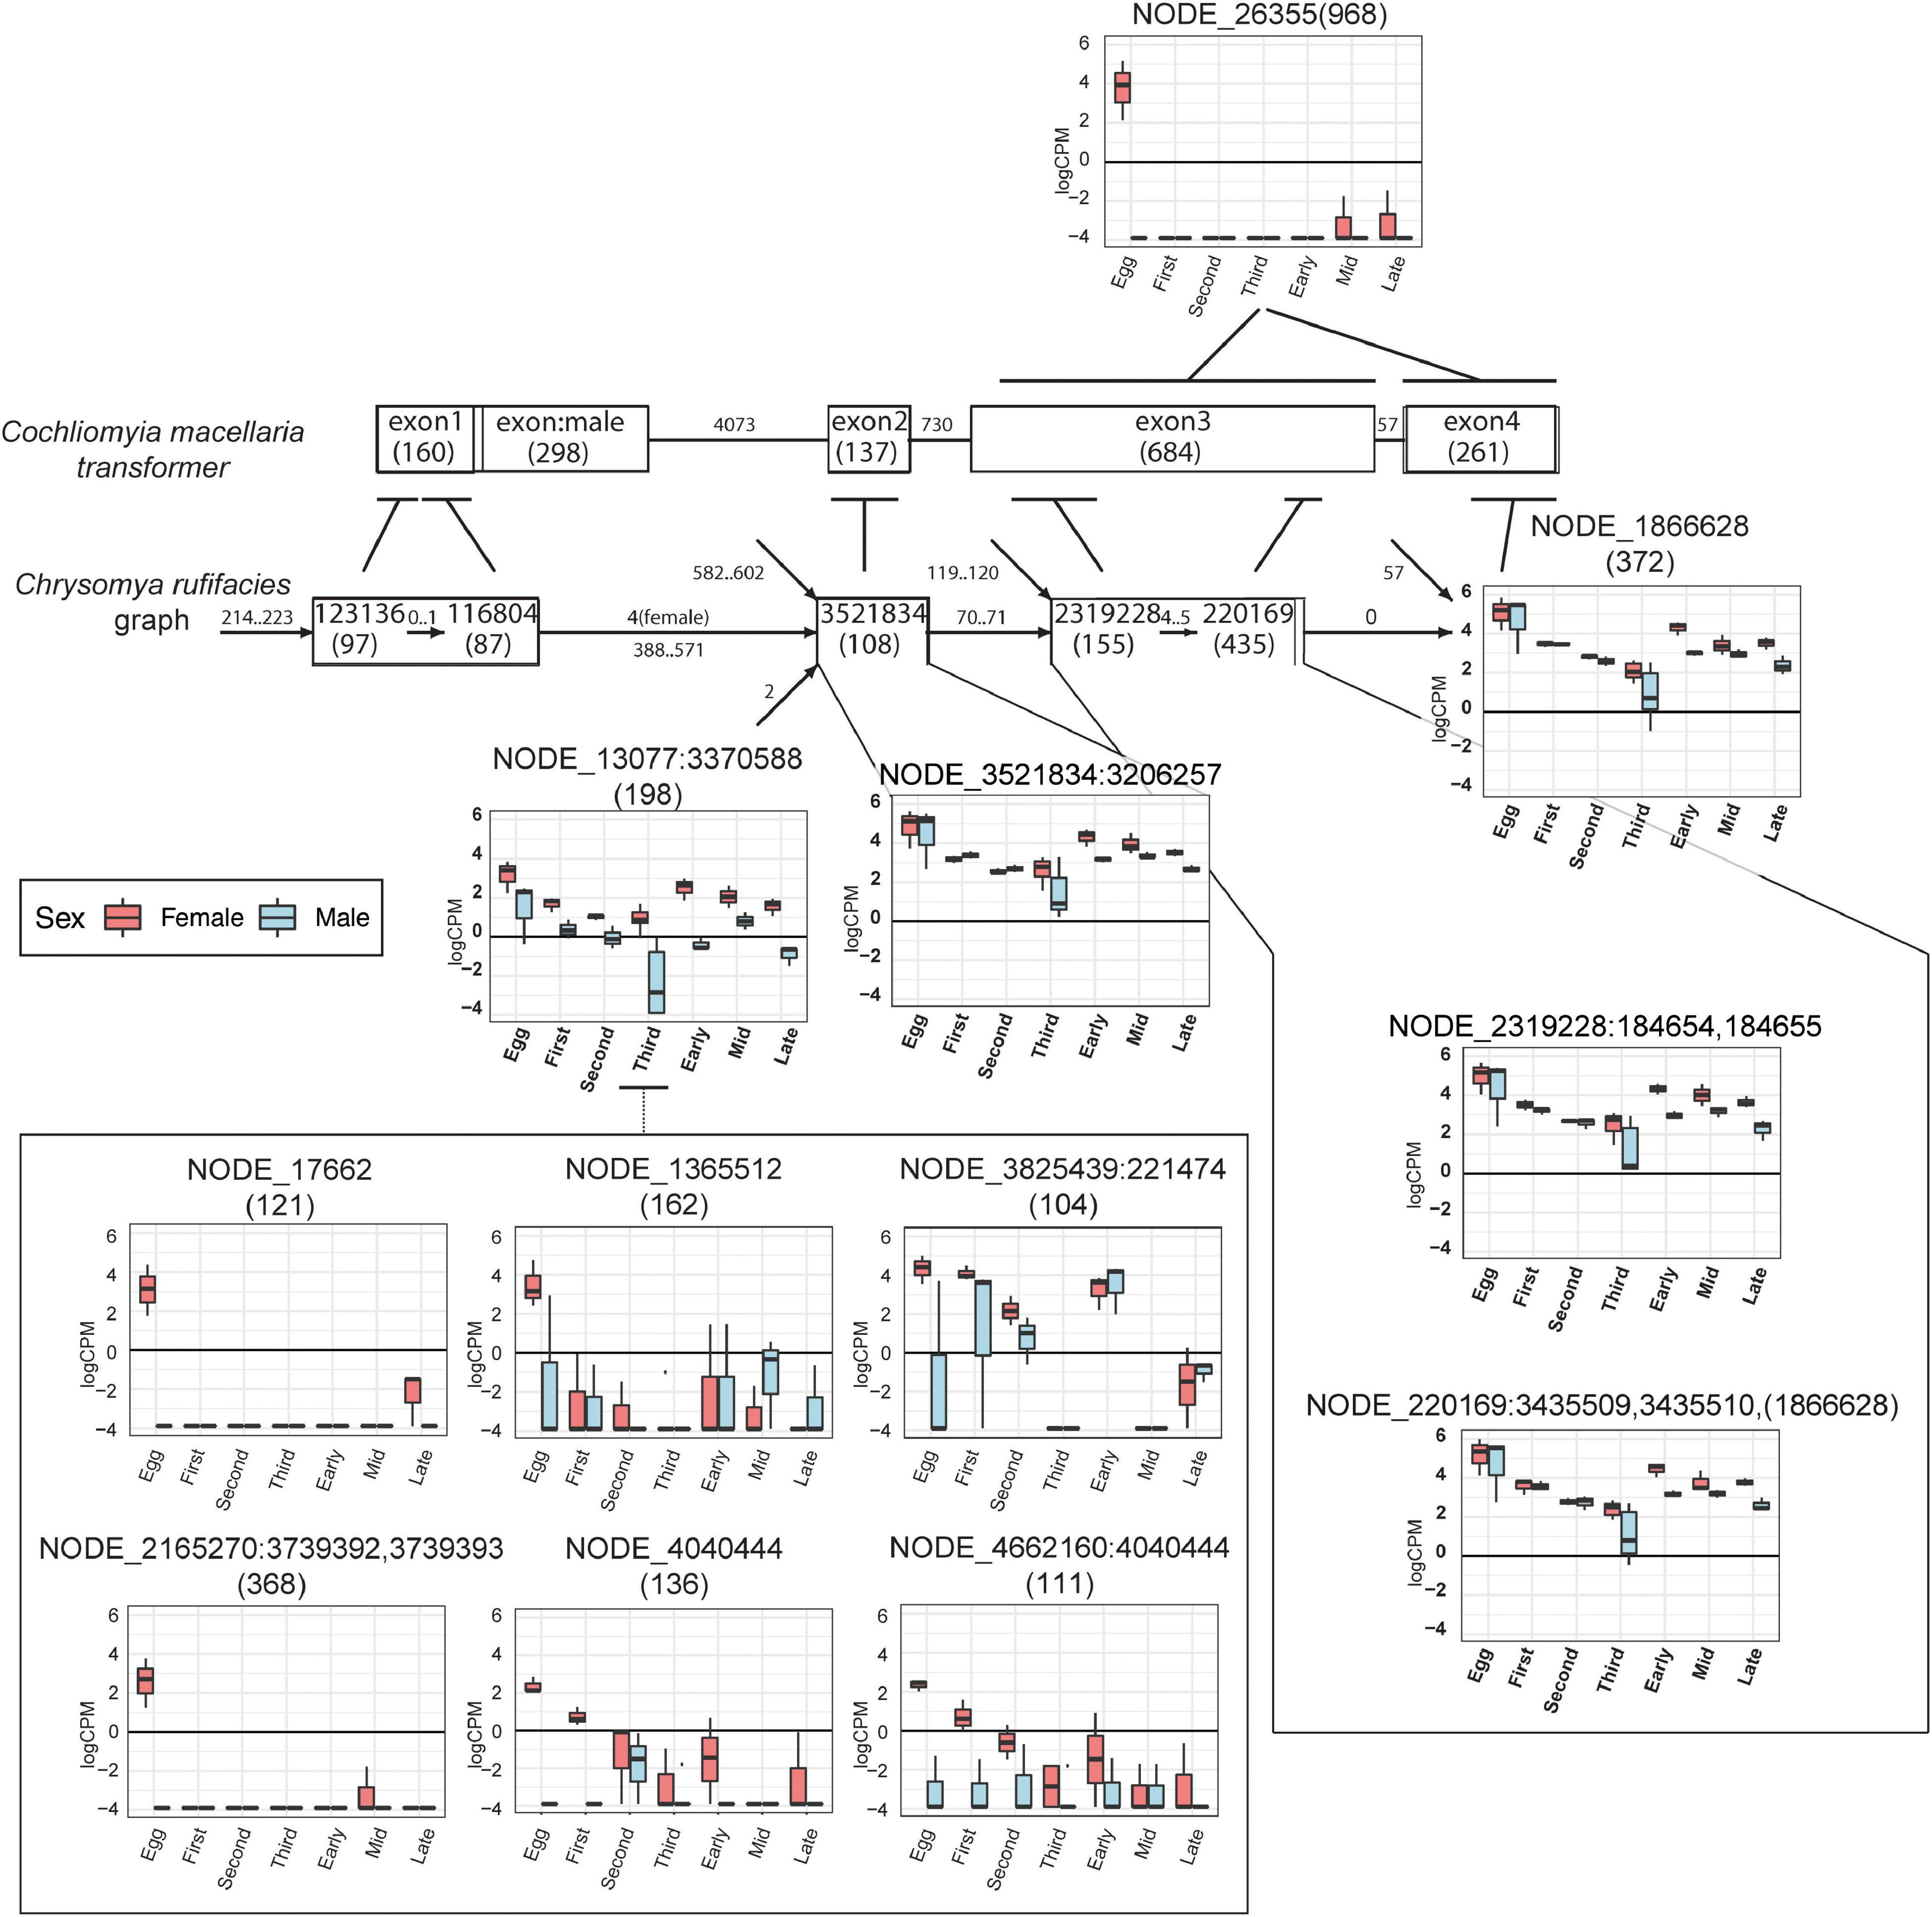
Figure 7. Putative transformer nodes have sex- and stage- specific patterns of expression. Condensed splicing graph in 31_100 assembly of C. rufifacies containing nodes that have hits to the Co. macellaria transformer protein from translated BLAST. Also shown are upregulated nodes in C. rufifacies that have similarity and the Co. macellaria transformer gene model from accession JX315619. Within the Co. macellaria transformer gene model, each exon is labeled by the exon number with its length in nucleotides in parentheses. Each edge is labeled by the length of the intron between the exons. Within the C. rufifacies splicing graph, each node is labeled by the node number with its length in nucleotides in parentheses, and expression (y-axis:log counts-per-million) is plotted on a sex:stage basis (x-axis) for those nodes with statistically significant patterns of expression. The line leading out from each node indicates the exonic region from the BLAST hit, with the range of the local hit represented by a horizontal line near the exon. Each edge is labeled by the range of path lengths between the nodes.
Sexual Dimorphism in Gene Expression
Sexual dimorphism in expression within a stage (i.e., Female eggs versus male eggs, female late pupariation versus male pupariation) was observed in 15,268 nodes (18.8% of all nodes passing quality and coverage cutoffs). Sexual dimorphism was observed in all stages measured, including eggs (Supplementary Material 6). Most of these nodes did not share any homology with D. melanogaster at our cutoff (14,025/15,268 nodes without homology; 91.8%). The 1,243 nodes represented 876 D. melanogaster genes, suggesting that some of these nodes are exons or different transcripts of the same gene. A total of 2,173 nodes were differentially expressed in two or more stages.
Differences Between Male-Specific and Female-Specific Changes in Gene Expression Throughout Development
In total, 76,5757 and 74,443 nodes were differentially expressed through female-specific and male-specific development respectively (4821 and 4838 unique D. mel homologies), with most of these nodes overlapping (73,900; Figure 8). These overlapping nodes demonstrated enrichment patterns common with other fly species, including terms such as regulation of developmental processes, regulation of nervous system development, muscle structure development, and photoreceptor cell differentiation (Supplementary Materials 7–9).
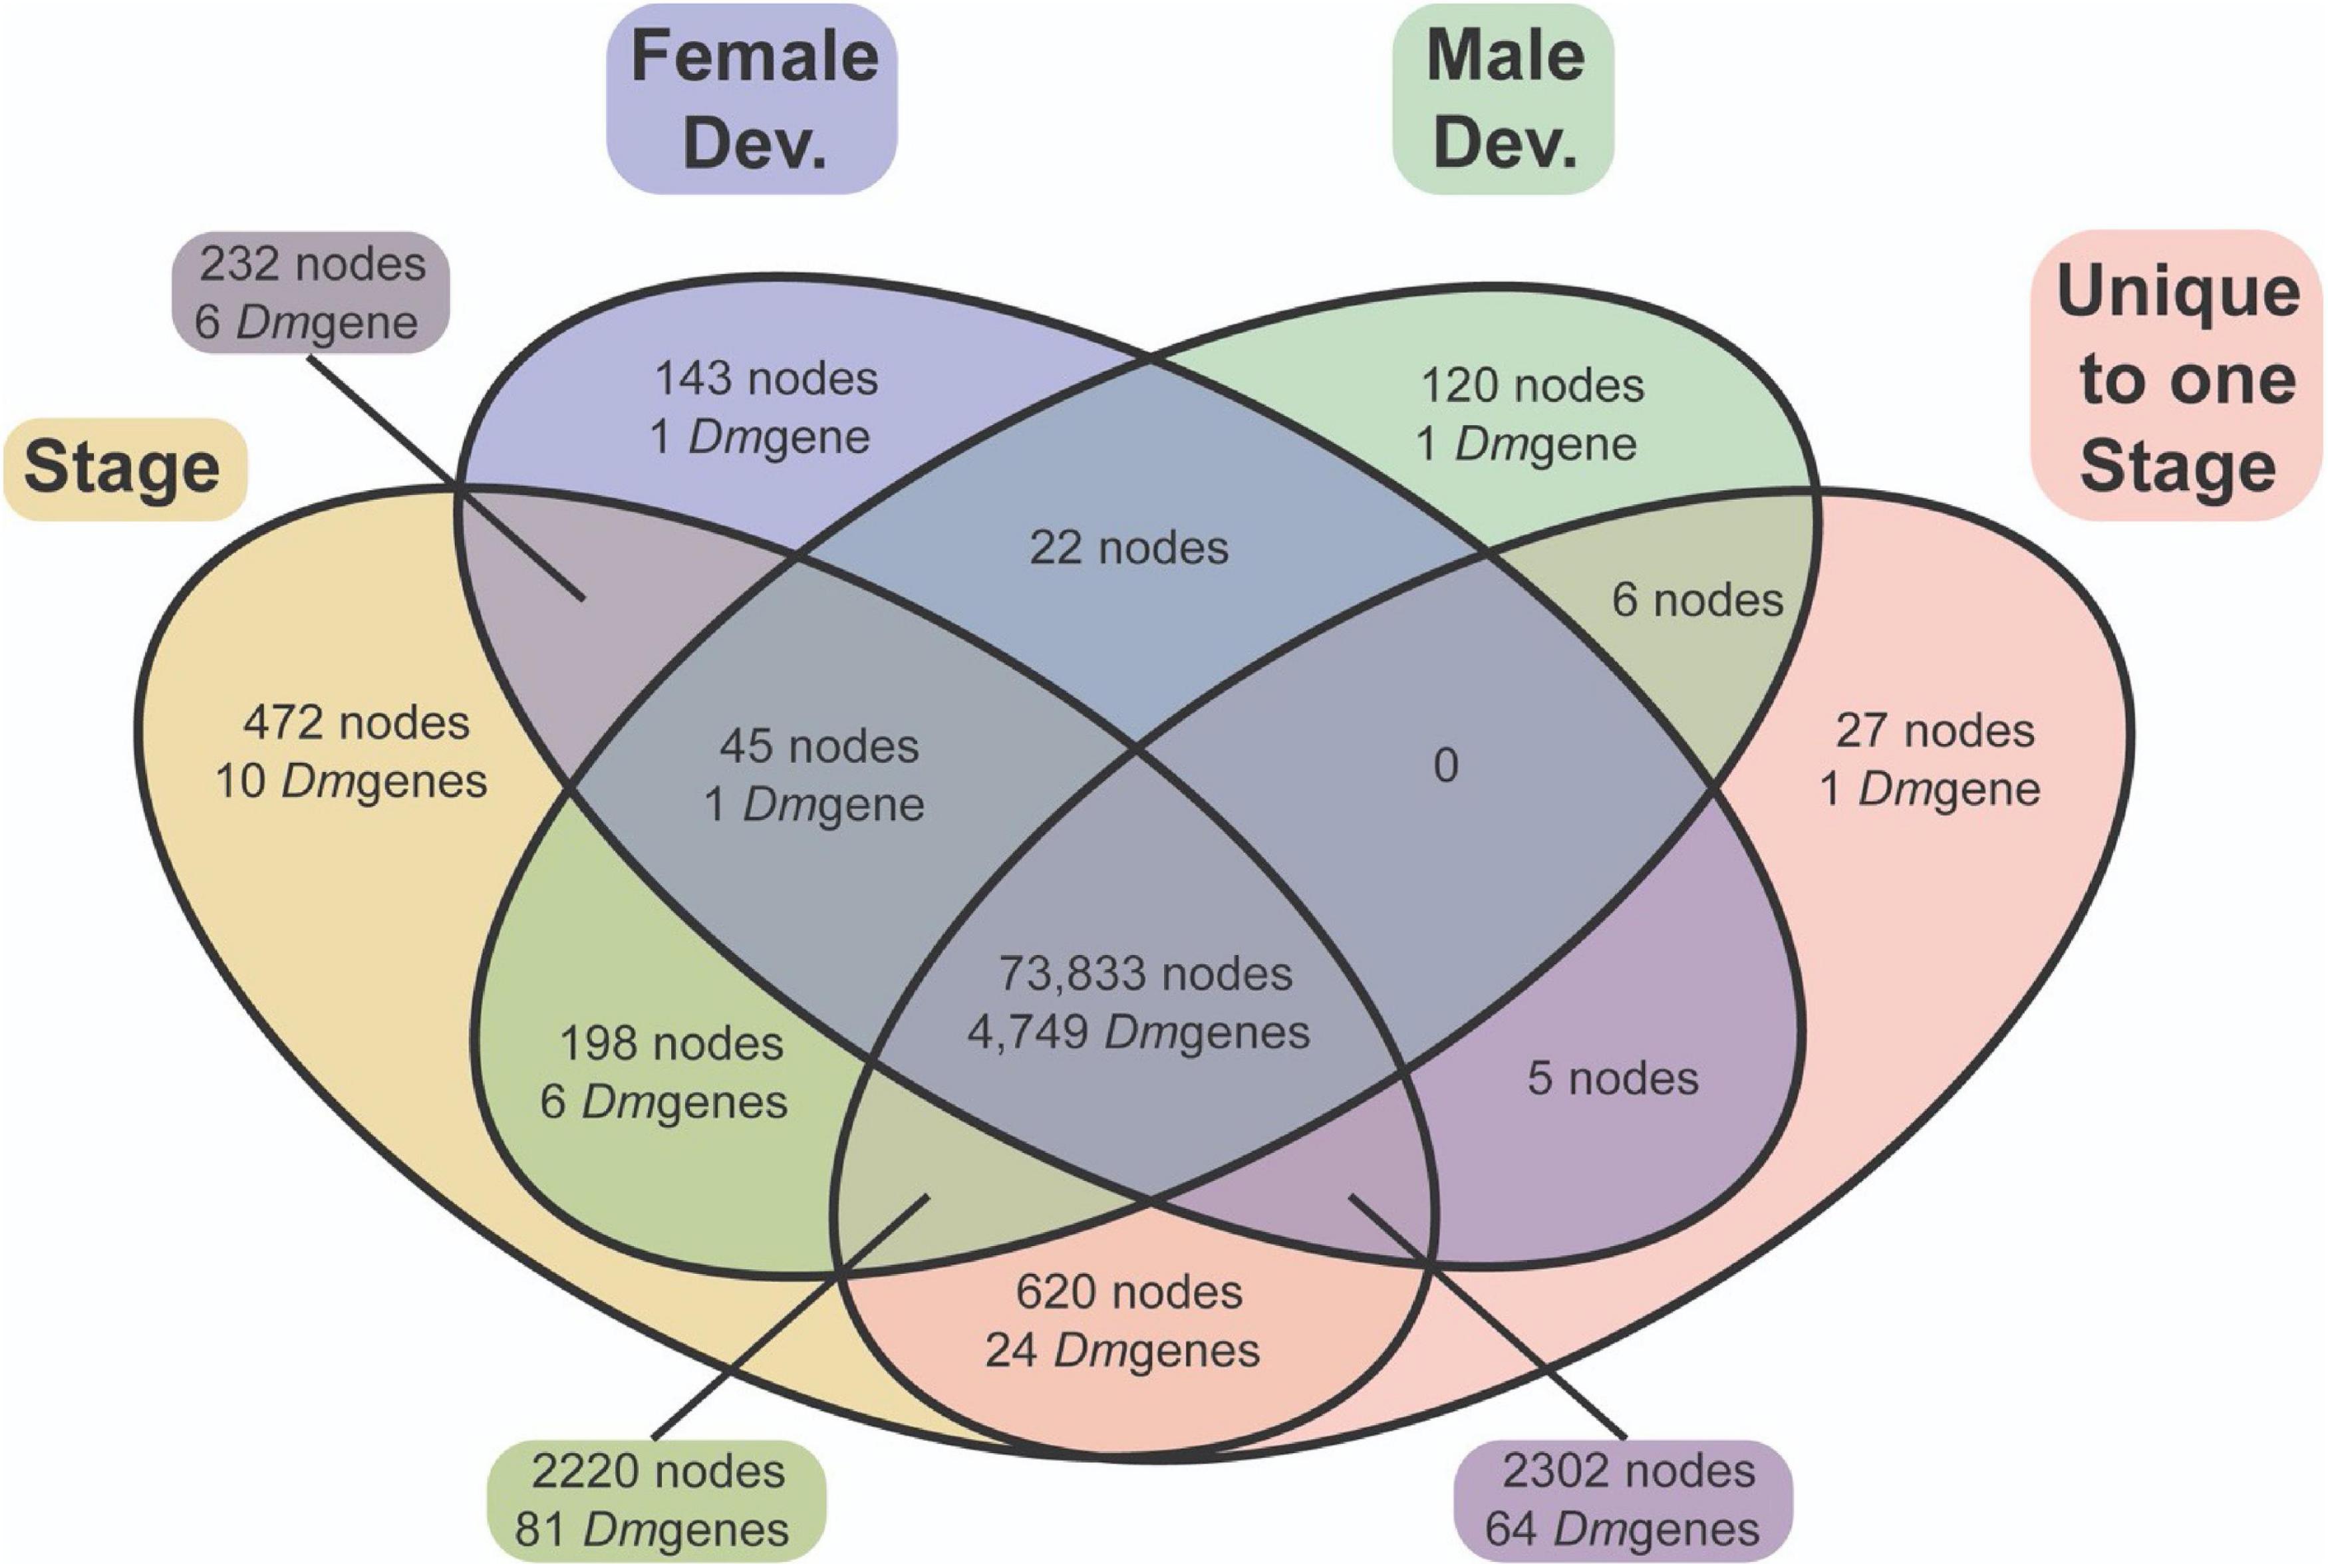
Figure 8. A Venn diagram of differential expression of nodes and genes annotated with similarity to Drosophila genes. Most DEN (73,900) exhibit differential expression throughout development within both males (green) and females (blue). A similar number of nodes are expressed in a sex-specific manner throughout development in both males and females.
Of greater interest, there were some specific nodes differentially expressed throughout female development only (2,682 nodes), as well as throughout male development only (2,544 nodes). However, as most nodes are not annotated, and multiple nodes can have homology with the same D. melanogaster gene, the number of “genes” differentially expressed between male-specific and female-specific development is significantly smaller (88 genes and 71 genes respectively). Throughout development, male-specific unique expression demonstrates GO enrichment of appendage morphogenesis including wing development, imaginal disk development, protein modification via conjugation and/or ubiquination, and positive regulations of cell adhesion. Female-specific unique expression, on the other hand, demonstrates GO term enrichment of chorion-containing eggshell formation, pole cell migration, and a multitude of terms related to growth and cellular division, including metaphase/anaphase transition, sister chromatid separation, and nuclear division (Supplementary Material 9).
Most Stages Demonstrated a Male Bias in Expression of Differentially Expressed Genes
The number of differentially expressed genes, the strength (log fold change and FDR corrected p-values), and direction of bias generally increased throughout development (Figure 9). In all stages but the egg and third instar stages, more nodes demonstrated a male bias of expression and these nodes were more extremely (smaller FDR corrected p-values) and strongly (larger log fold change) differentially expressed (Figure 9). Given these stage-distinct features, embryonic, larval, and puparial dimorphism are addressed separately and in more detail below.
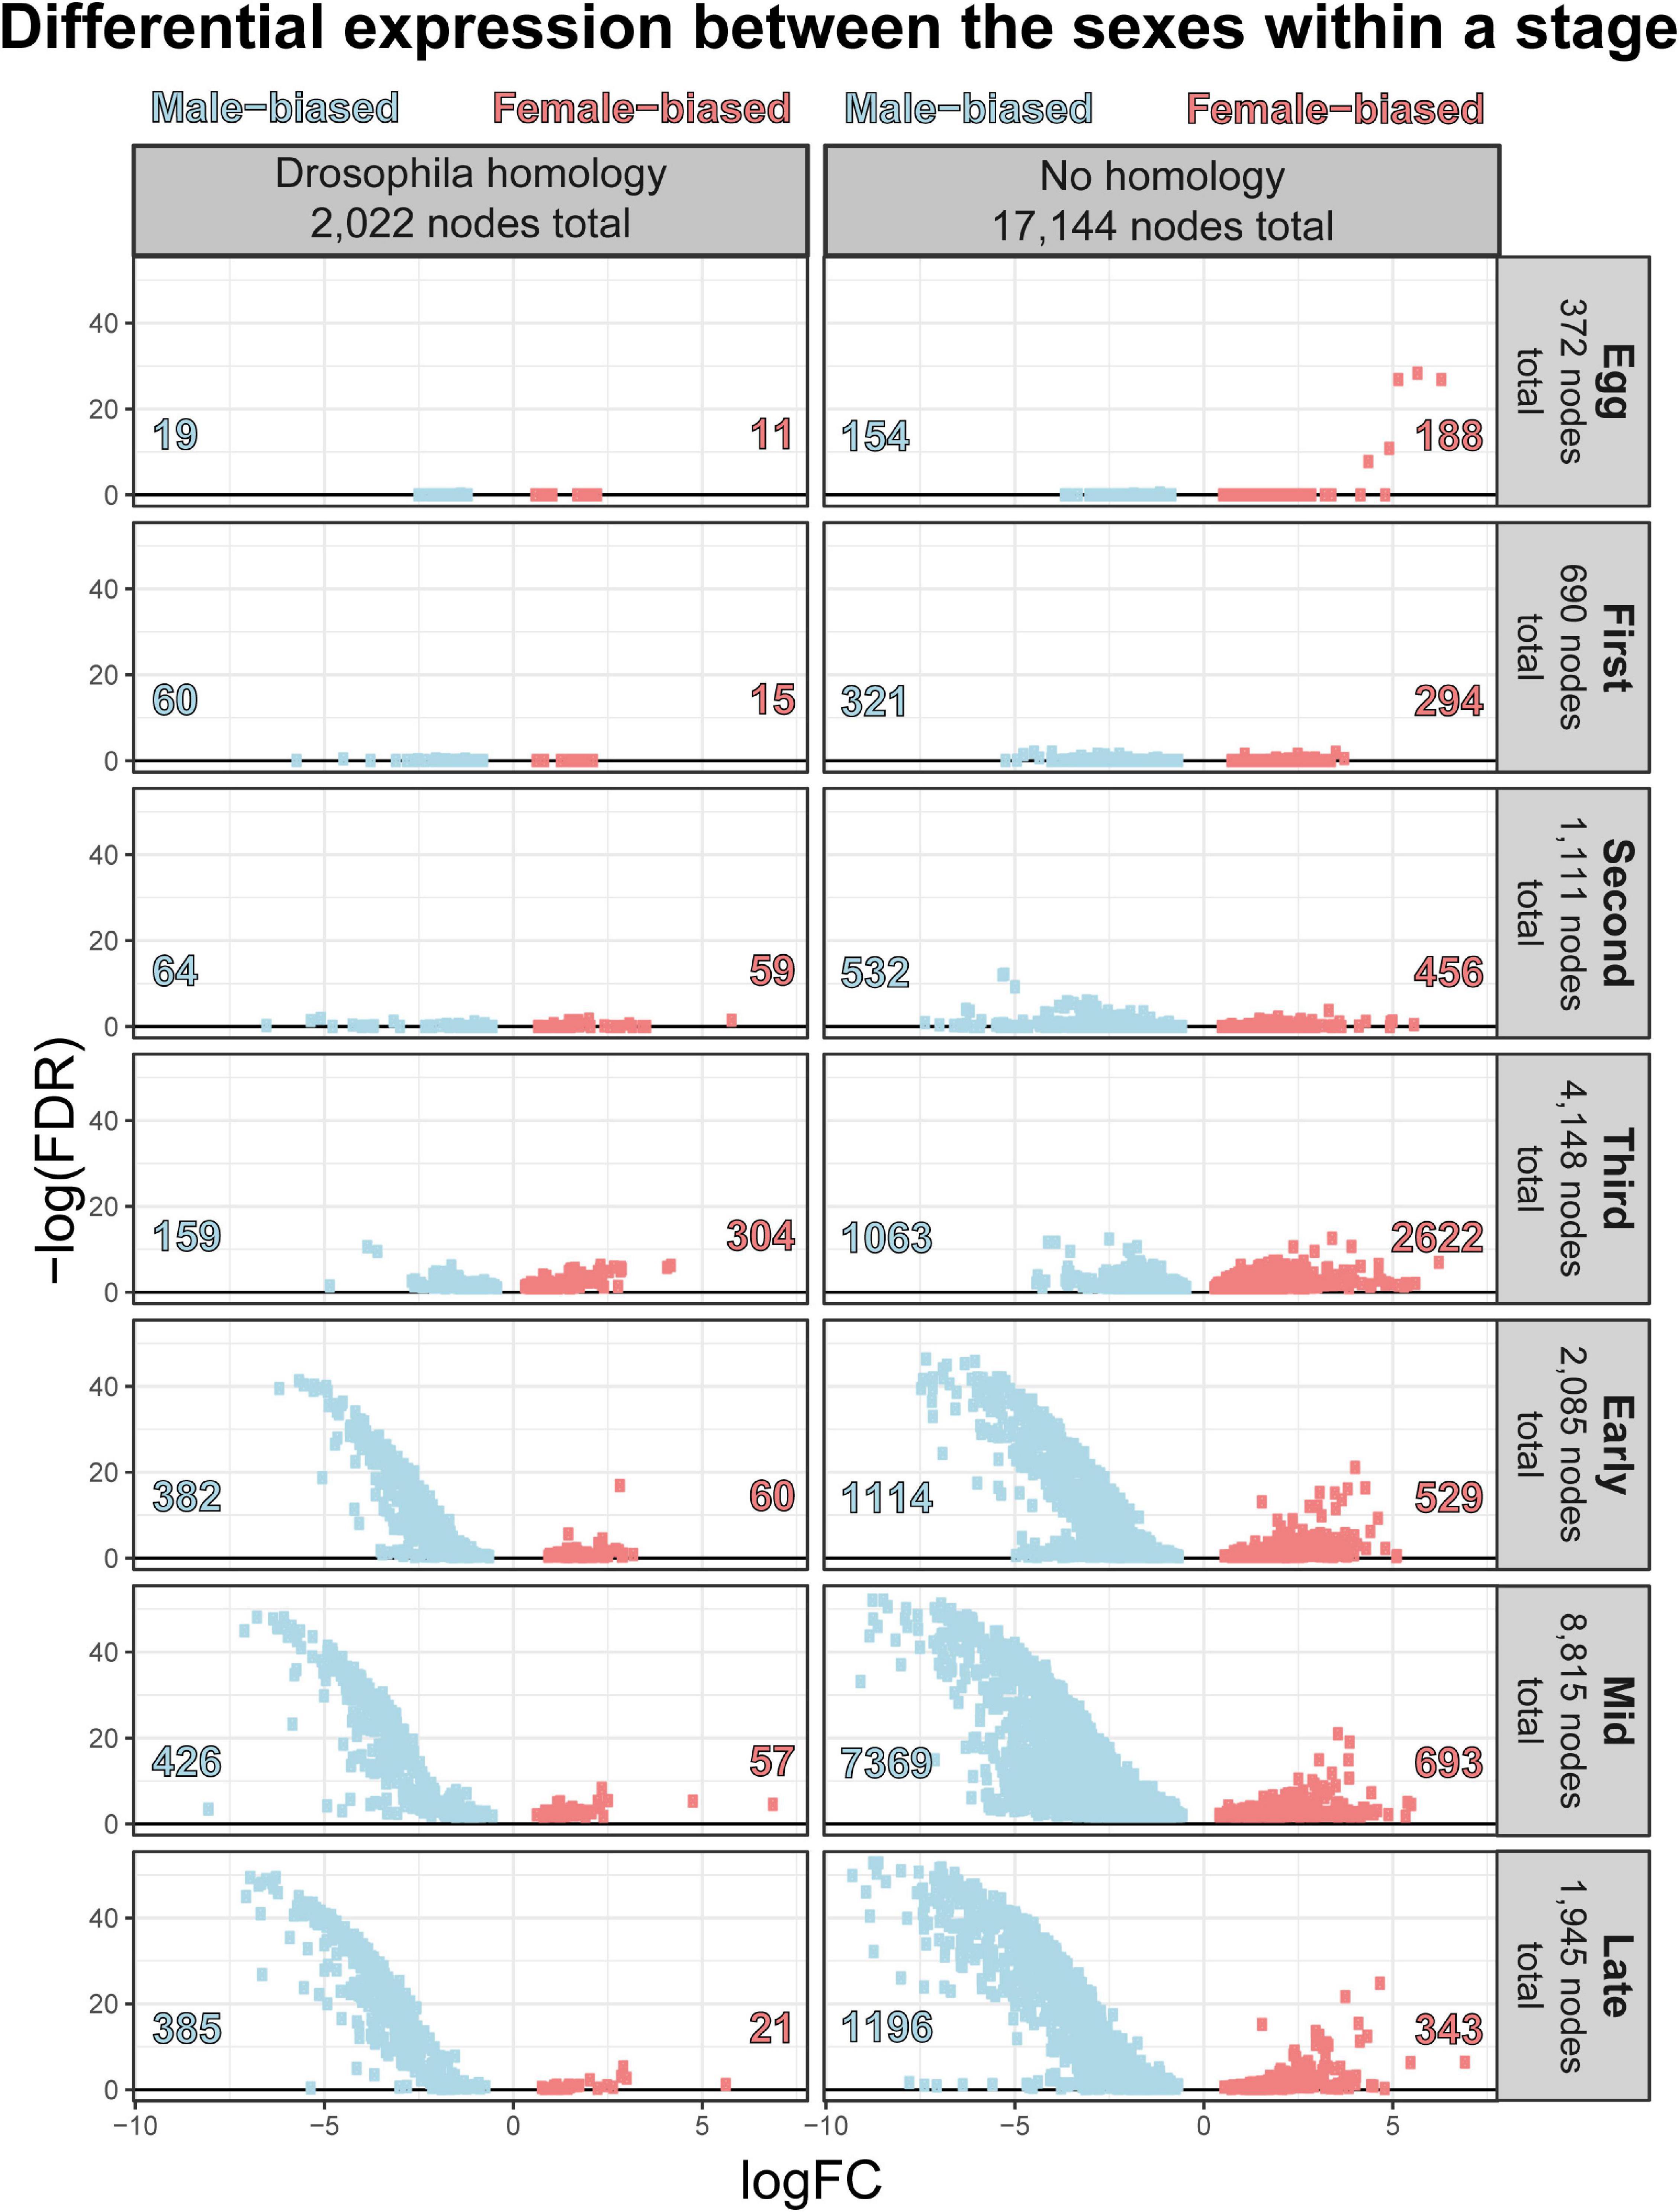
Figure 9. Volcano plot of sexual dimorphism throughout immature development highlights the increasing number of nodes and strength of masculinization of Chrysomya rufifacies’ transcriptome as development progresses.
Differential expression is female biased in the egg stage
In the egg stage, more nodes are female biased in expression, and the outlier nodes do not exhibit homology to Drosophila melanogaster genes at the imposed similarity cutoff. Of the annotated genes, female eggs show an upregulation of genes related to DNA replication and endoreduplication, DNA repair, and microtubule formation related to chromosome segregation. In comparison, males demonstrate an upregulation of genes related to positive regulation of gene expression, chromatin silencing, organ development, cell localization, dorsal-ventral pattern formation, and cell division.
There were six nodes that were highly upregulated (large effect sizes and low p-values) in embryos destined to develop into females (Figures 7, 9). Comparison to Diptera nucleotide sequences with a blastn search identified NODE_26355 as having sequence similarity to the end of (starting at exon three) Cochliomyia macellaria transformer (JX315619.1, 5e-30). The rest of the nodes were AT-rich sequences and demonstrated sequence similarity to each other. In addition, they demonstrate 38–43% sequence similarity to another node in a different splicing graph (NODE_13077:3370588) that joins upstream of a sequence that splices to a sequence that corresponds to exon two of tra in Co. macellaria. There is dimorphism of expression of this putative tra sequence (NODE_13077:3370588) with increased expression in female fated eggs relative to male fated eggs, though this homology is based on similarity of other nodes in the splicing graph to tra sequences isolated from other species of Calliphoridae. Thus, it appears that a female-biased AT-rich sequence upstream of exons 2 and 3 of tra may be connected to upregulation of that end of the gene in female C. rufifacies embryos.
Most larval stages exhibit male biased sexual dimorphism, and the number of genes increases throughout larval development
The larval stages did demonstrate sexual dimorphism in gene expression, and though it was more nodes than eggs, the FDR corrected p-values and fold changes in expression were not as extreme on average. Despite these differences, there was no significant differential expression of any of the core sex-determination genes which are important in other species of fly in either the first or second instar. Sexual dimorphism, defined as total number of nodes differentially expressed, is lowest in the first instar larvae (Figure 9), then increases throughout development. In the first instar, females are upregulating genes related to pH regulation, metabolic processes, and head development, while males are upregulating genes related to transmembrane transport, catabolism, response to food, and mitochondria (Supplementary Materials 7, 9). In the second instar, females continue to demonstrate enrichment in head development, as well as neuron differentiation and growth and neuromuscular junction development. In comparison, male enrichment switches to GO groups related to transcription regulation, DNA synthesis, protein secretion, regulation of the JAK-STAT cascade, and dorso-ventral patterning.
Sexual dimorphism in the larval stages is most pronounced in third instar larvae. Females continue to show increased expression of genes related to a neuron maturation and differentiation, as well as broad array of GO terms, including thermosensory behavior, gene expression, splicing, and silencing, chromatin remodeling, short-term memory, transmembrane transport, locomotion, and imaginal disk growth. Male third instar larvae also demonstrate a range of GO term enrichment, including shifts to metabolic processes, determination of right/left symmetry and asymmetry, imaginal disk fusion, apoptic cell clearance, cognition and memory, genital disk morphogenesis, sex differentiation, regulation of hormone metabolic processes, and the JNK cascade. Third instar is also where differential expression of the putative tra node NODE_13077:3370588 is most differentially expressed. Furthermore, nodes with homology to dsx begin to be differentially expressed in third instar, and female samples demonstrate significantly higher expression of the common dsx exon (NODE_4893622:2200887,2200888). Furthermore, the node with homology to the male exon of dsx (NODE_2200888) is also expressed only in males.
Sexual dimorphism throughout pupariation involves many genes, and changes throughout the process
As would be expected, sexual differentiation is highest across immature development during pupariation, and increases the closer an individual is to eclosion (Figure 9). All stages demonstrate differential expression of the putative tra node and both dsx nodes between the sexes. Furthermore, males demonstrate enrichment of male reproduction terms, such as spermatogenesis, as well as ATP production, throughout all of pupariation.
Early in pupariation, females demonstrate enrichment in a broad array of GO terms, chemosensation, signal transduction, ion transport, ovary development, and pupariation. In contrast, while also demonstrating enrichment in a broad array of term, males mostly demonstrate parent-child enrichment of terms such as pupal development, transmembrane proton transport, ATP generation, spermatogenesis, neurogenesis, proprioception, sensory perception, JH esterase activity, and, interestingly, Y-chromosomes. However, the “Y chromosome” GO term (GO:0000806) is linked to only a single node (NODE_3701213) with homology to Thioredoxin T (TrxT, CG3315); in D. melanogaster the product of this gene regulates expression of genes on the Y-chromosome (Bonaccorsi et al., 1988). Several genes initially identified as demonstrating differential expression between the stages were also identified as having sexually dimorphic patterns of expression in early pupariation, including CrLsp1α, CrSdhD, and CrJhebp29.
Mid pupariation, females show increased expression of genes related to sensory perception, BMP signaling, cellular differentiation, establishment of chromatin silencing, R7 cell development, and transmembrane transport systems, particularly those related to synaptic development. Males, on the other hand, continue to demonstrate enrichment of spermatogenesis and ATP generation, and also begin to enrich endosome organization, programmed larval cell death, salivary gland histolysis. This is also the only point in pupariation where differential expression of sc, a sex determination candidate with prior support (Andere et al., 2020) for driving the system, is statistically significant.
Late in pupariation, more than 2/3 of the differentially expressed genes are male biased in expression. Female upregulated genes are involved in regulation of synaptic activity, response to the BMP pathway, eye and wing development, renal filtration, RNA transport, pigment metabolic processes, and epidermis development. Males demonstrate enrichment of genes related to sensory perception, ATP generation, proton transport, male gamete generation, regulation of cellular pH, histolysis and cell death, axon generation and regeneration, spermatid differences and gas transport.
Clustering Identified Groups of Nodes With Similar Patterns of Expression
Using all differentially expressed nodes, we identified 38 clusters with an average Pearson Correlation Coefficient ≥ 0.85 and at least 100 nodes (Figure 6). In the interest of brevity, we will discuss only a few clusters, though each cluster may contain genes of interest to researchers investigating other questions (Supplementary Materials 5, 10). For example, the nodes in cluster 4 have high expression in eggs, and sexually dimorphic patterns of gene expression in most juvenile stages (Figure 6). This cluster demonstrates significant enrichment of genes with GO terms related to neurogenesis, cell differentiation, sex determination, regulation of the Wnt signaling pathway, and DNA damage repair. Another cluster of interest is 22, which has high node expression in larval stages that drops off at the onset of pupariation, making genes in this cluster potentially useful for identifying postfeeding larvae. This cluster demonstrates significant enrichment of genes with GO terms related to proteolysis, transmembrane transport, and response to external stimulus and stress (including NODE_1153482 which demonstrates highest homology with a D. melanogaster Cytochrome p450; Cyp28d2). Finally, expression in cluster 36 could be useful for sex-specific age differentiation over pupariation, and demonstrates enrichment for neurological processes such as synaptic vesicle localization, long-term memory, mating, courtship behavior, and sensory perception.
qPCR Validation
All genes analyzed by qPCR in this study were significantly differentially expressed by developmental stage according to ANOVA (p < 0.0001). It is important to note that these potential markers were assessed in a different population, collected less than 10 generations from the wild, and under different environmental conditions than those used to identify them. The point in development where developmental stages were sampled also differed subtly. These differences are important, because they most closely reflect a realistic forensic condition, where a reference will not exactly match the rearing conditions and source population of evidentiary specimens. When comparing the directional patterns of change for each of these genes between the RNAseq expression information and the expression from the qPCR validation, the general patterns held with some variation in timing or fold change across experiments and generally occur as observed in D. melanogaster (Graveley et al., 2011). Gene expression was highest in third instars and early puparial samples, then decreases throughout time in puparial stages for Larval serum protein 1α (Lsp1α) and across all stages in Cyp28d2 (Figures 10A,B). In Lsp1α, there are no significant differences in expression between larval stages and the early puparial stage; however, there is a significant decrease in expression in mid and late puparial stages (Figure 10A). In Cyp28d2, gene expression decreases throughout time, with lower expression in each subsequent developmental stage (Figure 10I). There were significant increases in expression throughout time in both SDCB and Jhebp29 (Figures 10C,D,G,H), with highest levels at the end of pupariation. In SDCB, there were no significant differences in expression between larval stages and early-mid puparial stages; however, there was a significant increase in expression of this gene in the late puparial stage (Figure 10C). In Jhebp29, there was an increase in gene expression between feeding 3rd instar and postfeeding stages, however, not significantly so. In puparial development, Jhebp29 expression significantly increased in the late puparial stage compared to early-mid puparial development (Figure 10G,H). Tango5 expression was found to be significantly lower in postfeeding larval stages compared to the feeding 3rd instar larval stage (Figure 10F). Puparial expression did not significantly differ across time, and is not significantly different from the feeding 3rd instar expression (Figures 10E,F). When separated by sex, only Tango5 in the early puparial stage and SDCB expression in the late puparial stage were significantly different between the sexes (Figure 10). In the early puparial stage, Tango5 expression was significantly higher in males than in females, something that was seen expression data from RNAseq (Figures 10E,F). In the late puparial stage, SDCB expression was significantly higher in females than in males, yet this difference was not seen in the RNAseq data (Figures 10C,D).
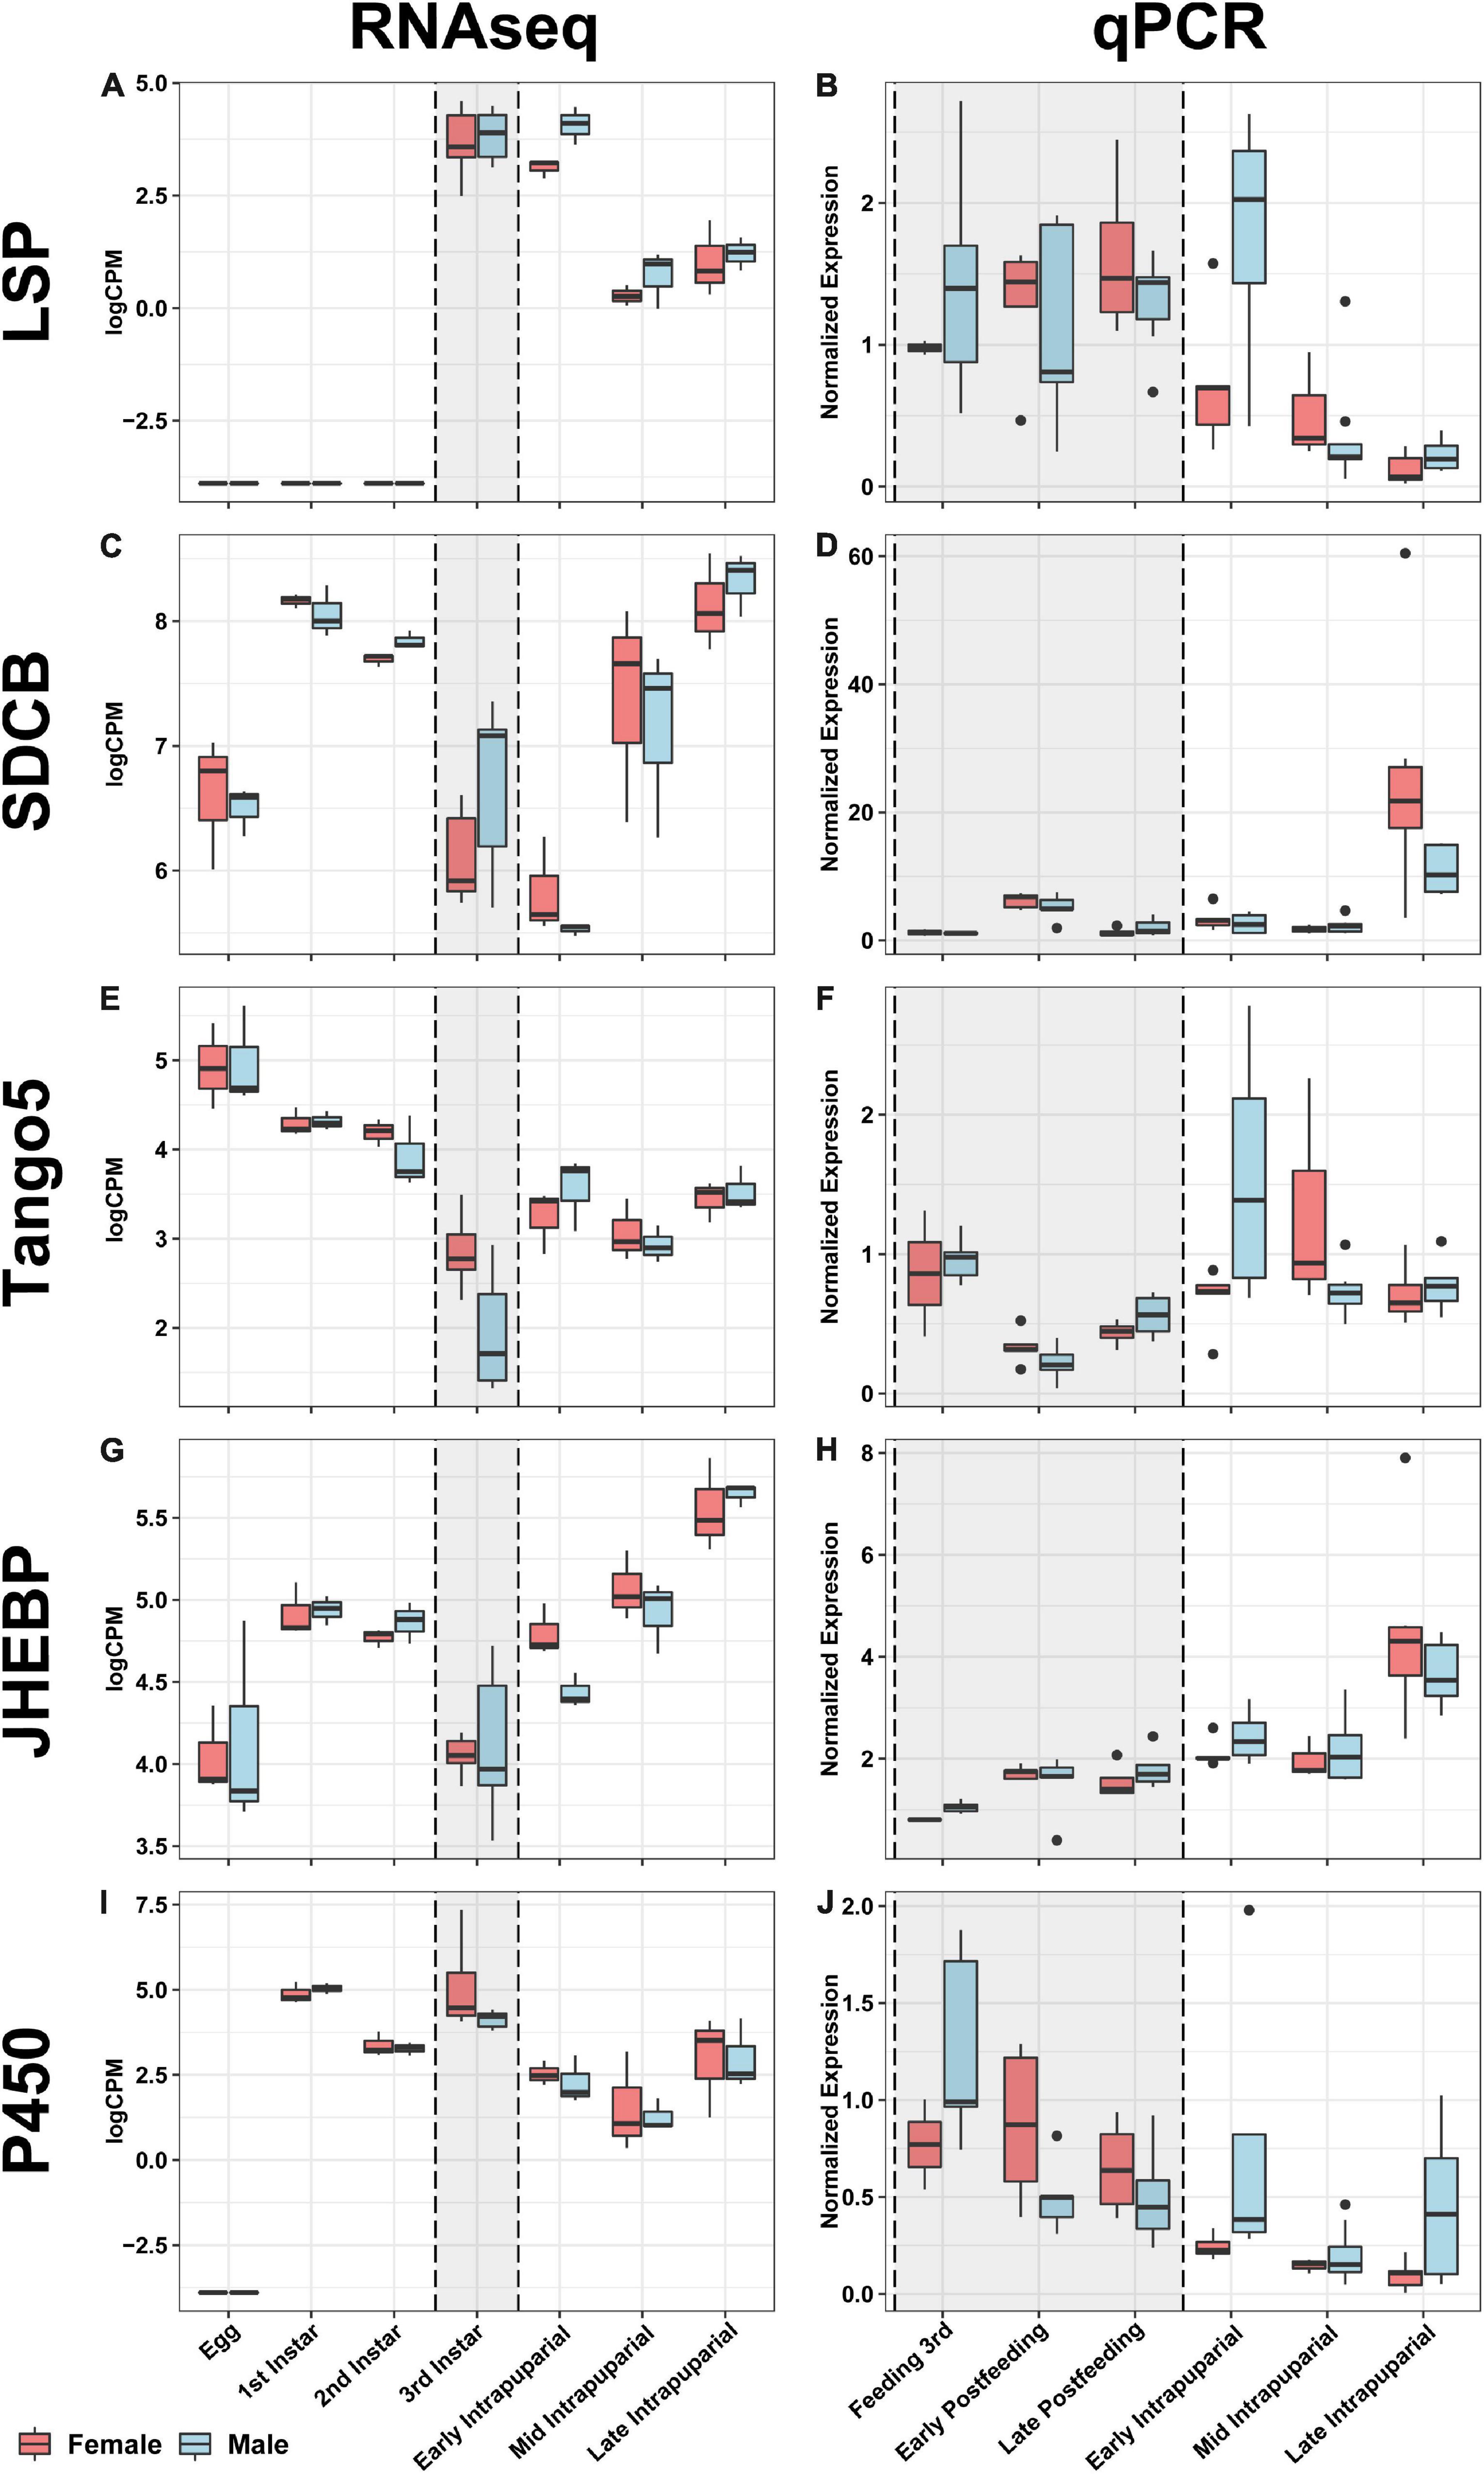
Figure 10. Comparative boxplots of genes selected for validation. RNAseq expression in the left column and qPCR normalized expression in the right column for each node for which primers were designed in the rows (see Table 4). Each boxplot for the RNAseq column represents three separate individuals, with the exception of the third instar samples (gray background shaded box), which represents six individuals collected to evaluate gene expression correlated with facultative predatory behavior, and therefore are likely to be feeding third instars. Eleven samples were evaluated for each time point with qPCR validation, and sampling also broke up the third instar into three separate time points, all indicated in the gray shaded box; see Table 3 and materials and methods section “Validation Fly Rearing” for more details. From left to right, top to bottom: (A) RNAseq expression of Larval serum protein 1a (Lsp1a), (B) qPCR expression of Lsp1a, (C) RNAseq expression of Succinate dehydrogenase cytochrome B (SDCB), (D) qPCR expression of SDCB, (E) RNAseq expression of Transport and Golgi organization 5 (Tango5), (F) qPCR expression of Tango5, (G) RNAseq expression of Juvenile hormone esterase binding protein (JHEBP), (H) qPCR expression of JHEBP, (I) RNAseq expression of a cytochrome p450 (P450), (J) qPCR expression of P450.
Discussion
The major goal of this project was to identify candidate genes useful for making improved predictions of C. rufifacies age through the use of gene expression markers. Logically, effective markers for this purpose will exhibit several features. They should be differentially expressed over development, especially among stadia whose ages are difficult to precisely predict with morphology (Anderson, 2000; Tarone and Foran, 2008; Tarone et al., 2011). Ideally, target markers will exhibit large effect sizes (e.g., off in early intra-puparial development and on at a high level at the end). However, since development time is a quantitative trait, it is expected that a variety of environmental and genetic factors, as well as their interactions, may impact either developmental progress or genes used to predict it (Tarone et al., 2015). Therefore, expression signals from target genes would ideally be robust to changes in environmental conditions (Kaneshrajah and Turner, 2004; Tarone and Foran, 2006; Fremdt et al., 2014) or genotypes (Tarone et al., 2011). One simple genetic difference found in many sexually reproducing organisms is the genetic effect of sex determination, which can impact a variety of sexually dimorphic traits. Therefore, we considered sex as a potentially major source of variation. It is also unlikely that the expression of any developmentally regulated gene is stable across all environments and genotypes (even housekeeping genes are expected to vary), so such an age prediction system will also likely be comprised of multiple genes that are less variable than other markers of age (within a point in development), respond to different environmental/genetic factors, and exhibit strong signals of change (i.e., high effect sizes) over development. The composition of such a collection of genes is likely to depend on the number of genes affected by environments, genotypes, and their interactions that exhibit characteristics desirable for predicting age. In some scenarios, it may be necessary to identify genes predictive of environments or genotypes, which can be used to correct for signals from other markers of age that exhibit large effect sizes. As an example (Frątczak-Łagiewska and Matuszewski, 2018), determined that sex alone is not useful information for improving predictions of age in a forensically informative beetle. However, improvement did occur when knowledge of sex was combined with size at maturity (Matuszewski and Fratczak-Łagiewska, 2018). Similarly, one may imagine a gene is useful in predicting age, but only when the sex of the immature fly is known, due to differences in the way the sexes developmentally regulate a gene. The inclusion of such a gene in a prediction set may be more or less desirable depending on how many genes are responsive to various inputs. Since little is known about the C. rufifacies transcriptomic response, we provide important baseline data that can be used to inform future decision regarding sets of age-predicting genes. Here, we evaluated gene expression across C. rufifacies development at 30°C and in both sexes. We identified genes that were differentially expressed over development, between sexes, and those differentially expressed across development by the sexes; identifying the relative proportions of the transcriptome that are differentially expressed by development, sex, or both. We then tested a subset of potential markers of age in a new population of flies raised at a 25°C, demonstrating that most genes (sexually dimorphic or not) performed as expected.
We present here evidence of sexual dimorphism throughout immature development against a wild-type genetic background through an assessment of two phenotypes, development rate and gene expression, in an under-studied and forensically relevant fly, Chrysomya rufifacies. Despite the relative lack of genetic tools in this species, broad patterns of GO enrichment were identified by leveraging sequence similarity to D. melanogaster. Furthermore, five genes were selected for qPCR validation based on the RNAseq results and concordance with patterns of expression in other species of fly. All genes analyzed by qPCR in this study were significantly differentially expressed by developmental stage, and two also demonstrated significant sexual dimorphism in expression. Ideal markers of age were strongly differentially expressed during development during longer developmental stages, robust to changes in the ambient temperature during rearing, and not sexually dimorphic. However, with knowledge of sex, dimorphism could be used to optimize estimate accuracy (as in Matuszewski and Fratczak-Łagiewska, 2018).
There are a few potential biases associated with the approach taken. The transcriptome was assembled with a program designed to preserve splicing information (Sze et al., 2017), as differential splicing of key sex-determination genes is responsible for many aspects of downstream sexual dimorphism. The error structure of sequences associated with this method have already been investigated, and this algorithm has been shown to be conservative and reliable (Sze et al., 2012, 2017; Pimsler et al., 2019); identifying dsx in C. rufifacies, which was confirmed by Sanger sequencing (Jonika et al., 2020), and recovering known sequences in several other model and non-model organisms. The assembly is fragmented, which may affect its usefulness for some purposes, but for the purpose of this project it was clearly sufficient for our needs. Some of the analysis relies on similarity of transcriptome sequences to the well-known and studied organism Drosophila melanogaster, another higher fly, and gene ontology analyses were based on these annotations. A conservative cutoff was considered for declaring similarity to Drosophila, thus only 8,903 retained nodes were associated with Drosophila sequences, representing 4,965 genes. Unique genes or unique uses of gene products will be overlooked with such an approach, which can particularly be an issue in rapidly evolving genes, such as sex-related genes (Ellegren and Parsch, 2007; Haerty et al., 2007). However, dsx appears to demonstrate an expected pattern of dimorphism, as do a variety of other sequences predicted to be associated with sex determination and development. International collaborative investment in gene ontology resources (Ashburner et al., 2001) and the use of BUSCO scoring to estimate genome completeness (Waterhouse et al., 2019) suggest, however, that leveraging information from non-study species can at least serve as a useful starting point. However, care should be taken to remember potential biases and divergence from Drosophila, if one is interested in gene functions from the transcriptome and not the more applied interest of age prediction.
Despite these challenges, the anonymous nature of the analyses (i.e., independent of knowledge of putative node product) was expected to produce reasonable results (Sze et al., 2017). Indeed, examination of specific genes, as well as overall GO enrichment across development, demonstrated concordance with patterns observed in other species, particularly in well-studied D. melanogaster, across a range of transcriptomic approaches (Arbeitman, 2002; Lebo et al., 2009; Chang et al., 2011). As an example, egg gene expression is particularly enriched for genes related to patterning, growth, and cell differentiation, while larval gene expression is enriched for genes related to digestion and locomotion. Thus, in many ways C. rufifacies development appears to follow a similar general trajectory to D. melanogaster in many ways, despite their evolutionary and ecological distance from one another.
Individual genes also demonstrated conservation in pattern. For example, the gene slam, which is important for cleavage and polarized membrane growth and demonstrates highest expression in D. melanogaster eggs (Lecuit et al., 2002), was found to be uniquely expressed in the egg stage in C. rufifacies. Another gene that demonstrated conservation in pattern in D. melanogaster, Bombyx mori, and Manduca sexta was a juvenile hormone esterase binding product (Jhebp29) (Campbell et al., 1992; Liu et al., 2007; Hao et al., 2013). In Drosophila, the expression pattern of this gene largely matches the pattern seen in C. rufifacies, where lowest expression occurs in third instars and increases afterward throughout pupariation (Graveley et al., 2011).
The utility of sexual dimorphism in development rates in forensic entomology is not yet clear. In this work, we have shown that male C. rufifacies eclose as adults 9 h earlier at 30°C, on average, than females whose eggs were laid at the same time, and pupariate 4 h earlier. Previous work in forensically relevant species has demonstrated statistically significant sexually dimorphic development rates, though in some cases this dimorphism can too small to have a practical use in case work (Picard et al., 2013; Frątczak-Łagiewska and Matuszewski, 2018; Smith and Cook, 2020). However, given the LDT’s calculated in this work, we observed that males pupariate 90-108 ADH and eclose 200–240 ADH earlier than females of the same temporal age. Chrysomya rufifacies can develop at relatively low temperatures (15.6°C; Byrd and Butler, 1997) and have been collected routinely as a part of indoor casework in Texas (average ambient ± std. dev.: 27.7°C ± 7.8 from Sanford, 2017). As ∼16% of cases involving C. rufifacies would have involved ambient temperatures of ∼20°C, this would represent a different of 16 h between male and female eclosion. Given that blow flies rarely lay eggs at night (Greenberg, 1990; Singh and Bharti, 2001; Amendt et al., 2008; Zurawski et al., 2009; Berg and Benbow, 2013), and it is common practice to use what are considered the oldest samples to estimate a minimum postmortem interval (in this case “fastest to eclose”), a 16 h difference could result in estimates that are off by a day or more (if the complete developmental timeline is relevant to a case). Clearly, more research is needed to validate the results presented here, and to identify what factors, if any, affect nocturnal oviposition in C. rufifacies. Results presented here indicate that there is moderate sexual dimorphism in immature development rate that is unlikely to be important in some temperatures but may have investigative importance in others – depending on what specimens/stages/sexes were sampled.
Generally, our results demonstrated that 98.4% of all nodes passing our filtering threshold were differentially expressed. Of these, most differentiated our samples by developmental time-point (99.8%), fewer nodes were sex-differentially expressed throughout development (19.1%), and very few nodes which demonstrated differential expression by sex alone (1.5%). The relatively large effect of development in differential expression is clearly demonstrated in the MDS plot (Figure 3), which shows the general pattern of clustering for sample types (sex:stage) across all nodes. For the purposes of estimating insect age, nodes which demonstrated significant stage-specific gene expression but which are not affected by other factors, such as sex, are the most useful (i.e., Jhebp29). Our results also point to sex-determination cascade genes with male and female shared exons (such as tra and dsx) which have stage-gated expression patterns as being potentially useful for age-related estimates. Additional research is required to determine how robust these patterns are with respect to other factors, such as temperature or geographic population of origin.
In concert with development-rate sexual dimorphism, sexual dimorphism in gene expression is also observed in every stage throughout immature development. Interestingly, the magnitude (p-value and log2FC) of sexual dimorphism is higher in eggs than first and second instar larvae, and is female skewed in eggs. This is likely a lingering effect of maternal contributions to their offspring (Avilés-Pagán and Orr-Weaver, 2018), although it is anticipated that embryonic samples were collected after the transition to zygotic gene expression (Kronja et al., 2014; Navarro-Costa and Martinho, 2020). However, there is a definite masculinization of the sexually dimorphic component of the transcriptome during the rest of development, characterized by a greater number of nodes demonstrating male-biased expression with more extreme p-values and logFC’s. This is directly in line with patterns observed in zebrafish (Small et al., 2009), but is also supported by findings that sex-linked gene expression dimorphism evolves and diverges more rapidly in male-linked genes (Ranz et al., 2003; Assis et al., 2012; Perry et al., 2014; Grath and Parsch, 2016). Furthermore, patterns of increasing dimorphism in gene expression over developmental time is supported by results in D. melanogaster (Perry et al., 2014). Additional work is needed, however, to disentangle sex-specific differences in gene expression from the effect of different development rates of males and females.
While the primary focus of this work was forensic entomology applications, these results also shed some light on the unusual sex determination mechanism of C. rufifacies. For example, there in an interesting connection of GO enrichment of cell cycle, underreplication, and endoreduplication in female-fated immatures relative to male-fated immatures which imply hypotheses that could explain coverage differences observed between arrhenogenic and thelygenic female genomes (Andere et al., 2020). Furthermore, the greatest increase of sexual dimorphism in gene expression coincides with the initial expression of dsx. Similarly, tra related sequences warrant further investigation, but indicate a potential role for exons 2 and 3 in embryonic cell fates. As the exact genes involved in the monogenic sex determination cascade of C. rufifacies have not been identified, much less their hierarchy, this serves as a promising starting point to begin to investigate critical genetic and ontological control points.
One of the main purposes of the RNA-seq work was to generate putative sequences for estimating ages of immature samples, especially puparial development, as this stage occupies a major proportion of immature development and, without dissection/imaging and detailed knowledge of development, is difficult to break into smaller portions of developmental time. Results which were upheld across RNA-seq and qPCR, especially when similar to patterns in D. melanogaster, support the possibility of stability of markers across genotypes and environments - more so than if they had been tested in the same conditions and population of flies (i.e., the comparison mirrors casework interests where the reference is not necessarily an exact representative of the casework sample population). Some potential markers of age were assessed further with qPCR in a different population of C. rufifacies, less than 10 generations out of the wild reared in different conditions. The validation qPCR tested genes demonstrated similar patterns across developmental time-points and/or sexes as seen in the RNA-seq experiment. It was anticipated that Lsp1α and SdhD would be useful for differentiating feeding 3rd instar from postfeeding 3rd instar stages, as Lsp1α is expressed in all instars and new white prepupae at moderate to high levels in D. melanogaster. However, our qPCR results indicate that Jhebp29, Cyp28d2, and Tango5 would be a more useful panel in these larval development stages. Of the validation qPCR tested genes, Lsp1α, SdhD, and Jhebp29 seem like ideal candidates for further work to develop a gene expression model to quantify puparial development progress. The qPCR found higher Lsp1α expression in the early puparial stage than later stages, with highly sexually dimorphic expression early in pupariation. While Lsp1α expression drops throughout puparial development, SdhD and Jhebp29 have significantly higher expression in the late puparial stage than earlier stages. Aside from the sexual dimorphism in Lsp1α expression in early puparial development, comparison of the validation qPCR results between sexes did produce any other remarkable differences that could be found in both RNA-seq and qPCR analyses.
We have demonstrated that C. rufifacies is a useful organism for the study of developmental sex-specific gene expression impacts in insects against a wild-type genetic background, and provided some genetic tools with which to do so. These results set the stage for a number of downstream applications. Building upon this work will deepen our understanding of the evolution of sex determination and sexual dimorphism, especially in the case of comparison of model systems and across clades. This work has specific applications in medical entomology as well, especially for the development of new tools for the control on myiasis causing Calliphoridae. The Sterile Insect Technique (SIT), originally developed in the 1950’s to control the calliphorid species Cochliomyia hominivorax a.k.a “the new world screwworm” (Sapti et al., 2005), has proven to be a robust tool in the control of pest insects. However, while newer applications of SIT have integrated genetic tools, the control of Co. hominivorax still relies upon uneconomical bisexual rearing and sorting. We have generated a list of target pathways and the genetic tools to exploit them for both SIT and the release of dominant lethal genes.
One core challenge of forensic entomology has been that individual species have their own temperature-dependent development rates (Amendt et al., 2011). As more work is done in more parts of the world, publishing pressures and theoretical developments have led to a shift in research focus away from laboratory development studies. Work in the last 10 years in this field has also highlighted the effect of carrion species and potential local adaptation on development rates (Tarone et al., 2011; Flores et al., 2014; Owings et al., 2014), though current application in forensic entomology does not always take these factors into account. The results of this work add to a growing body of data on developmental patterns of gene expression in Calliphoridae (Zehner et al., 2009; Tarone et al., 2011; Boehme et al., 2013; Fremdt et al., 2014; Zajac et al., 2015), which could be used to identify a core set of conserved genes with which to make quantitative age estimates across the Family. It is also unclear how much of an effect sex-specific development rates may have in case-work applications, as there have only been few studies so far (including this one) with flies (Smith and Cook, 2020) and beetles (Frątczak-Łagiewska and Matuszewski, 2018) of forensic importance. As noted previously (Tarone et al., 2015), any genes used to predict fly age for forensic purposes would ideally be tested across a range of genetic and environmental conditions to whittle the long list of candidates available from this and other genomic projects down to those that are the most informative across the widest range of conditions.
Conclusion
This study evaluated gene expression over immature C. rufifacies development, leveraging the distinct sex determination system to simultaneously evaluate sexual dimorphism in development and developmental gene expression. It allowed an evaluation of the proportion of the transcriptome impacted by sex and/or development (developmental progress impacts expression the most and sex the least), in a system with no obvious morphological differences between immatures of either sex and with wild-type individuals (not mutants). The results largely align with what is known in Drosophila. However, it has been established that in this species, dimorphism in expression in embryos is female biased, with a major signal from tra, then switches to male biased expression in larvae (except third instars) and puparia that increases as development progresses and with the greatest shift in dimorphism occurring concurrent with when dsx expression initiates. The study sets a baseline for a set of genes that are potential markers of age, independent of and dependent on sex. Several genes were confirmed as markers of developmental progress in a way that can help separate feeding from postfeeding third instars or can break intra-puparial development into smaller portions of developmental time without detailed morphological knowledge of metamorphosis. In addition, several features of the unique sex determination system were identified that can be pursued in more detail in the future, enhancing support for, and ruling out, previous hypotheses about the sex determination system (Andere et al., 2020). Thus, this study of a forensically important insect enhances forensic application while synergistically contributing to basic evolutionary ecology (Tomberlin et al., 2011) and potentially other applications with blow flies (Yan et al., 2020).
Data Availability Statement
Raw data files and additional results files can be accessed on Dryad (https://doi.org/10.5061/dryad.2z34tmpmx).
Author Contributions
MP, JT, and AT conceived of the experimental design for the RNAseq. MP collected RNAseq samples, extracted RNA, collected sexual dimorphism in development rate data, did differential gene expression and GO analyses, and identified nodes for validation. S-HS and SF did the transcriptome assembly and Drosophila melanogaster annotation. AT, CH, AS, and MJ contributed to validation qPCR (samples collection, RNA extraction, qPCR, and data analysis). All authors contributed to writing and editing the manuscript.
Funding
Sequencing was performed by the Genomics and Bioinformatics Services at Texas A&M University and the High−Throughput Sequencing Facility of the University of North Carolina at Chapel Hill, funded through Whole Systems Genomics Initiative Catalyst, Texas AgriLife Genomics Seed grants and Texas A&M AgriLife Research funding. Bioinformatic analyses were performed on the Whole Systems Genomics Initiative Cluster and the Brazos Cluster at Texas A&M University, with A&M grants for sequencing and funding from NIJ: 2012-DN-BX-K024 to AT and S-HS partially contributing to analysis. Collection of qPCR data was supported by a Fulbright Fellowship through the Institute of International Education, New York, United States (Grant Number: 2221/DR/2017-2018) to AS. MP was supported by the TAMU Regents and Diversity Fellowships, as well as the TAMU Whole Systems Genomics Initiative Student Fellowship program and the TAMU Dissertation Fellowship.
Conflict of Interest
JT and AT are part of an NSF funded IUCRC, which includes Government and Corporate members. Most of the work done here preceded the formation of the center and no work after formation of the center was guided by any interactions with the center. No funding from the center contributed to this work.
The remaining authors declare that the research was conducted in the absence of any commercial or financial relationships that could be construed as a potential conflict of interest.
Publisher’s Note
All claims expressed in this article are solely those of the authors and do not necessarily represent those of their affiliated organizations, or those of the publisher, the editors and the reviewers. Any product that may be evaluated in this article, or claim that may be made by its manufacturer, is not guaranteed or endorsed by the publisher.
Acknowledgments
We would like to thank C. D. Jones, S. P. Srivastav, C. J. Picard, C. G. Owings, and J. A. W. Blanks for their assistance and support, as well as the TAMU Department of Entomology, the TAMU FLIES Facility, and the University of Alabama Lozier Lab.
Supplementary Material
The Supplementary Material for this article can be found online at: https://drive.google.com/drive/folders/1gOEI9fU0t1IY5Q_0os5_ighl9MlCqkX8
Footnotes
References
Alexa, A., and Rahnenführer, J. (2015). Gene set enrichment analysis with topGO. Available online at: https://bioconductor.org/packages/release/bioc/vignettes/topGO/inst/doc/topGO.pdf (accessed October 30, 2020).
Altschul, S. F., Gish, W., Miller, W., Myers, E. W., and Lipman, D. J. (1990). Basic local alignment search tool. J. Mol. Biol. 215, 403–410. doi: 10.1016/S0022-2836(05)80360-2
Amendt, J., Krettek, R., and Zehner, R. (2004). Forensic entomology. Naturwissenschaften 91, 51–65. doi: 10.1007/s00114-003-0493-5
Amendt, J., Richards, C. S., Campobasso, C. P., Zehner, R., and Hall, M. J. R. (2011). Forensic entomology: applications and limitations. Forensic Sci. Med. Pathol. 7, 379–392. doi: 10.1007/s12024-010-9209-2
Amendt, J., Zehner, R., and Reckel, F. (2008). The nocturnal oviposition behaviour of blowflies (Diptera: Calliphoridae) in Central Europe and its forensic implications. Forensic Sci. Int. 175, 61–64. doi: 10.1016/j.forsciint.2007.05.010
Andere, A. A., Pimsler, M. L., Tarone, A. M., and Picard, C. J. (2020). The genomes of a monogenic fly: views of primitive sex chromosomes. Sci. Rep. 10, 1–12. doi: 10.1038/s41598-020-72880-0
Anderson, G. S. (2000). Minimum and maximum development rates of some forensically important Calliphoridae (Diptera). J. Forensic Sci. 45:14778J. doi: 10.1520/JFS14778J
Arbeitman, M. N. (2002). Gene expression during the life cycle of Drosophila melanogaster. Science 297, 2270–2275. doi: 10.1126/science.1072152
Ashburner, M., Ball, C. A., Blake, J. A., Butler, H., Cherry, J. M., Eppig, J. T., et al. (2001). Creating the Gene Ontology resource: Design and implementation. Genome Res. 11, 1425–1433. doi: 10.1101/gr.180801
Assis, R., Zhou, Q., and Bachtrog, D. (2012). Sex-biased transcriptome evolution in Drosophila. Genome Biol. Evol. 4, 1189–1200. doi: 10.1093/gbe/evs093
Avilés-Pagán, E. E., and Orr-Weaver, T. L. (2018). Activating embryonic development in Drosophila. Semin. Cell Dev. Biol. 84, 100–110. doi: 10.1016/j.semcdb.2018.02.019
Baker, B. S., and Belote, J. M. (1983). Sex determination and dosage compenstion in Drosophila melanogaster. Annu. Rev. Genet. 17, 345–393. doi: 10.1146/annurev.ge.17.120183.002021
Baker, B. S., Burtis, K., Goralski, T., Mattox, W., and Nagoshi, R. (1989). Molecular genetic aspects of sex determination in Drosophila melanogaster. Genome 31, 638–645. doi: 10.1139/g89-117
Benjamini, Y., and Hochberg, Y. (1995). Controlling the false discovery rate: a practical and powerful approach to multiple testing. J. R. Stat. Soc. Ser. B 57, 289–300. doi: 10.2307/2346101
Berg, M. C., and Benbow, M. E. (2013). Environmental factors associated with Phormia regina (Diptera: Calliphoridae) oviposition. J. Med. Entomol. 50, 451–457. doi: 10.1603/ME12188
Blanckenhorn, W. U., Dixon, A. F. G., Fairbairn, D. J., Foellmer, M. W., Gibert, P., Van Der Linde, K., et al. (2007). Proximate causes of Rensch’s rule: Does sexual size dimorphism in arthropods result from sex differences in development time? Am. Nat. 169, 245–257. doi: 10.1086/510597
Blanckenhorn, W., Benbow, M. E., Tomberlin, J., and Tarone, A. (2015). “Quantitative genetics of life history traits in coprophagous and necrophagous insects,” in Carrion ecology, evolution, and their applications, eds M. E. Benbow, J. K. Tomberlin, and A. M. Tarone (Boca Raton,FL: CRC Press), 333–360.
Boehme, P., Spahn, P., Amendt, J., and Zehner, R. (2013). Differential gene expression during metamorphosis: a promising approach for age estimation of forensically important Calliphora vicina pupae (Diptera: Calliphoridae). Int. J. Legal Med. 127, 243–249. doi: 10.1007/s00414-012-0699-1
Bonaccorsi, S., Pisano, C., Puoti, F., and Gatti, M. (1988). Y chromosome loops in Drosophila melanogaster. Genetics 120, 1015–1034. doi: 10.1093/genetics/120.4.1015
Byrd, J. H., and Butler, J. F. (1996). Effects of temperature on Cochliomyia macellaria (Diptera: Calliphoridae) development. J. Med. Entomol. 33, 901–905. doi: 10.1093/jmedent/33.6.901
Byrd, J. H., and Butler, J. F. (1997). Effects of temperature on Chrysomya rufifacies (Diptera:Calliphoridae) development. J. Med. Entomol. 34, 353–358. doi: 10.1093/jmedent/34.3.353
Campbell, P. M., Healy, M. J., and Oakeshott, J. G. (1992). Characterisation of juvenile hormone esterase in Drosophila melanogaster. Insect Biochem. Mol. Biol. 22, 665–677. doi: 10.1016/0965-1748(92)90045-G
Chang, P. L., Dunham, J. P., Nuzhdin, S. V., and Arbeitman, M. N. (2011). Somatic sex-specific transcriptome differences in Drosophila revealed by whole transcriptome sequencing. BMC Genomics 12:364. doi: 10.1186/1471-2164-12-364
Clausen, S., and Ullerich, F. H. (1990). Sequence homology between a polytene band in the genetic sex chromosomes of Chrysomya rufifacies and the daughterless gene of Drosophila melanogaster. Naturwissenschaften 77, 137–138. doi: 10.1007/bf01134479
Cline, T. W. (1993). The Drosophila sex determination signal: how do flies count to two? Trends Genet. 9, 385–390. doi: 10.1016/0168-9525(93)90138-8
Colgan, T. J., Carolan, J. C., Bridgett, S. J., Sumner, S., Blaxter, M. L., and Brown, M. J. (2011). Polyphenism in social insects: insights from a transcriptome-wide analysis of gene expression in the life stages of the key pollinator, Bombus terrestris. BMC Genomics 12:623. doi: 10.1186/1471-2164-12-623
Connallon, T., and Knowles, L. L. (2005). Intergenomic conflict revealed by patterns of sex-biased gene expression. Trends Genet. 21, 495–499. doi: 10.1016/j.tig.2005.07.006
de Hoon, M. J. L., Imoto, S., Nolan, J., and Miyano, S. (2004). Open source clustering software. Bioinformatics 20, 1453–1454. doi: 10.1093/bioinformatics/bth078
dos Santos, G., Schroeder, A. J., Goodman, J. L., Strelets, V. B., Crosby, M. A., Thurmond, J., et al. (2015). FlyBase: introduction of the Drosophila melanogaster Release 6 reference genome assembly and large-scale migration of genome annotations. Nucleic Acids Res. 43, D690–D697.
Drost, H.-G., and Paszkowski, J. (2017). Biomartr: genomic data retrieval with R. Bioinformatics 33:btw821. doi: 10.1093/bioinformatics/btw821
Dubendorfer, A., Hediger, M., Burghardt, G., and Bopp, D. (2002). Musca domestica, a window on the evolution of sex-determining mechanisms in insects. Int. J. Dev. Biol. 46, 75–79.
Ellegren, H., and Parsch, J. (2007). The evolution of sex-biased genes and sex-biased gene expression. Nat. Rev. Genet. 8, 689–698. doi: 10.1038/nrg2167
Erickson, J. W., and Cline, T. W. (1998). Key aspects of the primary sex determination mechanism are conserved across the genus Drosophila. Development 125, 3259–3268. doi: 10.1242/dev.125.16.3259
Flight, R. M., and Wentzell, P. D. (2009). Potential bias in GO::TermFinder. Brief. Bioinform. 10, 289–294. doi: 10.1093/bib/bbn054
Flores, M., Longnecker, M., and Tomberlin, J. K. (2014). Effects of temperature and tissue type on Chrysomya rufifacies (Diptera: Calliphoridae) (Macquart) development. Forensic Sci. Int. 245, 24–29. doi: 10.1016/j.forsciint.2014.09.023
Frątczak-Łagiewska and Matuszewski, K., and Matuszewski, S. (2018). Sex-specific developmental models for Creophilus maxillosus (L.) (Coleoptera: Staphylinidae): searching for larger accuracy of insect age estimates. Int. J. Legal Med. 132, 887–895. doi: 10.1007/s00414-017-1713-4
Fremdt, H., Amendt, J., and Zehner, R. (2014). Diapause-specific gene expression in Calliphora vicina (Diptera: Calliphoridae)-a useful diagnostic tool for forensic entomology. Int. J. Legal Med. 128:1001. doi: 10.1007/s00414-013-0920-x
Ghiselli, F., Milani, L., Chang, P. L., Hedgecock, D., Davis, J. P., Nuzhdin, S. V., et al. (2011). De novo assembly of the Manila clam Ruditapes philippinarum transcriptome provides new insights into expression bias, mitochondrial doubly uniparental inheritance and sex determination. Mol. Biol. Evol. 29, 771–786. doi: 10.1093/molbev/msr248
Grassberger, M., and Reiter, C. (2001). Effect of temperature on Lucilia sericata (Diptera: Calliphoridae) development with special reference to the isomegalen- and isomorphen-diagram. Forensic Sci. Int. 120, 32–36. doi: 10.1016/S0379-0738(01)00413-3
Grassberger, M., and Reiter, C. (2002). Effect of temperature on development of the forensically important holarctic blow fly Protophormia terraenovae (Robineau-Desvoidy) (Diptera: Calliphoridae). Forensic Sci. Int. 128, 177–182. doi: 10.1016/S0379-0738(02)00199-8
Grath, S., and Parsch, J. (2016). Sex-biased gene expression. Annu. Rev. Genet. 50, 29–44. doi: 10.1146/annurev-genet-120215-035429
Graveley, B. R., Brooks, A. N., Carlson, J. W., Duff, M. O., Landolin, J. M., Yang, L., et al. (2011). The developmental transcriptome of Drosophila melanogaster. Nature 471, 473–479. doi: 10.1038/nature09715
Greenberg, B. (1990). Nocturnal oviposition behavior of blow flies (Diptera: Calliphoridae). J. Med. Entomol. 27, 807–810. doi: 10.1093/jmedent/27.5.807
Haerty, W., Jagadeeshan, S., Kulathinal, R. J., Wong, A., Ram, K. R., Sirot, L. K., et al. (2007). Evolution in the fast lane: Rapidly evolving sex-related genes in Drosophila. Genetics 177, 1321–1335. doi: 10.1534/genetics.107.078865
Hao, W., Zhang, Y., and Xu, Y. (2013). Identification of a juvenile hormone esterase binding protein gene and its developmental and hormone regulation in the silkworm, Bombyx mori. J. Insect Physiol. 59, 906–912. doi: 10.1016/j.jinsphys.2013.06.009
Hedrick, A. V., and Temeles, E. J. (1989). The evolution of sexual dimorphism in animals: hypotheses and tests. Trends Ecol. Evol. 4, 4–6. doi: 10.1016/0169-5347(89)90212-7
Jonika, M. M., Hjelmen, C. E., Faris, A. M., McGuane, A. S., and Tarone, A. M. (2020). An evaluation of differentially spliced genes as markers of sex for forensic entomology. J. Forensic Sci. 65, 1579–1587. doi: 10.1111/1556-4029.14461
Kaneshrajah, G., and Turner, B. (2004). Calliphora vicina larvae grow at different rates on different body tissues. Int. J. Legal Med. 118, 242–244. doi: 10.1007/s00414-004-0444-5
Kronja, I., Yuan, B., Eichhorn, S. W., Dzeyk, K., Krijgsveld, J., Bartel, D. P., et al. (2014). Widespread changes in the posttranscriptional landscape at the Drosophila oocyte-to-embryo transition. Cell Rep. 7, 1495–1508. doi: 10.1016/j.celrep.2014.05.002
Lagos, D., Koukidou, M., Savakis, C., and Komitopoulou, K. (2007). The transformer gene in Bactrocera oleae: the genetic switch that determines its sex fate. Insect Mol. Biol. 16, 221–230. doi: 10.1111/j.1365-2583.2006.00717.x
Lebo, M. S., Sanders, L. E., Sun, F., and Arbeitman, M. N. (2009). Somatic, germline and sex hierarchy regulated gene expression during Drosophila metamorphosis. BMC Genomics 10:80. doi: 10.1186/1471-2164-10-80
Lecuit, T., Samanta, R., and Wieschaus, E. (2002). slam encodes a developmental regulator of polarized membrane growth during cleavage of the Drosophila embryo. Dev. Cell 2, 425–436. doi: 10.1016/S1534-5807(02)00141-7
Lewin, A., and Grieve, I. C. (2006). Grouping Gene Ontology terms to improve the assessment of gene set enrichment in microarray data. BMC Bioinformatics 7:426. doi: 10.1186/1471-2105-7-426
Li, F., Vensko, S. P. II, Belikoff, E. J., and Scott, M. J. (2013). Conservation and sex-specific splicing of the transformer gene in the calliphorids Cochliomyia hominivorax, Cochliomyia macellaria and Lucilia sericata. PLoS One 8:e56303. doi: 10.1371/journal.pone.0056303
Liu, Z., Ho, L., and Bonning, B. (2007). Localization of a Drosophila melanogaster homolog of the putative juvenile hormone esterase binding protein of Manduca sexta. Insect Biochem. Mol. Biol. 37, 155–163. doi: 10.1016/j.ibmb.2006.11.003
Luo, R., Liu, B., Xie, Y., Li, Z., Huang, W., Yuan, J., et al. (2012). SOAPdenovo2: an empirically improved memory-efficient short-read de novo assembler. Gigascience 1:18. doi: 10.1186/2047-217X-1-18
Mank, J. E., Hosken, D. J., and Wedell, N. (2011). Some inconvenient truths about sex chromosome dosage compensation and the potential role of sexual conflict. Evolution 65, 2133–2144. doi: 10.1111/j.1558-5646.2011.01316.x
Martín-Vega, D., Hall, M. J. R., and Simonsen, T. J. (2016). Resolving confusion in the use of concepts and terminology in intrapuparial development studies of cyclorrhaphous Diptera. J. Med. Entomol. 53, 1249–1251. doi: 10.1093/jme/tjw081
Matuszewski, S., and Fratczak-Łagiewska, K. (2018). Size at emergence improves accuracy of age estimates in forensically-useful beetle Creophilus maxillosus L. (Staphylinidae). Sci. Rep. 8:2390. doi: 10.1038/s41598-018-20796-1
McCarthy, D. J., Chen, Y., and Smyth, G. K. (2012). Differential expression analysis of multifactor RNA-Seq experiments with respect to biological variation. Nucleic Acids Res. 40, 4288–4297. doi: 10.1093/nar/gks042
Morrow, E. H., Stewart, A. D., and Rice, W. R. (2008). Assessing the extent of genome-wide intralocus sexual conflict via experimentally enforced gender-limited selection. J. Evol. Biol. 21, 1046–1054. doi: 10.1111/j.1420-9101.2008.01542.x
Morrow, J. L., Riegler, M., Frommer, M., and Shearman, D. C. A. (2014a). Expression patterns of sex-determination genes in single male and female embryos of two Bactrocera fruit fly species during early development. Insect Mol. Biol. 23, 754–767. doi: 10.1111/imb.12123
Morrow, J. L., Riegler, M., Gilchrist, A. S., Shearman, D. C. A. A., and Frommer, M. (2014b). Comprehensive transcriptome analysis of early male and female Bactrocera jarvisi embryos. BMC Genet. 15:S7. doi: 10.1186/1471-2156-15-S2-S7
Muller-Holtkamp, F. (1995). The Sex-lethal gene homologue in Chrysomya rufifacies is highly conserved in sequence and exon-intron organization. J. Mol. Evol. 41, 467–477. doi: 10.1007/bf00160318
National Research Council (2009). Strengthening Forensic Science in the United States: A Path Forward. Washington, DC: The National Academies Press. doi: 10.17226/12589
Navarro-Costa, P., and Martinho, R. G. (2020). The emerging role of transcriptional regulation in the oocyte-to-zygote transition. PLoS Genet. 16:e1008602. doi: 10.1371/journal.pgen.1008602
Owings, C. G., Spiegelman, C., Tarone, A. M., and Tomberlin, J. K. (2014). Developmental variation among Cochliomyia macellaria Fabricius (Diptera: Calliphoridae) populations from three ecoregions of Texas, USA. Int. J. Legal Med. 128, 709–717. doi: 10.1007/s00414-014-1014-0
Page, R. D. M. (1996). Tree View: An application to display phylogenetic trees on personal computers. Bioinformatics 12, 357–358. doi: 10.1093/bioinformatics/12.4.357
Parisi, M., Nuttall, R., Edwards, P., Minor, J., Naiman, D., Lü, J., et al. (2004). A survey of ovary-, testis-, and soma-biased gene expression in Drosophila melanogaster adults. Genome Biol. 5, 1–18. doi: 10.1186/gb-2004-5-6-r40
Patrício Macedo, M., Arantes, L. C., and Tidon, R. (2018). Sexual size dimorphism in three species of forensically important blowflies (Diptera: Calliphoridae) and its implications for postmortem interval estimation. Forensic Sci. Int. 293, 86–90. doi: 10.1016/j.forsciint.2018.10.009
Perry, J. C., Harrison, P. W., and Mank, J. E. (2014). The ontogeny and evolution of sex-biased gene expression in Drosophila melanogaster. Mol. Biol. Evol. 31, 1206–1219. doi: 10.1093/molbev/msu072
Picard, C. J., Deblois, K., Tovar, F., Bradley, J. L., Johnston, J. S., and Tarone, A. M. (2013). Increasing precision in development-based postmortem interval estimates: what’s sex got to do with it? J. Med. Entomol. 50, 425–431. doi: 10.1603/ME12051
Picard, C. J., Johnston, J. S., and Tarone, A. M. (2012). Genome sizes of forensically relevant Diptera. J. Med. Entomol. 49, 192–197. doi: 10.1603/me11075
Pimsler, M. L., Sze, S.-H., Saenz, S., Fu, S., Tomberlin, J. K., and Tarone, A. M. (2019). Gene expression correlates of facultative predation in the blow fly Chrysomya rufifacies (Diptera: Calliphoridae). Ecol. Evol. 9:5413. doi: 10.1002/ece3.5413
R Core Team (2010). R: A language and environment for statistical computing. R Foundation for Statistical Computing. Vienna: R Foundation for Statistical Computing, doi: ISBN 3-900051-07-0
Ranz, J. M. (2003). Sex-dependent gene expression and evolution of the Drosophila transcriptome. Science 300, 1742–1745. doi: 10.1126/science.1085881
Ranz, J. M., Castillo-Davis, C. I., Meiklejohn, C. D., and Hartl, D. L. (2003). Sex-dependent gene expression and evolution of the Drosophila transcriptome. Science 300, 1742–1745.
Ritchie, M. E., Phipson, B., Wu, D., Hu, Y., Law, C. W., Shi, W., et al. (2015). limma powers differential expression analyses for RNA-sequencing and microarray studies. Nucleic Acids Res. 43, e47–e47. doi: 10.1093/nar/gkv007
Robinson, M. D., McCarthy, D. J., and Smyth, G. K. (2010). edgeR: a Bioconductor package for differential expression analysis of digital gene expression data. Bioinformatics 26, 139–140. doi: 10.1093/bioinformatics/btp616
Salvemini, M., Amato, R. D., Petrella, V., Ippolito, D., Ventre, G., Zhang, Y., et al. (2014a). Subtractive and differential hybridization molecular analyses of Ceratitis capitata XX/XY versus XX embryos to search for male-specific early transcribed genes. BMC Genet. 15:S5. doi: 10.1186/1471-2156-15-S2-S5
Salvemini, M., Arunkumar, K. P., Nagaraju, J., Sanges, R., Petrella, V., Tomar, A., et al. (2014b). De novo assembly and transcriptome analysis of the Mediterranean fruit fly Ceratitis capitata early embryos. PLoS One 9:e114191. doi: 10.1371/journal.pone.0114191
Sanford, M. R. (2017). Insects and associated arthropods analyzed during medicolegal death investigations in Harris County, Texas, USA: January 2013-April 2016. PLoS One 12:1–23. doi: 10.1371/journal.pone.0179404
Sapti, M., Klassen, W., and Curtis, C. F. (2005). “History of the Sterile Insect Technique,” in Sterile Insect Technique: Principles and Practice in Area-Wide Integrated Pest Management, eds V. A. Dyck, J. Hendrichs, and A. S. Robinson (Dordrecht: Springer), 3–36. doi: 10.1007/1-4020-4051-2_1
Sawanth, S. K., Gopinath, G., Sambrani, N., and Arunkumar, K. P. (2016). The autoregulatory loop: A common mechanism of regulation of key sex determining genes in insects. J. Biosci. 41, 283–294. doi: 10.1007/s12038-016-9609-x
Scott, M. J. M. J., Pimsler, M. L. M. L. M. L., and Tarone, A. M. A. M. (2014). Sex determination mechanisms in the Calliphoridae (Blow Flies). Sex. Dev. 8, 29–37. doi: 10.1159/000357132
Shearman, D. C. (2002). The evolution of sex determination systems in dipteran insects other than Drosophila. Genetica 116, 25–43.
Shine, R. (1989). Ecological causes for the evolution of sexual simorphism: a review of the evidence. Q. Rev. Biol. 64, 419–461. doi: 10.1086/416458
Singh, D., and Bharti, M. (2001). Further observations on the nocturnal oviposition behaviour of blow flies (Diptera: Calliphoridae). Forensic Sci. Int. 120, 124–126. doi: 10.1016/S0379-0738(01)00419-4
Small, C. M., Carney, G. E., Mo, Q., Vannucci, M., and Jones, A. G. (2009). A microarray analysis of sex- and gonad-biased gene expression in the zebrafish: evidence for masculinization of the transcriptome. BMC Genomics 10:579. doi: 10.1186/1471-2164-10-579
Smith, J. L., and Cook, A. K. (2020). First use of an entire age cohort to evaluate the role of sex in the development of the forensically important Chrysomya megacephala (Diptera: Calliphoridae). J. Med. Entomol. 57, 641–644. doi: 10.1093/jme/tjz205
Stillwell, R. C., Blanckenhorn, W. U., Teder, T., Davidowitz, G., and Fox, C. W. (2010). Sex differences in phenotypic plasticity affect variation in sexual size dimorphism in insects: from physiology to evolution. Annu. Rev. Entomol. 55, 227–245. doi: 10.1146/annurev-ento-112408-085500
Supek, F., Bošnjak, M., Škunca, N., and Šmuc, T. (2011). REVIGO summarizes and visualizes long lists of gene ontology terms. PLoS One 6:e21800. doi: 10.1371/journal.pone.0021800
Sze, S.-H. H., Dunham, J. P., Carey, B., Chang, P. L., Li, F., Edman, R. M., et al. (2012). A de novo transcriptome assembly of Lucilia sericata (Diptera: Calliphoridae) with predicted alternative splices, single nucleotide polymorphisms and transcript expression estimates. Insect Mol. Biol. 21, 205–221. doi: 10.1111/j.1365-2583.2011.01127.x
Sze, S.-H., Pimsler, M. L., Tomberlin, J. K., Jones, C. D., and Tarone, A. M. (2017). A scalable and memory-efficient algorithm for de novo transcriptome assembly of non-model organisms. BMC Genomics 18:387. doi: 10.1186/s12864-017-3735-1
Tarone, A. M., and Benoit, J. B. (2019). “Insect development as it relates to forensic entomology,” in Forensic Entomology: The Utility of Arthropods in Legal Investigations, eds J. H. Byrd and K. Tomberlin (London: CRC Press), 225–252. doi: 10.4324/9781351163767-10
Tarone, A. M., and Foran, D. R. (2006). Components of developmental plasticity in a Michigan population of Lucilia sericata (Diptera: Calliphoridae). J. Med. Entomol. 43, 1023–1033. doi: 10.1093/jmedent/43.5.1023
Tarone, A. M., and Foran, D. R. (2008). Generalized additive models and Lucilia sericata growth: Assessing confidence intervals and error rates in forensic entomology. J. Forensic Sci. 53, 942–948. doi: 10.1111/j.1556-4029.2008.00744.x
Tarone, A. M., Foran, D. R., Ph, D., Foran, D. R., and Ph, D. (2011). Gene expression during blow fly development: improving the precision of age estimates in forensic entomology. J. Forensic Sci. 56, 112–122. doi: 10.1111/j.1556-4029.2010.01632.x
Tarone, A. M., Singh, B., and Picard, C. J. (2015). “Molecular biology in forensic entomology,” in Forensic Entomology: International Dimensions and Frontiers, eds J. K. Tomberlin and M. E. Benbow (London: CRC Press), 297–316.
Tomberlin, J. K., Adler, P. H., Myers, H. M., and Entomol, E. (2009). Development of the black soldier fly (Diptera: Stratiomyidae) in relation to Ttemperature. Physiol. Ecol. 38, 930–934. doi: 10.1603/022.038.0347
Tomberlin, J. K., Benbow, M. E., and Tarone, A. M. and Mohr, R. M. (2011). Basic research in evolution and ecology enhances forensics. Trends Ecol. Evol. 26, 53–55. doi: 10.1016/j.tree.2010.12.001
Ullerich, F. H. (1963). Geschlechtschromosomen und Geschlechtsbestimmung bei einigen Calliphorinen (Calliphoridae, Diptera). Chromosoma 14, 45–110. doi: 10.1007/bf00332610
Ullerich, F. H. (1973). Die genetische grundlage der monogenie beider schmeilfliege Chrysomya rufifacies (Calliphoridae, Diptera). Mol. Gen. Genet. 125, 157–172. doi: 10.1007/bf00268869
Ullerich, F. H. (1975). [Identification of the genetic sex chromosomes in the monogenic blowfly Chrysomya rufifacies (Calliphoridae, Diptera)]. Chromosoma 50, 393–419. doi: 10.1007/bf00327076
Ullerich, F. H. (1977). Production of male and female offspring in the strictly monogenic fly Chrysomya rufifacies after ovary transplantation. Naturwissenschaften 64, 277–278. doi: 10.1007/bf00438313
Ullerich, F. H. (1980). Analysis of the predetermining effect of a sex realizer by ovary transplantations in the monogenic fly Chrysomya rufifacies. Wilhelm Roux’s Arch. Dev. Biol. 188, 37–43. doi: 10.1007/bf00848608
Ullerich, F. H. (1984). Analysis of sex determination in the monogenic blowfly Chrysomya rufifacies by pole cell transplantation. Mol. Gen. Genet. 193, 479–487. doi: 10.1007/bf00382087
Van Emden, F. I. (1957). The taxonomic significance of the characters of immature insects. Annu. Rev. Entomol. 2, 91–106. doi: 10.1146/annurev.en.02.010157.000515
Vuong, Q. H. (1989). Likelihood ratio tests for model selection and non-nested hypotheses. Econometrica 57:307. doi: 10.2307/1912557
Wang, X., Xiong, M., Wang, J., Lei, C., and Zhu, F. (2015). Reference gene stability of a synanthropic fly, Chrysomya megacephala. Parasites Vectors 8, 1–10. doi: 10.1186/s13071-015-1175-9
Waterhouse, R. M., Seppey, M., Simão, F. A., and Zdobnov, E. M. (2019). “Using BUSCO to assess insect genomic resources,” in Methods in Molecular Biology, ed. J. M. Walker (New Jersey, NJ: Humana Press Inc.), 59–74. doi: 10.1007/978-1-4939-8775-7_6
Whitworth, T. (2010). Keys to the genera of species of blow flies (Diptera: Calliphoridae) of the West Indies and description of a new species of Lucilia Robineau-Desvoidy. Zootaxa 2663, 1–35. doi: 10.11646/zootaxa.2663.1.1
Wilton, D. P. (1954). A study of a blowfly, Chrysomya rufifacies (Macquart), with special reference to its reproductive behavior (Diptera: Calliphoridae). Ph. D. thesis. Hawaii: University of Hawaii.
Yan, Y., Williamson, M. E., Davis, R. J., Andere, A. A., Picard, C. J., and Scott, M. J., (2020). Improved transgenic sexing strains for genetic control of the Australian sheep blow fly Lucilia cuprina using embryo-specific gene promoters. Molecular Genetics and Genomics 295, 287–298. doi: 10.1007/s00438-019-01622-3
Yanmanee, S., Husemann, M., Benbow, M. E., and Suwannapong, G. (2016). Larval development rates of Chrysomya rufifacies Macquart, 1842 (Diptera: Calliphoridae) within its native range in South-East Asia. Forensic Sci. Int. 266, 63–67. doi: 10.1016/j.forsciint.2016.04.033
Yu, G., Cheng, P., Chen, Y., Li, Y., Yang, Z., Chen, Y., et al. (2011). Inoculating poultry manure with companion bacteria influences growth and development of black soldier fly (Diptera: Stratiomyidae) larvae. Environ. Entomol. 40, 30–35. doi: 10.1603/EN10126
Zajac, B. K., Amendt, J., Horres, R., Verhoff, M. A., and Zehner, R. (2015). De novo transcriptome analysis and highly sensitive digital gene expression profiling of Calliphora vicina (Diptera: Calliphoridae) pupae using MACE (Massive Analysis of cDNA Ends). Forensic Sci. Int. Genet. 15, 137–146. doi: 10.1016/j.fsigen.2014.11.013
Zehner, R., Amendt, J., and Boehme, P. (2009). Gene expression analysis as a tool for age estimation of blowfly pupae. Forensic Sci. Int. Genet. Suppl. Ser. 2, 292–293. doi: 10.1016/j.fsigss.2009.08.008
Zerbino, D. R., Achuthan, P., Akanni, W., Amode, M. R., Barrell, D., Bhai, J., et al. (2018). Ensembl 2018. Nucleic Acids Res. 46, D754–D761. doi: 10.1093/nar/gkx1098
Zhang, Y., Sturgill, D., Parisi, M., Kumar, S., and Oliver, B. (2007). Constraint and turnover in sex-biased gene expression in the genus Drosophila. Nature 450, 233–237. doi: 10.1038/nature06323
Zuha, R. M., and Omar, B. (2014). Developmental rate, size, and sexual dimorphism of Megaselia scalaris (Loew) (Diptera: Phoridae): Its possible implications in forensic entomology. Parasitol. Res. 113, 2285–2294. doi: 10.1007/s00436-014-3883-z
Keywords: forensic entomology, development, transcriptome, sexual dimorphism, Calliphoridae
Citation: Pimsler ML, Hjelmen CE, Jonika MM, Sharma A, Fu S, Bala M, Sze S-H, Tomberlin JK and Tarone AM (2021) Sexual Dimorphism in Growth Rate and Gene Expression Throughout Immature Development in Wild Type Chrysomya rufifacies (Diptera: Calliphoridae) Macquart. Front. Ecol. Evol. 9:696638. doi: 10.3389/fevo.2021.696638
Received: 17 April 2021; Accepted: 14 May 2021;
Published: 29 July 2021.
Edited by:
Gulnaz T. Javan, Alabama State University, United StatesReviewed by:
Jonathan J. Parrott, Arizona State University West Campus, United StatesSheree J. Finley, Alabama State University, United States
Copyright © 2021 Pimsler, Hjelmen, Jonika, Sharma, Fu, Bala, Sze, Tomberlin and Tarone. This is an open-access article distributed under the terms of the Creative Commons Attribution License (CC BY). The use, distribution or reproduction in other forums is permitted, provided the original author(s) and the copyright owner(s) are credited and that the original publication in this journal is cited, in accordance with accepted academic practice. No use, distribution or reproduction is permitted which does not comply with these terms.
*Correspondence: Meaghan L. Pimsler, mlpimsler@gmail.com