Early Breeding Conditions Followed by Reduced Breeding Success Despite Timely Arrival in an Alpine Migratory Songbird
 Martha Maria Sander1*
  Dan Chamberlain1
  Camille Mermillon2 Riccardo Alba1
  Susanne Jähnig1 Domenico Rosselli3
  Christoph Manuel Meier4
  Simeon Lisovski5*
- 1Department of Life Sciences and Systems Biology, University of Turin, Turin, Italy
- 2Centre d’Etudes Biologiques de Chizé, CNRS UMR 7372, La Rochelle Université, Villiers-en-Bois, France
- 3Ente di Gestione delle Aree Protette delle Alpi Cozie, Salbertrand, Italy
- 4Department of Bird Migration, Swiss Ornithological Institute, Sempach, Switzerland
- 5Alfred Wegener Institute, Helmholtz Center for Polar and Marine Research, Polar Terrestrial Environmental Systems, Potsdam, Germany
Timing reproduction to coincide with optimal environmental conditions is key for many organisms living in seasonal habitats. Advance in the onset of spring is a particular challenge to migratory birds that must time their arrival without knowing the conditions on the breeding grounds. This is amplified at high elevations where resource availability, which is linked to snowmelt and vegetation development, shows much annual variation. With the aim of exploring the effects of variability in the onset of local resource availability on reproduction, we compared key life history events in an Alpine population of the Northern Wheatear (Oenanthe oenanthe) between years of contrasting timing of snowmelt. Based on remote sensed images, we identified 2020 as an exceptionally early snowmelt and green-up year compared to the preceding year and the long-term average. Individuals tracked with light-level geolocators arrived well before the snowmelt in 2020 and clutch initiation dates across the population were earlier in 2020 compared to 2019. However, observations from a citizen science database and nest monitoring data showed that the arrival-breeding interval was shorter in 2020, thus the advance in timing lagged behind the environmental conditions. While hatching success was similar in both years, fledging success was significantly reduced in 2020. A trophic mismatch in early 2020 could be a possible explanation for the reduced reproductive success, but alternative explanations cannot be excluded. Our results show that, despite the timely arrival at the breeding grounds and a contraction of the arrival-breeding interval, Wheatears were not able to advance breeding activities in synchrony with environmental conditions in 2020. Earlier reproductive seasons are expected to become more frequent in the future. We show that the negative effects of changing seasons in Alpine migratory birds might be similar to birds breeding at high latitudes, despite their shorter migratory distance.
Introduction
Alpine habitats are highly seasonal and are characterised by a relatively short reproductive period compared to the lowlands at similar latitudes (Nagy and Grabherr, 2009; Lisovski et al., 2017). However, the onset of the reproductive season depends on the timing of snow melt that can be highly variable between years, requiring a level of phenotypic flexibility in organisms to respond accordingly (Martin and Wiebe, 2004; Jabis et al., 2020). Timely arrival at the breeding site is crucial (Møller et al., 2010), and the entire annual schedule of migrants is meticulously tuned and adapted to spring phenology (La Sorte and Graham, 2020), in particular resource availability during offspring rearing (Doiron et al., 2015). Years with relatively extreme conditions, especially in early spring, can have severe consequences for migrants (Shipley et al., 2020). Late arrival can result in a mismatch between the energetic demands of the migrants and their reproductive effort, and local food abundance, with subsequent negative effects on offspring growth (Doiron et al., 2015), survival (Post and Forchhammer, 2007), annual productivity (Visser et al., 2006), recruitment in following years (Reed et al., 2013), and thus population size (Both et al., 2010). Extreme weather events, cold snaps, shorter days, and colder nights at the beginning of early snow melt years can pose additional challenges and may also reduce the reproductive success of alpine birds (MacDonald et al., 2013; Moreno et al., 2015; Martin et al., 2017; Bründl et al., 2020; Shipley et al., 2020).
Understanding the fitness consequences and the phenotypic constraints of migratory animals during years with early breeding conditions has become a focal issue, since climate warming results in the advancement of spring conditions worldwide (Parmesan and Yohe, 2003) which can have negative consequences for biodiversity when these changes result in phenological mismatches (Visser and Gienapp, 2019). The phenological shifts seem especially fast in highly seasonal environments, including Alpine habitats (Oyler et al., 2015). Long-distance migrants have also experienced strong population declines over recent decades (Sanderson et al., 2006; Vickery et al., 2014). Furthermore, trophic mismatches appear to be most prominent in long-distance migrants that breed at high latitudes of the northern hemisphere and depend on highly seasonal food resources (Both et al., 2010; Doiron et al., 2015). In contrast, shorter distance migrants seem to have higher flexibility in adjusting their arrival dates, and long-term studies have shown that bird populations that match the pace of changing climate and underlying resources can even have positive population trajectories (Koleček et al., 2020).
The Northern Wheatear (Oenanthe oenanthe, henceforth wheatear) has one of the largest breeding distributions amongst migratory songbirds (Conder, 1989; Dunn et al., 2020), but the non-breeding distribution is confined to northern sub-Sahara Africa (Cramp, 1988; Bairlein et al., 2012; Schmaljohann et al., 2012). Thus, migratory distance in wheatears can vary between 3,000 and almost 15,000 km (Förschler and Bairlein, 2011; Bairlein et al., 2012). European Alpine breeding wheatears have amongst the shortest migratory distance from breeding to wintering grounds (approx. 3,500 km) relative to other wheatear populations. However, the high-elevation breeding sites are similar to those of northerly breeding populations, being characterised by strong seasonal climate and food resources, and the duration of snow cover and the short season limits the reproductive period and requires accurate timing of life-history events (de Zwaan et al., 2019, 2020). The European Alps have experienced marked phenological changes over recent decades, including earlier springs (Migliavacca et al., 2008) and prolonged snow free periods (Asam et al., 2018), with potential consequences for high elevation species (e.g., Resano-Mayor et al., 2019).
Despite wider population declines in Europe (Pan-European Common Bird Monitoring Scheme, 1980-2009, Vickery et al., 2014), wheatear population trends in the Alps seem stable (Lehikoinen et al., 2018). This in part may be due to the shorter migratory distances of Alpine breeding birds that allow a greater flexibility to adjust the timing in synchrony with environmental conditions. Whilst the wheatear is classed as a long-distance migrant, the relatively short journey for those in southern Europe may mean these populations can cope better with environmental fluctuations, as has been proposed for short-distance migrants (Alerstam and Högstedt, 1980). Alpine breeding individuals may have always arrived in advance or stayed at nearby stopovers to monitor environmental conditions and occupy their breeding sites as soon as conditions permit (de Zwaan et al., 2019), thereby buffering effects of recent earlier springs in the Alps. Effects of climate change on alpine species’ demography through phenological changes seem highly likely (Scridel et al., 2018), although it is as yet unknown how earlier snow melt and spring green-up affect the timing and success of alpine breeding birds.
It is important to study biodiversity responses in climatically extreme years as they can serve as templates for likely future conditions (McGuire et al., 2020). A late snowmelt in 2019 and an exceptionally early snowmelt in 2020 across the European Alps provided a natural experiment that allowed us to explore how Alpine breeding wheatears’ reproduction is affected in years when the season is advanced. Our primary objective was therefore to understand how wheatear arrival varied in relation to snowmelt (in other words, is there evidence that they are able to arrive on the breeding grounds when conditions are right for the onset of breeding in years with widely different snowmelt dates), and thus determine whether this might have had any consequences for reproductive success. A secondary aim was to describe the migration of this species to and from the wintering grounds, adding tracks and more detailed locations to previously published data (Schmaljohann et al., 2016). There is a lack of detailed information on mountain bird ecology compared to other habitats, especially outside the breeding season (e.g., Boyle and Martin, 2015). It is thus important to study the whole annual cycle of mountain species to better understand how they may respond to environmental change. We thus provide an important baseline for understanding migration and how this relates to breeding season ecology, in our population of wheatears.
We used light-level geolocators to track wheatears across their annual migration and thus define their arrival at the breeding grounds, and collected detailed information on individual breeding activity and success as well as environmental conditions during the reproductive season. In addition, we used citizen science data on wheatear observations in order to quantify estimated arrival and transition dates of wheatears in the wider area of our study site, and potential longer term trends. Environmental conditions were measured both in the field and using remote sensed images in order to quantify seasonal vegetation development (i.e., spring green-up, the seasonal development of new vegetation growth). By combining the citizen science observations and remote sensing data, we aimed to put the data from our study into a wider spatio-temporal context. We predicted that the relatively short migration distance of Alpine breeding wheatears would lead to early arrival at the breeding grounds, allowing reproduction in synchrony with environmental conditions, even in the exceptionally early year of 2020. We thus predicted that individual plasticity in arrival would result in no effect of the variation in conditions from year to year on fitness.
Materials and Methods
Study Area
Data on environmental conditions, breeding phenology and breeding success were collected in 2019 and 2020 during the breeding season, from May to August, in Parco Naturale Val Troncea, 44°57′28″N, 6°56′28″E, Western Alps, Piedmont, Italy (Figure 1A). The elevation of the study area varied from 1,560 m a.s.l. to 2,700 m a.s.l. and was located on a south-eastern slope. The landscape structure is characterised by forests (predominantly larch Larix decidua) with shrubby patches at lower elevations, and larches interspersed with open grasslands at around 2,200 m a.s.l., followed by rocky areas, above the treeline. The valley is used seasonally as pasture, and grazing cows influence the distribution and availability of potential open grassland habitat across all elevations (Jähnig et al., 2018).
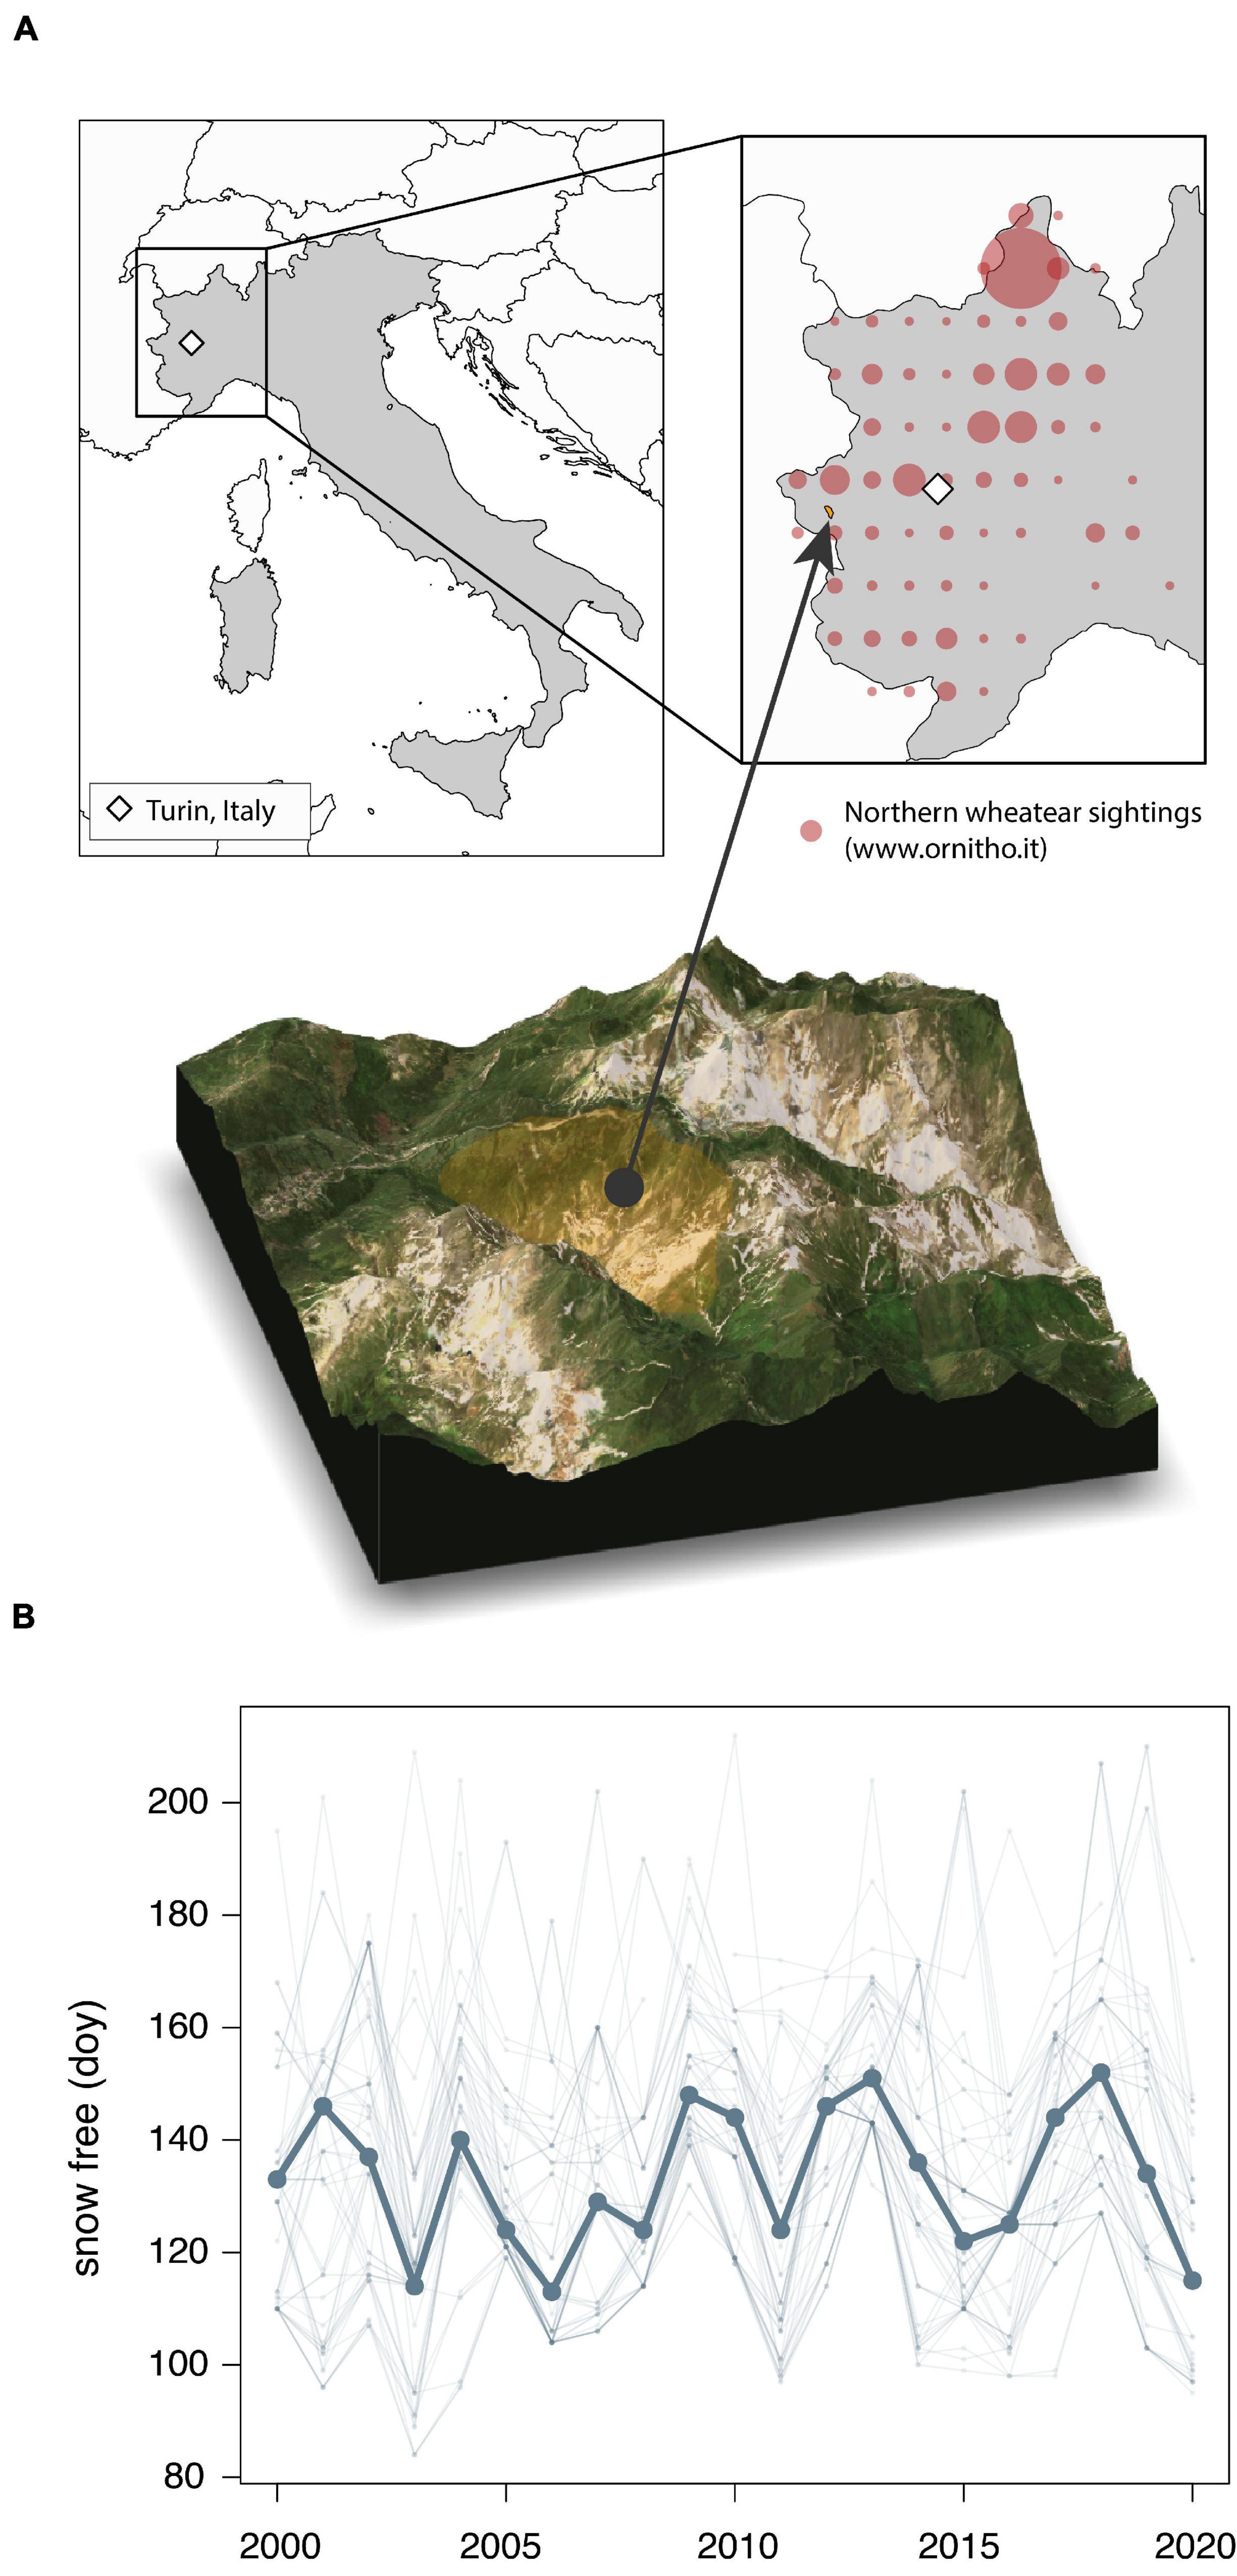
Figure 1. (A) Location of the study area, Parco Naturale Val Troncea in the Western Alps in Piedmont, Italy (yellow shaded south-eastern slope in topographical map), and the locations of wheatear sightings between March and May submitted to the ornitho.it database (red circle size corresponds to the number of sightings within a 0.25° grid cell). (B) The day of the year, from 2000 to 2020, after which the study area was generally snow free in spring for at least 60 days. The fine lines represent the snow free dates for all MODIS satellite image pixels within the study area and the thick line connects the annual median values across pixels. Map data from Natural Earth (naturalearthdata.com), Landsat 5 and topographic model was downloaded from Mapbox (www.mapbox.com).
Environmental Conditions
To investigate the longer-term trends in the annual date of snowmelt (“the snow free date”), we used the remotely sensed MODIS (MOD10A1.006) Terra Snow Cover Daily Global 500 m dataset with recordings starting in 2000 (Hall et al., 2016). Daily values for all pixels (N = 68) within the study area were extracted from Google Earth Engine (Gorelick et al., 2017) via the R package rgee (Aybar, 2020). For each pixel and each year, we identified the snow free date as the first date without snow that was followed by at least 60 days (approximately 2 months) of snow free conditions, ignoring potential snow free periods within the winter.
To derive higher-resolution snow free dates for the actual nest sites in the study area during 2019 and 2020, we used the remotely sensed Sentinel-2 MSI MultiSpectral Instrument Level-2A dataset with a spatial resolution of 10 m (Drusch et al., 2012). On the Google Earth Engine Server, we first selected all images taken in 2019 and 2020 intersecting at least one of the nest sites. Next, we masked cloud pixels using the Sentinel-2 Cloud Probability layer with the standard probability threshold of 60. We then calculated the normalised differenced snow index (NDSI, Band 8 and 4) and the normalised vegetation index (NDVI, Band 3 and 11). For each nest site and each image, we extracted the mean NDSI and NDVI values of all pixels within a 10 m radius (N = 2–4) around the nest. For each nest site and for both years, we fitted a smooth line (loess fit with span = 0.2 from the R package stats) to the NDVI and NDSI values over the day of the year, and extracted the day when the model fit fell below 0.1 NDSI (less than 10% of snow cover was defined as the snow free date) and exceeded 80% of the NDVI annual amplitude (the defined threshold when the peak in spring green-up was reached).
In the field, snow cover and grass height, as proxies for the spring green-up were monitored throughout the two breeding seasons (see Supplementary Table 1 for details and sample sizes). Data were collected using a standardised protocol for territory mapping. In summary, we defined four sectors above the treeline (total area: 161 ha) that were characterised by open grassland habitat, variation in elevation (∼ 700 m) and a high density of wheatear territories. We defined a route (∼ 6 km in each sector) along which we defined habitat survey points separated by a distance of 200 m (6–8 points each sector, 30 in total). Territory mapping and habitat point surveys were conducted over five visits between 27th May and 21st July 2019. Positions of singing males were recorded with a GPS device during the period between sunrise and 12 am and during suitable weather conditions. Following the protocol introduced by Südbeck and Weick (2005), territories were confirmed when a singing male or other territorial behaviour was recorded during at least two visits at the same point. Habitat parameters were recorded at each of these points (covering an area of 200 m × 200 m at habitat survey points and a 100 m radius around territory points) at each of the five visits and were all included in analyses to track changes in environmental conditions across the season. The territory mapping as well as the habitat point survey was repeated in 2020 over five visits between 14th May and 6th July.
Light Level Geolocation
Males and females were trapped either at their nest during chick feeding or with spring traps (using mealworm bait) when the nest location was unknown, not yet established, or chicks had fledged. In 2019, 35 adults were tagged, using 15 (eight males, seven females) light-level geolocators manufactured by Migrate Technology Ltd. [Intigeo P65, light stalk, 0.8 g, fitted with a leg-loop harness (Rappole and Tripton, 1991) and 20 (10 males, 10 females) geolocators manufactured by the Swiss Ornithological Institute (SOI, SOI-PAM, light stalk, recording pressure, 1.1 g)]. Device weights were on average 4.1% of the individuals’ body mass (2.8–5.2%, see Supplementary Table 2). All captured individuals were marked with three plastic colour rings and a metal ring of the Italian bird ringing scheme. As a control for the effect of geolocator devices on return rates, an additional 16 individuals were ringed, but were not fitted with a geolocator. All animal handling and protocols were carried out in accordance with relevant guidelines and regulations under licences issued by Istituto Superiore per la Protezione e la Ricerca Ambientale (ISPRA, protocol nos. 27303 and 2463) and Città di Torino (licence nos. 56.1433/2019 and 197.4765/2019).
Light-intensity data were recorded at 5 min intervals and analysed using a threshold method (Lisovski et al., 2020a). Sunrise and sunset events (twilight events) were identified on log-transformed light data and a threshold of 1 log lux, using the R package TwGeos (Lisovski et al., 2015).
Twilight events recorded at the known deployment site during periods after deployment and before recapture were used for calibration, i.e., to estimate the error distribution of twilight events and the individual reference sun elevation angle (position of the sun when twilight events were detected). For recordings from Migrate Technology Ltd., tags, migratory movements were identified as sudden and directed changes of consecutive sunrise or sunset events (for details, see the “invMovement” method description in Lisovski et al., 2020b). Stationary periods with a minimum of two consecutive twilight events were then identified as periods surrounded by migratory movements. For data recordings from Swiss Ornithological Institute tags, we used the additional air pressure measurements to identify movement periods with a change in a pressure threshold of 4 (change in the altitudinal position of the bird), using the method implemented and described in the R package PAMLr (Dhanjal-Adams, 2019).
For the final track estimation, we used a Bayesian approach from the R Package SGAT (Wotherspoon et al., 2016) allowing the incorporation of twilight events, their error distribution (gamma density distribution), the information on periods of movement and residency, a spatial probability mask and expected flight speed distribution (gamma distribution with shape = 2.2 and rate = 0.08).
The method provides the most likely paths with credible intervals derived via Markov Chain Monte Carlo (MCMC) simulations. The applied groupedThresholdModel provides a single location estimate for stationary periods as well as one location estimate for each twilight during movement. A spatial mask was applied for the estimate of stationary locations, restricting positions to be estimated on land. During the MCMC simulation, the first and last site of residency (in case the logger was still recording light on return from the wintering grounds) were fixed to the deployment site.
We first ran a modifiedGamma model (relaxed assumptions) for 1,000 iterations to initiate the model, before tuning the model with final assumptions/priors with three runs, each containing 300 iterations. Finally, the model was run for 2,000 iterations to ensure convergence. Median location estimates and 95% CrI were calculated using the entire final MCMC chain (i.e., each location estimate was based on 2,000 estimates from within the MCMC chains). Locations from the most likely track were used for plotting.
Arrival Dates
We used three different approaches to estimate the timing of departure and arrival at the breeding grounds in 2020 from the geolocator data. First, we used the dates from the above-described analysis of the stationary periods (first day at breeding ground after last northward migration stopover site, Supplementary Table 3). Second, we performed a separate analysis on the defined twilight times to estimate the probability that each sunrise and sunset time were recorded within the larger area around the breeding site (radius = 250 km). To this end, we used the calibrated individual gamma distribution of the twilight error and simulated 500 locations for each twilight time. The resulting locations reflect the expected precision of the location estimates (see Lisovski et al., 2018). The probability was then defined as the percentage of location estimates per twilight falling into the defined radius around the breeding site. A symmetrical Gaussian curve was then fitted to the probabilities over time, and departure and arrival were calculated as the dates when the curve fell, respectively, below or exceeded a probability of 0.5 (as well as the 0.025 and 0.975 probability to report the 95% confidence intervals). The idea behind the third approach emerged while inspecting the light recordings. During the sunrise periods at the beginning and the end of the recordings, thus at the breeding site, we discovered a time delay in the daily maximum light values. This was caused by the south-eastern slope of the breeding area and the fact that the direct sunlight was blocked by the mountain ridge in the east (Figure 1A). To make use of this pattern in the identification of the exact arrival and departure time at the breeding site, we applied an additional calibration with a higher light intensity threshold (9 log lux), slightly below the maximum light values that the tags can resolve (11 log lux), resulting in a gamma distribution of the delayed maximum light intensities. Due to the changes in the position of the sun, the delay was expected to change over the course of the year, thus we estimated the gamma distribution parameters for autumn and spring separately. Next, we calculated the probability that the daily timing of the maximum light intensity during sunrise would belong to the derived gamma distribution (the first half of the light recordings were compared to the autumn gamma distribution and the second half to the spring gamma distribution). A symmetrical Gaussian curve was then fitted to the probabilities over time, and departure and arrival was calculated as the date when the curve fell, respectively, below or exceeded a probability of 0.5 (as well as the 0.025 and 0.975 probability to report the 95% confidence intervals).
To estimate the general migration transition of wheatears migrating northward from African wintering ranges into the regions of Piedmont and Aosta Valley, and thus elaborate a proxy for the arrival in the wider area of the breeding site in the Western Alps in 2019 and 2020, we additionally used citizen science data of wheatear sightings during spring submitted via the ornitho.it platform. The data includes the number of all observations of wheatears per day in the period March–May. We furthermore used data from the years 2010 to 2020 to describe changes over a longer period, being aware of the bias in the data that might include not only local breeding wheatears, but also individuals migrating further north. It is not possible to formally account for observer effort in the ornito.it data, as observers often submit occasional observations of specific species. However, based on both the total number of observations of any species submitted in each year (2019: n = 151.799, 2020: n = 168.180) and the number of individual wheatear observations (2019: n = 101, 2020: n = 93), there appears to be negligible differences between years, hence we consider the data appropriate to indicate the general temporal migration patterns in the larger area of the study site.
Breeding Phenology and Success
From the fourth week of May until the first week of August (2019, 2020), we searched for wheatear nests in all four sectors as well as adjacent accessible areas, including open grassland sites at lower elevations (pastures). Each identified nest was marked with bamboo sticks at a distance of at least 5 m, and consecutively monitored until the chicks fledged or the nest failed.
Depending on the stage (e.g., longer breaks during incubation when date of hatching could be estimated from date of laying the last egg, following Conder, 1989), the status of the nests was recorded on average every 5 days. In 2020, at each visit, habitat parameters at the nest were recorded. We were able to record the exact dates for building, laying, hatching, and fledging for some nests in 2019 and 2020, and subsequently estimate the duration of each stage for our population (see for details Supplementary Table 4). We used the average of these individual durations of each stage (Supplementary Table 4) to estimate breeding phenology dates for nests where direct observation was not possible in all their stages (back or forward in time from a known breeding phenology date). If the number of eggs laid was unknown, we assumed a clutch size of five eggs, which is the average number within our population (nests reaching the stage of incubation and no. of eggs known, 2019: 36, 2020: 22), to estimate the lay date. Breeding phenology dates were calculated only for stages reached by the individual nest, e.g., we did not estimate a fledge date if the nest failed before. The arrival-breeding interval (A-B interval) was estimated by calculating the difference between the median arrival date and lay date, providing two estimates of A-B interval for 2020 (using geolocation and citizen science observations).
To estimate and compare the breeding success of the population between the two consecutive years 2019 and 2020, we considered three different measures: (a) the hatching success rate (eggs that hatched), (b) the fledging success rate (hatchlings that fledged), and (c) the nest success rate (successful nests/all nest attempts). Measures a and b allowed us to separate the breeding success into two states of a nest, i.e., nests during incubation and nests during chick rearing, by considering the success rates of individual eggs and hatchlings estimated as probabilities of reaching the next state (“period” hatching and fledging). We excluded nests where number of eggs or chicks was unknown or incomplete. For the vast majority of the nests, we could not determine whether this was a first attempt or a replacement of a failed attempt due to predation, abandonment or hatching failure. Thus, we included all nests monitored in our analyses, except for the nests known to be replacements.
We applied a general linear mixed model with binomial errors to quantify the success rate of hatching and fledging (a, b) of each egg laid within the population, with the fixed effects “year” (2019, 2020) and “period” (hatching, fledging), adding “nest id” as a random effect [using the function glmer from package lme4 (Bates et al., 2007)]. To quantify the nest success rate (c), we applied a generalised linear model with the fixed effect “year” (using the function glm from package stats). Model assumptions were tested by deriving residual plots and checking for overdispersion [function dispersion_glmer from package blmeco (Korner-Nievergelt et al., 2019)]. Conclusions from test statistics were based on the credibility intervals from the model predictions calculated using the function sim from package arm (Gelman and Hill, 2007), and by drawing 2,000 random samples from the posterior distribution of the model parameters to obtain their 95% credible intervals from these simulations. An effect was considered significant if the credible interval of the model estimate did not include zero (Korner-Nievergelt et al., 2015).
Results
Environmental Conditions
The time series of the snow free date within the study area (Figure 1A) from 2000 to 2020 showed high interannual variation, but no significant trend over time (t1191 = 1.88, p = 0.059, 0.20 days/year; −0.002 to 0.419 95% CI) (Figure 1B). In 2019, the median snow free date was close to the long-term average, whereas the snow free date in 2020 was the earliest for over a decade (Figure 1B). On average and at the finer scale around the detected wheatear nests, the area was snow free more than 3 weeks earlier in 2020 (median = 130 doy; 40th to 60th quantile 125–143) compared to 2019 (155; 148–164) (Figure 2A). Similarly, vegetation growth reached the 80% threshold 17 days earlier in 2020 (162; 156–167) compared to 2019 (181, 178–184), and was strongly correlated with snow free dates (R2 = 0.43, p < 0.001, t254 = 7.68) (Table 1). Snow cover and vegetation height data from direct observations in the field matched remote sensed images (Figure 2A, date of snowmelt and 80%-NDVI amplitude).
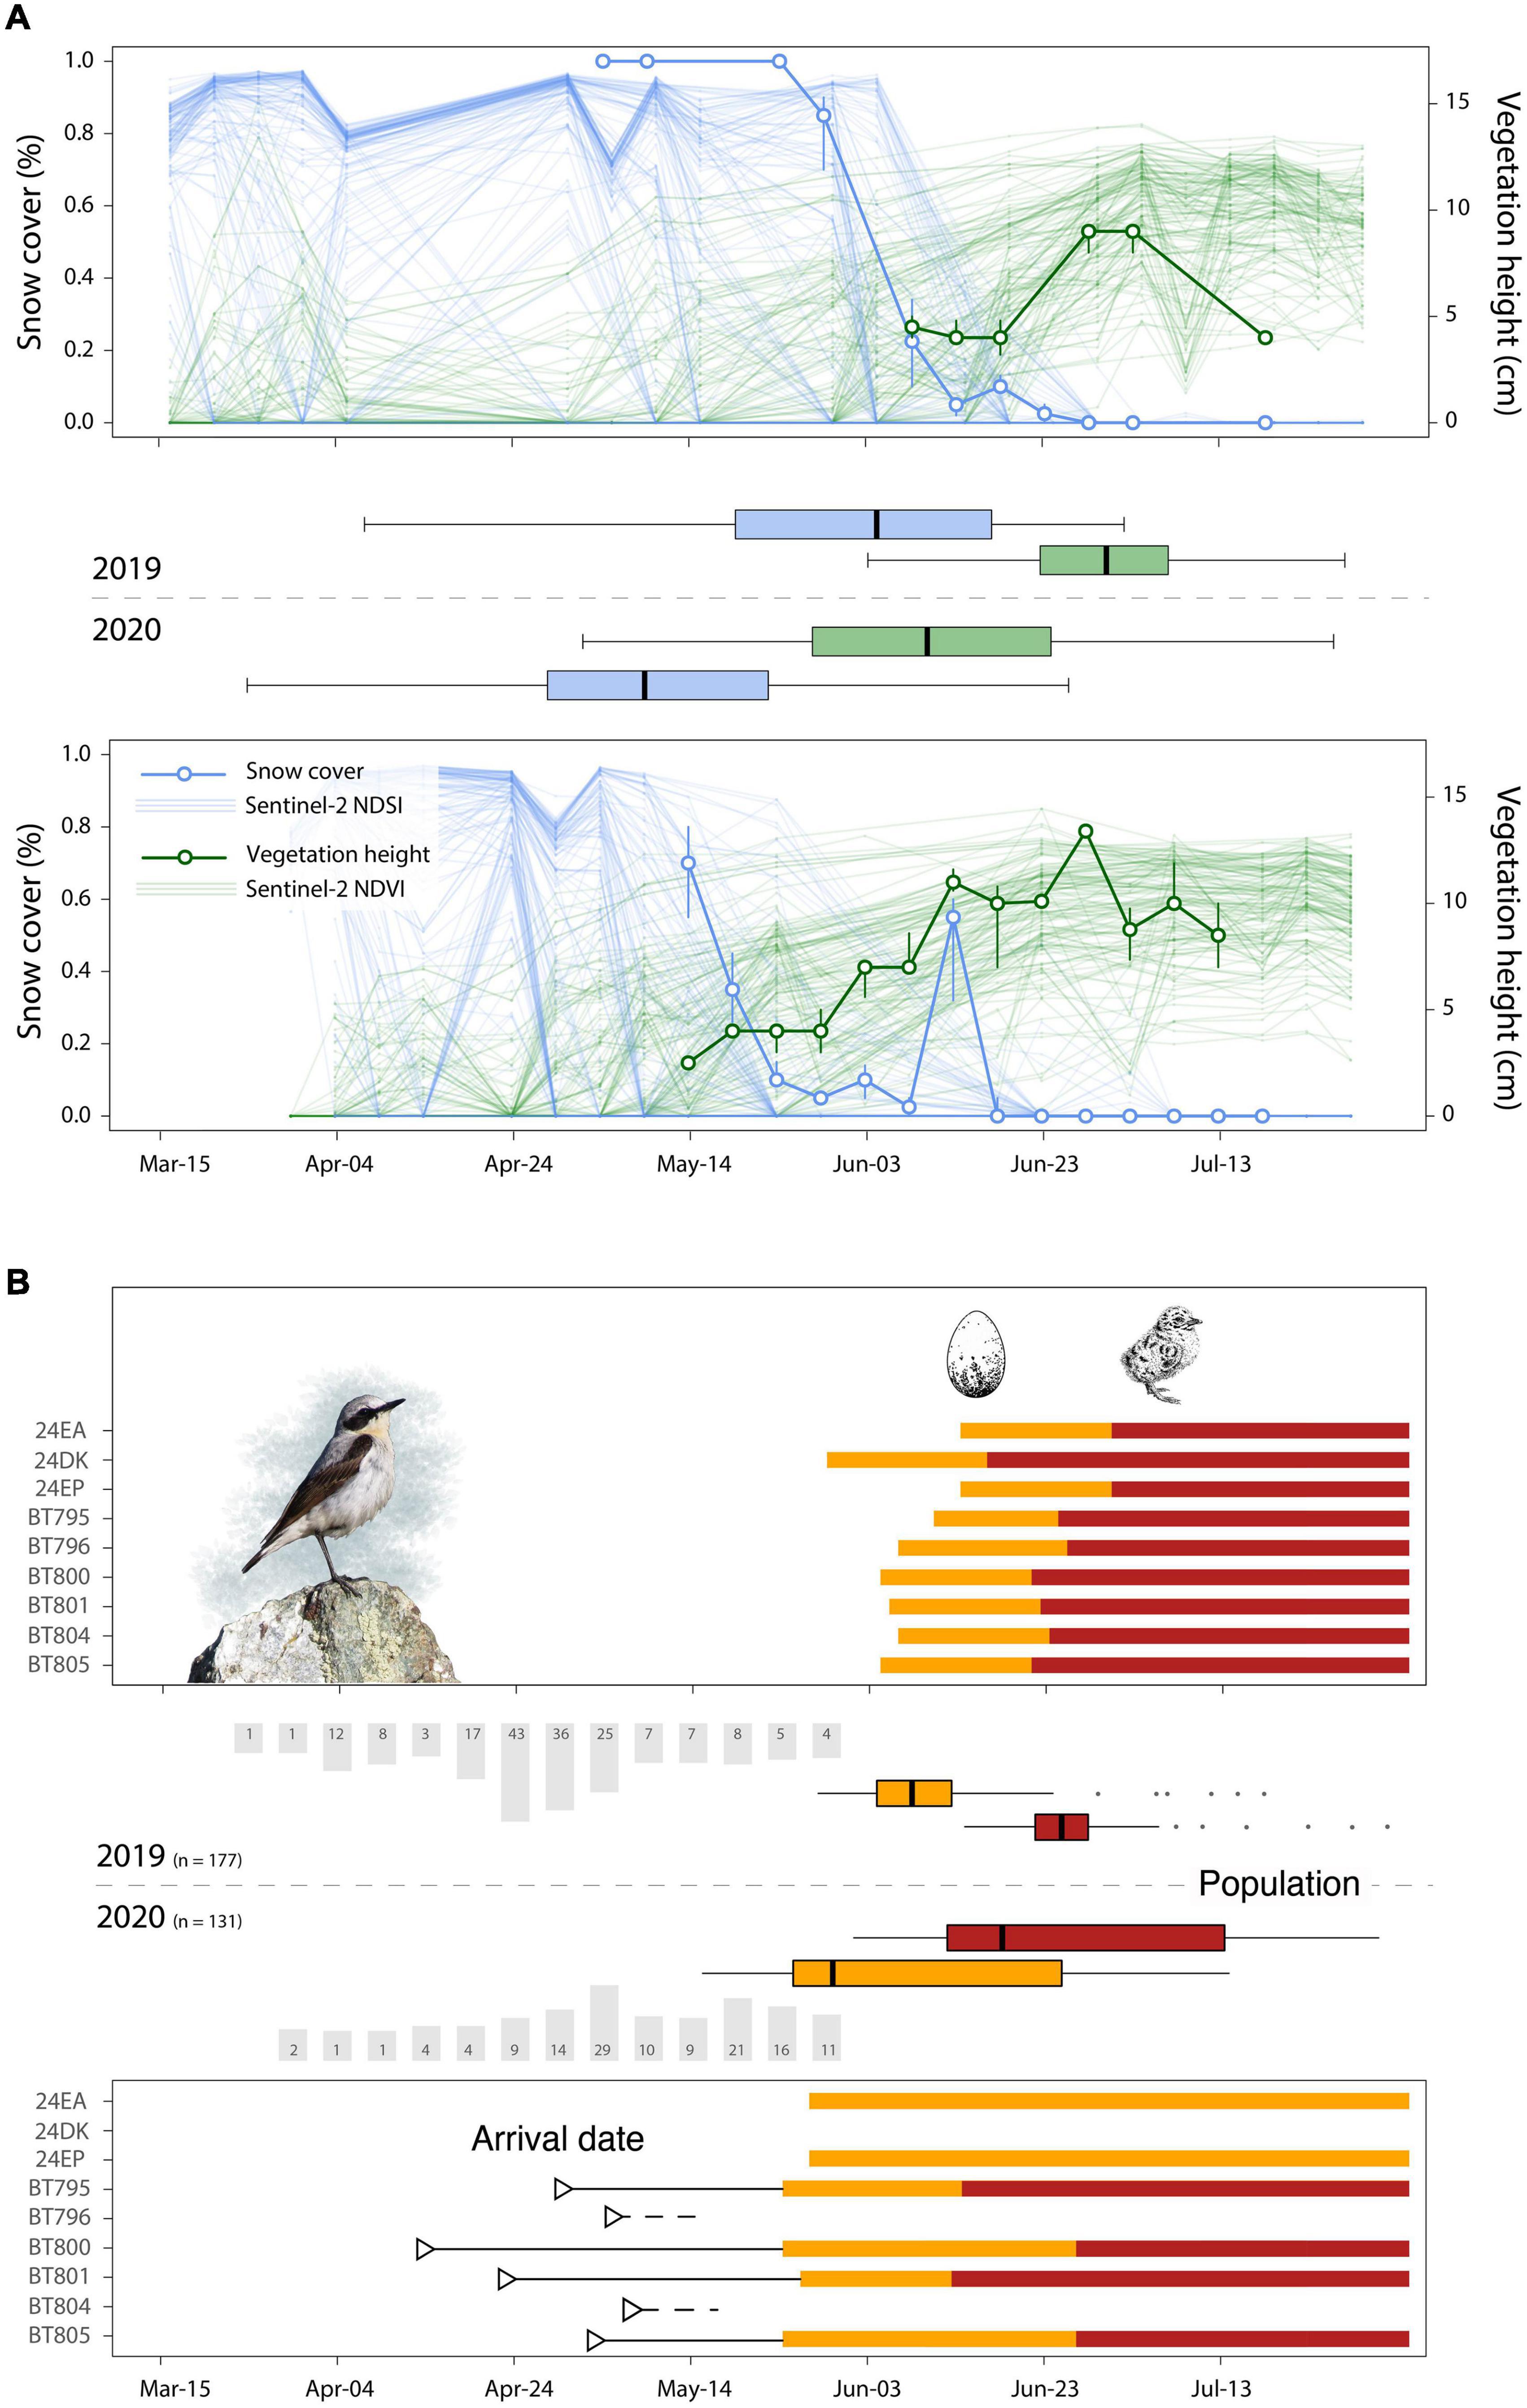
Figure 2. Arrival and lay dates at the Alpine breeding ground in relation to the spring green-up. (A) Snow cover and vegetation height data derived from territory, habitat (2019 and 2020) and nest monitoring (2020) (thick lines). Measures for the green-up derived from Sentinel-2 data (thin lines). Day of year when snow cover was less than 10% of the maximum and NDVI reached 80% of the amplitude are shown in boxplots. (B) Barplots (grey) show the no. of observations from ornitho.it in Piedmont and Aosta Valley from March to May. Triangles show arrival dates of the tagged individuals (n = 6, 2020). Rectangles represent lay (orange) and hatch (red) dates of nine tagged individuals (2019 and 2020), whereas the orange and red boxplots show the distribution of lay and hatch date across the whole population and season (nest monitoring 2019: n = 73, 2020: n = 48). Photo credit: Camille Mermillon.
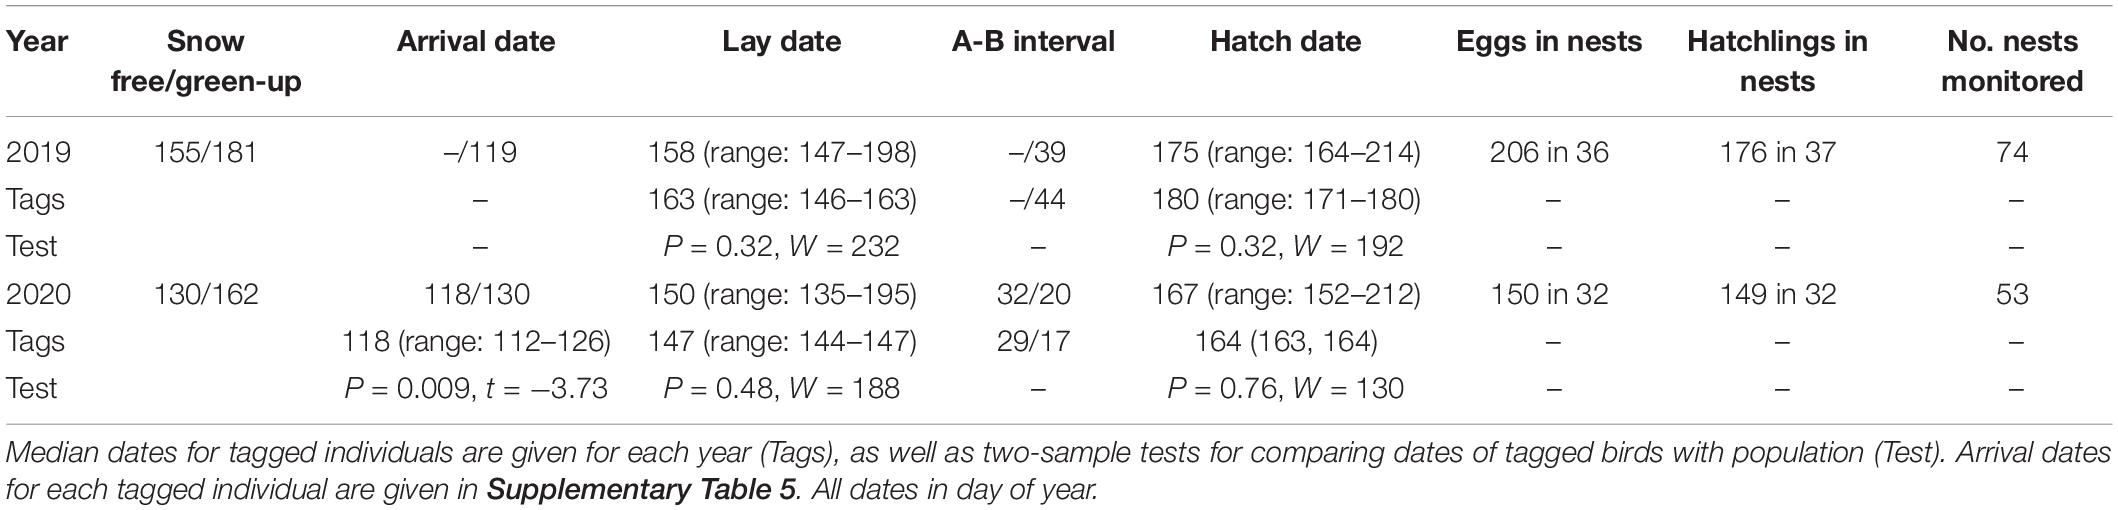
Table 1. Snow free and green-up date, arrival date (median date from geolocation/median date of citizen science observations), median lay date, difference in days (A-B interval), median hatch date and sample sizes for the breeding success models (no. of eggs, no. of hatchlings, no. of nests monitored).
Migration Schedule and Arrival Dates
In 2020, we retrieved 11 geolocators, of which nine contained sufficient data for further analyses (6 Migrate Technology, 3 SOI, of five males and four females). Fourteen tagged individuals were resighted (n = 35, return rate: 40%) of which 13 were recaptured. Two individuals lost the device. Nine adults of the control group were resighted (n = 16, return rate: 56%). The frequency of return rate between tagged and control groups was not significant (Fisher exact test, P = 0.126). Six tags recorded light levels for the full annual cycle. One tag stopped recording after arrival at the main wintering site (24EA). Two tags stopped recording during spring migration (24DK, 24EP). In total, we derived arrival dates at the breeding site from six tracked individuals in 2020 (Figure 2B and Table 1; see for details Supplementary Figures 1A–C and Supplementary Table 5).
Geolocation data reveals that in 2020 the arrival period at the breeding site for the six tagged individuals ranged from 13th April to 6th May 2020 (Figure 2B, Supplementary Table 5, and Supplementary Figure 1B). The three males (BT795, BT800, and BT801) were on average 13 days earlier than the three females (Figure 2B and Supplementary Table 6). Interannual variation in the timing of spring arrival/transition in the larger region of the study area (citizen science observations of wheatears) was high over the last 10 years (R2 < 0.001), with an average arrival in 2019 (median doy = 119) and a rather late arrival in 2020 (median doy = 130) (Figure 2B, Table 1, and Supplementary Figure 2). For 2020, observation dates differed from the geolocator arrival dates by 12 days, with earlier arrivals of tagged birds (median doy = 118, Table 1).
Individual tracks revealed, compared to further stopovers in the same year, relatively long stopovers (approx. 20–30 days) before crossing the Sahara desert in autumn and shorter stopovers (approx. 5–10 days) just before reaching the wintering sites (Figure 3; see for details Supplementary Table 3 and Supplementary Figures 1A,C). Spring migration appeared to be faster, with fewer and shorter stopovers (approx. 5–10 days) (Figure 3, Supplementary Table 3, and Supplementary Figures 1A–C) until the coast of the Mediterranean Sea and Sardinia was reached. Here, most (4 out of 6) wheatears stopped again for a longer period (approx. 15–20 days, Figure 3, Supplementary Table 3, and Supplementary Figure 1A). With larger sample sizes, it will be possible to link data on migration routes, stopovers and arrival times more strongly to the breeding season, so we will have a much better idea of how non-breeding and breeding seasons are linked.
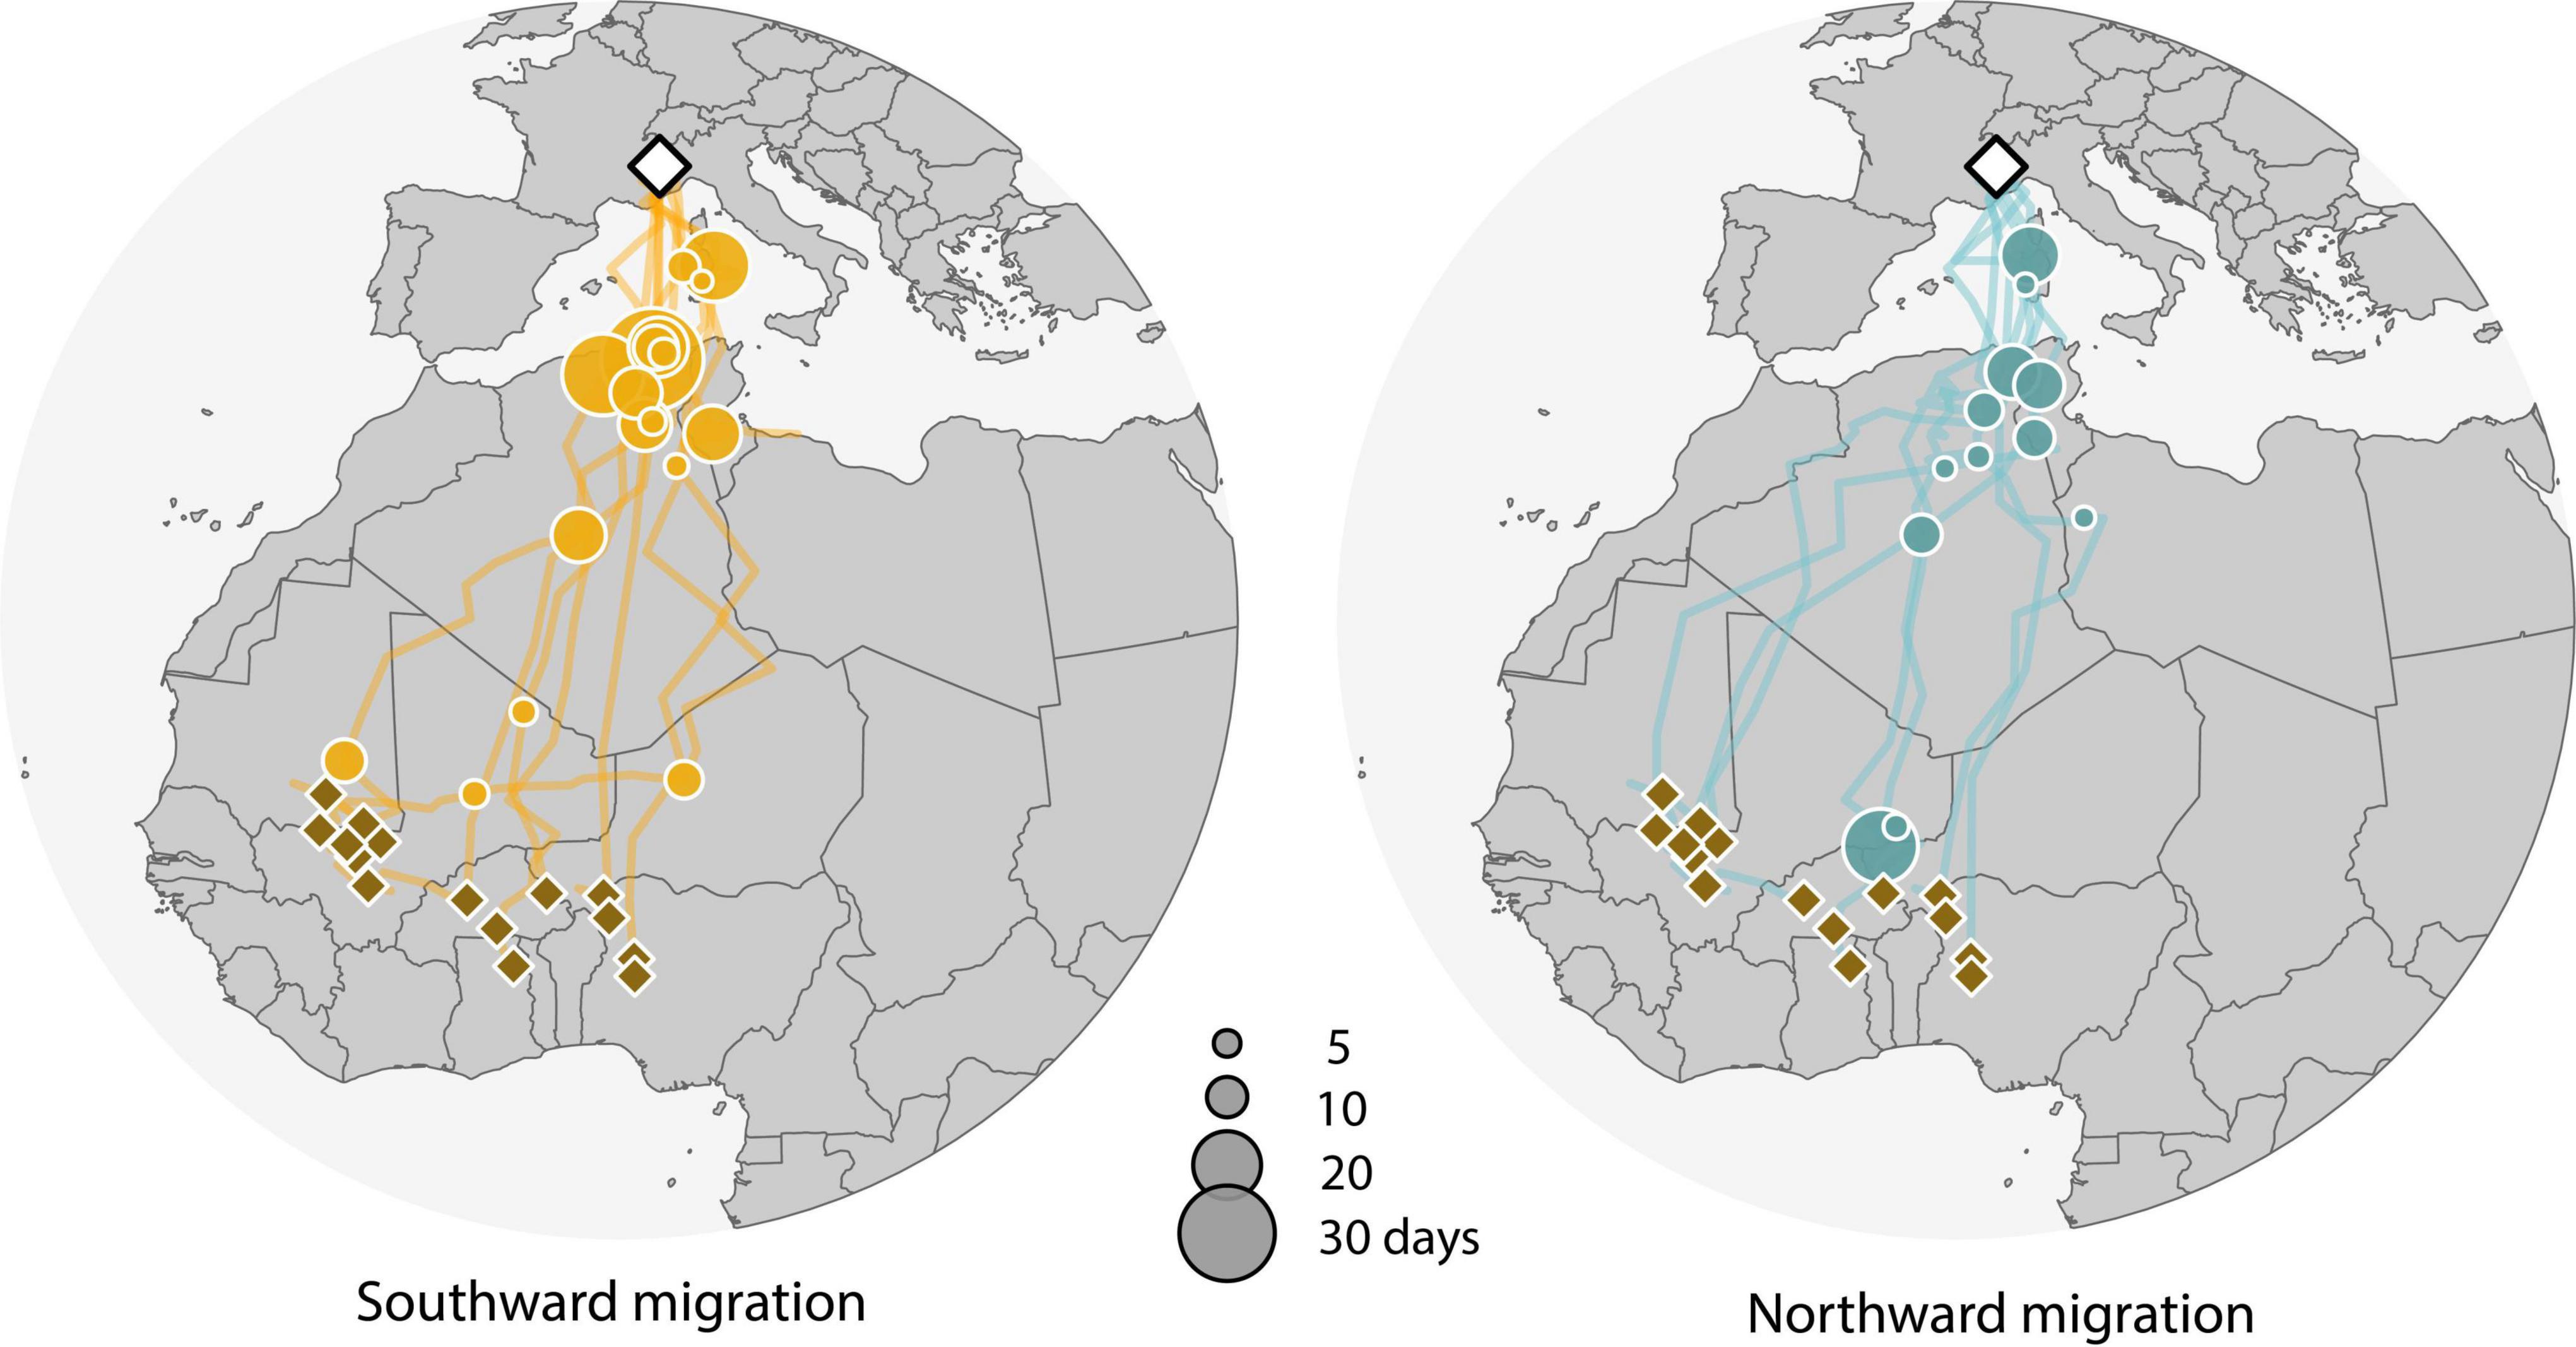
Figure 3. Most likely migration route estimates of individual Alpine breeding Northern wheatears. The breeding location is marked with a white diamond, stopover sites (>2 days) with an orange and blue circle, and wintering grounds with a brown diamond. Some individuals changed location and had more than one wintering ground. Southward migration tracks include nine, and northward migration tracks six, individuals. Map data downloaded from Natural Earth (naturalearthdata.com).
Breeding Phenology and Success
In 2019, we monitored 74 nests, of which 27 failed. In 2020, 53 nests were monitored, of which 23 failed. Nest failure was caused mainly by predation (23 nests in 2019, 15 in 2020), but also by nest abandonment or hatching failure (4 and 7, respectively). The cause of failure could not be identified in all cases (2 and 1, respectively). The first and last lay dates in 2019 were 28th May and July 18th, and in 2020 May 15th and July 14th. The number of monitored nests is assumed to be representative of this population, as they were located over an elevational gradient of 680 m which encompassed most of the elevation range of the species in the local area (attempts at higher or lower elevations are rare). According to results of the territory mapping (spanning an area of 1.15 km2), the study area holds 60 breeding pairs per km2 and includes a range of different habitats (mountain grassland, grazed shrubland, and scree).
In 2020, for five nests out of all 53 attempts, we had enough information to distinguish replacements from first attempts (identified by colour ringed adults). For 2019, only one out of 75 nests could be identified as a replacement nest. For the lay date and the interval between arrival and breeding (arrival-breeding interval) estimates, we therefore excluded the replacement nests.
Lay dates in 2020 were 8 days earlier on average, although there was much variation, compared to 2019 (Figure 2B; median doy 2019: 158, range: 147–198, n = 73; median doy 2020: 150, range: 135–195; N = 48). However, due to later arrival in 2020 (citizen science observations), the arrival-breeding interval was shorter in the early year of 2020 (20 days) than in 2019 (39 days) (Figure 2B and Table 1). The median hatch date was 8 days earlier in 2020 (median doy: 167) than in 2019 (median doy: 175), but in 2020, we observed greater variability in hatch dates (range: 152–212) than in 2019 (range: 164–214). The difference in days between the peak of the green-up (NDVI 80% of amplitude) and hatching was similar in both years (difference in median dates: −6 days in 2019, +5 days in 2020), but in 2020, hatching was 5 days behind the peak (Table 1 and Figure 2B). Breeding phenology dates of tagged individuals did not differ from those of the studied population, but sample sizes were low due to nest failures in 2020 (Table 1).
The success rates (a, b) were lower in 2020 than in 2019. Even though the difference in hatching success between years was negligible, the probability that a hatchling would fledge differed significantly and was lower in 2020 (Figure 4; see for sample size and model output Supplementary Table 7). The nest success model (c) showed a non-significant lower success rate in 2020 (Figure 4 and Supplementary Table 7).
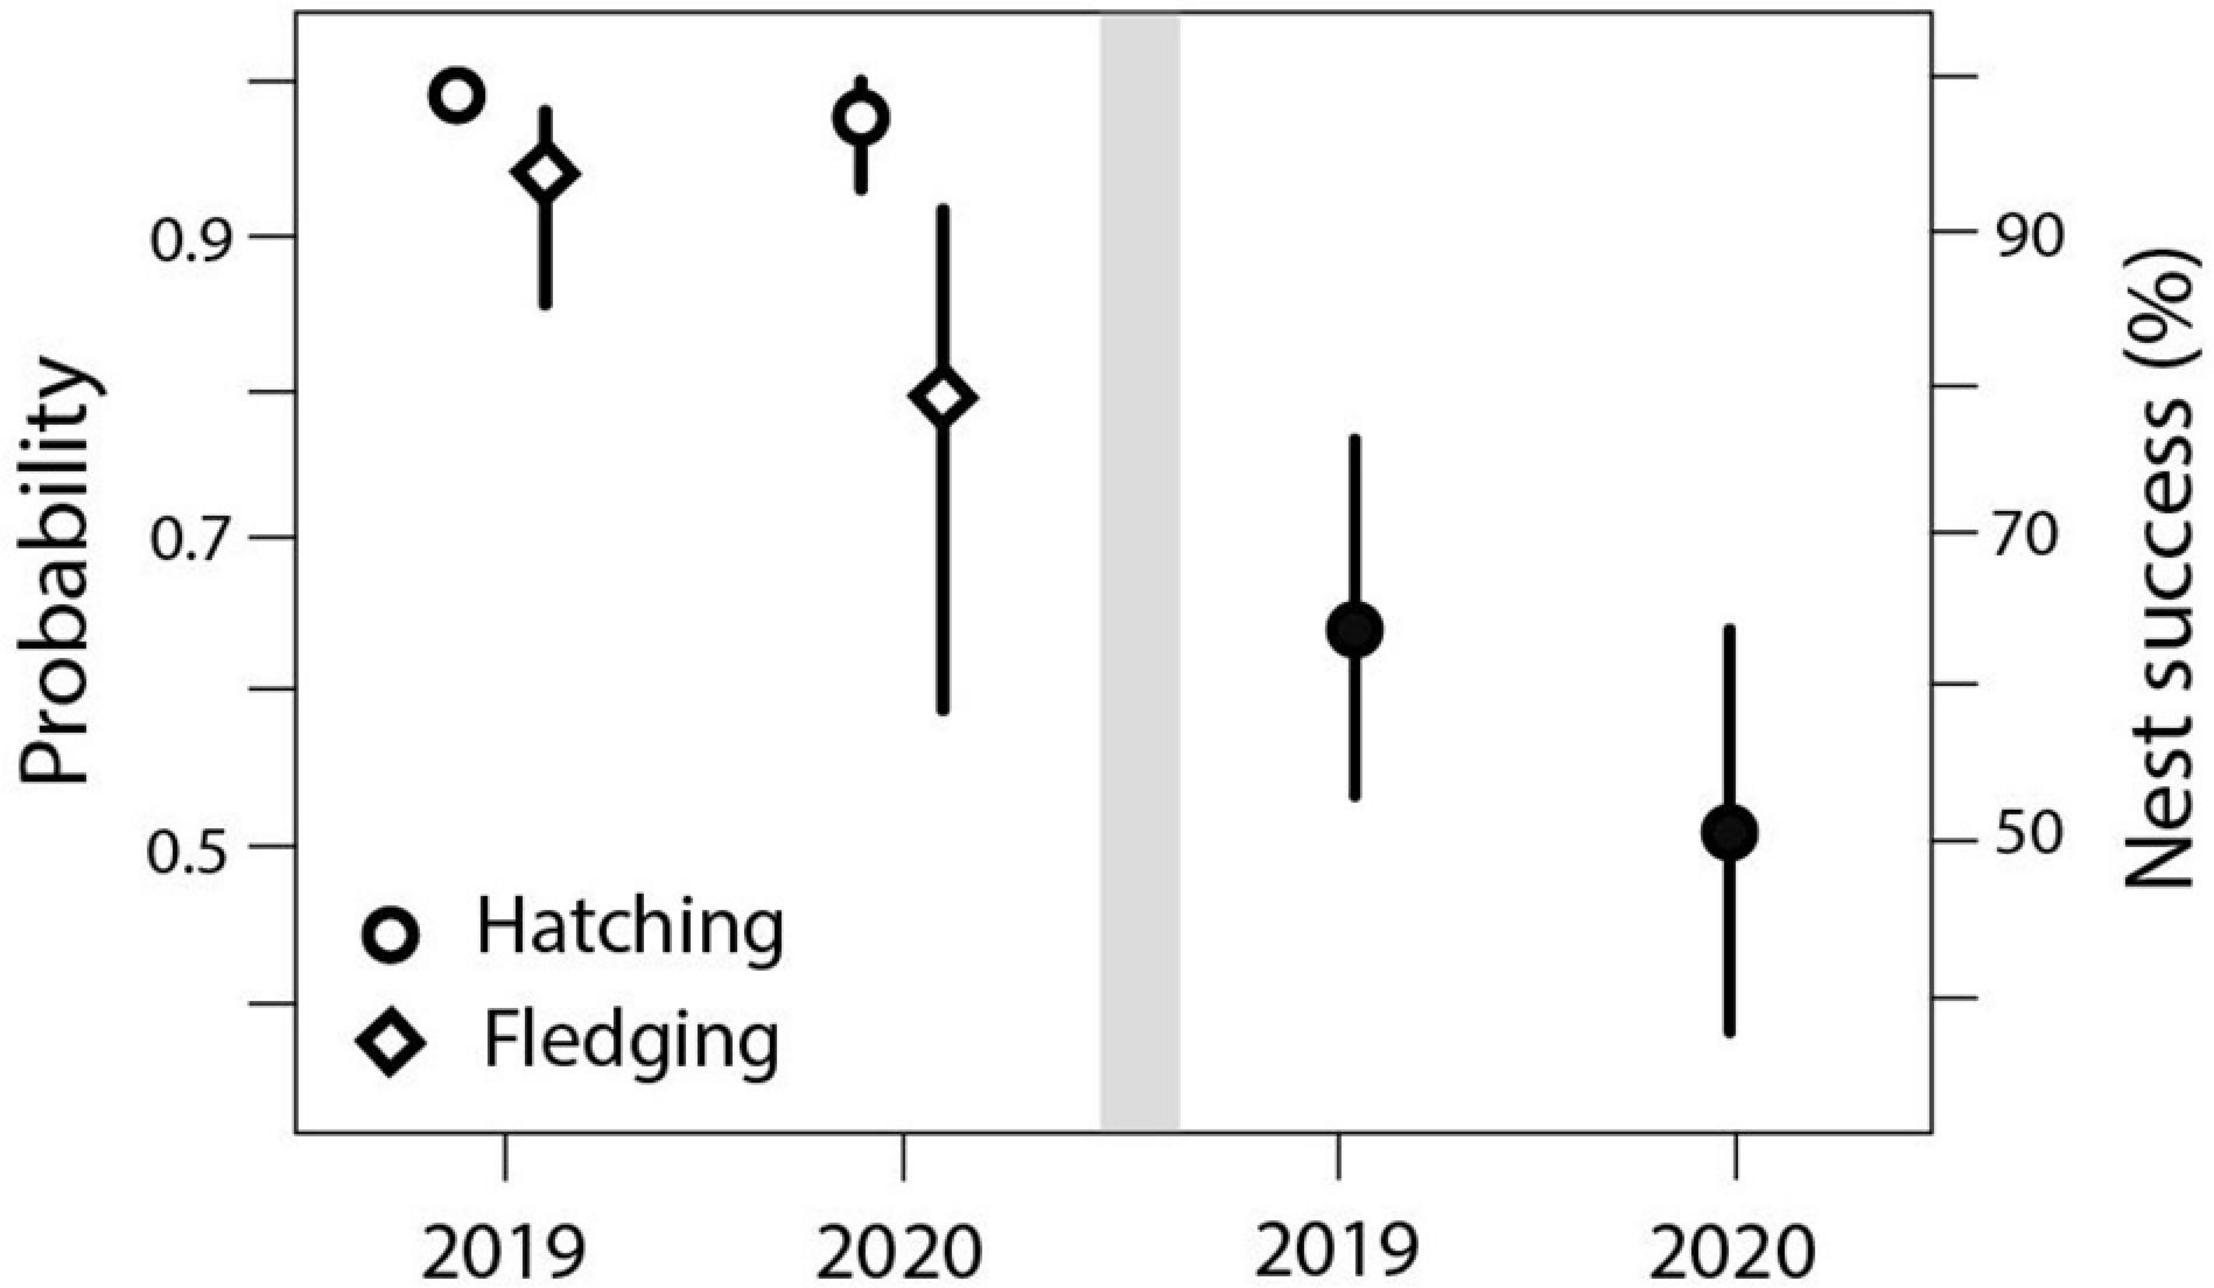
Figure 4. Left: Year effect on the probability of hatching and fledging (β = –1.4, 95% CrI: –2.870 to –0.018, P = 0.05). Hatching probability: 99% (0.98–1.00) in 2019 and 98% (0.93–0.99) in 2020. Fledging probability: 94% (0.85–0.98) in 2019 and 80% (0.59–0.92) in 2020, β = 2.38, 95% CrI: 1.754–2.996, P < 0.001, N = 683. Right: Year effect on nest success: 65% (0.54–0.76) in 2019 and 51% (0.38–0.64) in 2020, β = –0.139 (0.314–0.040), P = 0.12, N = 126.
Discussion
In long-distance migratory birds, phenological asynchronies are mainly attributed to the inability to advance spring arrival at the breeding grounds in synchrony with temporal shifts in resource availability (Møller et al., 2008; Saino et al., 2011; Reed et al., 2013; Mayor et al., 2017). While a growing number of studies have provided evidence for such asynchronies, reports on the impacts on fitness are less frequent (Visser et al., 2012). Despite having only 2 years of detailed data, we show that there was a significantly lower reproductive success in an exceptionally early spring, compared to an average year, in a bird population with a relatively short migration distance. Based on that and on previous findings, we predicted that wheatears breeding in the European Alps would arrive before the conditions became suitable for breeding and would therefore cope with an early spring by advancing their clutch initiation date. While our predictions regarding the arrival seem true (time buffer before laying), and clutch initiation was earlier in 2020 compared to the later spring in 2019, the advancement and thus the adjustment in the arrival-breeding interval was only about 8 days compared to the 3 weeks of the advancement in environmental conditions (Figure 2B).
Seasonal dynamics in the European Alps are changing; over recent decades, the snow cover period has become shorter resulting in an increase in primary productivity during the summer (Asam et al., 2018), and while we could not find a strong trend in the snow free dates within the very low resolution remote sensing data (MODIS NDSI) of the study area in the Western Alps in Piedmont, we found high interannual variations (Figure 1B), with an average year in 2019 and a very early snow free date in 2020. Direct observations and high-resolution remote sensing data (Sentinel-2) allowed a more detailed quantification of the differences between the 2 years, showing that snowmelt, crucial for clutch initiation (Liebezeit et al., 2014), and green-up of the vegetation, a proxy for food availability (Pettorelli et al., 2006; Marcelino et al., 2020), occurred about 3 weeks earlier in 2020 (Figure 2A). These yearly differences set the scene to compare key phenological events, such as arrival, clutch initiation, date of hatching and fledging, as well as breeding success as a measure of individual and overall population fitness.
Sightings of Northern Wheatears arriving in and passing through the Piedmont and Aosta valley during spring migration did not show a significant advance over the last decade (Supplementary Figure 2). However, individuals migrating through the area can come from various wintering sites in Africa and can vary even more strongly in their breeding destinations. Population-specific migration schedules, such as the later transition of northerly populations (Maggini et al., 2013), and potential trends may thus be hidden in the sightings dataset. In fact, wheatears from Greenland (Oenanthe oenanthe leucorhoa) have advanced their migration within the last three decades (Desaever and Bairlein, 2020) and previous studies on a northern lowland population of the wheatear have shown a continuous trend toward earlier arrival at breeding sites (Low et al., 2019). Constant effort trapping data of wheatears stopping-over on islands in the Mediterranean Sea has revealed a weak, but not significant, trend toward earlier passage during spring migration within the last 18 years (Maggini et al., 2020). The tracked individuals in this study provided exact arrival dates for 2020, showing that the studied population might arrive earlier than the major migration flow of wheatears in the region (Figure 2B), including birds of northerly populations (Maggini et al., 2013). This might be also true for 2019. However, citizen science data enabled us to compare the overall timing of arrival and transition of wheatears in the Western Alps for both years, showing that birds were recorded about 10 days later in 2020, which implies a further shortening of the arrival-breeding interval in 2020. There are known biases associated with citizen science data (e.g., Callaghan et al., 2017), including variations in spatial and temporal survey effort. In 2020, restrictions on people’s movement were imposed in March in Italy as a measure against the COVID-19 pandemic. However, there was no evidence that this had an impact on sampling effort – indeed, the total number of observations submitted to ornitho.it was slightly higher in 2020 (2019: n = 151.799, 2020: n = 168.180), and there was a negligible difference in the number of wheatear observations (2019: n = 101, 2020: n = 93). We cannot control for differences in spatial coverage, but most wheatears arrive first in lowlands and are detected commonly on agricultural fields, i.e., close to human populations and therefore potential observers. Furthermore, many contributors to ornito.it are park rangers who were allowed to carry out their normal field activities during the pandemic (E. Caprio, pers.comm.). We do not thus think there would be any effect of the fact that people could not travel far (i.e., into the mountains) in 2020 on the relative arrival dates estimated from citizen science data in the 2 years.
During spring migration, the tracked individuals stayed for relatively long periods at stopover sites in the Mediterranean region before making the final leg of their migration and arriving some weeks ahead of breeding (Figures 2B, 3). This finding is in line with tracking studies of the Swedish lowland population (Arlt et al., 2015). It has been suggested that these longer stopovers after the Sahara crossing are used to assess the environmental conditions in Europe and could therefore be used to buffer interannual variation in the timing of spring. Similar patterns were found in migratory Horned Larks (Eremophila alpestris) that performed long stopovers before reaching their high elevation breeding grounds (de Zwaan et al., 2019). In addition to a general adjustment in the arrival time, wheatears can adjust the arrival-breeding interval according to their arrival dates and spring progression (Low et al., 2019), strongly suggesting that, to some extent, wheatears are able to match their migration and breeding activities with local conditions and seasonally limited resources (Arlt and Pärt, 2017).
While hatching success was similar between the 2 years, the probability that a hatchling fledged, i.e., became independent, was significantly lower in the early year of 2020, leading to a reduced reproductive output in the population (Figure 4). While this might point toward phenological asynchrony, since the differences occurred during the most resource-demanding period and the peak in NDVI was missed by about a week, we can only speculate about the underlying mechanisms of hatchling mortality. To identify food shortages, data on chick growth and prey abundance (Barras et al., 2021) are necessary. However, phenological asynchronies may also have indirect effects. In our population, most nest failures were caused by predation. Increased begging behaviour due to food shortage could make nests more obvious to predators (Leech and Leonard, 1997). Furthermore, due to cold snaps, predators may have higher energy demands in early spring years, leading to greater predator activity and higher nest failure rate. Potentially colder days and even cold-snaps including snow and frost during the early season are more likely to occur in earlier years. This in general could negatively affect fitness via lower adult survival (Both, 2010) and reduced reproductive success (Kluen et al., 2011; Moreno et al., 2015; Bründl et al., 2020), even if migrants match the advanced spring conditions. We observed a generally higher variability in breeding phenology in the early spring of 2020, which was found also in McGuire et al. (2020), and a delayed hatching. Clutches experiencing a rainy season or severe weather events, such as snow storms, have a prolonged incubation period, exposing the nest to predators for a longer period at the same time, and generally higher failure rates (due to abandonment, hatch failure and predation) than clutches in a dry season (Rauter et al., 2002; Kluen et al., 2011; Higgot et al., 2020; Marcelino et al., 2020). Further explanations for variations in breeding success in alpine birds include annual variations in temperature, where success is lower in years with lower mean temperatures (Mingozzi et al., 2021), but also variations in weather-dependent resources (Barras et al., 2021) and local predation risk (Rauter et al., 2002).
Here, we have shown that breeding success was reduced in wheatears breeding in the European Alps in an exceptionally early year and despite timely arrival. We expected that the timely arrival, before the conditions allow the onset of breeding, would buffer the effects of early springs. However, the adjustment via shortening the arrival-breeding interval might not be flexible enough, as birds seem to be unable to advance egg laying sufficiently and thus may need to arrive even earlier to have the same arrival-breeding interval as in average years. The arrival-breeding interval is needed for recovering after migration, territory choice and defence, and mating (Kristensen et al., 2015; Nicolau et al., 2021). A shortening of this interval could be driving the observed lower fledging success. Arriving even earlier is limited by a trade-off between achieving good territories and matching the hatch date with the peak availability of resources on the one side, and a higher risk of potentially lowered survival for adults (Both, 2010) on the other. Similar limits in timing have been found in long-distance migrant Pied Flycatchers (Ficedula hypoleuca), which do not seem to be able to advance arrival at breeding sites to the same extent as the advance of spring, but they lay eggs earlier (Both and Visser, 2001). Nevertheless, the advance in lay dates still seems insufficient to track the advance of spring, which might be the result of the inflexibility in their migration onset, that is triggered by day length rather than temperature (Both and Visser, 2001), as well as migration speed (Fraser et al., 2013; Schmaljohann and Both, 2017). Within the same species, flexible adjustment to earlier springs seemed to be realised by shortening the arrival-breeding interval (Nicolau et al., 2021). McDermott and DeGroote (2017) analysed data on 17 migratory species, and found a positive relationship between earlier arrival at the breeding grounds and earlier breeding in four species, whereas in six species, the arrival-breeding interval shortened in warmer springs, as occurred in our Alpine wheatear population in 2020 (Figure 2B).
Although we cannot definitively identify the factors that drive the annual variations in breeding success, we can speculate that the reduced success in 2020 could potentially be related to environmental constraints (i.e., harsh weather conditions in early spring and cold snaps), to the mismatched peak in food resources, or to the shorter arrival-breeding interval, or a combination of these. Disentangling these effects will be an important challenge for ongoing and future long-term studies that combine phenological data, breeding performance, chick growth and predation, as earlier reproductive seasons are expected to become more frequent in the future, and climate change effects are known to be especially severe at high latitudes and elevations.
Data Availability Statement
Geolocator data including the raw light recordings, the annotated twilight files, the location estimates with credibility intervals, and the R code will be uploaded onto Movebank (www.movebank.org) upon paper acceptance. R code for Satellite data manipulation and Northern wheatear sightings can be accessed at https://github.com/slisovski/Sander_et_al_Analyses and will be uploaded to a public repository (Zotero) upon paper acceptance. Field observations including nest site occupation, clutch size, hatching, and fledging success as well as snow and vegetation monitoring data are available upon request.
Ethics Statement
The animal study was reviewed and approved by the ISPRA (Istituto Superiore per la Protezione e la Ricerca Ambientale, https://www.isprambiente.gov.it/it, protocol nos. 27303 and 2463) and Città di Torino (licence nos. 56.1433/2019 and 197.4765/2019), which includes the capture, ringing, and tagging (geolocators) of the study species in the protected area in the period 2019–2021.
Author Contributions
MS and DC initiated the study. MS, DC, CM, RA, SJ, CMM, and DR collected the data. MS, DC, and SL conceptualised the manuscript. MS and SL analysed the data and wrote the manuscript with significant input from DC. All authors approved the final version.
Funding
This project was funded by the Ph.D. scholarship (University of Turin) of MS. The German Ornithologists’ Society supported this project with a research grant (designated to MS) to fund the Migrate Technology Ltd., geolocators. SL acknowledges funding by the Geo.X Research Network for Geosciences in Berlin and Potsdam. We acknowledge support by the Open Access Publication Funds of Alfred Wegener Institute Helmholtz Center for Polar and Marine Research.
Conflict of Interest
The authors declare that the research was conducted in the absence of any commercial or financial relationships that could be construed as a potential conflict of interest.
Publisher’s Note
All claims expressed in this article are solely those of the authors and do not necessarily represent those of their affiliated organizations, or those of the publisher, the editors and the reviewers. Any product that may be evaluated in this article, or claim that may be made by its manufacturer, is not guaranteed or endorsed by the publisher.
Acknowledgments
Thanks are due to Chris Fiedler, Ursula Scuderi, and Liam Kelly who contributed to the environmental data collection, nest monitoring and ringing, including geolocator deployment and retrieval. We are also grateful to Heiko Schmaljohann for giving specific advice for fieldwork methods and trapping, to Michele Ottino and staff of the Ente di Gestione delle Aree Protette delle Alpi Cozie for logistical support, and Enrico Caprio and ornitho.it for providing the citizen science data. This work is a collaboration between the University of Turin and the Alfred Wegener Institute Helmholtz Centre for Polar and Marine Research in Potsdam, which was the hosting institute during data analysis and manuscript writing.
Supplementary Material
The Supplementary Material for this article can be found online at: https://www.frontiersin.org/articles/10.3389/fevo.2021.676506/full#supplementary-material
References
Alerstam, T., and Högstedt, G. (1980). Spring predictability and leapfrog migration. Ornis Scand. 11, 196–200. doi: 10.2307/3676124
Arlt, D., Olsson, P., Fox, J. W., Low, M., and Pärt, T. (2015). Prolonged stopover duration characterises migration strategy and constraints of a long-distance migrant songbird. Anim. Migr. 2, 47–62. doi: 10.1515/ami-2015-0002
Arlt, D., and Pärt, T. (2017). Marked reduction in demographic rates and reduced fitness advantage for early breeding is not linked to reduced thermal matching of breeding time. Ecol. Evol. 7, 10782–10796. doi: 10.1002/ece3.3603
Asam, S., Callegari, M., Matiu, M., Fiore, G., De Gregorio, L., Jacob, A., et al. (2018). Relationship between spatiotemporal variations of climate, snow cover and plant phenology over the Alps—an earth observation-based analysis. Remote Sens. 10:1757. doi: 10.3390/rs10111757
Bairlein, F., Norris, D. R., Nagel, R., Bulte, M., Voigt, C. C., Fox, J. W., et al. (2012). Cross-hemisphere migration of a 25 g songbird. Biol. Lett. 8, 505–507. doi: 10.1098/rsbl.2011.1223
Barras, A. G., Niffenegger, C. A., Candolfi, I., Hunziker, Y. A., and Arlettaz, R. (2021). Nestling diet and parental food provisioning in a declining mountain passerine reveal high sensitivity to climate change. J. Avian Biol. 52:e02649. doi: 10.1111/jav.02649
Bates, D., Maechler, M., and Bolker, B. (2007). lme4: Linear Mixed-Effects Models using “Eigen” and S4.
Both, C. (2010). “Food availability, mistiming and climatic change,” in Effects of Climate Change on Birds, eds A. P. Møller, W. Fiedler, and P. Berthold (Oxford: Oxford University Press), 129–147.
Both, C., Van Turnhout, C., Bijlsma, R., Siepel, H., Van Strien, A. J., and Foppen, R. P. B. (2010). Avian population consequences of climate change are most severe for long-distance migrants in seasonal habitats. Proc. R. Soc. B 277, 1259–1266. doi: 10.1098/rspb.2009.1525
Both, C., and Visser, M. E. (2001). Adjustment to climate change is constrained by arrival date in a long-distance migrant bird. Nature 411, 296–298. doi: 10.1038/35077063
Boyle, A. W., and Martin, K. (2015). The conservation value of high elevation habitats to North American migrant birds. Biol. Conserv. 192, 461–476. doi: 10.1016/j.biocon.2015.10.008
Bründl, A. C., Sallé, L., Lejeune, L. A., Sorato, E., Thiney, A. C., Chaine, A. S., et al. (2020). Elevational gradients as a model for understanding associations among temperature, breeding phenology and success. Front. Ecol. Evol. 8:563377. doi: 10.3389/fevo.2020.563377
Callaghan, C. T., Lyons, M. B., Martin, J. M., Major, R. E., and Kingsford, R. T. (2017). Assessing the reliability of avian biodiversity measures of urban greenspaces using eBird citizen science data. Avian Conserv. Ecol. 12:12. doi: 10.5751/ACE-01104-120212
Cramp, S. (1988). Handbook of the Birds of Europe, the Middle East and North Africa. The Birds of the Western Palearctic, Vol. 5. Oxford: Oxford University Press, 913.
de Zwaan, D., Drake, A., Greenwood, J. L., and Martin, K. (2020). Timing and intensity of weather events shape nestling development strategies in three alpine breeding songbirds. Front. Ecol. Evol. 8:570034. doi: 10.3389/fevo.2020.570034
de Zwaan, D. R., Wilson, S., Gow, E. A., and Martin, K. (2019). Sex-specific spatiotemporal variation and carry-over effects in a migratory alpine songbird. Front. Ecol. Evol. 7:285. doi: 10.3389/fevo.2019.00285
Desaever, R., and Bairlein, F. (2020). Earlier spring passage of ‘Greenlandic’ Northern wheatears Oenanthe o. leucorhoa on the coast of Belgium. Ringing Migr. 34, 1–5.
Doiron, M., Gauthier, G., and Lévesque, E. (2015). Trophic mismatch and its effects on the growth of young in an Arctic herbivore. Glob. Change Biol. 21, 4364–4376. doi: 10.1111/gcb.13057
Drusch, M., Del Bello, U., Carlier, S., Colin, O., Fernandez, V., Gascon, F., et al. (2012). Sentinel-2: ESA’s optical high-resolution mission for GMES operational services. Remote Sens. Environ. 120, 25–36.
Dunn, E. H., Hussell, D. J. T., Kren, J., and Zoerb, A. C. (2020). “Northern wheatear (Oenanthe oenanthe), version 2.0,” in Birds of the World, eds P. G. Rodewald, B. K. Keeney, and S. M. Billerman (Ithaca, NY: Cornell Lab of Ornithology).
Förschler, M. I., and Bairlein, F. (2011). Morphological shifts of the external flight apparatus across the range of a passerine (Northern Wheatear) with diverging migratory behaviour. PLoS One 6:e18732. doi: 10.1371/journal.pone.0018732
Fraser, K. C., Silverio, C., Kramer, P., Mickle, N., Aeppli, R., and Stutchbury, B. J. M. (2013). A trans-hemispheric migratory songbird does not advance spring schedules or increase migration rate in response to record-setting temperatures at breeding sites. PLoS One 8:e64587. doi: 10.1371/journal.pone.0064587
Gelman, A., and Hill, J. (2007). Data Analysis using Regression and Hierarchical/Multilevel Models. New York, NY: Cambridge University Press.
Gorelick, N., Hancher, M., Dixon, M., Ilyushchenko, S., Thau, D., and Moore, R. (2017). Google Earth Engine: planetary-scale geospatial analysis for everyone. Remote Sens. Environ. 202, 18–27. doi: 10.1016/j.rse.2017.06.031
Hall, D. K., Salomonson, V. V., and Riggs, G. A. (2016). MODIS/Terra Snow Cover Daily L3 Global 500m Grid. Boulder, CO: NASA National Snow and Ice Data Center Distributed Active Archive Center.
Higgot, C., Evans, K., and Hatchwell, B. J. (2020). Incubation in a temperate passerine: do environmental conditions affect incubation period duration and hatching success? Front. Ecol. Evol. 8:542179. doi: 10.3389/fevo.2020.542179
Jabis, M. D., Winkler, D. E., and Kueppers, L. M. (2020). Warming acts through earlier snowmelt to advance but not extend alpine community flowering. Ecology 101:e03108.
Jähnig, S., Alba, R., Vallino, C., Rosselli, D., Pittarello, M., Rolando, A., et al. (2018). The contribution of broadscale and finescale habitat structure to the distribution and diversity of birds in an Alpine forest-shrub ecotone. J. Ornithol. 159, 747–759. doi: 10.1007/s10336-018-1549-9
Kluen, E., de Heij, M. E., and Brommer, J. E. (2011). Adjusting the timing of hatching to changing environmental conditions has fitness costs in blue tits. Behav. Ecol. Sociobiol. 65, 2091–2103. doi: 10.1007/s00265-011-1218-y
Koleèek, J., Adamík, P., and Reif, J. (2020). Shifts in migration phenology under climate change: temperature vs. abundance effects in birds. Clim. Change 159, 177–194. doi: 10.1007/s10584-020-02668-8
Korner-Nievergelt, F., Roth, T., von Felten, S., Guelat, J., Almasi, B., and Korner-Nievergelt, P. (2015). Bayesian Data Analysis in Ecology Using Linear Models with R, BUGS, and Stan. London: Elsevier.
Korner-Nievergelt, F., Roth, T., von Felten, S., Guelat, J., Almasi, B., and Korner-Nievergelt, P. (2019). blmeco: Data Files and Functions Accompanying the Book “Bayesian Data Analysis in Ecology Using Linear Models with R, BUGS, and Stan”.
Kristensen, N. P., Johansson, J., Ripa, J., and Jonzén, N. (2015). Phenology of two interdependent traits in migratory birds in response to climate change. Proc. R. Soc. B Biol. Sci. 282:20150288. doi: 10.1098/rspb.2015.0288
La Sorte, F. A., and Graham, C. H. (2020). Phenological synchronization of seasonal bird migration with vegetation greenness across dietary guilds. J. Anim. Ecol. 90, 343–355. doi: 10.1111/1365-2656.13345
Leech, S. M., and Leonard, M. L. (1997). Begging and the risk of predation in nestling birds. Behav. Ecol. 8, 644–646. doi: 10.1093/beheco/8.6.644
Lehikoinen, A., Brotons, L., Calladine, J., Campedelli, T., Escandell, V., Flousek, J., et al. (2018). Declining population trends of European mountain birds. Glob. Change Biol. 25, 577–588. doi: 10.1111/gcb.14522
Liebezeit, J. R., Gurney, K. E. B., Budde, M., Zack, S., and Ward, D. (2014). Phenological advancement in arctic bird species: relative importance of snow melt and ecological factors. Polar Biol. 37, 1309–1320. doi: 10.1007/s00300-014-1522-x
Lisovski, S., Bauer, S., Briedis, M., Davidson, S. C., Dhanjal-Adams, K. L., Hallworth, M. T., et al. (2020a). Light-level geolocator analyses: a user’s guide. J. Anim. Ecol. 89, 221–236. doi: 10.1111/1365-2656.13036
Lisovski, S., Gosbell, K., Minton, C., and Klaassen, M. (2020b). Migration strategy as an indicator of resilience to change in two shorebird species with contrasting population trajectories. J. Anim. Ecol. 1–10. doi: 10.1111/1365-2656.13393 [Epub ahead of print].
Lisovski, S., Ramenofsky, M., and Wingfield, J. C. (2017). Defining the degree of seasonality and its significance for future research. Integr. Comp. Biol. 57, 934–942. doi: 10.1093/icb/icx040
Lisovski, S., Schmaljohann, H., Bridge, E. S., Bauer, S., Farnsworth, A., Gauthreaux, S. A., et al. (2018). Inherent limits of light-level geolocation may lead to over-interpretation. Curr. Biol. 28, R99–R100.
Lisovski, S., Sumner, M. D., and Wotherspoon, S. J. (2015). TwGeos: Basic Data Processing for Light Based Geolocation Archival Tags.
Low, M., Arlt, D., Knape, J., Pärt, T., and Öberg, M. (2019). Factors influencing plasticity in the arrival-breeding interval in a migratory species reacting to climate change. Ecol. Evol. 9, 12291–12301. doi: 10.1002/ece3.5716
MacDonald, E. C., Camfield, A. F., Jankowski, J. E., and Martin, K. (2013). Extended incubation recesses by alpine-breeding Horned Larks: a strategy for dealing with inclement weather? Extended recesses by Horned Larks. J. Field Ornithol. 84, 58–68. doi: 10.1111/jofo.12006
Maggini, I., Cardinale, M., Sundberg, J. H., Spina, F., and Fusani, L. (2020). Recent phenological shifts of migratory birds at a Mediterranean spring stopover site: species wintering in the Sahel advance passage more than tropical winterers. PLoS One 15:e0239489. doi: 10.1371/journal.pone.0239489
Maggini, I., Spina, F., Voigt, C. C., Ferri, A., and Bairlein, F. (2013). Differential migration and body condition in Northern wheatears (Oenanthe oenanthe) at a Mediterranean spring stopover site. J. Ornithol. 154, 321–328. doi: 10.1007/s10336-012-0896-1
Marcelino, J., Silva, J. P., Gameiro, J., Silva, A., Rego, F. C., Moreira, F., et al. (2020). Extreme events are more likely to affect the breeding success of lesser kestrels than average climate change. Sci. Rep. 10:7207.
Martin, K., and Wiebe, K. L. (2004). Coping mechanisms of alpine and arctic breeding birds: extreme weather and limitations to reproductive resilience. Integr. Comp. Biol. 44, 177–185. doi: 10.1093/icb/44.2.177
Martin, K., Wilson, S., MacDonald, E. C., Camfield, A. F., Martin, M., and Trefry, S. A. (2017). Effects of severe weather on reproduction for sympatric songbirds in an alpine environment: interactions of climate extremes influence nesting success. Auk 134, 696–709. doi: 10.1642/auk-16-271.1
Mayor, S. J., Guralnick, R. P., Tingley, M. W., Otegui, J., Withey, J. C., Elmendorf, S. C., et al. (2017). Increasing phenological asynchrony between spring green-up and arrival of migratory birds. Sci. Rep. 7:1902.
McDermott, M. E., and DeGroote, L. W. (2017). Linking phenological events in migratory passerines with a changing climate: 50 years in the Laurel Highlands of Pennsylvania. PLoS One 12:e0174247. doi: 10.1371/journal.pone.0174247
McGuire, R. L., Lanctot, R. B., Saalfeld, S. T., Ruthrauff, D. R., and Liebezeit, J. R. (2020). Shorebird reproductive response to exceptionally early and late springs varies across sites in Arctic Alaska. Front. Ecol. Evol. 8:577652. doi: 10.3389/fevo.2020.577652
Migliavacca, M., Cremonese, E., Colombo, R., Busetto, L., Galvagno, M., Ganis, L., et al. (2008). European larch phenology in the Alps: can we grasp the role of ecological factors by combining field observations and inverse modelling? Int. J. Biometeorol. 52, 587–605. doi: 10.1007/s00484-008-0152-9
Mingozzi, T., Storino, P., Venuto, G., Massolo, A., and Tavecchia, G. (2021). Climate warming induced a stretch of the breeding season and an increase of second clutches in a passerine breeding at its altitudinal limits. Curr. Zool. zoab029. doi: 10.1093/cz/zoab029
Møller, A. P., Fiedler, W., and Berthold, P. (2010). Effects of Climate Change on Birds. Oxford: Oxford University Press, 90–91.
Møller, A. P., Rubolini, D., and Lehikoinen, E. (2008). Populations of migratory bird species that did not show a phenological response to climate change are declining. Proc. Natl. Acad. Sci. U.S.A. 105, 16195–16200. doi: 10.1073/pnas.0803825105
Moreno, J., González-Braojos, S., and Ruiz-de-Castañeda, R. (2015). A spring cold snap is followed by an extreme reproductive failure event in a mountain population of pied flycatchers Ficedula hypoleuca. Bird Study 62, 466–473. doi: 10.1080/00063657.2015.1073680
Nicolau, P. G., Burgess, M. D., Marques, T. A., Baillie, S. R., Moran, N. J., Leech, D. I., et al. (2021). Latitudinal variation in arrival and breeding phenology of the pied flycatcher Ficedula hypoleuca using large-scale citizen science data. J. Avian Biol. 52:jav.02646. doi: 10.1111/jav.02646
Oyler, J. W., Dobrowski, S. Z., Ballantyne, A. P., Klene, A. E., and Running, S. W. (2015). Artificial amplification of warming trends across the mountains of the western United States. Geophys. Res. Lett. 42, 153–161. doi: 10.1002/2014gl062803
Parmesan, C., and Yohe, G. (2003). A globally coherent fingerprint of climate change impacts across natural systems. Nature 421, 37–42. doi: 10.1038/nature01286
Pettorelli, N., Gaillard, J.-M., Mysterud, A., Duncan, P., Stenseth, N. C., Delorme, D., et al. (2006). Using a proxy of plant productivity (NDVI) to find key periods for animal performance: the case of roe deer. Oikos 112, 565–572. doi: 10.1111/j.0030-1299.2006.14447.x
Post, E., and Forchhammer, M. C. (2007). Climate change reduces reproductive success of an Arctic herbivore through trophic mismatch. Philos. Trans. R. Soc. B Biol. Sci. 363, 2369–2375.
Rappole, J. H., and Tripton, A. R. (1991). New harness design for attachment of radio transmitters to small passerines. J. Field Ornithol. 62, 335–337.
Rauter, C. M., Reyer, H.-U., and Bollmann, K. (2002). Selection through predation, snowfall and microclimate on nest-site preferences in the water pipit Anthus spinoletta. IBIS 144, 433–444. doi: 10.1046/j.1474-919x.2002.00013.x
Reed, T. E., Jenouvrier, S., and Visser, M. E. (2013). Phenological mismatch strongly affects individual fitness but not population demography in a woodland passerine. J. Anim. Ecol. 82, 131–144. doi: 10.1111/j.1365-2656.2012.02020.x
Resano-Mayor, J., Korner-Nievergelt, F., Vignali, S., Horrenberger, N., Barras, A.G., Braunisch, V., et al. (2019). Snow cover phenology is the main driver of foraging habitat selection for a high-alpine passerine during breeding: implications for species persistence in the face of climate change. Biodivers. Conserv. 28, 2669–2685. doi: 10.1007/s10531-019-01786-9
Saino, N., Ambrosini, R., Rubolini, D., von Hardenberg, J., Provenzale, A., Hüppop, K., et al. (2011). Climate warming, ecological mismatch at arrival and population decline in migratory birds. Proc. R. Soc. B Biol. Sci. 278, 835–842. doi: 10.1098/rspb.2010.1778
Sanderson, F. J., Donald, P. F., Pain, D. J., Burfield, I. J., and van Bommel, F. P. J. (2006). Long-term population declines in Afro-Palearctic migrant birds. Biol. Conserv. 131, 93–105. doi: 10.1016/j.biocon.2006.02.008
Schmaljohann, H., and Both, C. (2017). The limits of modifying migration speed to adjust to climate change. Nat. Clim. Change 7, 573–576. doi: 10.1038/nclimate3336
Schmaljohann, H., Buchmann, M., Fox, J. W., and Bairlein, F. (2012). Tracking migration routes and the annual cycle of a trans-Sahara songbird migrant. Behav. Ecol. Sociobiol. 66, 915–922. doi: 10.1007/s00265-012-1340-5
Schmaljohann, H., Meier, C., Arlt, D., Bairlein, F., van Oosten, H., Morbey, Y. E., et al. (2016). Proximate causes of avian protandry differ between subspecies with contrasting migration challenges. Behav. Ecol. 27, 321–331. doi: 10.1093/beheco/arv160
Scridel, D., Brambilla, M., Martin, K., Lehikoinen, A., Iemma, A., Matteo, A., et al. (2018). A review and meta-analysis of the effects of climate change on Holarctic mountain and upland bird populations. Ibis 160, 489–515. doi: 10.1111/ibi.12585
Shipley, J. R., Twining, C. W., Taff, C. C., Vitousek, M. N., Flack, A., and Winkler, D. W. (2020). Birds advancing lay dates with warming springs face greater risk of chick mortality. Proc. Natl. Acad. Sci. U.S.A. 117, 25590–25594. doi: 10.1073/pnas.2009864117
Südbeck, P., and Weick, F. (2005). Methodenstandards zur Erfassung der Brutvögel Deutschlands. Radolfzell: Mugler.
Vickery, J. A., Ewing, S. R., Smith, K. W., Pain, D. J., Bairlein, F., Škorpilová, J., et al. (2014). The decline of Afro-Palaearctic migrants and an assessment of potential causes. IBIS 156, 1–22. doi: 10.1111/ibi.12118
Visser, M. E., and Gienapp, P. (2019). Evolutionary and demographic consequences of phenological mismatches. Nat. Ecol. Evol. 3, 879–885. doi: 10.1038/s41559-019-0880-8
Visser, M. E., Holleman, L. J. M., and Gienapp, P. (2006). Shifts in caterpillar biomass phenology due to climate change and its impact on the breeding biology of an insectivorous bird. Oecologia 147, 164—-172.
Visser, M. E., te Marvelde, L., and Lof, M. E. (2012). Adaptive phenological mismatches of birds and their food in a warming world. J. Ornithol. 153, 75–84. doi: 10.1007/s10336-011-0770-6
Keywords: arrival, laying, interval, light-level geolocation, alpine, citizen science, remote sensing
Citation: Sander MM, Chamberlain D, Mermillon C, Alba R, Jähnig S, Rosselli D, Meier CM and Lisovski S (2021) Early Breeding Conditions Followed by Reduced Breeding Success Despite Timely Arrival in an Alpine Migratory Songbird. Front. Ecol. Evol. 9:676506. doi: 10.3389/fevo.2021.676506
Received: 05 March 2021; Accepted: 05 August 2021;
Published: 01 September 2021.
Edited by:
Claire Loiseau, Research Center in Biodiversity and Genetic Resources, PortugalReviewed by:
Ivan Maggini, University of Veterinary Medicine Vienna, AustriaKevin C. Fraser, University of Manitoba, Canada
Copyright © 2021 Sander, Chamberlain, Mermillon, Alba, Jähnig, Rosselli, Meier and Lisovski. This is an open-access article distributed under the terms of the Creative Commons Attribution License (CC BY). The use, distribution or reproduction in other forums is permitted, provided the original author(s) and the copyright owner(s) are credited and that the original publication in this journal is cited, in accordance with accepted academic practice. No use, distribution or reproduction is permitted which does not comply with these terms.
*Correspondence: Martha Maria Sander, marthamaria.sander@unito.it; Simeon Lisovski, simeon.lisovski@awi.de