Predictions of Disease Risk in Space and Time Based on the Thermal Physiology of an Amphibian Host-Pathogen Interaction
 Julia M. Sonn1
  Warren P. Porter
 Paul D. Mathewson
 Corinne L. Richards-Zawacki
- 1Department of Ecology and Evolutionary Biology, Tulane University, New Orleans, LA, United States
- 2Department of Integrative Biology, University of Wisconsin–Madison, Madison, WI, United States
- 3Department of Biological Sciences, University of Pittsburgh, Pittsburgh, PE, United States
Emerging infectious diseases have been responsible for declines and extinctions in a growing number of species. Predicting disease variables like infection prevalence and mortality and how they vary in space and time will be critical to understanding how host-pathogen dynamics play out in natural environments and will help to inform management actions. The pandemic disease chytridiomycosis, caused by the fungal pathogen, Batrachochytrium dendrobatidis (Bd), has been implicated in declines in hundreds of amphibian species worldwide. We used field-collected measurements of host body temperatures and other physiological parameters to develop a mechanistic model of disease risk in a declining amphibian, the Northern cricket frog (Acris crepitans). We first used a biophysical model to predict host body temperatures across the species range in the eastern United States. We then used empirically derived relationships between host body temperature, infection prevalence and survival to predict where and when the risk of Bd-related declines is greatest. Our model predicts that pathogen prevalence is greatest, and survival of infected A. crepitans frogs is lowest, just prior to breeding when host body temperatures are low. Taken together, these results suggest that Bd poses the greatest threat to short-lived A. crepitans populations in the northern part of this host’s range and that disease-related recruitment failure may be common. Furthermore, our study demonstrates the utility of mechanistic modeling approaches for predicting disease outbreaks and dynamics in animal hosts.
Introduction
Emerging infectious diseases threaten animals, plants and humans alike. Fungal pathogens in particular have been responsible for an increasing number of declines and extinctions of wildlife (Fisher et al., 2012). For example, epidemics of the fungal pathogen Aspergillus sydowii, which causes the disease aspergillosis and is widespread throughout the Caribbean, can cause up to 90% mortality in coral populations (Bruno et al., 2011). The pandemic amphibian disease chytridiomycosis, caused by another fungal pathogen, Batrachochytrium dendrobatidis (Bd), has been implicated in global declines in hundreds of amphibian species (Wake and Vredenburg, 2008; Murray et al., 2013; Scheele et al., 2019). Interactions between climate change and fungal disease have been implicated in the declines of both corals (Ruiz-Moreno et al., 2012) and amphibians (Lips et al., 2008; Cohen et al., 2018). Understanding how variation in host body temperatures impacts fungal diseases may, thus, be helpful in mitigating these and other emerging infectious diseases of wildlife. Here we describe a mechanistic approach to predicting wildlife disease dynamics and illustrate its potential using the example of Northern cricket frogs (Acris crepitans), a declining North American host species susceptible to chytridiomycosis.
Body temperature profoundly affects the ecology of ectotherm hosts by influencing both their physiology and behavior (Huey and Stevenson, 1979). Temperature can also impact the ectotherm immune system. For the amphibian-Bd interaction, which takes place in/on the host’s skin, body temperature has been shown to modulate the antifungal properties of the skin microbiome (Robak and Richards-Zawacki, 2018) and the production of skin antimicrobial peptides (Robak et al., 2019), which are part of the innate immune response to Bd. For A. crepitans, the impact of body temperature on Bd infections has been documented in the lab (Sonn et al., 2017, 2019) and in the field (Sonn et al., 2019), with Bd-exposed frogs showing greater infection prevalence, load and mortality at lower temperatures. Interestingly, Sonn et al. (2017) showed that the temperature at which the Bd pathogen grows best in culture (21 - 23°C) is the one where infected A. crepitans have the greatest survival, underscoring the importance of considering host (and not just pathogen) physiology in predicting disease risk.
In natural environments, animal hosts may select a variety of microhabitats to meet their thermal needs, and the body temperatures that result may have a profound effect on the prevalence and outcome of infection. For example, during an outbreak of chytridiomycosis in a wild population of Panamanian golden frogs (Atelopus zeteki), odds of infection was lower in individuals that selected warmer temperatures than pre-infection averages and the number of animals selecting these warmer-than-usual temperatures increased during the epidemic (Richards-Zawacki, 2010). This suggests that raising body temperature could be therapeutic for Bd-infected frogs (but see Sauer et al., 2018) and underscores the importance of understanding the body temperatures attainable by ectotherm hosts and how they relate to those where pathogens can be best combatted.
Models can be useful tools for predicting the impact of emerging pathogens. For example, climate envelope, or ‘niche’ models have been used to understand the potential impact of the Bd fungal pathogen (Ron, 2005; Lötters et al., 2009; Puschendorf et al., 2009; Rödder et al., 2010). These have been useful in predicting broad-scale patterns, such as a reduction in the geographic range of Bd with climate change (Rödder et al., 2010) and that regions with the highest suitability for Bd also contain some the world’s most diverse amphibian assemblages (Ron, 2005). These types of presence/absence models are well suited for predicting where a pathogen is expected to be able to survive, giving us an idea of its potential geographic distribution, but they are not well suited for predicting the locations or timing of epidemics that may threaten host communities. This is because they do not incorporate key information about wildlife hosts, such as their thermal physiology and disease susceptibility.
Here, we describe and use an alternative approach to predicting the risk of emerging infectious diseases in wildlife. Our mechanistic models use both field and experimental data to parameterize and validate predictions of disease variables, explicitly taking into account the thermal physiology and behavior of the host. We start by using field studies to characterize species-specific patterns of host behavior and physiology, and then incorporate empirically sourced information about the ecology of the host-pathogen relationship to produce a model that can predict variables relevant to predicting disease risk. Unlike climate envelope models, this mechanistic modeling approach captures the fundamental niche of both the host and pathogen by linking key organismal traits to spatial data (Kearney et al., 2008).
To illustrate the potential of this approach, we used and extended a biophysical model (Porter and Mitchell, 2006) to predict where and when one North American amphibian host, A. crepitans, would be most susceptible to Bd. Generating accurate predictions of animal body temperatures, and from there the relationship between body temperature and disease dynamics, requires a model that can translate local weather data into variables pertinent to the host’s physiology and the ways in which animal hosts behave in response to their local environment. The modeling platform we built on (Niche Mapper) calculates rates of heat and mass transfer between an animal and its environment based on the principle of energy conservation (Porter and Mitchell, 2006; Huang et al., 2013). It calculates the spatiotemporal metabolic and hydric costs imposed on the animal by the thermal environment by using topographic and climate data to estimate the animal’s microenvironment (Long et al., 2014). Niche Mapper has been used to model spatial distributions, behaviors and body temperatures of amphibians and a variety of other ectotherms (Kearney et al., 2008; Bartelt et al., 2010; Huang et al., 2013; Nowakowski et al., 2017). Niche Mapper has also been used to predict the distributions of disease-causing mosquitoes (Kearney et al., 2009). However, to our knowledge this is the first time that Niche Mapper has been extended to predict wildlife disease dynamics.
While the Bd pathogen is widespread in North America (Rothermel et al., 2008; Lannoo et al., 2011; Petersen et al., 2016), Bd-associated declines of amphibian hosts have been limited to a subset of the pathogen’s current range. We hypothesized, based on previous studies, that differences in body temperature make A. crepitans in northern latitudes more susceptible to Bd infection and disease-related mortality than frogs in the central and southern parts of their range. We hypothesized that Bd-infected frogs in the northern part of their range would often not survive long enough to breed after emerging from hibernation, potentially leading to population declines or local extinctions. Our findings demonstrate how a biophysical modeling approach that explicitly takes into account the environmental physiology of animal hosts can provide a more mechanistic understanding of where and when disease outbreaks may emerge and threaten biodiversity, facilitating conservation action.
Materials and Methods
Selection of Focal Host
We used the Northern cricket frog (Acris crepitans) as our focal host because this frog has a broad distribution in the eastern United States and is abundant throughout the southern part of its range, but has declined and even disappeared from much of the northern part of its range (Steiner and Lehtinen, 2008). Bd has been detected in A. crepitans populations from many parts of its range (Rothermel et al., 2008; Steiner and Lehtinen, 2008; Zippel and Tabaka, 2008; Brannelly et al., 2018; Sonn et al., 2019). Chytridiomycosis (Zippel and Tabaka, 2008; Sonn et al., 2017; Robak and Richards-Zawacki, 2018; Sonn et al., 2019) and other, sublethal effects of Bd infections (Brannelly et al., 2018) have also been documented in this species, suggesting that infection with Bd may have contributed to declines. Acris crepitans has a short life span, with most individuals living less than two years (Gray, 1983; Lehtinen and MacDonald, 2011; McCallum et al., 2011). Because of this, impacts of even short-lived and localized disease outbreaks on adult survival and recruitment are likely to impact the persistence of local populations. Acris crepitans is a terrestrial to semiaquatic frog commonly found in muddy areas close to water and shelter. It is often encountered near ponds, streams, or rivers in habitats ranging from forests to prairies but is rarely encountered in water. Males call from exposed vegetation and from wetland banks rather than from the water (Smith et al., 2003; Lehtinen and Witter, 2014; Sonn et al., 2019). Smith et al. (2003) reported a mean body temperature for A. crepitans of 27.4°C, though body temperatures reported from individual frogs measured in the field range from 6.1 – 39.0°C (Dunlap, 1968; Smith et al., 2003; Sonn et al., 2019). The critical thermal maximum for this species ranges from 40.5 – 43.5, depending on acclimation temperature (Dunlap, 1968). The critical thermal minimum has not been measured experimentally. This species’ broad distribution and the range of habitats in which it lives make it a suitable one for studying the relationship between microclimate, thermal physiology, and disease risk.
Field Data
We collected local weather data and recorded body temperature and microhabitat information for A. crepitans as part of a four-year field study at six field sites spanning three latitudes (Supplementary Table S1, see also Sonn et al., 2019). At our northernmost latitude, we surveyed two sites in Cesar Creek State Park, Waynesville, Ohio, United States. At our middle latitude, we surveyed two sites in Northwest Arkansas, United States, one in Hobbs State Park, Rogers, Arkansas, and the other in Lincoln Lake City Park, Lincoln, Arkansas, United States. At our southernmost latitude, we surveyed two sites in the Atchafalaya National Wildlife Refuge, Breaux Bridge, Louisiana, United States. All sites were at least partly wooded, included a pond, lake or stream, and were located within a protected habitat, such as park or wildlife refuge. Appropriate permits were obtained for the research at all study sites. We used a Hobo weather station (Onset Computer Corp., Bourne Massachusetts, United States, U30-USB) during each field visit to record air temperature and humidity (sensor S-THB-M008, 3 m above ground), wind speed (sensor S-WSA-M003), ground temperature (S-TMB-M006), and solar radiation (Sensor S-LIB-M003). The weather station was deployed prior to the first survey of a sampling session in a shady, flat location in A. crepitans habitat and it recorded data every 10 min until the last survey was complete.
We conducted daytime and nighttime surveys at each field site every two months during the A. crepitans active season (May – September in Ohio, March – October in Arkansas, and year-round in Louisiana), from 2012 to 2015, as detailed in Sonn et al. (2019). Daytime surveys began in the morning (0700 – 0900 h) when frogs began to be active and continued until the afternoon (1500 – 1700 h) when frogs became less active. Nighttime surveys were also conducted. These began at dusk and continued for at least one hour or until frogs were no longer active. When a frog was encountered, we noted the category of microhabitat that the frog was initially seen on (water, vegetation, bare ground, mud, leaf litter/debris, or rock) and whether it was in the sun or shade. We then measured the dorsal skin temperature of the frog and the temperature of the substrate on which the frog was first encountered using a hand-held infrared thermometer (Micro-Epsilon Dual-Focus Infrared, Maine, United States, Accuracy ± 0.1°C).
In addition to direct measurements of A. crepitans body temperatures, we deployed physical models to approximate the body temperatures of these amphibians over a broader range of time periods and microhabitats. Our physical models were made of 3% agar (following Navas and Araujo, 2000). Within the body of each model we placed an iButton data logger (Thermochron DS1925L-F5, Maxim Integrated Products, Sunnyvale, CA, United States) that recorded temperature every 10 min to within ± 0.5°C for the duration of each survey period (48 – 72 h). The models were made by pouring melted agar into silicone molds. Prior to pouring, the iButton sensor was suspended within the mold cavity using string so that the final product was an agar frog shape with the temperature data logger suspended inside the agar. The original molds, from which we made many silicone replicates, were made by pouring dental alginate over the bodies of anesthetized frogs in a water conserving posture.
We deployed physical models in two sizes, the smaller of which was similar in size to an adult cricket frog. We deployed each size of model in two color varieties (green or brown, using pistachio green and burnt umber pigments from Natural Pigments, Inc., Willits, CA, United States, respectively) to account for color variation among A. crepitans individuals. To account for variation in cutaneous resistance to evaporative water loss among individuals, after the agar had set we dipped some models in a plastic coating (Plasti-Dip Blaine, Minnesota, United States), which later hardened, giving them 100% resistance to evaporative water loss (following Roznik and Alford, 2014). Other models were left uncoated, allowing for evaporative water loss from the agar. Model sets including one replicate of each combination of size, color and resistance to evaporative water loss were placed in each of three microclimates (full shade, partial shade, and full sun) during each field survey for a total of 24 agar models deployed per survey. To determine which physical model and microclimate combination resulted in body temperatures that most closely resembled those measured by infrared thermometry on live A. crepitans, live frog body temperatures were subtracted from agar model data logger temperatures that were recorded within the same 5 min period. To ask how variation in agar model type and placement affected the approximation to live frog temperatures, we used the absolute value of the difference between the live frog body temperatures and the agar model temperatures (across sites and survey periods) as the dependent variable in a linear model (in SPSS v. 26), with model size, color, resistance to evaporative water loss (i.e., plastic coated or not), and microclimate (placement in full sun, part shade, or full shade) as fixed effects. All two- and three-way interactions between model size, color, and water loss type were included as fixed effects as well.
Modeling Body Temperature
Our ultimate goal was to develop a model that can accurately predict disease risk in space and time. We began by developing a model to predict A. crepitans body temperatures, a variable known to influence the course and outcome of Bd infections in this species (Sonn et al., 2017; Sonn et al., 2019), across a range of environmental conditions. We used the biophysical modeling program Niche Mapper (Porter and Mitchell, 2006), which couples a microclimate model with an organismal (ectotherm) model, to predict A. crepitans skin temperatures. The microclimate model computes the hourly temperature profile, wind speed, relative humidity and clear sky solar radiation of a location for each time period of interest using standard weather station measurements as input. These hourly outputs are then used as input for Niche Mapper’s ectotherm model, which calculates body temperatures by solving the steady state heat balance equation;
given conditions in the microclimate model and information about an animal’s morphology, physiology and behavior. In this equation, Qgen represents generated metabolic heat, Qsolar represents solar energy, Qinfra, in and Qinfra, out are incoming and outgoing thermal infrared radiation, and Qevap, Qconv, and Qcond are evaporative heat, convective heat, and conductive heat, respectively (Tracy, 1976; Porter and Mitchell, 2006).
As a first step in developing our body temperature model, we used field-collected weather data to parameterize Niche Mapper’s microclimate model and measurements of the morphology and physiology of A. crepitans to parameterize Niche Mapper’s ectotherm model. We then evaluated the ectotherm model’s predictions of skin temperature by comparing them to field-collected A. crepitans skin temperature estimates. Once we had an optimized ectotherm model that gave reliable predictions of A. crepitans body temperatures across our survey sites and time points, we used those parameters to extend our model to make predictions of body temperatures across the species’ range using global information system (GIS) weather data and the landscape version of Niche Mapper.
To parameterize our initial single-site Niche Mapper models, we used hourly wind speed, relative humidity, and air temperature data recorded using the Hobo weather station deployed during each of our field surveys as inputs for the microclimate model. Other site-specific inputs to this model included latitude, longitude, slope, azimuth, and elevation. A full list of parameters used in the microclimate model and their sources can be found in Supplementary Table S2.
We used Niche Mapper’s ectotherm model to output skin temperature predictions for each field site over the time periods during which field body temperature data were collected. In agreement with observations of microhabitat use for A. crepitans (Smith et al., 2003; Sonn et al., 2019), which indicates little time spent in water, and given the complexity of accurately modeling pond temperatures from weather data, we assumed frogs spent 100% of their time on land. We parameterized the ectotherm model for A. crepitans using the parameters found in Supplementary Table S3. These include published estimates of the lethal temperatures (Dunlap, 1968) and basal metabolic rate (Dunlap, 1969) for A. crepitans. For maximum and minimum voluntary core temperatures, we used the highest and lowest body temperatures observed in active A. crepitans frogs during our four-year field study (see also Sonn et al., 2019). Estimates of the digestive efficiency, gut passage time, fecal water percentage, and food properties for A. crepitans were from Johnson and Christensen (1976). Diurnal, crepuscular, and nocturnal activity patterns were parameterized based on field observations made during our four-year study. Similarly, fossorial, burrowing, and shade seeking activity patterns, as well as the number of activity hours, were adjusted by month based on our field observations. To achieve the best fit between Niche Mapper and our field data, we adjusted several factors in both the ectotherm and microclimate models that we were unable to measure accurately in the field or find values for in the literature. These variables are indicated in Supplementary Tables S2 and S3 and included climate, physiological, and behavioral parameters. The Niche Mapper model was considered to be ‘fit’ when the parameters used minimized the difference between field measured A. crepitans body temperatures (when available) and/or agar model temperatures and Niche Mapper predicted body temperatures was minimized across field sites and survey time points.
Predicting Disease Risk
We used the results of laboratory experiments where A. crepitans were individually exposed to Bd and held at different temperatures (Sonn et al., 2017; Sonn et al., 2019) to predict relationships between body temperature and disease risk, with survival of Bd-exposed animals and Bd infection prevalence being our focal disease variables. The results of these experiments showed a strong relationship between temperature and both of these disease variables. We used the survival function from a Cox regression analysis (in SPSS v. 23) of the Sonn et al. (2017) data, with temperature as the only covariate, to predict the survival of Bd-exposed animals based on body temperature.
The Cox survival function takes the form S(t) = Ho(t)e^(bx), where S(t) is the probability of survival of a Bd-infected frog for t days after exposure, bx is the value of the coefficient at temperature x, Ho(t) is the baseline hazard function value at time t, and x is treatment temperature (there were six in Sonn et al., 2017: 11, 14, 17, 20, 23, and 26°C). We used the baseline hazard functions at time zero, or Ho(0), and coefficient (bx) from the Cox survival functions for each temperature group as dependent variables in a regression against treatment temperature. We then found the polynomial equation that best described the relationship between temperature (x, in °C) and baseline hazard at time zero (R2 = 0.616), and between temperature and the coefficient b (R2 = 0.992), and used these equations to rewrite the survival function with both the baseline hazard function and the coefficient as a function of temperature (in °C, Figure 1A). We then compared the predicted survival for each of the frogs in the Sonn et al. (2017) experiment, based on the Cox survival function, with that predicted by our temperature-based survival function to make sure that our polynomial equation provided a good fit to these empirical data. The average difference in probability of survival between the Cox Regression’s survival prediction and our equation’s was 0.042 meaning that, on average, the two agreed on the predicted survival of a frog, based on its body temperature, to within 5%.
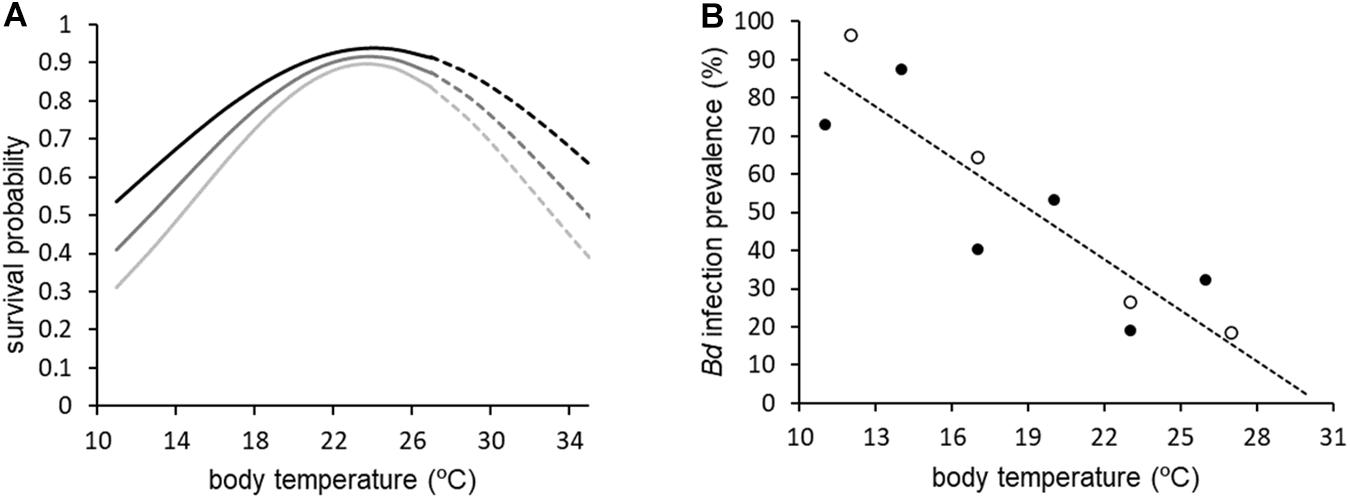
Figure 1. Probability of survival (A) and Bd infection prevalence (B) for Bd-infected A. crepitans as a function of temperature, based on laboratory exposure studies. In (A), predictions are shown for 20, 30, and 40 days after infection and solid lines are within the range of temperatures included in Sonn et al. (2017) whereas dashed lines represent extrapolated relationships. In (B), open circles are median daily temperatures from Sonn et al. (2019) whereas closed circles are constant temperature treatments from Sonn et al. (2017). The equation for polynomial describing survival probability (S) as a function of body temperature (x, in°C) and time (t, in days post exposure) in (A) is S (t, x) = (0.0046x + 0.874)e^(-0.000163x2 + 0.00762x – 0.091346)t. The equation for the line of best fit describing infection prevalence (y) in (B) is y = -4.4407x + 135.42, with R2 = 0.7992.
To predict Bd infection prevalence based on body temperature, we used the equation for the line of best fit from a linear regression relating the average infection prevalence from the laboratory exposure experiments (Sonn et al., 2017, 2019) to temperature. For the Sonn et al. (2019) experiment, where temperature fluctuated daily in in all treatment groups, median daily temperature was used to describe the relationship with prevalence as this yielded the greatest R2 value (Figure 1B).
Landscape Simulations
To extend our Niche Mapper predictions of frog body temperature to two dimensions (space and time) we first adjusted the microclimatic input data to account for spatial variation in macroclimate conditions and topography and then processed the microclimate and ectotherm output from the model for each pixel in the selected landscape, which in our case was the entire historic range of A. crepitans. Elevation and long-term (1980–2010) monthly maximum and minimum air temperature raster files were obtained for this area from the Prism Climate Group (2004). Cloud cover was obtained from New et al. (2002) and resampled to 800 m resolution to match the temperature and elevation data. The minimum relative humidity of each pixel was calculated based on the pixel’s temperature range, and assuming a maximum relative humidity of 100% and a constant mass of water per unit volume of air. Clear sky solar radiation was calculated for each pixel using its location and topography (McCullough and Porter, 1971). We assumed up to 100% shade was available in each pixel, and windspeeds at 2 m height were assumed to range from 0.1 m/s to 4.0 m/s each day. For each pixel, all other microclimate model inputs and all frog physiological and behavioral inputs to the ectotherm model were as described above and in Supplementary Tables S2, S3. The frogs were modeled on a wet soil surface (20% surface wetness; Supplementary Table S2) with their bodies exposed to the prevailing air conditions at animal height as calculated by the microclimate model.
Landscape simulations were controlled using an R (R Core Team, 2017) script that populated pixel-specific model input information with appropriate values, executed the Niche Mapper microclimate and ectotherm models, and stored the results in a data frame for export upon completion of all pixel calculations. These landscape-scale simulations generated the data we used to create a series of maps using ESRI ArcMap (v. 10.7) that predict average frog body temperatures for each month throughout the frogs’ historic range. Functions relating body temperature to survival and infection prevalence derived from laboratory exposure experiments, as described above, were then applied to these maps using the ‘map algebra’ function in ArcMap to yield distribution-wide monthly average predictions of disease variables for Bd-exposed A. crepitans.
The breeding season for A. crepitans begins within a month after the coldest part of their active season. Hence we focused on modeling the probability of survival of Bd-infected frogs for 30 days, which we estimated to be the minimum time a frog infected at or soon after emergence from hibernation would need to survive in order to breed. In the southernmost part of their range (southern Louisiana and Texas) A. crepitans do not hibernate and are active year-round, with breeding occurring from February through October (Bayless, 1966). Thus, even in the areas where frogs do not hibernate, 30 days may be a critical timeframe for survival with Bd as this would allow frogs infected during the coolest month of the year (January) to survive to the start of the February breeding pulse.
Results
Body Temperature Predictions
Body temperature predictions from our A. crepitans Niche Mapper model and our agar physical models closely matched the temperatures measured from live A. crepitans at each field site (Figure 2). Across sites and survey periods, the mean of the absolute difference between live frog body temperatures and agar model temperatures (for all size, color, and resistance to evaporative water loss varieties, and across all three microclimates in which they were placed) was ≤0.58 °C. There were no significant differences in the approximation to live frog body temperatures among model sizes, colors, or water loss resistance types (Linear model: F1,5665 ≤ 1.875, P ≥ 0.171), nor did microclimate placement affect this approximation (Linear model: F2,5665 = 2.761, P = 0.063). The only significant term in the model was the size by water loss resistance type interaction (Linear model: F1,5665 = 3.945, P = 0.047), which suggested that plastic coating to prevent evaporative water loss improves the approximation to live frog body temperatures when the agar model is large in size, but makes the approximation worse when the model is small (Supplementary Figure S1).
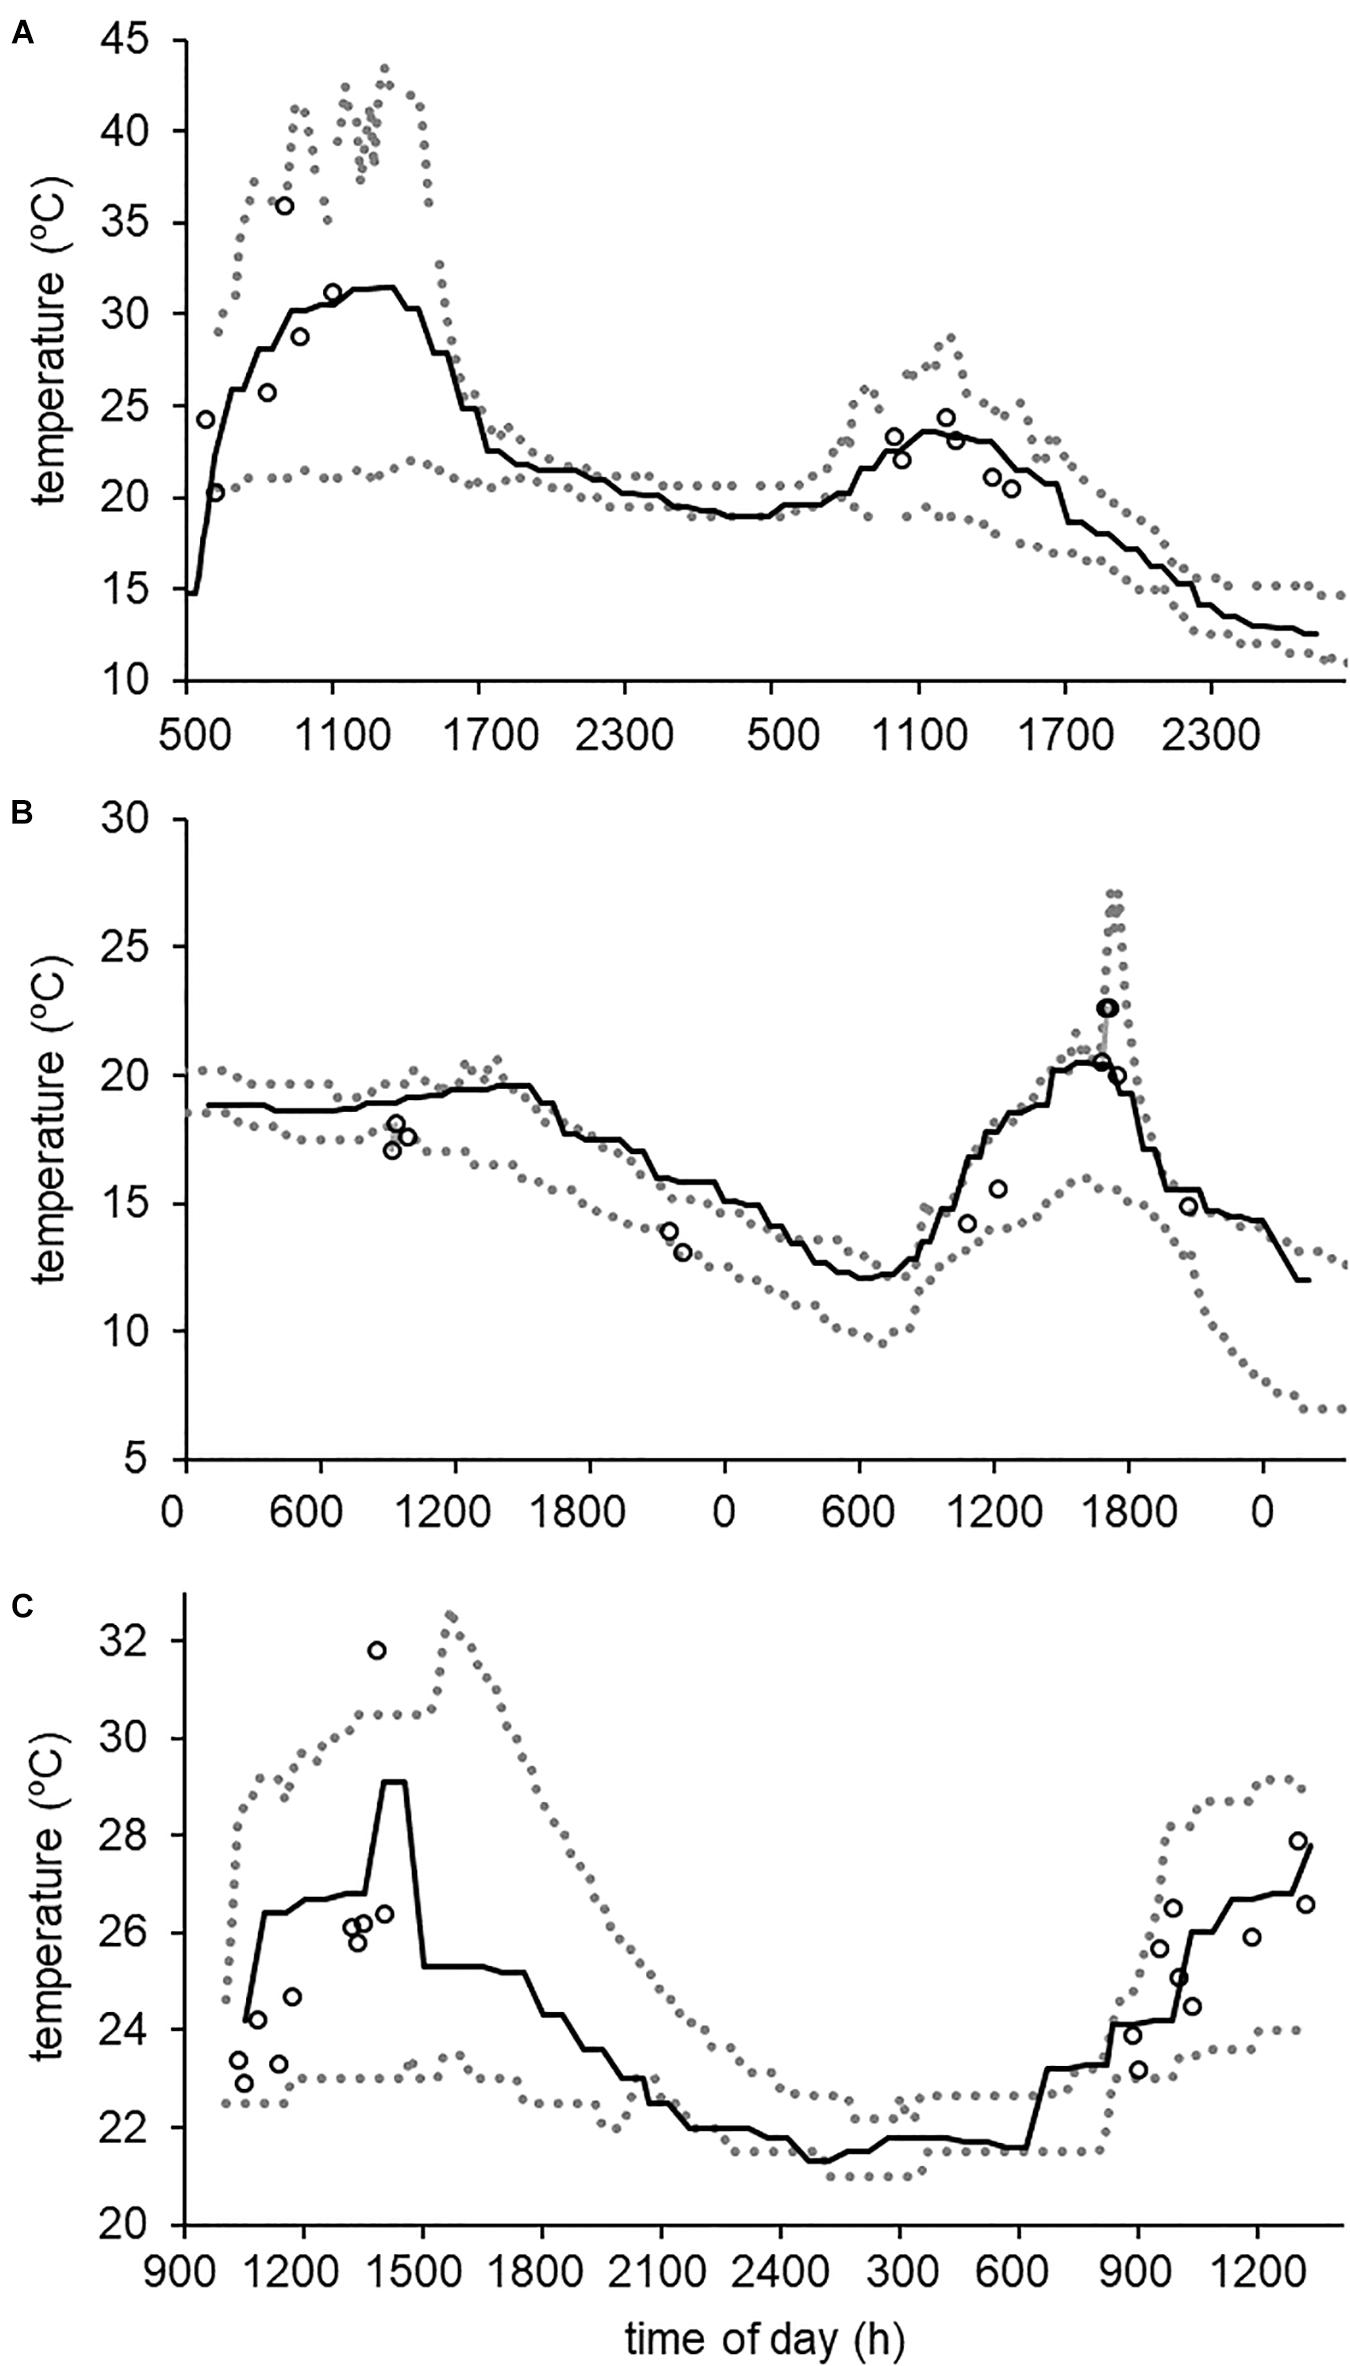
Figure 2. Comparison of A. crepitans body temperatures (measured with IR thermometry, open circles), agar model temperatures (maximum and minimum iButton readings across all model types, shown as dotted gray lines) and Niche Mapper predicted skin temperatures (solid black lines) for our May 2015 surveys of (A) Cesar Creek State Park site #1, Ohio, United States, (B) Lincoln Lake City Park, Arkansas, United States, and (C) Atchafalaya Basin site #1, Louisiana, United States. For this time period, Niche Mapper predictions were frequently within the range observed among our agar models and only one measured A. crepitans had a body temperature that fell outside that envelope.
The body temperatures of live A. crepitans frogs measured at the same site and time of day varied by as much as 4°C, such that frogs in certain microhabitats were much warmer than others. Nevertheless, when we compared Niche Mapper predicted body temperatures to live frog temperatures recorded during our field surveys, we found a strong correspondence across seasons and latitudes. To illustrate this, we will use as an example from our May sampling period, as May is a time when microclimates differ greatly among our field sites and a time when the frogs are active and (in most cases) breeding. During this survey period, across sites, the average difference between Niche Mapper predictions of A. crepitans skin temperatures and temperatures measured from live frogs within the same 10 min period was 1.42°C (N = 15, range 0.10 – 2.70°C). All but one of the live frog body temperatures and all of the Niche Mapper predicted temperatures during this survey period fell within the range of temperatures recorded by the agar models (Figure 2). Our Niche Mapper model predicted frog temperatures similarly well during other parts of the active season.
Running our model using the landscape version of Niche Mapper resulted in monthly average body temperatures for active (i.e., non-hibernating) A. crepitans that range from ∼ 5 to 27°C, with both the lowest (January) and highest (July) averages occurring in the southern part of the species’ range. In the northern part of the species’ range, where declines and local extinctions have occurred, mean monthly body temperatures are predicted to remain below 20°C year-round. At our field sites, the predicted monthly average body temperatures were, on average, 4.14°C (range = 1.74 – 5.86°C) lower than the average A. crepitans body temperatures we measured using IR thermometry during those months. This difference is not surprising, however, given that our field data were collected during the warmer day and evening hours and Niche Mapper’s monthly estimates also include the nighttime hours when body temperatures would be lowest.
Based on its relationship with body temperature, the prevalence of Bd infections in exposed A. crepitans frogs is predicted to fluctuate annually between 15.8% (July) to 79.5% (January) at the southern extent of the species range and between 68.2% (July) and 100% (at emergence from hibernation) at the northern extent of the species range (Figure 3). Our models of 30 day survival suggest that the probability that a cricket frog infected with Bd at or shortly after emergence from hibernation (or after the coldest active month in the south) would have a 10 - 50% chance of surviving 30 days (Figure 4). In the southernmost part of the range, where frogs are active year-round, the probability of surviving with infection through January reaches a maximum of 45% at the southern extent of the species range in Texas and is predicted to be as low as 10% in the northern parts of Texas and Louisiana (where frogs may or may not hibernate). Toward the center of the range, where frogs tend to emerge from hibernation in April, the probability of a Bd-infected frog surviving to breed in May is close to 50%, but moving further north within the species historic range that probability drops. In areas where the species has declined, that probability reaches as low as 10%.
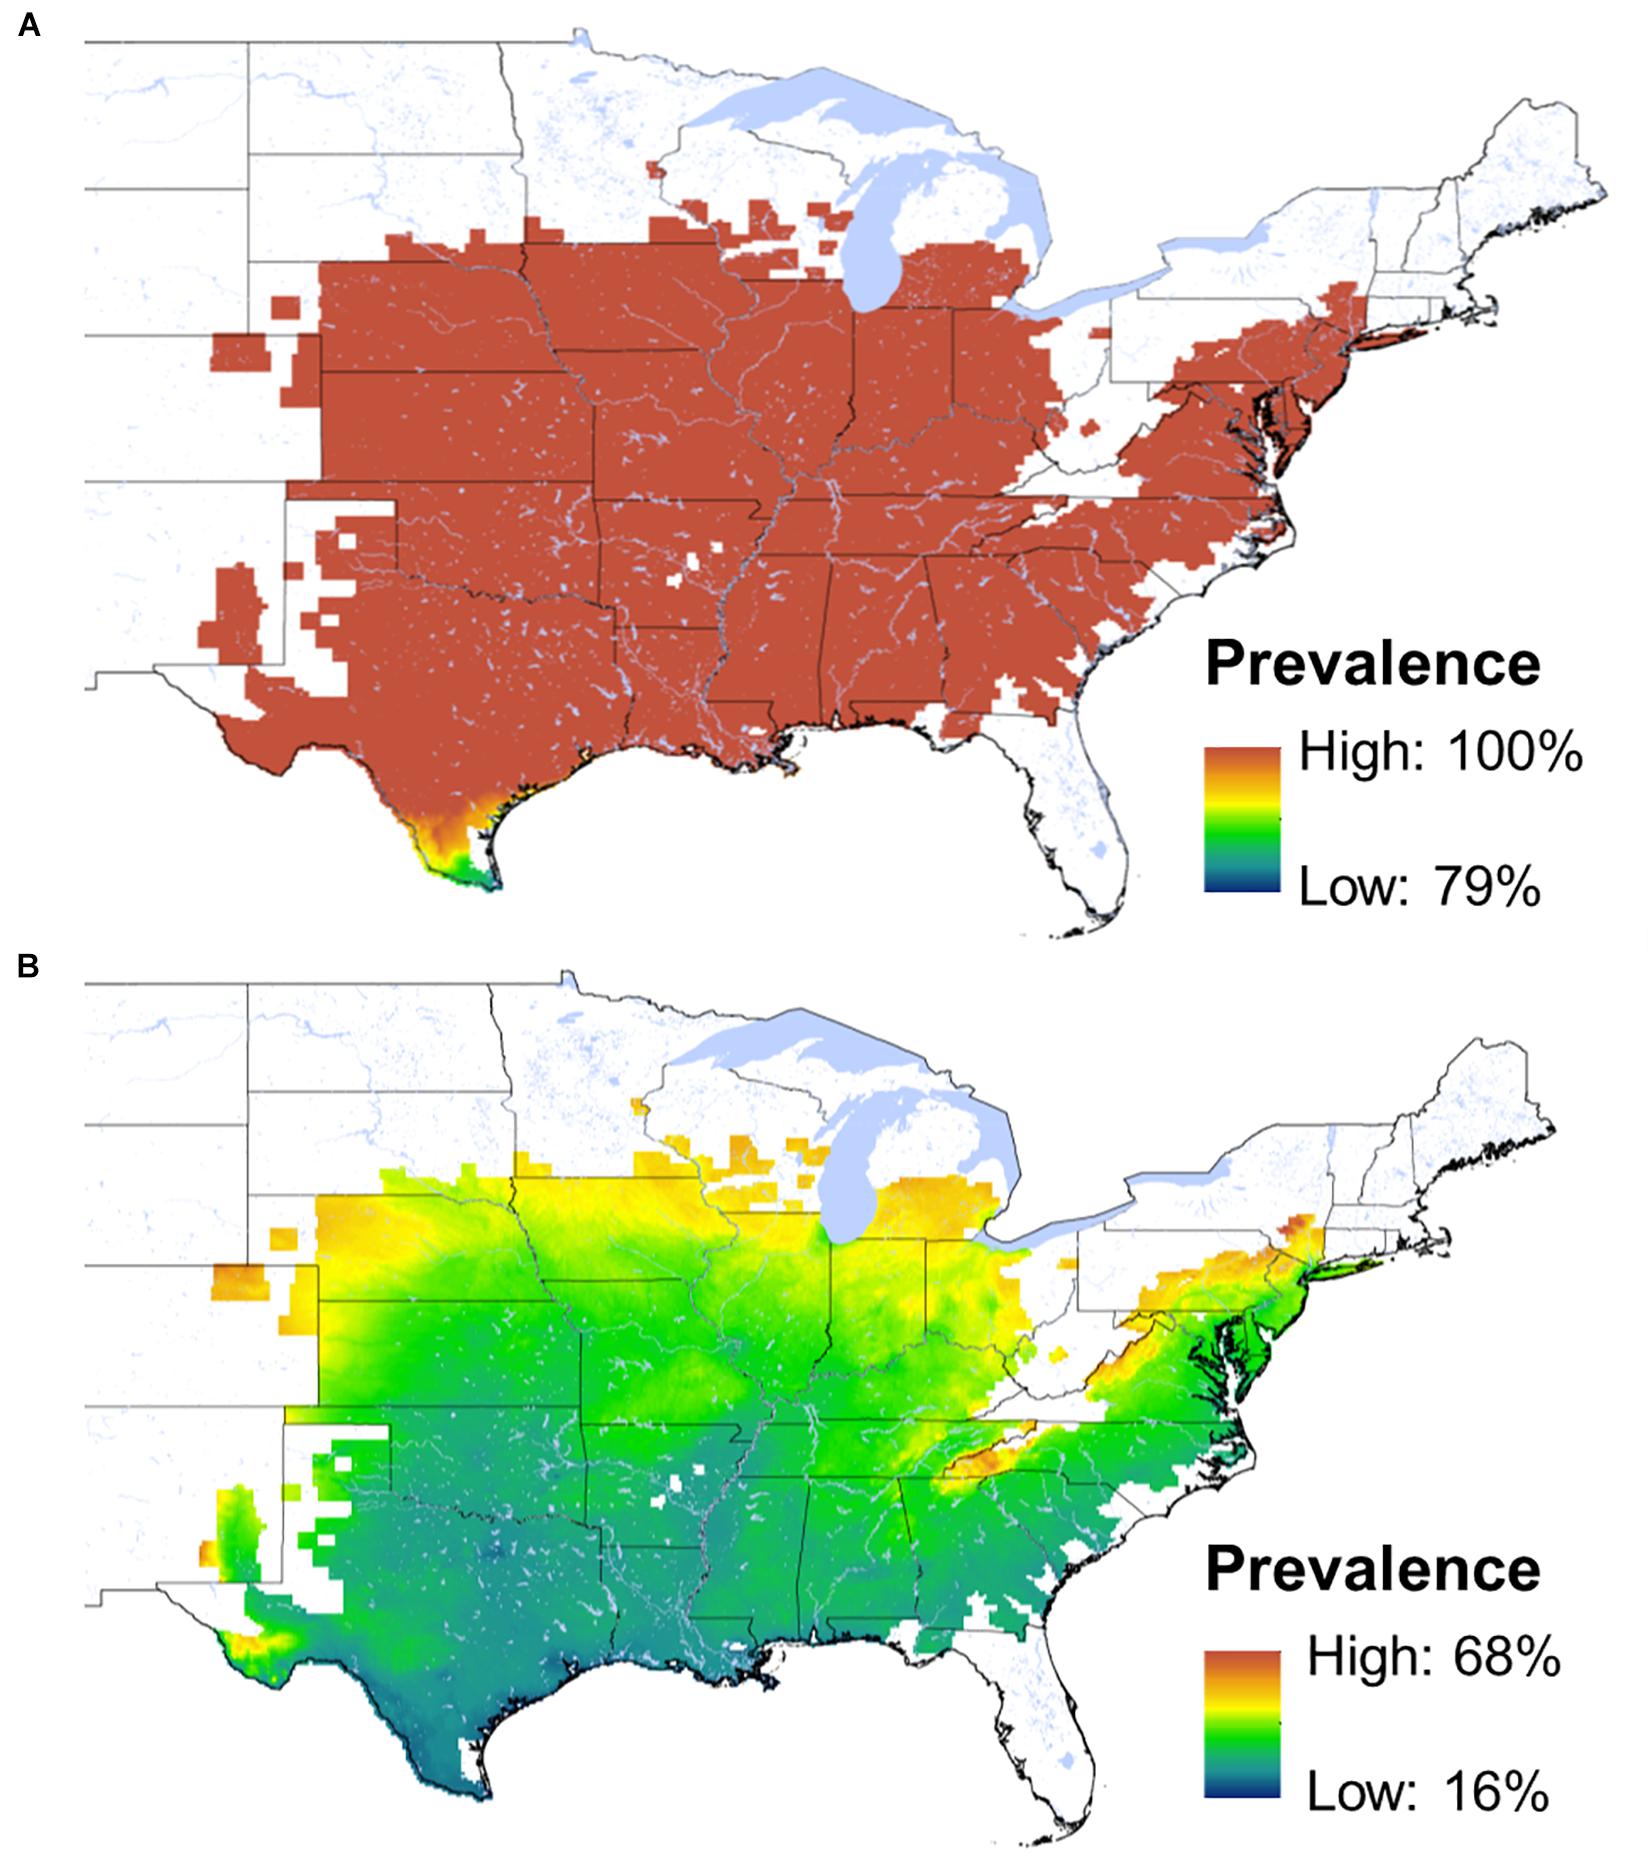
Figure 3. Maps of predicted infection prevalence for A. crepitans frogs exposed to the Bd pathogen. Over nearly all of this host’s range the predicted prevalence is 100% during the coldest active months (A). Prevalence is predicted to reach its lowest point in July (B) when frog body temperatures are greatest.
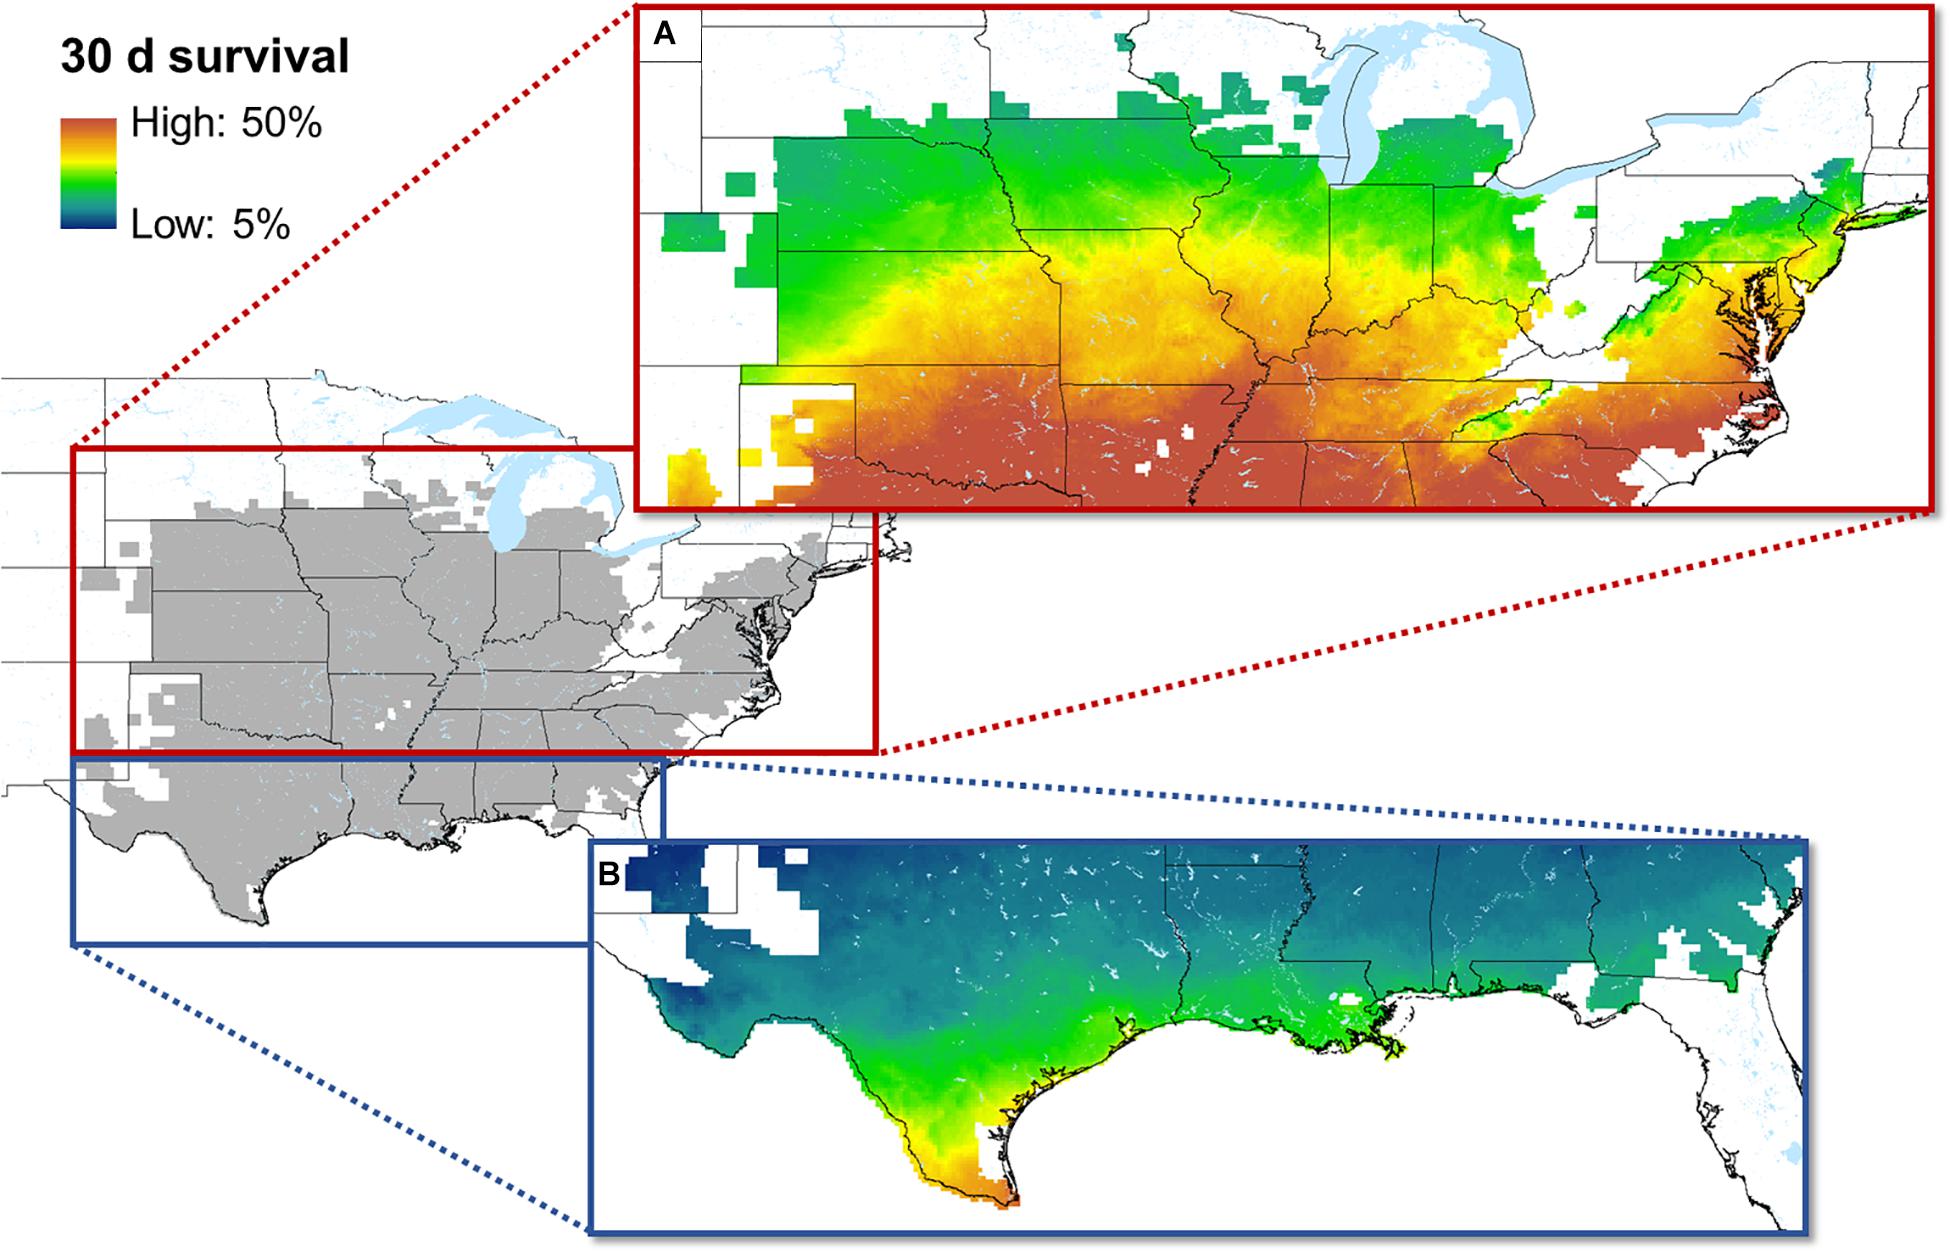
Figure 4. The historic range of A. crepitans is shown in gray on the map at left. Enlarged on the right are maps of predicted 30 day survival for A. crepitans frogs infected with Bd just prior to breeding. In the central and northern part of the frog’s range (A), the model is for the time between emergence and the start of breeding. In the south (where A. crepitans are known to remain active year-round), the model is for the coldest part of the year (January), which precedes a breeding pulse in February.
Discussion
At the largest scales, latitudinal, seasonal and elevational variation in temperature have long been known to impact the amphibian-Bd interaction, with infections and mortality occurring more frequently in cooler climes and seasons than in warm ones (Woodhams and Alford, 2005; Wake and Vredenburg, 2008 Murray et al., 2013; Catenazzi et al., 2014; Sonn et al., 2019). In North America, latitude has been shown to correlate with Bd prevalence in amphibian populations, but only at the end of the amphibian active season (Petersen et al., 2016). In other studies, and at other times of the year, no correlation with latitude has been found (Petersen et al., 2016; Sonn et al., 2019). When they occur, correlations between air temperatures and infection disease are often attributed to the fact that in vitro, Bd growth shows strong temperature dependence. It grows optimally below ∼21–23°C, but death of the fungus occurs at temperatures above ∼25 – 26°C, depending on the strain (Voyles et al., 2017). However, the temperature-dependence of Bd growth in culture can be a poor predictor of infection and disease in amphibian hosts (Cohen et al., 2017; Sonn et al., 2017), possibly because the behaviors and physiological traits of amphibian hosts that affect their susceptibility to infection and disease also depend upon temperature.
Many ectotherms, including amphibians, actively thermoregulate, and thus their body temperatures can differ markedly from environmental temperatures. For frogs, especially in sunny areas, body temperatures often reach or exceed those lethal to the Bd pathogen for at least part of the day (e.g., Richards-Zawacki, 2010; Rowley and Alford, 2013; Sonn et al., 2019) even when air temperatures remain lower. Microhabitat use has been shown to affect the likelihood of infection, where sunny sites can act as refugia for amphibians despite high Bd prevalence in the area (Puschendorf et al., 2011). Frogs may also actively choose microhabitats conducive to raising their body temperatures above what the pathogen can tolerate. This has been suggested for Atelopus zeteki in Panama (Richards-Zawacki, 2010) and for A. crepitans in Louisiana, where frogs encountered in sunny microhabitats had heavier Bd loads than frogs encountered in the shade (Sonn et al., 2019). Thus, it would seem, that the relationship between climate and chytridiomycosis risk is complex, and understanding it requires careful consideration of the ecologies, physiologies, and behaviors of both host and pathogen.
Mechanistic approaches to modeling disease risk, like the one we have developed here, have several advantages over the more commonly used climate envelope or ‘niche model’ approach. For example, beyond simply predicting the likelihood that the pathogen and/or the host may co-occur at a given site our biophysical modeling approach allowed us to model how disease-relevant aspects of host physiology and behavior vary across the time points and areas where host and pathogen co-occur, and from there, to make predictions of about the likelihood and outcome of infection. Our example case of A. crepitans frogs, a species that has experienced declines in part of its range that may or may not have been driven by disease, demonstrates the additional insights that a biophysical modeling approach has to offer.
Across latitudes, seasons and hours of the day, our biophysical model’s predictions of A. crepitans body temperatures were similar to live frog body temperatures measured in the field and the temperatures of agar models that simulate the physiology of live frogs. This finding, and the tight relationship between temperature and disease variables in Bd-infected frogs seen in our empirical studies (Sonn et al., 2017, 2019), suggest that the model we have developed and employed in this study may be able to accurately predict the patterns of Bd infection and disease that frogs experience in nature.
At the scale of a single site, even when frog body temperatures varied by as much as 15°C over the course of a few hours, our Niche Mapper model was generally able to predict frog body temperatures to within 1 - 2°C, and many predictions were within one degree of live frog temperatures measured in the field. On sunny days and when weather patterns fluctuated throughout the day frog body temperatures were more difficult to predict, likely because under these conditions frogs have a wider variety of microclimates from which to choose. Additional model fitting under a wider variety of weather conditions and at a greater number of sites may help improve model predictions under these conditions.
At the landscape scale, our model suggests that monthly average body temperatures for this host exceed the upper limit of the Bd pathogen’s thermal tolerance (∼ 25°C, Voyles et al., 2017) only in the very southern extent of the species range, and then only for a few months of the year (Figure 5). Thus, given that this pathogen appears ubiquitous across this species’ range, our model suggests that most populations will encounter Bd at temperatures where it can survive and infect them, for at least a portion of each month of the year. In the northern part of the species range, where declines and local extinctions have occurred, mean body temperatures are predicted to remain below 17°C, in the temperature range where the pathogen load and mortality of Bd-exposed A. crepitans was high in laboratory exposure experiments, for all but 1 – 3 months of the year.
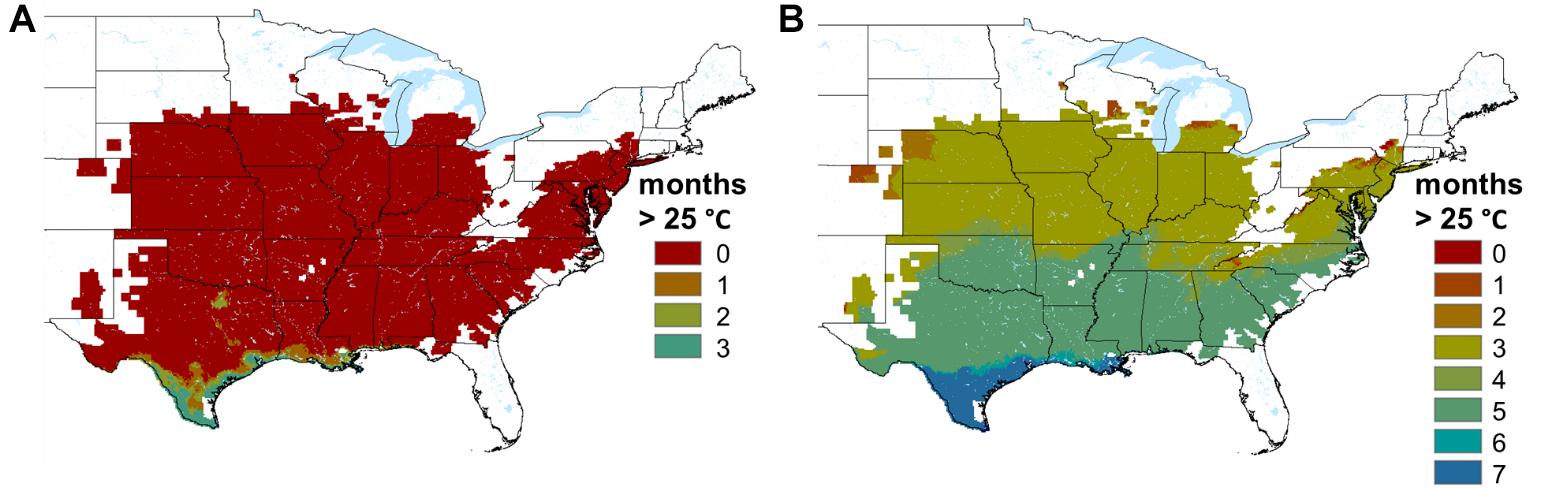
Figure 5. Map showing the number of months that average A. crepitans body temperatures are predicted to exceed (A) 25°C, the approximate thermal maximum for the Bd pathogen (Voyles et al., 2017), and (B) 17°C, the temperature below which A. crepitans is most susceptible to Bd (Sonn et al., 2017).
Our model’s predictions of Bd infection prevalence, based on the empirically derived relationship between temperature and prevalence for A. crepitans frogs exposed to Bd in the lab, suggest that across this species’ range, the vast majority of frogs (79.5% in the south to 100% in the north) that encounter the Bd pathogen during the coolest months of their active period are likely to become infected. In the summer, when environmental temperatures and frog body temperatures are higher, the prevalence of Bd infection is predicted to drop below 20% in the south but to remain above 60% in the northern part of the host’s range. In the field, Bd infection prevalence in A. crepitans populations has indeed shown this type of dramatic seasonal fluctuation (Brannelly et al., 2018; Sonn et al., 2019), exceeding 90% in some years during the winter only to fall below detectable levels in summer. However, in most years and sites sampled to date, monthly prevalence in the field has not been as high as what our models would predict. For example, our field estimates of Bd prevalence in Ohio, the northernmost latitude we sampled in our field study, only reached the range predicted by our models in one of the four years we sampled (44 – 63% in 2015, see Sonn et al., 2019). From 2012 to 2014, the prevalence we measured was much lower. This apparent over-prediction of infection prevalence could be due to the fact that our model assumes that all frogs are exposed to Bd during the month in question, when in reality this may not be the case. While Bd may be present in most habitats most of the time, it is not clear how often animals encounter the pathogen. Mark-recapture studies suggest that even when Bd is present in A. crepitans habitats year-round, animals often gain and lose infections on short (monthly) time scales (Brannelly et al., 2018; Sonn et al., 2019).
Whether Bd-infected A. crepitans can survive hibernation remains unstudied, though our model suggests they would not. Our model also predicts low (∼ 10%) survival for Bd infected frogs during the coolest part of the active season, just prior to the start of breeding, at both the northern and southern extents of this frog’s historic range. Thus, even frogs that emerge from hibernation healthy but acquire new infections soon thereafter may often not survive to breed in the north. In the south, where A. crepitans is active year-round, it is also quite abundant. This, coupled with lower disease prevalence in the south, suggests that the low predicted survival rate for infected frogs during the coolest months of the year would have less impact on populations than it would in the north. In the north, not only are infections more prevalent, but populations tend to be smaller in size and patchily distributed (Lehtinen and MacDonald, 2011; Brannelly et al., 2018; Sonn et al., 2019). Because even apparently healthy cricket frogs seldom live longer than one year (Lehtinen and MacDonald, 2011), the combination of a high infection prevalence and low survival to breeding for Bd-infected A. crepitans in small northern populations suggests that Bd could be a cause of recruitment failure and local extinctions.
Disease-related failures of recruitment could explain the declines that A. crepitans has experienced in the northern part of its range. These declines were not well documented, and they occurred before the Bd pathogen was discovered. Cricket frogs apparently remained abundant in areas where populations have since declined as late as 1949 (Wright and Wright, 1949). Museum studies have shown evidence of widespread Bd infections in amphibian populations from eastern North America as far back as the 1960s, though degradation in preservative may have prohibited its detection in samples collected from earlier time points (Ouellet et al., 2005). Areas within the states of Ohio and Michigan where our model predicts some of the lowest body temperatures, and subsequently probabilities of survival, have few or no remaining populations of cricket frogs (Lehtinen, 2002; Lehtinen and Witter, 2014). The range of cricket frogs in Ohio has contracted by 120 km compared to its historic distribution and although pollution has long been proposed as a cause, no significant relationship has been found between other environmental stressors and cricket frog occurrence (Lehtinen and Skinner, 2006). Though we do not have enough evidence to directly attribute these declines to Bd, it remains a possible explanation. Some have suggested that the absence of observation of sick and dying frogs in long-term studies indicates that A. crepitans populations are not impacted by Bd (Steiner and Lehtinen, 2008). However, our work has shown that these frogs can and do die of chytridiomycosis after exposure to Bd (Sonn et al., 2017, 2019) and that even when disease is not observed Bd infection can have sublethal effects on A. crepitans populations (Brannelly et al., 2018). The small size of cricket frogs, as well as their rapid decomposition in wetland environments, may also prevent dead individuals from being found.
Although climate envelope models remain important tools for predicting the potential spread of pathogens to new areas and hosts, models like the one we’ve developed, that incorporate host physiology and behavior, are needed to understand the threat new diseases pose to biodiversity once they have arrived. The biophysical modeling approach we used to predict risk that the Bd fungal pathogen poses to a declining amphibian host could readily be adapted and applied to understand the impact of other emerging wildlife diseases. Knowing that the relationship between temperature and susceptibility to Bd differs among amphibian hosts, we designed both field and laboratory studies to collect the information we needed to parameterize and test our model. Similar types of models, relating environmental variation to patterns in pathogen growth and host energy budgets, have been used to predict the impact of white-nose syndrome in bats (Hayman et al., 2016). For other well-studied emerging disease systems, the information needed to predict the ecological drivers of disease outbreaks may already be available. These types of biophysical models, once validated to, are poised to provide scientists and conservation practitioners with the ability to predict the potential impact of disease outbreaks and respond with appropriate management actions.
Data Availability Statement
The raw data supporting the conclusions of this article will be made available by the authors, without undue reservation.
Ethics Statement
This study and its methods were approved by the Institutional Care and Use Committee (IACUC) at Tulane University (Protocol Nos. 0391 - 0391R2 and 0430 – 0430R).
Author Contributions
CR-Z conceived of the study and secured funding for it. JS conducted the field studies. JS and CR-Z analyzed the field data. All authors contributed to model development and JS and WP did the validation. All authors contributed to writing the manuscript.
Funding
This project was funded by grants from the National Science Foundation (Award Nos. 1453780 and 1649443) and the Louisiana Board of Regents [Award Nos. NSF(2012)-LINK-67 and LEQSF(2011-14)-RD-A-26] to CR-Z and funds from Tulane University to CR-Z and JS.
Conflict of Interest
The authors declare that the research was conducted in the absence of any commercial or financial relationships that could be construed as a potential conflict of interest.
Acknowledgments
We thank Anat Belasen, Gina Botello-Young, Elise Creed, Mysia Dye, Tyler Freeman, Sarah Giltz, Jonathan Hermanson, Sam Lantz, Rory Loo, Amelia Lormond, Brittany Maldonado, Nathan Mansor, Maggie MacPherson, Megan McWilliams, Julia Michaels, Sophie Miller, Anna Peterson, Chloe Ramsay, Xander Rose, Jamie Rosenberg, Adriane Seiden, Sarah Sugarman, Becca Wier, Yusan Yang, and Gina Zwicky for help with fieldwork and Mary Neligh for help with database construction and design. We also thank Sunshine Van Bael and David Heins for feedback on previous drafts. This study and its methods were approved by the Institutional Care and Use Committee (IACUC) at Tulane University (Protocol Nos. 0391 - 0391R2 and 0430 – 0430R).
Supplementary Material
The Supplementary Material for this article can be found online at: https://www.frontiersin.org/articles/10.3389/fevo.2020.576065/full#supplementary-material
References
Bartelt, P. E., Klaver, R. W., and Porter, W. P. (2010). Modeling amphibian energetics, habitat suitability, and movements of western toads, Anaxyrus (=Bufo) boreas, across present and future landscapes. Ecol. Model. 221, 2675–2686. doi: 10.1016/j.ecolmodel.2010.07.009
Bayless, L. E. (1966). Comparative Ecology of Two Sympatric Species of Acris (Anura, Hylidae) with Emphasis on Interspecific Competition. Ph.D. dissertation, Tulane University, New Orleans.
Brannelly, L. A., Chatfield, M. W. H., Sonn, J., Robak, M., and Richards-Zawacki, C. L. (2018). Fungal infection has sublethal effects in a lowland subtropical amphibian population. BMC Ecol. 18:34. doi: 10.1186/s12898-018-0189-5
Bruno, J. F., Ellner, S. P., Vu, I., Kim, K., and Harvell, C. D. (2011). Impacts of aspergillosis on sea fan coral demography: modeling a moving target. Ecol. Monogr. 81, 123–139. doi: 10.1890/09-1178.1
Catenazzi, A., Lehr, E., and Vredenburg, V. T. (2014). Thermal physiology, disease, and amphibian declines on the eastern slopes of the Andes. Conserv. Biol. 28, 509–517. doi: 10.1111/cobi.12194
Cohen, J. M., Civitello, D. J., Venesky, D. M., McMahon, T. A., and Rohr, J. R. (2018). An interaction between climate change and infectious disease drove widespread amphibian declines. Glob. Change Biol. 25, 927–937. doi: 10.1111/gcb.14489
Cohen, J. M., Venesky, M. D., Sauer, E. L., Civitello, D. J., McMahon, T. A., Roznik, E. A., et al. (2017). The thermal mismatch hypothesis explains host susceptibility to an emerging infectious disease. Ecol. Lett. 20, 184–193. doi: 10.1111/ele.12720
Dunlap, D. G. (1968). Critical thermal maximum as a function of temperature of acclimation in two species of hylid frogs. Physiol. Zool. 41, 432–439. doi: 10.1086/physzool.41.4.30155478
Dunlap, D. G. (1969). Influence of temperature and duration of acclimation, time of day, sex, and body weight on metabolic rates in the Hylid frog, Acris crepitans. Comp. Biochem. Physiol. 31, 555–570. doi: 10.1016/0010-406x(69)90057-7
Fisher, M. C., Henk, D. A., Briggs, C. J., Brownstein, J. S., Madoff, L. C., McCraw, S. L., et al. (2012). Emerging fungal threats to animal, plant and ecosystem health. Nature 484, 186–194. doi: 10.1038/nature10947
Gray, R. H. (1983). Seasonal, annual and geographic variation in color morph frequencies of the cricket frog, Acris crepitans, in Illinois. Copeia 1983, 300–311. doi: 10.2307/1444372
Hayman, D. T. S., Pulliam, J. R. C., Marshall, J. C., Cryan, P. M., and Webb, C. T. (2016). Environment, host, and fungal traits predict continental-scale white-nose syndrome in bats. Sci. Adv. 2:e1500831. doi: 10.1126/sciadv.1500831
Huang, S. P., Chiou, C. R., Lin, T. E., Tu, M. C., Lin, C. C., and Porter, W. P. (2013). Future advantages in energetics, activity time, and habitats predicted in a high-altitude pit viper with climate warming. Funct. Ecol. 27, 446–458. doi: 10.1111/1365-2435.12040
Huey, B., and Stevenson, R. D. (1979). Integrating thermal physiology and ecology of ectotherms: a discussion of approaches. Am. Zool. 19, 357–366. doi: 10.1093/icb/19.1.357
Johnson, B. K., and Christensen, J. L. (1976). The food and food habits of Blanchard’s cricket frogs, Acris crepitans blanchardi (Amphibia, Anura, Hylidae), in Iowa. J. Herpetol. 10, 63–74. doi: 10.2307/1562786
Kearney, M., Phillips, B. L., Tracy, C. R., Christian, K. A., Betts, G., and Porter, W. P. (2008). Modelling species distributions without using species distributions: the cane toad in Australia under current and future climates. Ecography 31, 423–434. doi: 10.1111/j.0906-7590.2008.05457.x
Kearney, M., Porter, W. P., Williams, C., Ritchie, S., and Hoffmann, A. A. (2009). Integrating biophysical models and evolutionary theory to predict climatic impacts on species’ ranges: the dengue mosquito Aedes aegypti in Australia. Funct. Ecol. 23, 528–538. doi: 10.1111/j.1365-2435.2008.01538.x
Lannoo, M. J., Petersen, C., Lovich, R. E., Nanjappa, P., Phillips, C., Mitchell, J. C., et al. (2011). Do frogs get their kicks on Route 66? Continental U.S. transect reveals spatial and temporal patterns of Batrachochytrium dendrobatidis infection. PLoS One 6:e22211. doi: 10.1371/journal.pone.0022211
Lehtinen, R. (2002). A historical study of the distribution of Blanchard’s cricket frog (Acris crepitans blanchardi) in Southeastern Michigan. Herpetol. Rev. 33, 194–197.
Lehtinen, R., and MacDonald, M. C. (2011). Live fast, die young? A six-year field study of longevity and survivorship in Blanchard’s cricket frog (Acris crepitans blanchardi). Herpetol. Rev. 2011, 504–507.
Lehtinen, R., and Skinner, A. (2006). The enigmatic decline of Blanchard’s cricket frog (Acris crepitans blanchardi): a test of the habitat acidification hypothesis. Copeia 2006, 159–167. doi: 10.1643/0045-8511(2006)6[159:tedobc]2.0.co;2
Lehtinen, R., and Witter, J. R. (2014). Detecting frogs and detecting declines: an examination of occupancy and turnover patterns at the range edge of Blanchard’s cricket frog (Acris blanchardi). Herpetol. Conserv. Biol. 9, 502–515.
Lips, K. R., Diffendorfer, J., Mendelson, J. R., and Sears, M. W. (2008). Riding the wave: reconciling the roles of disease and climate change in amphibian declines. PLoS Biol. 6:e0060072. doi: 10.1371/journal.pbio.0060072
Long, R. A., Bowyer, R. T., Porter, W. P., Mathewson, P., Monteith, K. L., and Kie, J. G. (2014). Behavior and nutritional condition buffer a large-bodied endotherm against direct and indirect effects of climate. Ecol. Monogr. 84, 513–532. doi: 10.1890/13-1273.1
Lötters, S., Kielgast, J., Bielby, J., Schmidtlein, S., Bosch, J., Veith, M., et al. (2009). The link between rapid enigmatic amphibian decline and the globally emerging chytrid fungus. EcoHealth 6, 358–372. doi: 10.1007/s10393-010-0281-6
McCallum, M. L., Brooks, C., Mason, R., and Trauth, S. E. (2011). Growth, reproduction, and life span in Blanchard’s cricket frog (Acris blanchardi) with notes on the growth of the Northern cricket frog (Acris crepitans). Herpetol. Notes 4, 025–035.
McCullough, E. C., and Porter, W. P. (1971). Computing clear day solar radiation spectra for the terrestrial ecological environment. Ecology 52, 1008–1015. doi: 10.2307/1933806
Murray, K. A., Skerratt, L. F., Garland, S., Kriticos, D., and McCallum, H. (2013). Whether the weather drives patterns of endemic amphibian chytridiomycosis: a pathogen proliferation approach. PLoS One 8:e61061. doi: 10.1371/journal.pone.0061061
Navas, C. A., and Araujo, C. (2000). The use of agar models to study amphibian thermal ecology. J. Herpetol. 34, 330–334. doi: 10.2307/1565438
New, M., Lister, D., Hulme, M., and Makin, I. (2002). A high-resolution dataset of surface climate over global land areas. Clim. Res. 21, 1–25. doi: 10.3354/cr021001
Nowakowski, J. A., Watling, J. I., Whitfield, S. M., Todd, B. D., Kurz, D. J., and Donnelly, M. A. (2017). Tropical amphibians in shifting thermal landscapes under land-use and climate change. Conserv. Biol. 31, 96–105. doi: 10.1111/cobi.12769
Ouellet, M., Mikaelian, I., Pauli, B. D., Rodrigue, J., and Green, D. M. (2005). Historical evidence of widespread chytrid infection in North American amphibian populations. Conserv. Biol. 19, 1431–1440. doi: 10.1111/j.1523-1739.2005.00108.x
Petersen, C. E., Lovich, R. E., Phillips, C. A., Dreslik, M. J., and Lannoo, M. J. (2016). Prevalence and seasonality of the amphibian chytrid fungus Batrachochytrium dendrobatidis along widely separated longitudes across the United States. EcoHealth 13, 368–382. doi: 10.1007/s10393-016-1101-4
Porter, W. P., and Mitchell, J. W. (2006). Method and System for Calculating the Spatial-Temporal Effects of Climate and Other Environmental Conditions on Animals. Madison: Wisconsin Alumni Research Foundation.
Prism Climate Group (2004). Oregon State University. Available online at: http://prism.oregonstate.edu (accessed January, 2017).
Puschendorf, R., Carnaval, A. C., Vanderwal, J., Zumbado-Ulate, H., Chaves, G., Bolaños, F., et al. (2009). Distribution models for the amphibian chytrid Batrachochytrium dendrobatidis in Costa Rica: proposing climatic refuges as a conservation tool. Divers. Distrib. 15, 401–408. doi: 10.1111/j.1472-4642.2008.00548.x
Puschendorf, R., Hoskin, C. J., Cashins, S. D., Mcdonald, K., Skerratt, L. F., Vanderwal, J., et al. (2011). Environmental refuge from disease-driven amphibian extinction. Conserv. Biol. 25, 956–964. doi: 10.1111/j.1523-1739.2011.01728.x
R Core Team (2017). R: A Language and Environment for Statistical Computing. Vienna: R Foundation for Statistical Computing.
Richards-Zawacki, C. L. (2010). Thermoregulatory behaviour affects prevalence of chytrid fungal infection in a wild population of Panamanian golden frogs. Proc. R. Soc. Lond. Ser. B 277, 519–528. doi: 10.1098/rspb.2009.1656
Robak, M. J., Reinert, L. K., Rollins-Smith, L. A., and Richards-Zawacki, C. L. (2019). Out in the cold and sick: low temperatures and fungal infections impair a frog’s skin defenses. J. Exp. Biol. 222:jeb209445. doi: 10.1242/jeb.209445
Robak, M. J., and Richards-Zawacki, C. L. (2018). Temperature-dependent effects of cutaneous bacteria on a frog’s tolerance of fungal infection. Front. Microbiol. 9:410. doi: 10.3389/fmicb.2018.00410
Rödder, D., Kielgast, J., and Lötters, S. (2010). Future potential distribution of the emerging amphibian chytrid fungus under anthropogenic climate change. Dis. Aquat. Organ. 92, 201–207. doi: 10.3354/dao02197
Ron, S. R. (2005). Predicting the distribution of the amphibian pathogen Batrachochytrium dendrobatidis in the New World. Biotropica 37, 209–221. doi: 10.1111/j.1744-7429.2005.00028.x
Rothermel, B. B., Walls, S. C., Mitchell, J. C., Dodd, C. K., Irwin, L. K., Green, D. E., et al. (2008). Widespread occurrence of the amphibian chytrid fungus Batrachochytrium dendrobatidis in the southeastern USA. Dis. Aquat. Organ. 82, 3–18. doi: 10.3354/dao01974
Rowley, J. J. L., and Alford, R. A. (2013). Hot bodies protect amphibians against chytrid infection in nature. Sci. Rep. 3:1515.
Roznik, E. A., and Alford, R. A. (2014). Using pairs of physiological models to estimate temporal variation in amphibian body temperature. J. Therm. Biol. 45, 22–29. doi: 10.1016/j.jtherbio.2014.07.005
Ruiz-Moreno, D., Willis, B. L., Page, A. C., Weil, E., Cróquer, A., Vargas-Angel, B., et al. (2012). Global coral disease prevalence associated with sea temperature anomalies and local factors. Dis. Aquat. Organ. 100, 249–261. doi: 10.3354/dao02488
Sauer, E. L., Fuller, R. C., Richards-Zawacki, C. L., Sonn, J., Sperry, J. H., and Rohr, J. R. (2018). Variation in individual temperature preference, not behavioral fever, affects susceptibility to chytridiomycosis in amphibians. Proc. R. Soc. Lond. Ser. B 285:20181111. doi: 10.1098/rspb.2018.1111
Scheele, B. C., Pasmans, F., Skerratt, L. F., Berger, L., Martel, A., Beukema, W., et al. (2019). Amphibian fungal panzootic causes catastrophic and ongoing loss of biodiversity. Science 363, 1459–1463. doi: 10.1126/science.aav0379
Smith, G. R., Todd, A., Rettig, J. E., and Nelson, F. (2003). Microhabitat selection by Northern cricket frogs (Acris crepitans) along a West-Central Missouri creek: field and experimental observations. J. Herpetol. 37, 383–385. doi: 10.1670/0022-1511(2003)037[0383:MSBNCF]2.0.CO;2
Sonn, J. M., Berman, S., and Richards-Zawacki, C. L. (2017). The influence of temperature on chytridiomycosis in vivo. EcoHealth 14, 762–770. doi: 10.1007/s10393-017-1269-2
Sonn, J. M., Utz, R. M., and Richards-Zawacki, C. L. (2019). Effects of latitudinal, seasonal, and daily temperature variations on chytrid fungal infections in a North American frog. Ecosphere 10:e02892.
Steiner, S. L., and Lehtinen, R. M. (2008). Occurrence of the amphibian pathogen Batrachochytrium dendrobatidis in Blanchard’s cricket frog (Acris crepitans blanchardi) in the U.S. Midwest. Herpetol. Rev. 39, 193–196.
Tracy, C. R. (1976). A model of the dynamic exchanges of water and energy between a terrestrial amphibian and its environment. Ecol. Monogr. 46, 293–326. doi: 10.2307/1942256
Voyles, J., Johnson, L. R., Rohr, J., Kelly, R., Barron, C., Miller, D., et al. (2017). Diversity in growth patterns among strains of the lethal fungal pathogen Batrachochytrium dendrobatidis across extended thermal optima. Oecologia 184, 363–373. doi: 10.1007/s00442-017-3866-8
Wake, D. B., and Vredenburg, V. T. (2008). Are we in the midst of the sixth mass extinction? A view from the world of amphibians. Proc. Natl. Acad. Sci. U.S.A. 105, 11466–11473. doi: 10.1073/pnas.0801921105
Woodhams, D. C., and Alford, R. A. (2005). Ecology of chytridiomycosis in rainforest stream frog assemblages of tropical queensland. Conserv. Biol. 19, 1449–1459. doi: 10.1111/j.1523-1739.2005.004403.x
Wright, A. H., and Wright, A. A. (1949). Handbook of Frogs and Toads of the United States and Canada. Ithaca, NY: Comstock Publishing Co.
Keywords: amphibian declines, biophysical model, chytridiomycosis, disease ecology, host-pathogen interaction, Niche Mapper, outbreak, thermal model
Citation: Sonn JM, Porter WP, Mathewson PD and Richards-Zawacki CL (2020) Predictions of Disease Risk in Space and Time Based on the Thermal Physiology of an Amphibian Host-Pathogen Interaction. Front. Ecol. Evol. 8:576065. doi: 10.3389/fevo.2020.576065
Received: 26 June 2020; Accepted: 17 November 2020;
Published: 04 December 2020.
Edited by:
Michael Sears, Clemson University, United StatesReviewed by:
Lin Zhang, Hangzhou Normal University, ChinaInger Suzanne Prange, Appalachian Wildlife Research Institute (United States), United States
Copyright © 2020 Sonn, Porter, Mathewson and Richards-Zawacki. This is an open-access article distributed under the terms of the Creative Commons Attribution License (CC BY). The use, distribution or reproduction in other forums is permitted, provided the original author(s) and the copyright owner(s) are credited and that the original publication in this journal is cited, in accordance with accepted academic practice. No use, distribution or reproduction is permitted which does not comply with these terms.
*Correspondence: Corinne L. Richards-Zawacki, cori.zawacki@pitt.edu