Genetic and Environmental Indicators of Climate Change Vulnerability for Desert Bighorn Sheep
 Tyler G. Creech1*†
  Clinton W. Epps1
  John D. Wehausen2 Rachel S. Crowhurst1 Jef R. Jaeger3 Kathleen Longshore4 Brandon Holton5 William B. Sloan6 Ryan J. Monello7
- 1Department of Fisheries and Wildlife, Oregon State University, Corvallis, OR, United States
- 2White Mountain Research Center, University of California, Bishop, CA, United States
- 3School of Life Sciences, University of Nevada, Las Vegas, Las Vegas, NV, United States
- 4Western Ecological Research Center, U.S. Geological Survey, Henderson, NV, United States
- 5Grand Canyon National Park, National Park Service, Grand Canyon, AZ, United States
- 6Southeast Utah Group, National Park Service, Moab, UT, United States
- 7Pacific Island Network, Inventory and Monitoring Program, National Park Service, Hawaii National Park, Hawaii, HI, United States
Assessments of organisms’ vulnerability to potential climatic shifts are increasingly common. Such assessments are often conducted at the species level and focused primarily on the magnitude of anticipated climate change (i.e., climate exposure). However, wildlife management would benefit from population-level assessments that also incorporate measures of local or regional potential for organismal adaptation to change. Estimates of genetic diversity, gene flow, and landscape connectivity can address this need and complement climate exposure estimates to establish management priorities at broad to local scales. We provide an example of this holistic approach for desert bighorn sheep (Ovis canadensis nelsoni) within and surrounding lands administered by the U.S. National Park Service. We used genetic and environmental data from 62 populations across the southwestern U.S. to delineate genetic structure, evaluate relationships between genetic diversity and isolation, and estimate relative climate vulnerability for populations as a function of five variables associated with species’ responses to climate change: genetic diversity, genetic isolation, geographic isolation, forward climate velocity within a population’s habitat patch (a measure of geographic movement rate required for an organism to maintain constant climate conditions), and maximum elevation within the habitat patch (a measure of current climate stress, as lower maximum elevation is associated with higher temperature, lower precipitation, and lower population persistence). Genetic structure analyses revealed a high-level division between populations in southeastern Utah and populations in the remainder of the study area, which were further differentiated into four lower-level genetic clusters. Genetic diversity decreased with population isolation, whereas genetic differentiation increased, but these patterns were stronger for native populations than for translocated populations. Populations exhibited large variation in predicted vulnerability across the study area with respect to all variables, but native populations occupying relatively intact landscapes, such as Death Valley and Grand Canyon national parks, had the lowest overall vulnerability. These results provide local and regional context for conservation and management decisions regarding bighorn populations in a changing climate. Our study further demonstrates how assessments combining multiple factors could allow a more integrated response, such as increasing efforts to maintain connectivity and thus potential for adaptation in areas experiencing rapid climate change.
Introduction
As evidence for the effects of climate change on biodiversity accumulates (Parmesan and Yohe, 2003; Bellard et al., 2012; Wiens, 2016), assessments of species’ vulnerability to predicted climatic shifts have become increasingly common (Chapman et al., 2014). By providing information on species’ exposure (the magnitude of climate change experienced), sensitivity (the degree to which fitness is affected by a given change in climate), and adaptive capacity (the potential to persist in situ or shift ranges), such assessments can improve our understanding of responses and inform high-level decisions about conserving biodiversity (Dawson et al., 2011). Natural resource agencies are increasingly considering climate vulnerability in management plans (Johnson, 2014; Halofsky et al., 2015; Staudinger et al., 2015), but there are two common characteristics of climate vulnerability assessments that may limit their utility for informing management strategies.
First, climate vulnerability assessments are typically conducted at the species level (Pearson et al., 2014; Pacifici et al., 2015; Urban, 2015), but many of the management decisions that most directly influence species are made at the population level. Natural resource managers must consider how to allocate agency resources among populations within their jurisdiction, and population-level assessments are especially relevant for broadly distributed species of conservation concern because populations are extirpated before species go extinct (Razgour et al., 2018). There is increasing evidence that climate vulnerability can vary considerably among populations (Bay et al., 2018; Razgour et al., 2019) and that failure to consider intraspecific variation can lead to misleading predictions regarding the overall climate vulnerability of a species (D’Amen et al., 2013; Schwalm et al., 2016; Razgour et al., 2019).
Second, vulnerability assessments tend to focus on climate exposure while overlooking other components of vulnerability, such as adaptive capacity (Butt et al., 2016). Assessments often rely on correlative modeling approaches (e.g., ecological niche, bioclimatic envelope, or species distribution models) that use associations between known species occurrences and climatic or other environmental variables to predict the distributions of species across geographic space (Wiens et al., 2009; Anderson, 2013; Porfirio et al., 2014; Foden et al., 2019). These models can be coupled with climate projections to infer climate exposure based on predicted changes in geographic distribution or habitat suitability (Araújo and Peterson, 2012; Foden et al., 2019). However, such assessments typically do not account for the ability of species to adjust to novel climatic conditions via evolutionary adaptation and phenotypic plasticity (Merilä and Hendry, 2014), which can be difficult to measure but potentially critical for understanding how climate change affects species (but see Bush et al., 2016; Razgour et al., 2019). Correlative approaches also rarely consider how effects of climate change on species distribution or persistence may depend on habitat connectivity or changes in landscape configuration (Brooker et al., 2007). These limitations suggest that a more multi-faceted approach to vulnerability assessment may be needed to establish population-level management priorities that better reflect the range of factors influencing vulnerability (Hoban, 2018; Razgour et al., 2018).
Genetic information can inform vulnerability assessments by characterizing the potential for evolutionary adaptation to climate change (Carroll et al., 2014), although whether specific populations can evolve climate-sensitive traits is rarely known (Urban et al., 2016). In the absence of that knowledge, other relevant questions may be addressed with genetic data. (1) How genetically diverse are populations? Genetic diversity is positively correlated with population fitness and persistence for many species (Reed and Frankham, 2003; Frankham, 2005), albeit not universally (Linløkken, 2018), and the amount of standing genetic variation in populations is thought to be the best indicator of their potential for contemporary evolution in response to climate change (Hendry et al., 2011; Sgro et al., 2011). (2) How is genetic variation distributed among populations? Genetically unique populations may be particularly valuable for maintaining species-level evolutionary potential (Petit et al., 2008), and identifying unique populations allows them to be managed as distinct taxa potentially adapted to different local environments (Buchalski et al., 2016). Neutral genetic variation also has been used to distinguish phylogenetic lineages and analyze potential climate-mediated range shifts under the assumption that different lineages likely contain different adaptive diversity (Ikeda et al., 2017), although that approach has been challenged (Smith et al., 2019). (3) How connected are populations via gene flow? Genetic isolation (or conversely, connectivity) of populations may be especially influential for evolutionary adaptation to climate change. Gene flow with neighboring populations can help maintain genetic variation upon which selection acts and can introduce adaptive alleles or gene combinations that confer fitness benefits in novel environments (Sexton et al., 2011). For small, fragmented populations in which effects of genetic drift are strong, gene flow facilitated by connectivity with neighboring populations is likely to be particularly important for both maintaining genetic diversity and allowing spread of alleles conveying fitness advantage (Epps et al., 2005; Creech et al., 2017).
Genetic measures of isolation provide estimates of connectivity and genetic structure, as well as variation in genetic diversity (Hedgecock et al., 2007; Lowe and Allendorf, 2010; Meirmans and Hedrick, 2011). However, genetic measures of isolation may become decoupled from landscape-based measures of isolation as a result of wildlife translocations (Malaney et al., 2015; Jahner et al., 2019) or rapid landscape change (Epps and Keyghobadi, 2015). Consequently, genetic-based isolation measures may poorly reflect the degree to which populations are linked via natural dispersal and subsequent gene flow with neighboring populations in the contemporary landscape. In such cases, spatial measures of population isolation may be more useful, such as landscape resistance modeling (Epps et al., 2007; Chetkiewicz and Boyce, 2009) or even Euclidean distance among habitat patches (Prugh, 2009).
As a case study, we illustrate how genetic and environmental data can be combined to assess population-level vulnerability and inform management priorities for desert bighorn sheep (Ovis canadensis nelsoni) within and surrounding lands administered by the U.S. National Park Service (NPS). Desert bighorn sheep, one of three subspecies of North American bighorn sheep (Wehausen and Ramey, 2000), range across the southwestern U.S. and northern Mexico. Bighorn are habitat specialists that rely on steeply sloped, rugged terrain with sparse vegetation and good visibility to detect and evade predators (Gionfriddo and Krausman, 1986; Sappington et al., 2007). Much of the best remaining habitat and many of the largest populations of desert bighorn are located on federal lands, including lands managed by NPS (Figure 1), and these federal lands have greater exposure to climate change than the U.S. as a whole (Gonzalez et al., 2018). Bighorn population dynamics are closely tied to temperature and precipitation patterns (Wehausen et al., 1987; Douglas, 2001; Epps et al., 2004; Bender and Weisenberger, 2005). Projected changes to the climate of the southwestern U.S. during this century include higher annual average temperatures, longer and hotter summer heat waves, reduced winter and spring precipitation, less reliable surface water supply, and more frequent and severe droughts (Garfin et al., 2014). If manifested, such climatic changes could negatively affect bighorn sheep populations by increasing physiological stress or by reducing availability of forage or water. Yet, evaluating the effect of these changes using a correlative approach would be challenging because of the definitive influence of landscape configuration and isolation on genetic diversity and gene flow of bighorn populations (Epps et al., 2005, 2006; Creech et al., 2017). Moreover, potential climate-related adaptive variation among desert bighorn sheep populations has been identified (Buchalski et al., unpublished) that suggests responses may differ in different habitats.
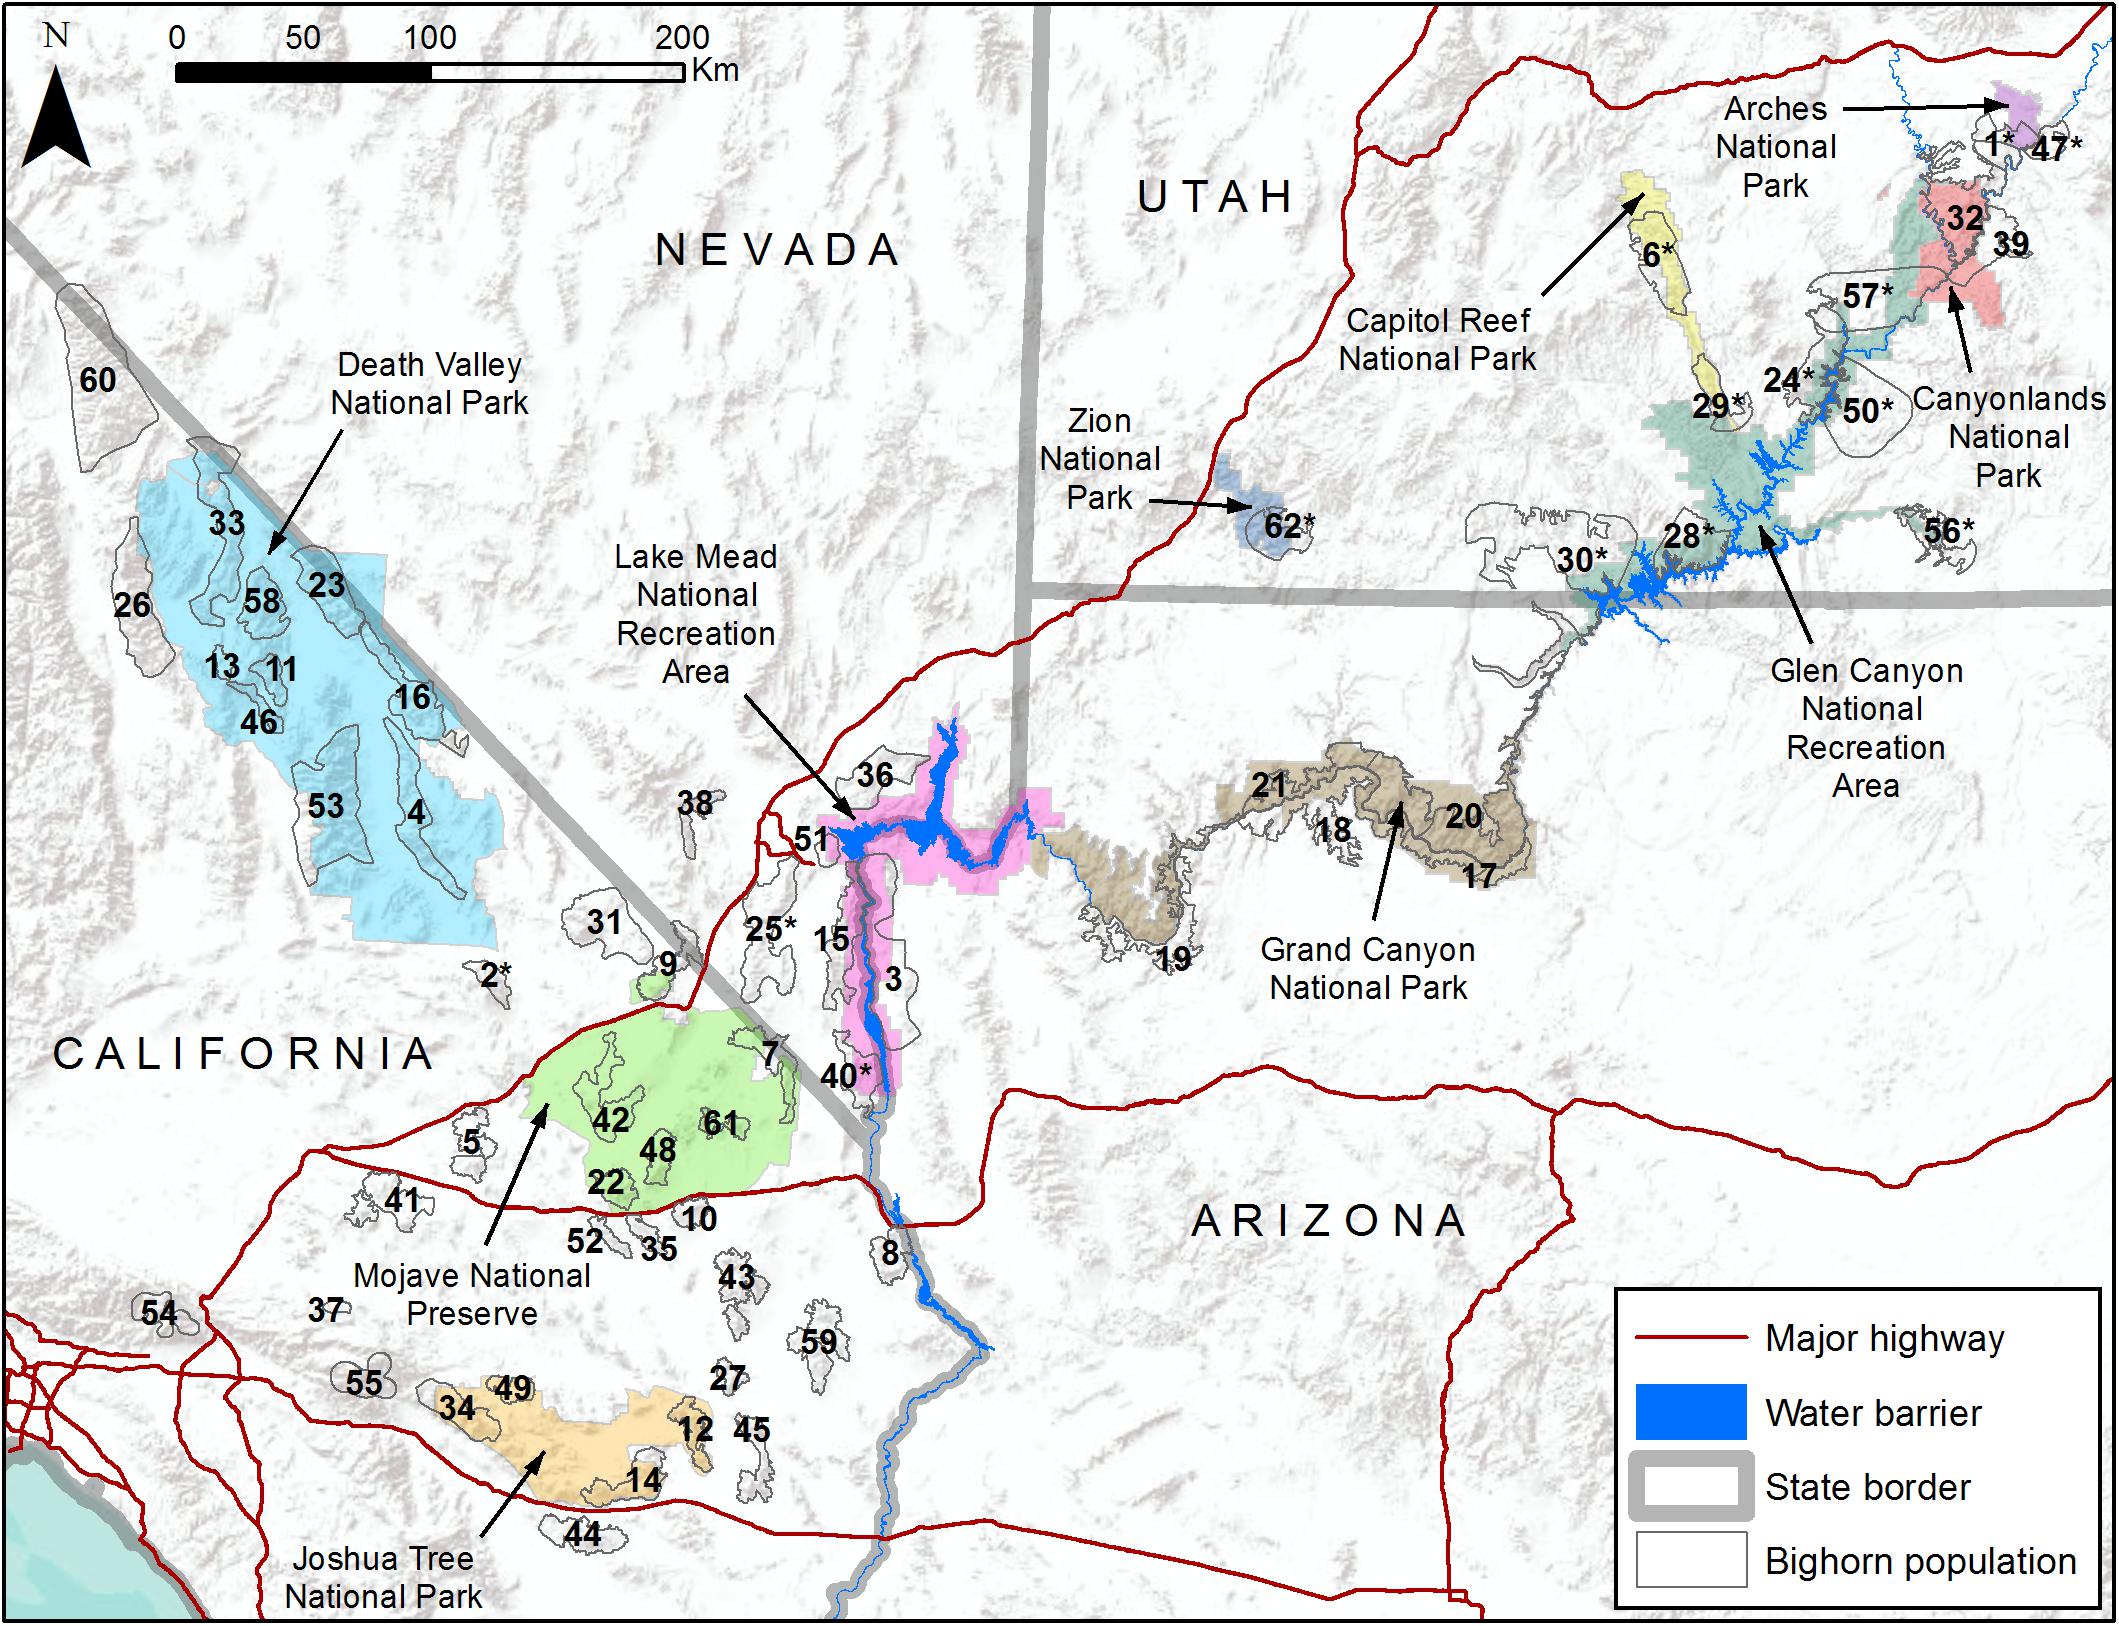
Figure 1. Map of study area including 10 National Park Service units (colored polygons) and 62 desert bighorn sheep populations (numbered hollow gray polygons). See Table 1 for names of populations associated with numbered polygons.
We developed an extensive genetic dataset for desert bighorn sheep across 10 NPS units and surrounding lands, and we used population-level measures of genetic diversity and region-wide analyses of genetic structure and gene flow to estimate relative capacity of populations to cope with climate change via evolutionary adaptation. We complemented genetic analyses with estimates of population isolation based on empirically derived landscape resistance models, which may better characterize isolation of desert bighorn populations with a history of translocation. We estimated climate exposure of populations using a species-neutral climate change metric (forward climate velocity; Loarie et al., 2009) and an environmental variable associated with persistence probability of desert bighorn populations (maximum elevation of habitat patch; Epps et al., 2004).
We took advantage of the history of population augmentation and reintroduction efforts for desert bighorn sheep in portions of our study area to explore the influence of translocations on genetic diversity and genetic structure. We expected that translocated populations would not be in genetic equilibrium with nearby populations because their genetic makeup would reflect influences of the artificial movements of individuals from potentially distant populations, rather than (or in addition to) influences of natural gene flow with neighboring populations constrained by landscape characteristics and time. Because of this expected decoupling of geographic influences from gene flow and resulting genetic diversity in translocated populations, we predicted that: (1) populations that were more geographically isolated (i.e., further from neighboring populations) would have lower genetic diversity, but this negative relationship would be stronger for native than for translocated populations; (2) populations that were more genetically isolated (i.e., more genetically differentiated from nearby populations) would have lower genetic diversity, but this negative relationship would be stronger for native than for translocated populations; and (3) populations that were more geographically isolated would be more genetically isolated, but this positive relationship would be stronger for native than for translocated populations.
Finally, we considered the implications of our results for management of desert bighorn sheep, including how the information from this study could contribute to assessments of the relative vulnerability of desert bighorn populations to climate change effects.
Materials and Methods
Study Area
The study area encompassed 10 NPS units and adjacent lands (e.g., state lands, Bureau of Land Management lands, U.S. Forest Service lands, or Indian reservations) that contained bighorn populations likely to interact with those on NPS lands (Figure 1). This study area included the majority of desert bighorn sheep on NPS lands and was heterogeneous with respect to many landscape characteristics that influence bighorn sheep. In all areas, bighorn habitat was defined by steep terrain and proximity to reliable surface water. However, the configuration of such habitat varied considerably, including areas where habitat was very discretely distributed (e.g., the Mojave Desert) and areas where habitat was relatively continuous (e.g., the Grand Canyon area). Three arid regions with different climate regimes and biota were represented: the Mojave and Sonoran deserts and the Colorado Plateau (Bender, 1982). In most areas the landscape was minimally altered by anthropogenic development (urbanization, highways, mining, water impoundments, etc.), but the extent of developments was greatest in southern California and Nevada. The degree to which population history of bighorn sheep had been directly influenced by management actions also varied. Populations in California, Arizona, and southern Nevada were predominately native, while Utah contained many populations that were reintroduced during the past half century using individuals sourced from distant areas in some cases (Epps et al., 2003; Utah Division of Wildlife Resources, 2013; Wild Sheep Working Group, 2015; Jahner et al., 2019).
Genetic Sampling and Genotyping Methods
We primarily used non-invasive sampling of fecal pellets to obtain DNA from individuals (Wehausen et al., 2004) and combined genetic datasets from multiple projects covering different portions of the study area. Populations were sampled during 2000–2003 in the southern Mojave Desert (Epps et al., 2006), 2003–2007 in southern Nevada and near Lake Mead (Jaeger and Wehausen, 2012), and 2003–2013 in Death Valley National Park and surrounding habitat. These sampling efforts generally targeted waterholes where bighorn sheep congregated during the summer months. Populations in northern Arizona and southern Utah were sampled during 2011–2014 with survey, radiotelemetry, and sightings data from state wildlife agencies and NPS used to identify areas in which to focus efforts. DNA sources also included a small number of blood and tissue samples (<5% of all samples) collected from carcasses discovered in the field or contributed by managing agencies, including California Department of Fish and Wildlife, Nevada Department of Wildlife, Arizona Game and Fish Department, U.S. Geological Survey, and NPS. Differences in sampling periods among populations were unlikely to significantly influence our findings because (1) dynamics of genetic structure and diversity operate on a generational basis, and the 14-year period between the earliest and latest sampling efforts represented only approximately two bighorn generations, (2) no major changes to the landscape (e.g., highway or dam construction) occurred during this period that would strongly impact gene flow, and (3) follow-up research on a subset of Mojave Desert populations showed no significant changes in genetic diversity over the course of a ∼12-year period (Epps et al., 2018).
Samples were processed and genotyped in three different laboratories (corresponding to the different projects) using similar techniques. Each lab genotyped samples at a slightly different set of neutral or neutral-acting microsatellite loci (14–17 loci per sample, depending on the laboratory, with 10 loci common to all laboratories). Nickerson (2014) tested both linked and putatively neutral loci for evidence of selection in bighorn populations within the Mojave Desert region using outlier tests, and only locus BL4 (linked to interferon gamma gene) showed potential evidence of positive selection. Evaluation of later BL4 data in the Mojave region (Epps et al., 2018) showed that the signal of positive selection for BL4 was transitory (i.e., no longer present two bighorn sheep generations later). Due to the high strength of genetic drift in these small populations (Creech et al., 2017), even loci linked to known genes largely reflect patterns at putatively neutral loci (Nickerson, 2014). To realign allele sizes for consistency across laboratories, we genotyped a small subset of samples at each locus used by multiple laboratories and translated all allele sizes to match those used in the most recent project. A full description of genetic laboratory protocols for the most recent project (samples from 2011 to 2014) can be found in Supplementary Material, and protocols for earlier projects can be found in Epps et al. (2006) and Jaeger and Wehausen (2012).
Defining Populations and Habitat Polygons
We grouped individuals into populations based on the location where they were sampled, then created an associated habitat polygon representing the geographic area inhabited by each population for use in spatially explicit analyses. In the Mojave and Sonoran deserts (southern California, southern Nevada, and southwestern Arizona) habitat was generally distributed in discrete patches of steeply sloped terrain separated by broad valleys, which made assigning individuals to populations and mapping associated habitat polygons relatively straightforward. We used a 10% slope cutoff to establish the boundaries of habitat polygons in these regions (Epps et al., 2007) and relied on expert opinion to modify polygon boundaries in areas where this cutoff did not accurately represent the extent of habitat known to be used by a population.
In the Colorado Plateau region (northern Arizona, southern and southeastern Utah) habitat was more continuously distributed and establishing populations and habitat polygon boundaries was less straightforward. We defined populations based on the spatial clustering of individuals (i.e., groups of samples whose locations were clearly separated from other groups) and used the spatially explicit genetic clustering program GENELAND (Guillot et al., 2005) to assign individuals to populations when we were unsure of population boundaries. After establishing populations, we created habitat polygons by generating a minimum convex polygon (MCP) from sample locations, adding a 10 km buffer to reflect the likely use of areas beyond the MCP, and removing areas inside the buffered MCP that were not suitable habitat (e.g., flat terrain, water bodies).
We used bighorn sheep translocation records from the Western Association of Fish and Wildlife Agencies (Wild Sheep Working Group, 2015) to determine whether populations were native or had a history of translocation (reintroduction or augmentation with individuals from other populations) to aid in interpretation of genetic structure results.
Genetic Structure
Individuals were distributed relatively continuously rather than in discrete populations in portions of our study area, and preliminary analyses suggested a pattern of genetic isolation by distance (Supplementary Figure S1) that could produce misleading patterns of genetic structure (Kalinowski, 2011; Janes et al., 2017; Perez et al., 2018) when analyzed using common Bayesian clustering algorithms such as STRUCTURE (Pritchard et al., 2000). We therefore relied on two analytical methods expected to perform more reliably when applied to genetic datasets that deviate from the classic island model of population structure. First, we used discriminant analysis of principal components (DAPC), a multivariate method that summarizes between-group genetic differentiation while ignoring within-group variation and making no assumptions about the underlying population genetic model (Jombart et al., 2010). We conducted DAPC using the adegenet package (Jombart, 2008) for R (R Development Core Team, 2017) and determined the most likely number of genetic clusters using 20 replicate runs of K-means clustering. We used alpha-score optimization to determine the number of retained principal components that represented the best trade-off between discrimination power and overfitting. We used a scatterplot of the first two discriminant functions to assess relatedness between clusters and estimated population-level cluster assignment probabilities by averaging individual assignment probabilities for the most likely number of clusters. Initial results suggested a major genetic split between one cluster and all remaining clusters, and we repeated the analysis after excluding the divergent cluster to identify any additional hierarchical structure.
We used the clustering program TESS3 (Caye et al., 2018) as an alternative approach to determine genetic structure. This program requires no assumptions about linkage or Hardy-Weinberg equilibrium and can incorporate information on sample locations using a spatial regularization parameter λ that adjusts the strength of spatial dependence (i.e., the degree to which geographically proximate individuals are more likely than distant individuals to share ancestral genotypes). We considered λ values spanning a range of spatial dependence strengths, allowing the number of clusters (K) to vary from 1 to 20, with 50 replicates for each K-value. We retained the run with the lowest root mean squared error for each K-value and examined cross-validation plots based on a cross-entropy criterion (Frichot and François, 2015) to determine the optimal number of clusters for each λ value tested. All genetic structure analyses were run using a subset of our genetic data that included 10 loci used by all labs and for all geographic regions, thus avoiding potential bias in these analyses caused by missing data.
To confirm the pattern of isolation by distance among populations in our study area, we calculated geographic distances (Euclidean distances between centroids of populations’ habitat polygons) and genetic distances (Weir and Cockerham (1984) FST) for all pairs of populations. We then performed a Mantel test of the relationship between log-transformed geographic distance and linearized genetic distance (FST/[1-FST]; Rousset, 1997).
Genetic Diversity
We assessed genetic diversity using genotypes at neutral microsatellite loci. For each population we calculated allelic richness (Ar), the average number of alleles per locus after correcting for variation in sample sizes among populations, using rarefaction (Leberg, 2002) with a minimum sample size of six individuals. To facilitate comparisons with populations from other studies, we also calculated expected heterozygosity (He), a common genetic diversity metric that is insensitive to sample size. We used the gstudio package (Dyer, 2014) for R to calculate both metrics.
Isolation
We quantified the isolation of each population using both geographic (i.e., landscape) and genetic measures. We used both approaches because genetic differentiation metrics based on direct measures of gene flow among populations such as FST are strongly influenced by time lags, translocations, and other non-equilibrium situations. In particular, the extensive history of translocations in parts of the study area made FST a questionable indicator of natural gene flow among some populations, and thus of limited value for predicting how landscape structure will influence future population connectivity. We assessed geographic isolation using a landscape resistance-based approach rather than Euclidean distance to account for the fact that populations geographically close to each other but separated by terrain that is highly resistant to dispersal (e.g., broad valleys or highways) may be less connected than geographically distant populations separated by terrain that is favorable for dispersal. We used a resistance model previously developed for desert bighorn sheep in our study area that included a Gaussian effect of slope (where moderate slopes were less resistant than shallow or steep slopes) and strong barrier effects of major water bodies and interstate highways (Creech et al., 2017; Supplementary Material). Terrain ruggedness is also known to influence bighorn habitat use (Sappington et al., 2007) and potentially dispersal but was not included in the resistance model because it was very highly correlated with slope at the spatial resolution (∼100 m) at which the resistance model was developed. We used the model to calculate effective distance (a measure that combines geographic distance and relative habitat resistance) along the least-cost path between the borders of each pair of habitat polygons using Linkage Mapper version 1.1.1 (McRae and Kavanagh, 2011). We quantified geographic isolation of each population as the harmonic mean of effective distances to the nearest three neighboring populations (Epps et al., 2005). We then quantified genetic isolation of each population as the mean pairwise FST (Weir and Cockerham, 1984) with these three nearest neighboring populations determined by effective distances.
Relationships Among Genetic Diversity and Isolation Measures
We used simple linear regression to test our predictions that (1) native populations would show stronger negative relationships between genetic diversity and geographic isolation than translocated populations, and (2) native populations would show stronger negative relationships between genetic diversity and genetic isolation than translocated populations. For each combination of genetic diversity (allelic richness) and isolation measure (mean pairwise FST or mean effective distance to three nearest neighboring populations), we fit separate regression models for native (n = 48) and translocated (n = 14) populations. We also fit separate regression models of the relationship between genetic isolation and geographic isolation for native and translocated populations to determine whether the degree of concordance between these isolation measures was affected by translocations. We compared model r2 and P-values to determine the relative strength of relationships for the two types of populations.
Climate Change Exposure
We used forward climate velocity as an index of the relative exposure of bighorn populations to climate change (Carroll et al., 2015). Forward climate velocity is a measure of the local direction and speed of climate change that indicates how species would need to shift distributions to remain within climatic envelopes (Dobrowski et al., 2013; Hamann et al., 2015). It is a species-neutral measure of exposure that may serve as a useful alternative to more complex correlative models when climate variables influencing the geographic distribution of a species are poorly understood or are believed to vary across the range (Brito-Morales et al., 2018). We obtained gridded spatial data on forward climate velocity based on mean projections for the 2050s from an ensemble of 15 CMIP5 global climate models (AdaptWest Project, 2015). We considered two emissions scenarios: (1) RCP4.5, a moderate emissions scenario that assumes climate policies are able to stabilize climate change by 2100, and (2) RCP8.5, a high emissions scenario that assumes that greenhouse gas emissions continue to rise throughout the twenty-first century (van Vuuren et al., 2011). Climate velocities were derived from a principal component analysis of 11 biologically relevant climate variables, and thus represent predicted potential shifts in overall climate rather than shifts in any single climate variable. We believe this approach was suitable for assessing relative exposure of desert bighorn populations across a large geographic range because although temperature and precipitation are known to influence fitness of desert bighorn sheep, the specific climatic conditions to which bighorn are most sensitive are not fully understood and may vary geographically. For each emissions scenario, we calculated the mean forward climate velocity for grid cells within each population habitat polygon as an estimate of predicted exposure to climate change.
Additionally, we calculated the maximum elevation within each habitat polygon from a 10 m resolution digital elevation model as an indicator of the relative climate stress currently experienced by desert bighorn populations. Previous research in the Mojave Desert region of California found higher extinction risk and lower genetic diversity in populations occupying mountain ranges with lower maximum elevation, which is typically associated with higher temperature and less precipitation (Epps et al., 2004, 2006). We used simple linear regression to explore whether any relationship existed between patch-level estimates of the two measures of climate change exposure (forward climate velocity and maximum elevation).
Overall Vulnerability
To aid in interpretation of results across multiple variables related to climate vulnerability, we created an index of overall vulnerability. We converted population values for genetic diversity (using Ar values only), genetic isolation, geographic isolation, forward climate velocity (using RCP4.5 values only), and maximum elevation to percentiles, reversing the order of values as necessary to ensure that higher percentiles represented greater vulnerability for all variables. We then calculated the mean percentile across the five variables for each population as an index of that population’s overall vulnerability with respect to the components of vulnerability included in our analysis. We recognize that these components likely vary in their relative influence on overall vulnerability, but we assigned them equal weight as a potentially useful starting point for making comparisons among populations.
Results
We genotyped 1,652 individuals from 62 populations (Figure 1). DAPC results indicated that the most likely number of clusters varied from four to 28, with a modal value of 11 across replicate runs (Supplementary Figure S2), suggesting that the program had difficulty reliably determining the number of genetic clusters. We generated individual- and population-level assignment probabilities assuming K = 11, and results revealed a single cluster corresponding to populations in southeastern Utah that was differentiated from all other clusters further west (Figure 2, upper panel). Nine populations had highest assignment to this distinct cluster, including seven of the 14 translocated populations within our study area. When these nine populations comprising the distinct cluster were excluded from the dataset, reanalysis suggested that remaining populations comprised 10 clusters that were not highly distinct, with most populations showing strongly mixed assignment (Figure 2, lower panel).
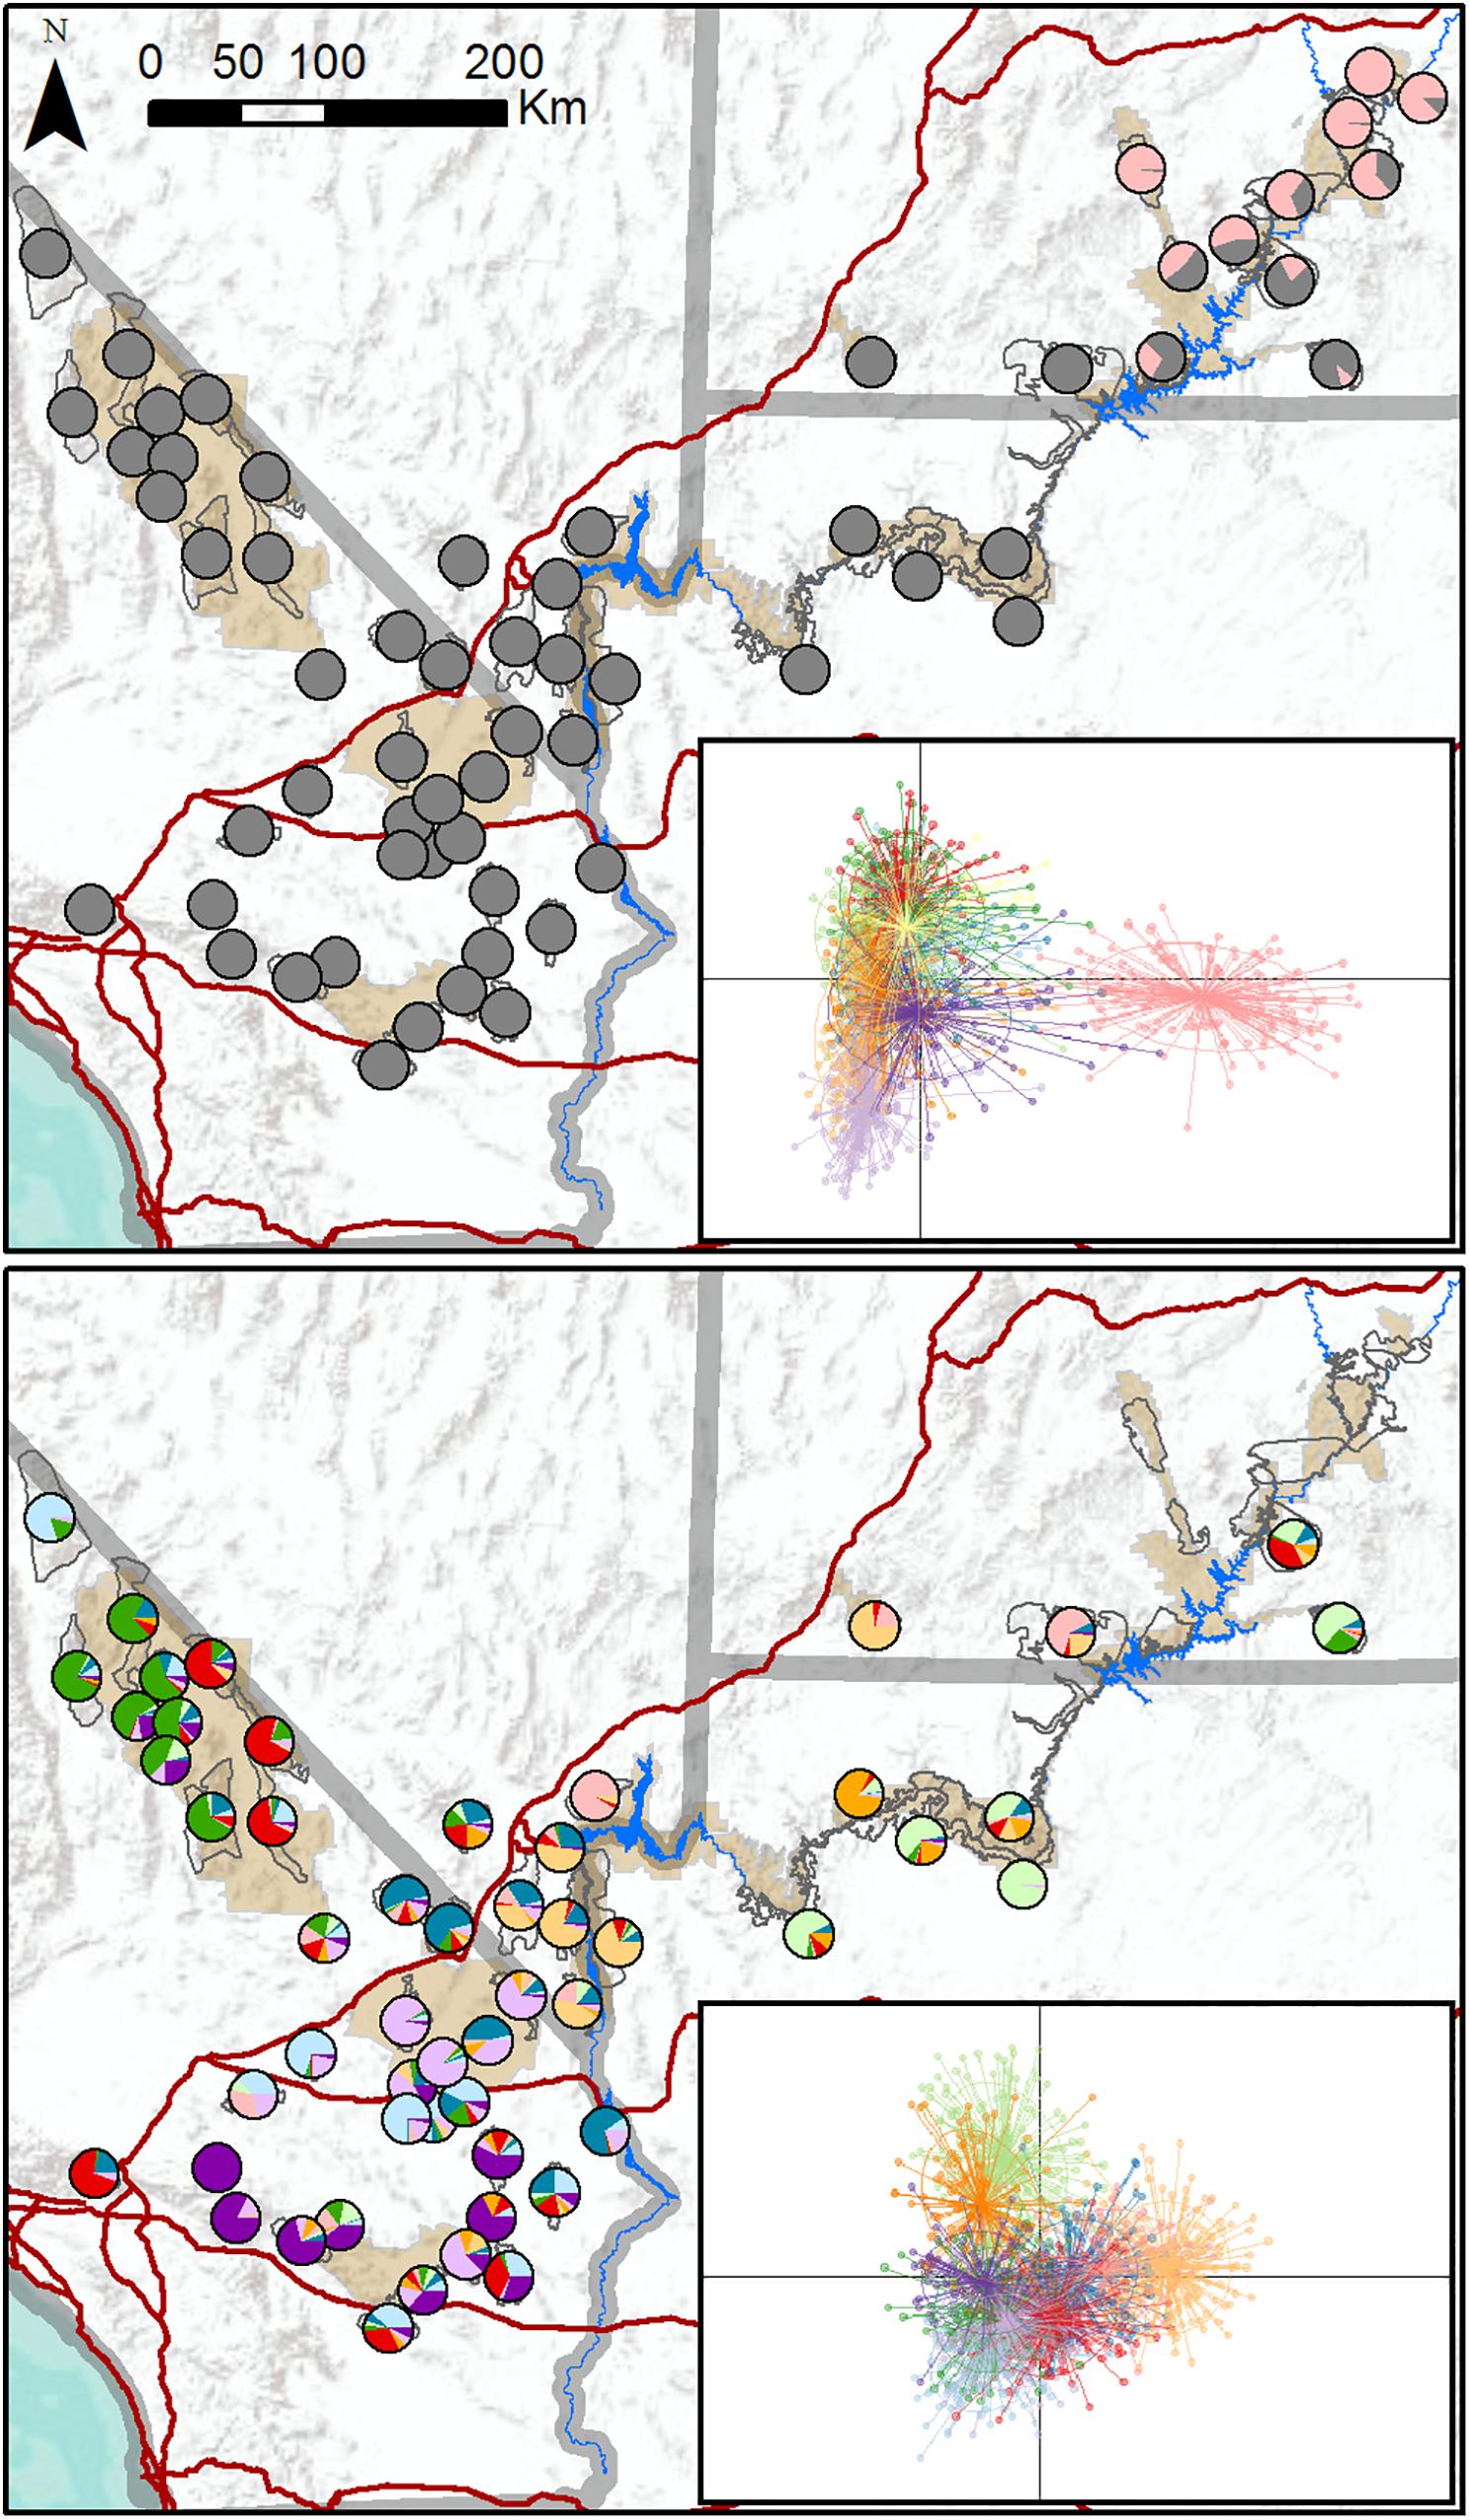
Figure 2. Maps of population assignments to genetic clusters from initial DAPC analysis of all 62 desert bighorn sheep populations in study area (upper panel), and from secondary DAPC analysis of further hierarchical structure after removing populations in southeastern Utah assigned to distinct cluster in initial analysis (lower panel). In pie charts in upper panel map, all clusters other than distinct southeastern Utah cluster are shown in gray to highlight key genetic division. Inset figures in each panel are scatterplots of first two principal component axes from DAPC analyses, with dots representing individuals, colors representing inferred clusters, and ellipses represent 67 percent confidence regions for clusters. Clusters with less overlap in scatterplot are more genetically distinct. Major water barriers and interstate highways are shown in dark blue and red, respectively, tan shaded areas show National Park Service units; and hollow gray polygons show habitat polygons associated with populations.
TESS3 results suggested that the most likely number of clusters was five, regardless of the strength of spatial dependence assumed by the model (Figure 3 and Supplementary Figure S3). Clusters roughly corresponded to the following geographic groupings: (1) southeastern Utah populations within and around Arches National Park (ARCH), Canyonlands National Park (CANY), Capitol Reef National Park (CARE), and Glen Canyon National Recreation Area (GLCA); (2) southern Nevada/western Arizona populations within and around Lake Mead National Recreation Area (LAKE), along with Zion National Park (ZION); (3) northern Arizona populations within and around Grand Canyon National Park (GRCA); (4) southern California populations north of Interstate 15, within and around Death Valley National Park (DEVA); and (5) southern California populations south of I-15, within and around Mojave National Preserve (MOJA) and Joshua Tree National Park (JOTR). Ancestry was mixed for most populations, with assignment probabilities of > 10 percent to two or more clusters (Figure 3), and the vast majority of individuals within populations also exhibited assignment probabilities of > 10% to multiple clusters (Supplementary Figure S4). Most populations with highest assignment to the southeastern Utah cluster, and nearly half of populations with highest assignment to the southern Nevada/western Arizona cluster, were translocated. Populations with highest assignment to the remaining clusters were almost exclusively native. A Mantel test confirmed that populations exhibited genetic isolation by distance across the study area (r = 0.21, p < 0.001).
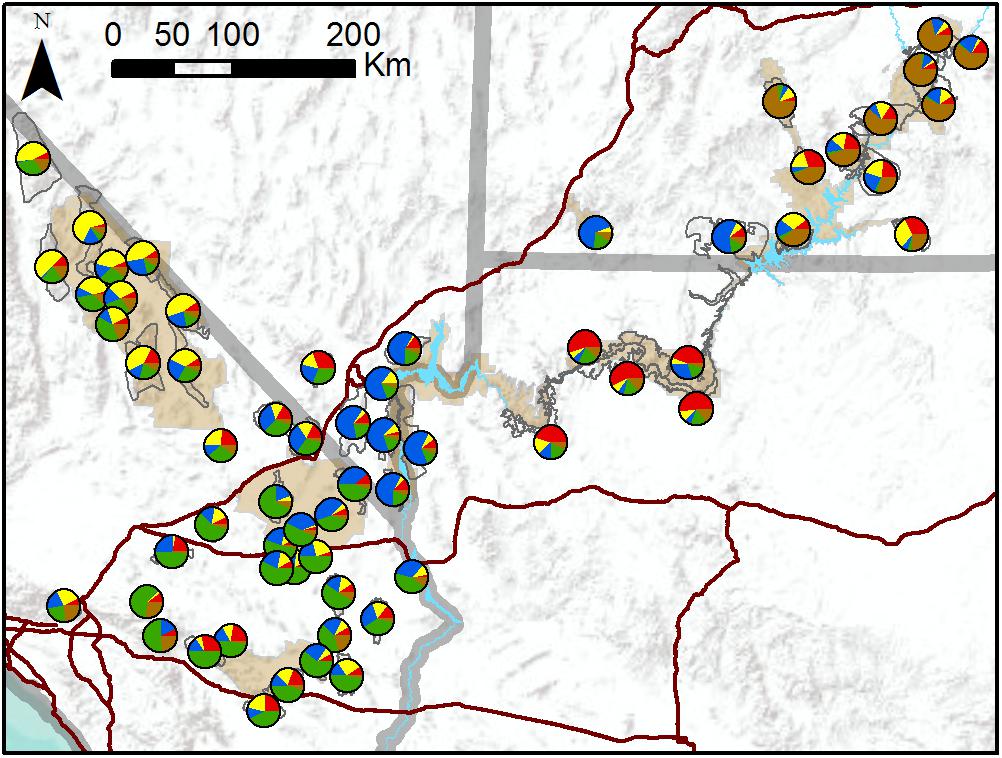
Figure 3. Map of population assignments to five genetic clusters from TESS3 analysis of all 62 desert bighorn sheep populations in study area. Major water barriers and interstate highways are shown in light blue and dark red, respectively, tan shaded areas show National Park Service units; and hollow gray polygons show habitat polygons associated with populations.
Allelic richness across the 62 populations ranged from 2.32 to 3.90 with a mean of 3.24, while expected heterozygosity ranged from 0.44 to 0.70 with a mean of 0.60 (Table 1). Ar and He of populations were highly correlated (r = 0.95). We focus henceforth on Ar results because Ar is sensitive to population bottlenecks and is considered a better indicator of evolutionary potential than other genetic diversity metrics (Leberg, 2002; Allendorf and Luikart, 2009). We observed the highest genetic diversity in populations located within or near eastern DEVA, LAKE, and GRCA (Figure 4A). Populations in southeastern Utah exhibited the lowest genetic diversity (especially the Arches-Gemini Bridges and Island in the Sky populations), as did many populations in the southern Mojave Desert (e.g., N. San Bernardino Mts./Cushenbury Mts., Newberry Mts./Ord Mts./Rodman Mts., and Iron Mts. populations).
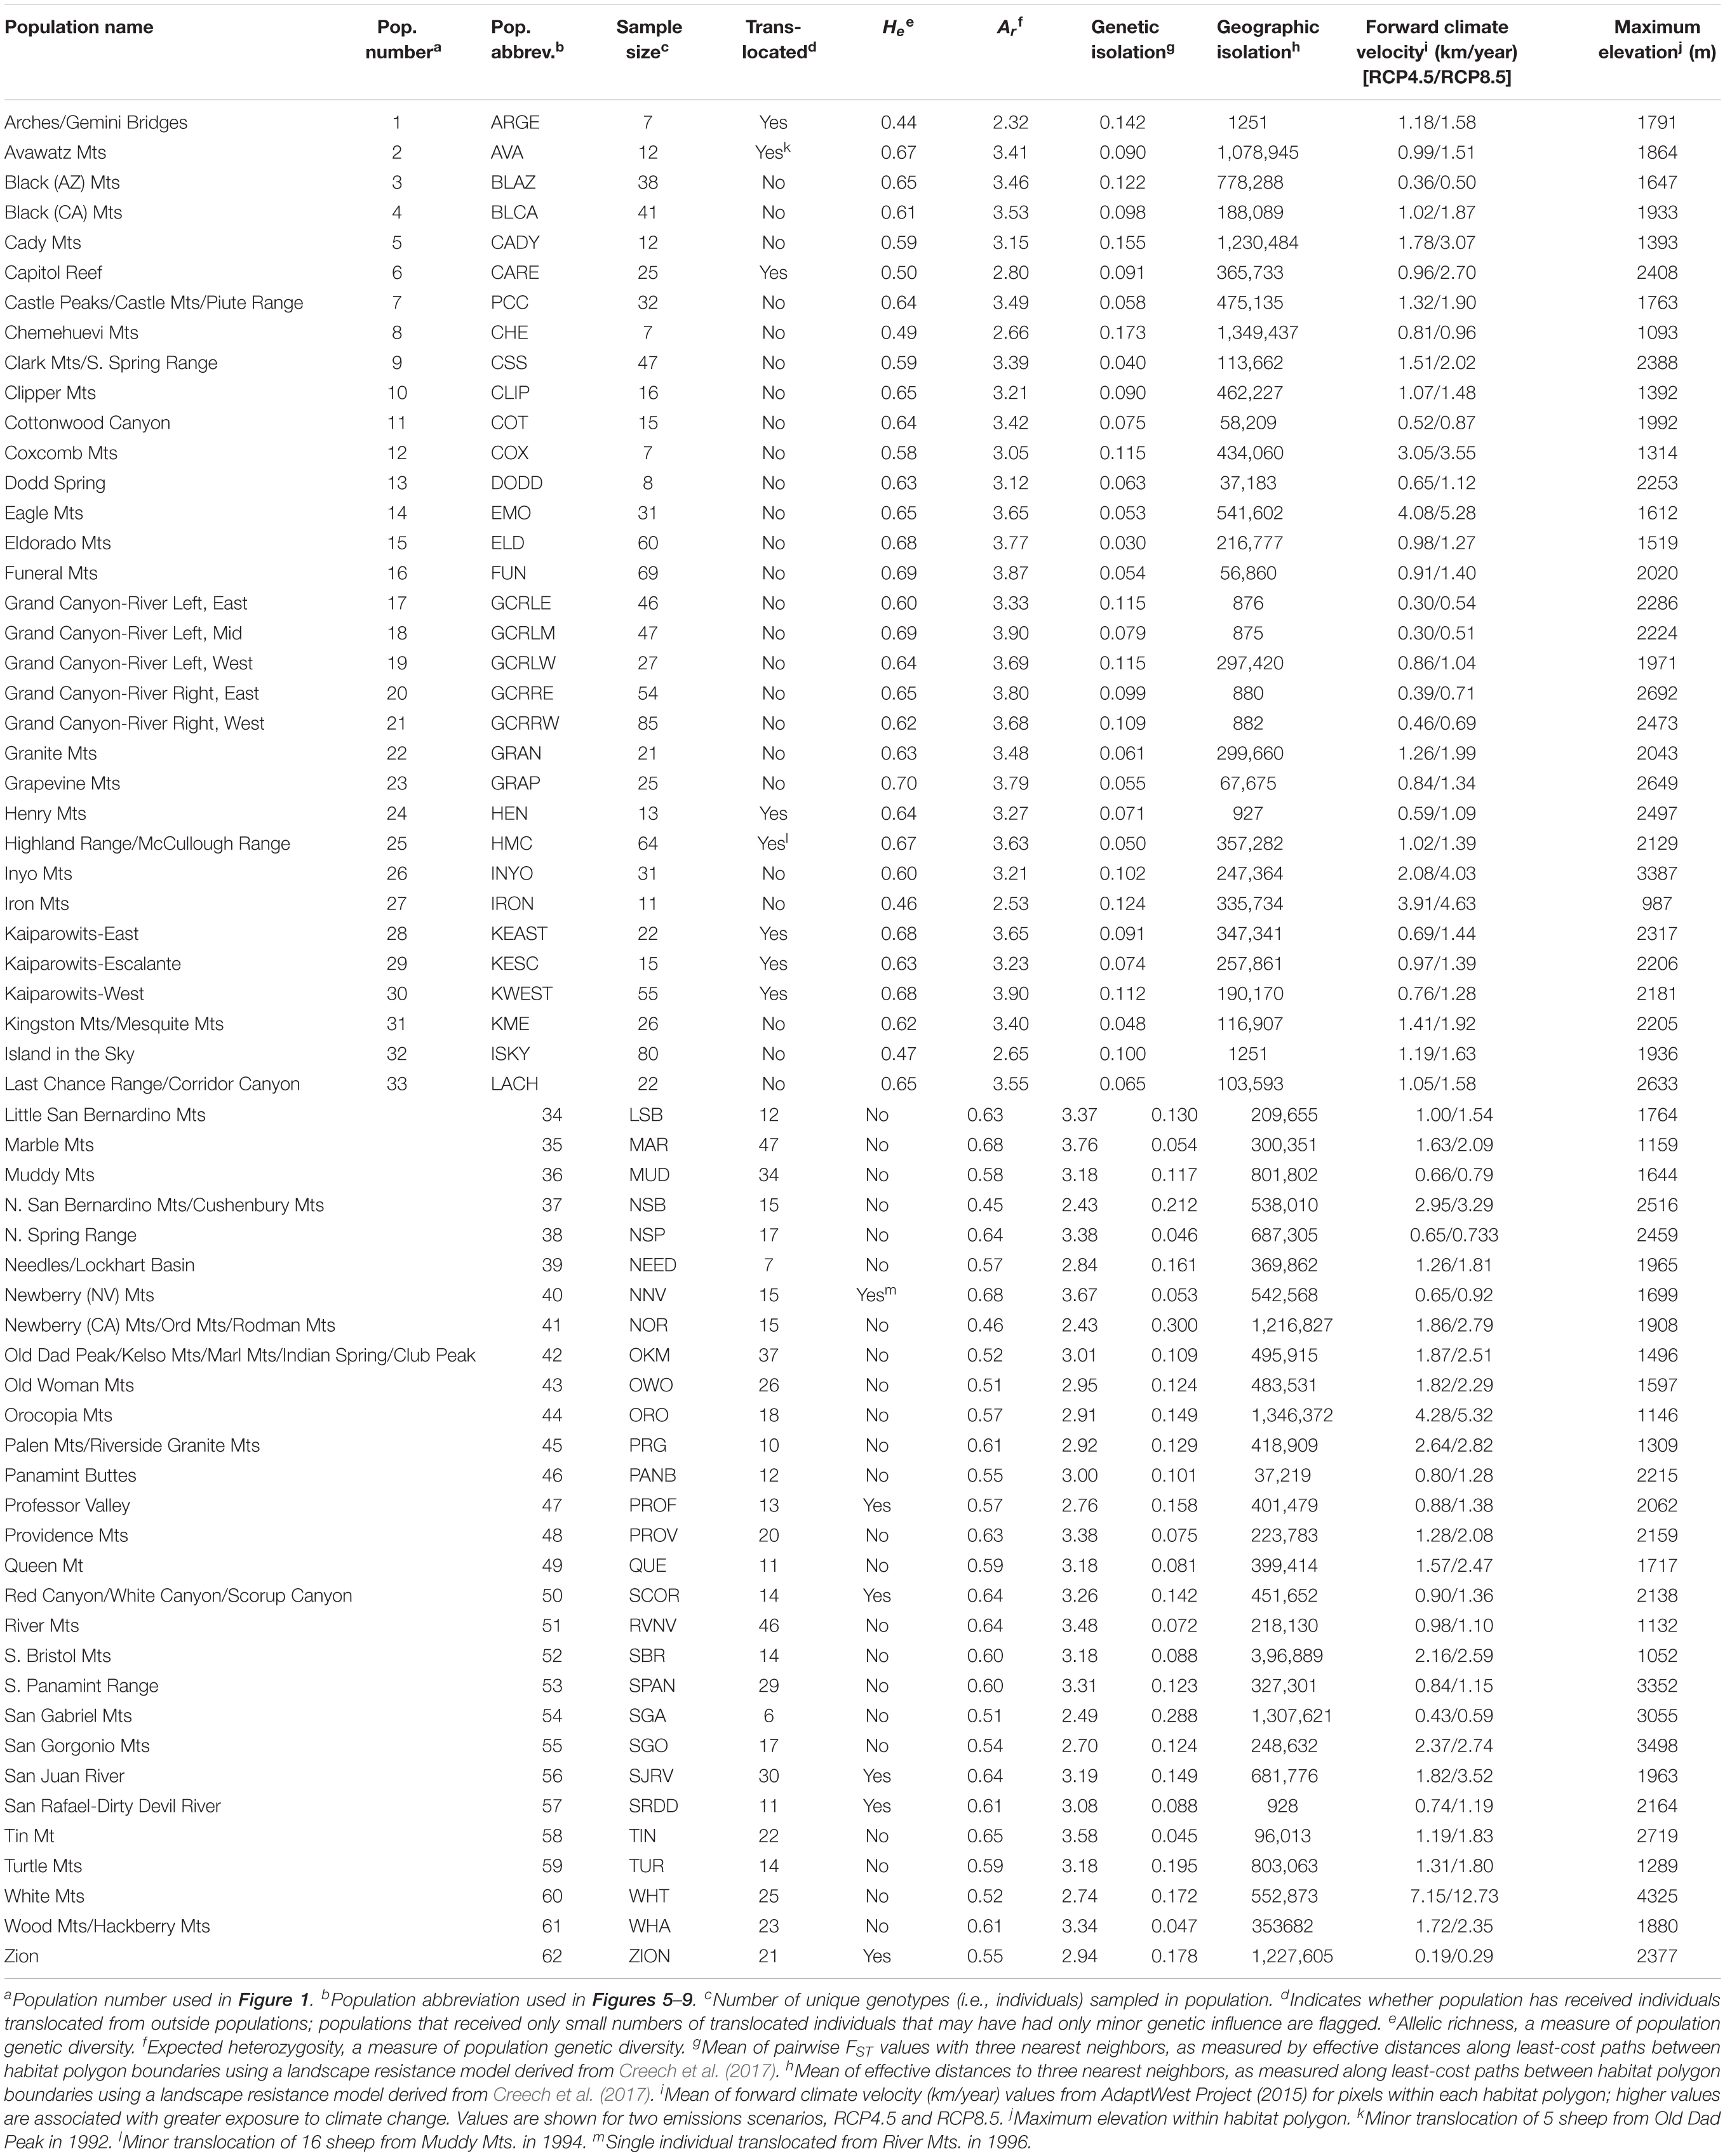
Table 1. Characteristics of 62 desert bighorn sheep populations in the study area, including translocation history, genetic diversity, geographic and genetic isolation, forward climate velocity, and maximum elevation.
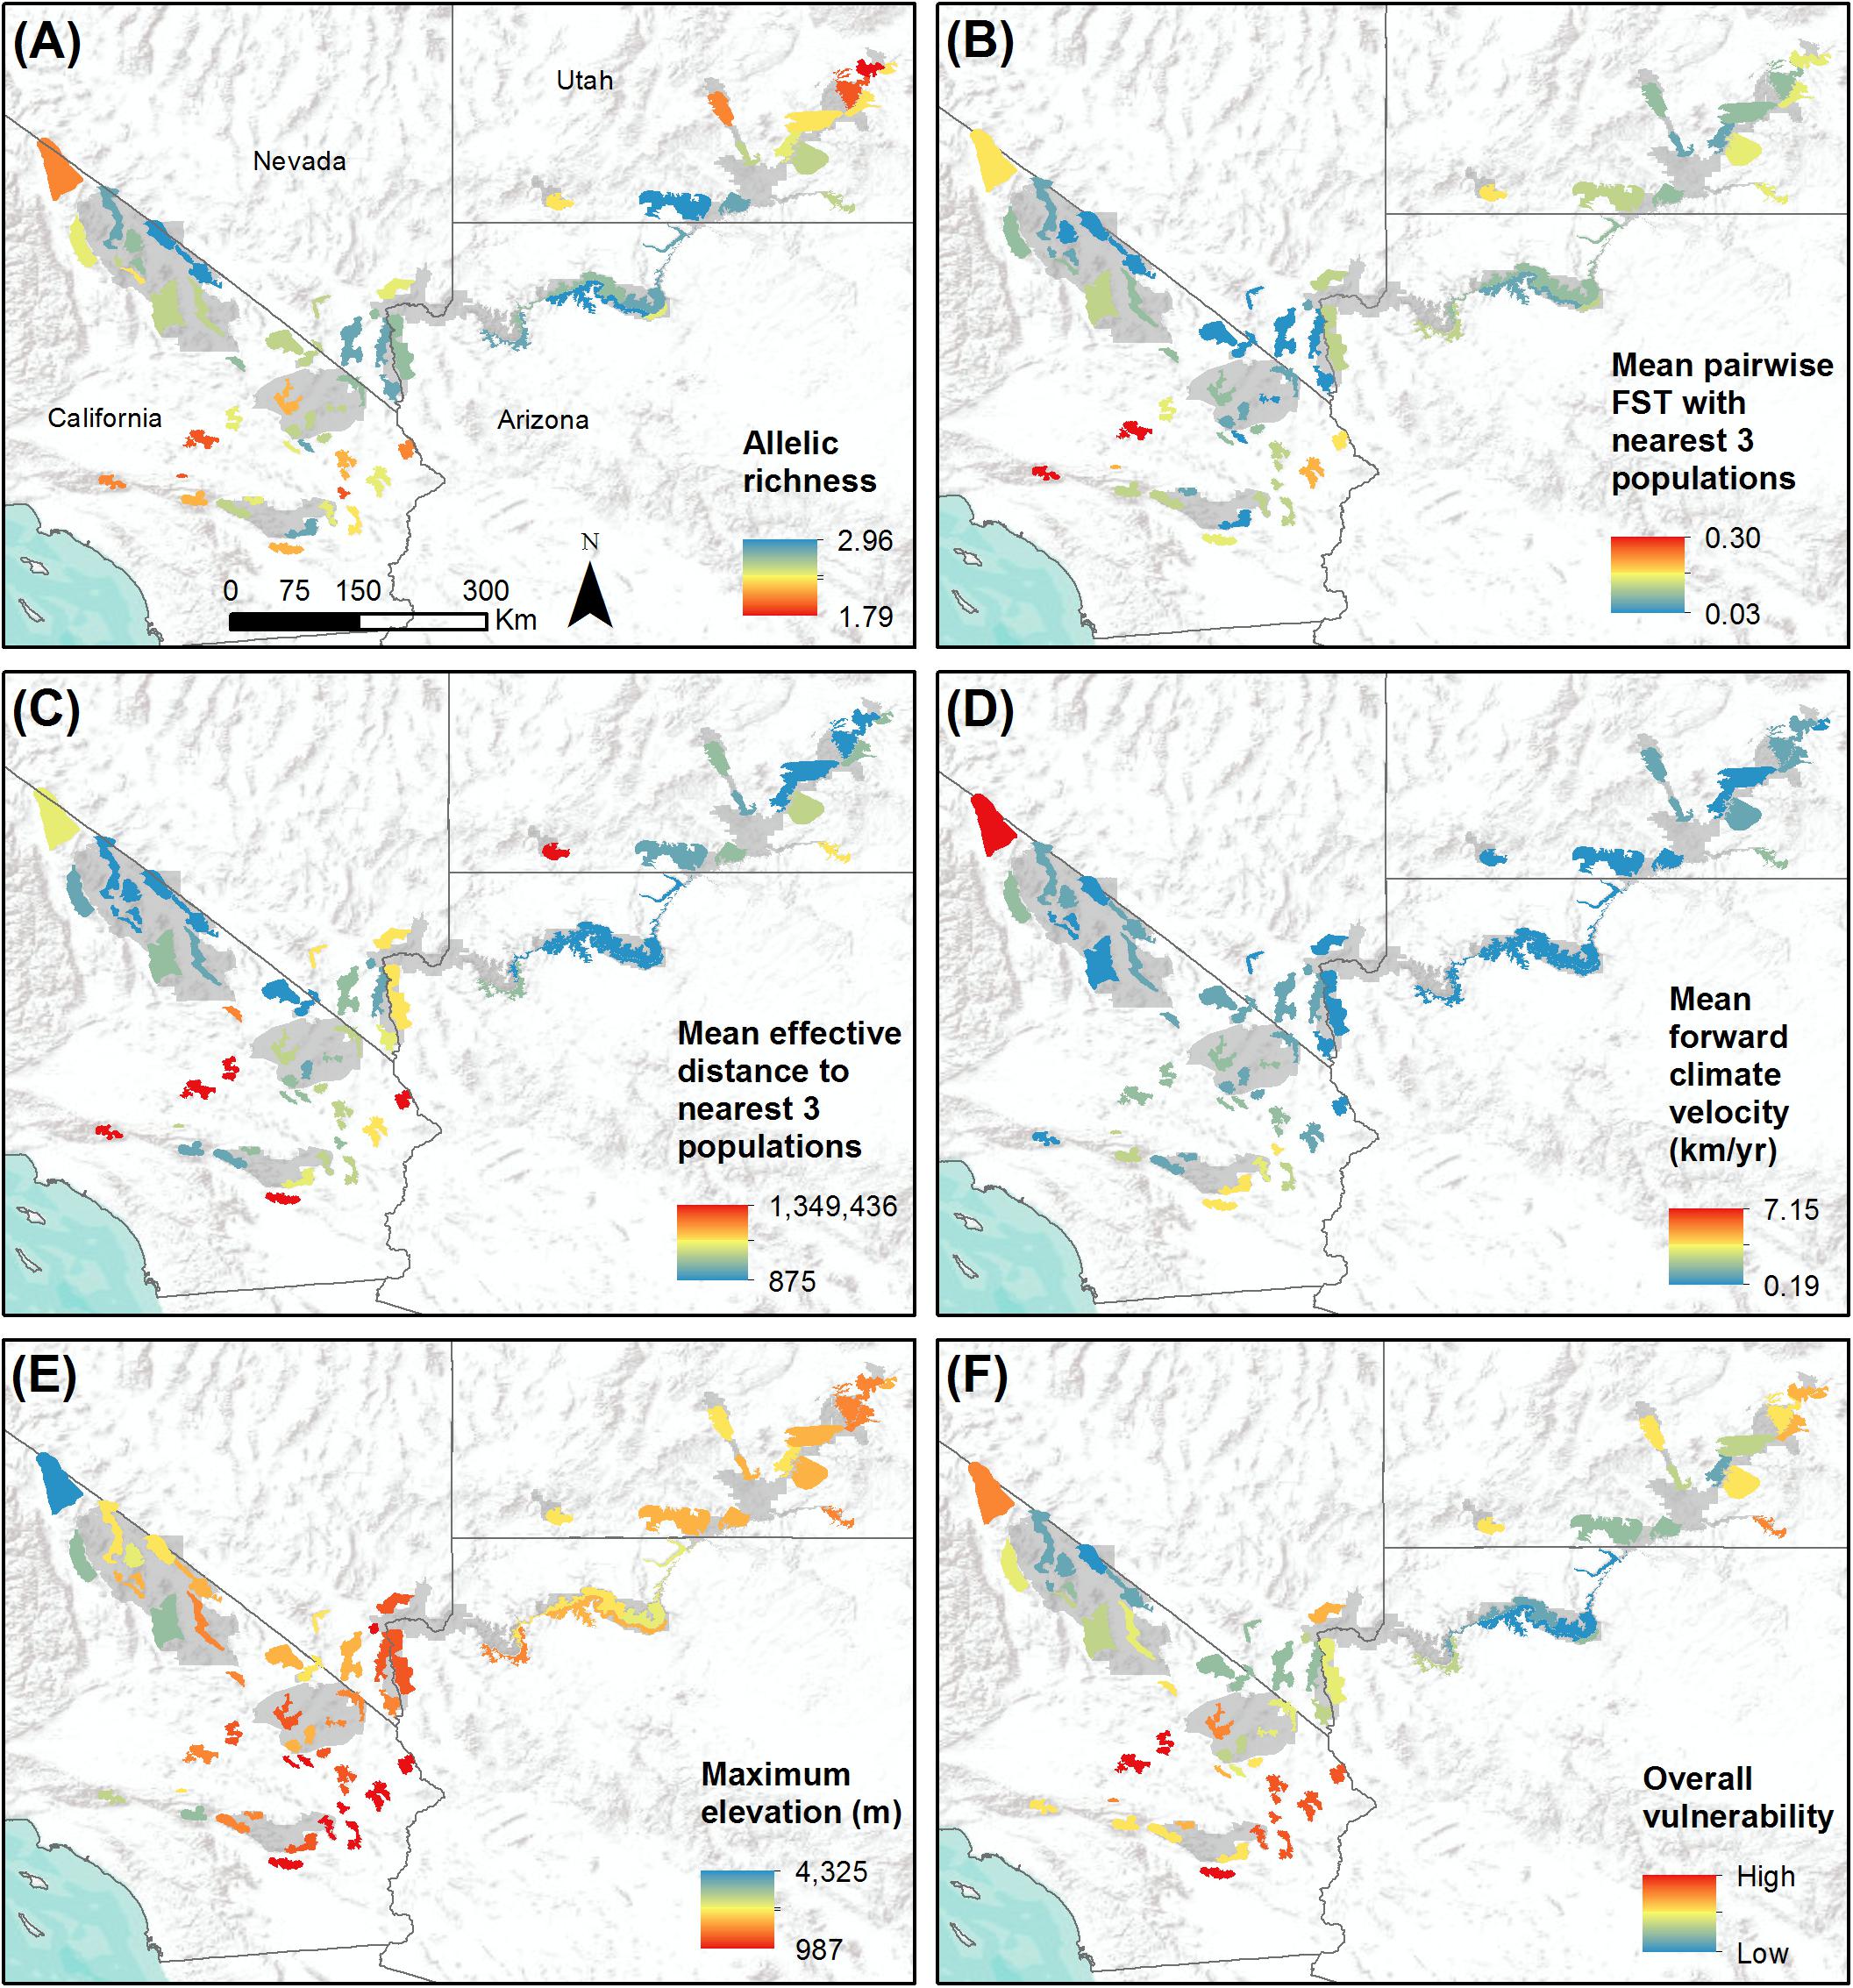
Figure 4. Study-wide comparison of populations with respect to variables that may influence population vulnerability to climate change. Populations are shown with colored polygons. National Park Service units are shaded gray. (A) Genetic diversity, measured as allelic richness. (B) Genetic isolation, measured as mean pairwise FST with three nearest populations. (C) Geographic isolation, measured as effective distance to three nearest populations. (D) Mean forward climate velocity for RCP4.5 emissions scenario. (E) Maximum elevation in meters. (F) Overall vulnerability, measured as mean percentile across variables (A–E). For all variables, red polygons indicate highest vulnerability and blue polygons indicate lowest vulnerability.
Mean pairwise FST with neighboring populations varied from 0.03 to 0.30 (Table 1). The most genetically isolated populations (i.e., those with highest pairwise FST with neighboring populations) occupied island ranges in the Mojave Desert, including the Newberry Mts./Ord Mts./Rodman Mts., N. San Bernardino Mts./Cushenbury Mts., San Gabriel Mts., and Turtle Mts. populations (Figure 4B). Populations near the California-Nevada border in the area between MOJA, DEVA, and LAKE (e.g., Eldorado Mts., N. Spring Range, Clark Mts./S. Spring Range populations) were the least genetically isolated from their neighbors.
The most geographically isolated populations (i.e., those with highest effective distances to neighboring populations) were located in the southern Mojave Desert, primarily outside of MOJA and JOTR (e.g., Chemehuevi Mts., Orocopia Mts., Cady Mts. populations), as well as the Zion population in southern Utah (Figure 4C). These populations tended to occupy island ranges surrounded by desert flats that were unfavorable to dispersal. In contrast, populations within and around DEVA, GRCA, and southeastern Utah, where steeply sloped terrain was more continuous, were relatively well connected geographically to their neighbors.
Genetic diversity of populations was negatively associated with degree of genetic isolation (Figure 5), and this relationship was stronger for native (r2 = 0.53, p < 0.001) than for translocated (r2 = 0.29, p = 0.047) populations. Genetic diversity was also negatively associated with geographic isolation (Figure 6) for native populations (r2 = 0.27, p < 0.001), however, there was no relationship between genetic diversity and geographic isolation for translocated populations (r2 = 0.007, p = 0.769). Geographic and genetic measures of isolation were positively associated (Figure 7) for native populations (r2 = 0.44, p < 0.001), but this association was weak for translocated populations (r2 = 0.12, p = 0.220).
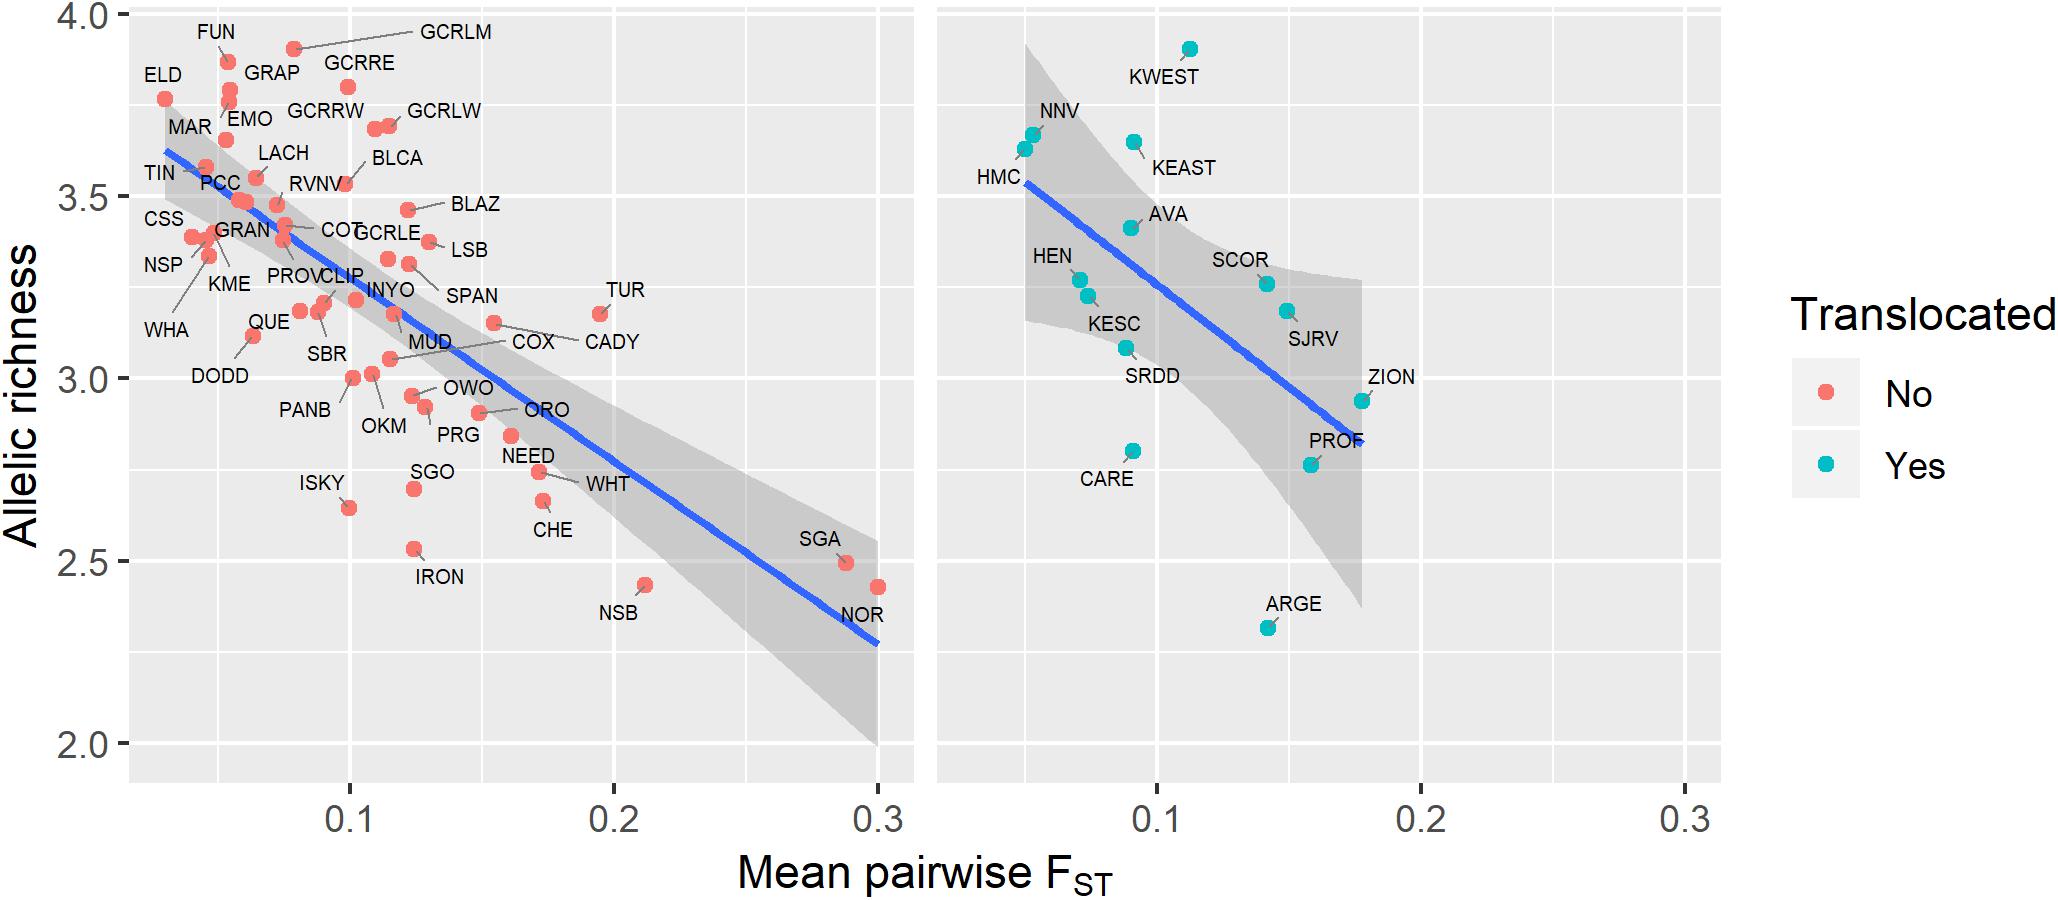
Figure 5. Relationship between genetic diversity (measured as allelic richness) and genetic isolation (measured as mean pairwise FST with three nearest populations) for native and translocated desert bighorn sheep populations. Blue line and dark gray band show best fit line and 95% confidence interval, respectively, from linear regression model. See Table 1 for full population names.
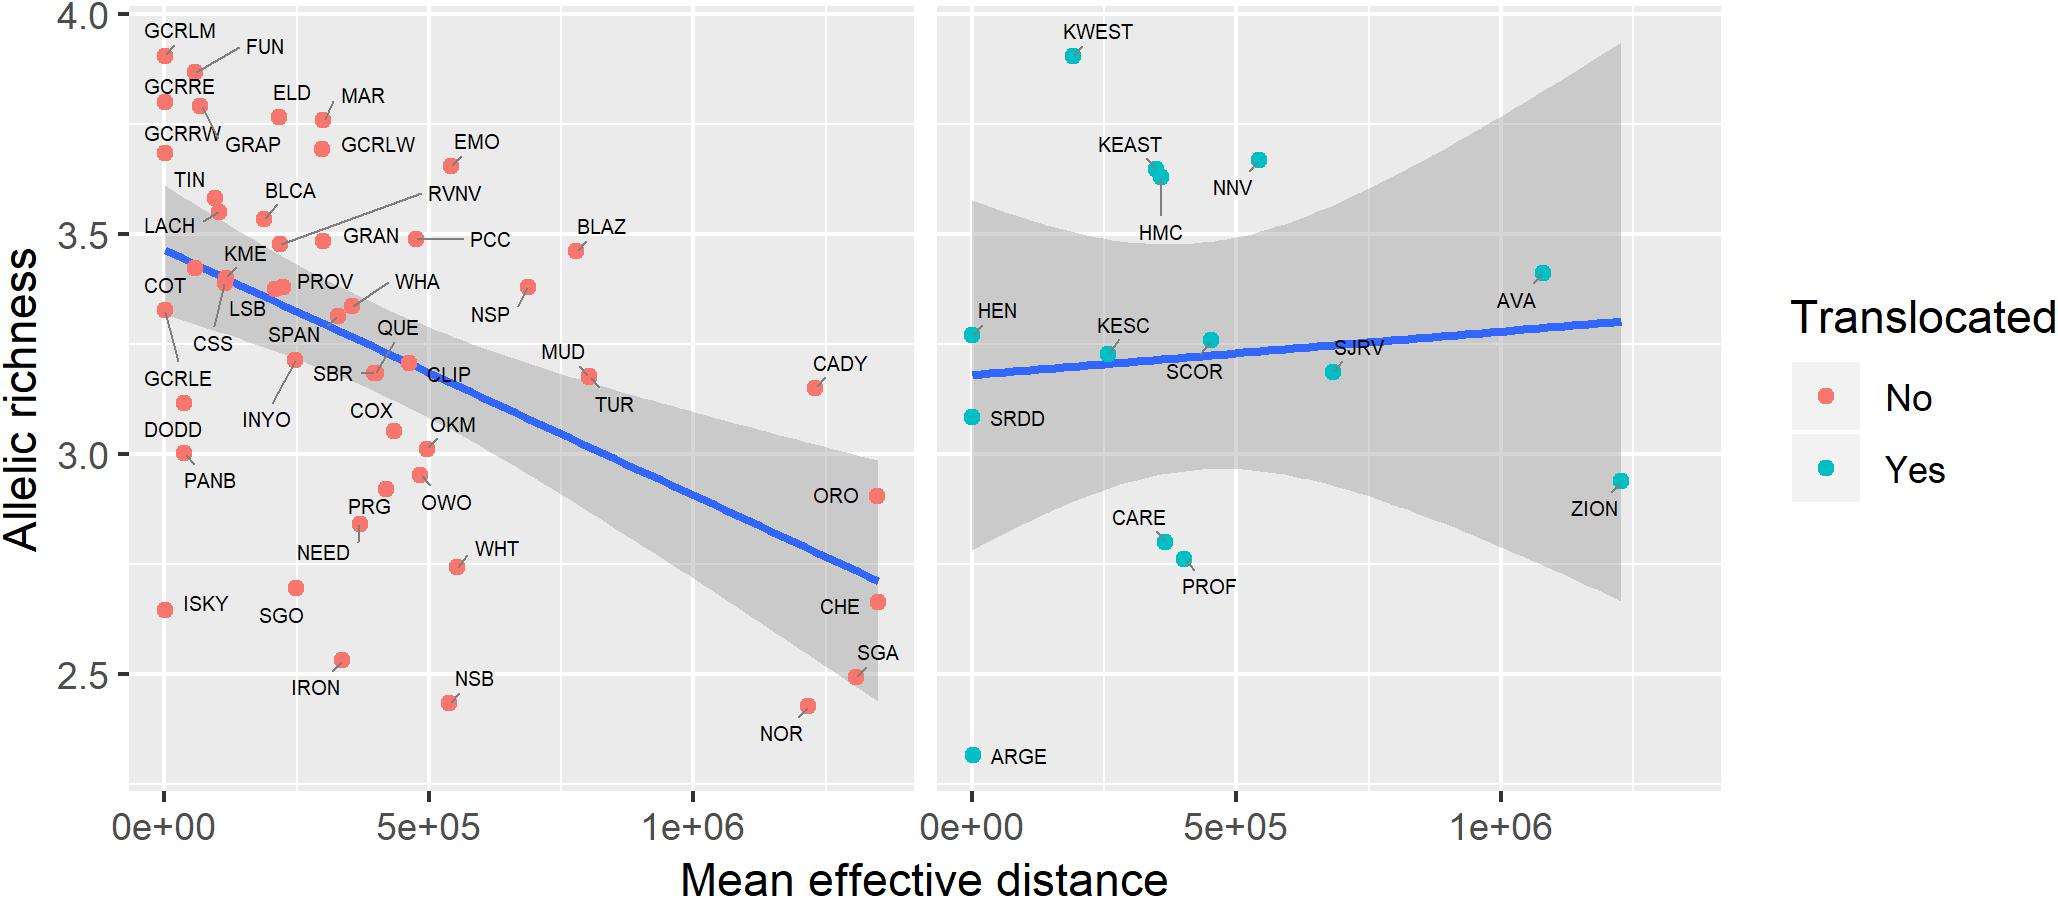
Figure 6. Relationship between genetic diversity (measured as allelic richness) and geographic isolation (measured as mean effective distance to nearest three neighbors) for native and translocated desert bighorn sheep populations. Blue line and dark gray band show best fit line and 95 percent confidence interval, respectively, from linear regression model. See Table 1 for full population names.
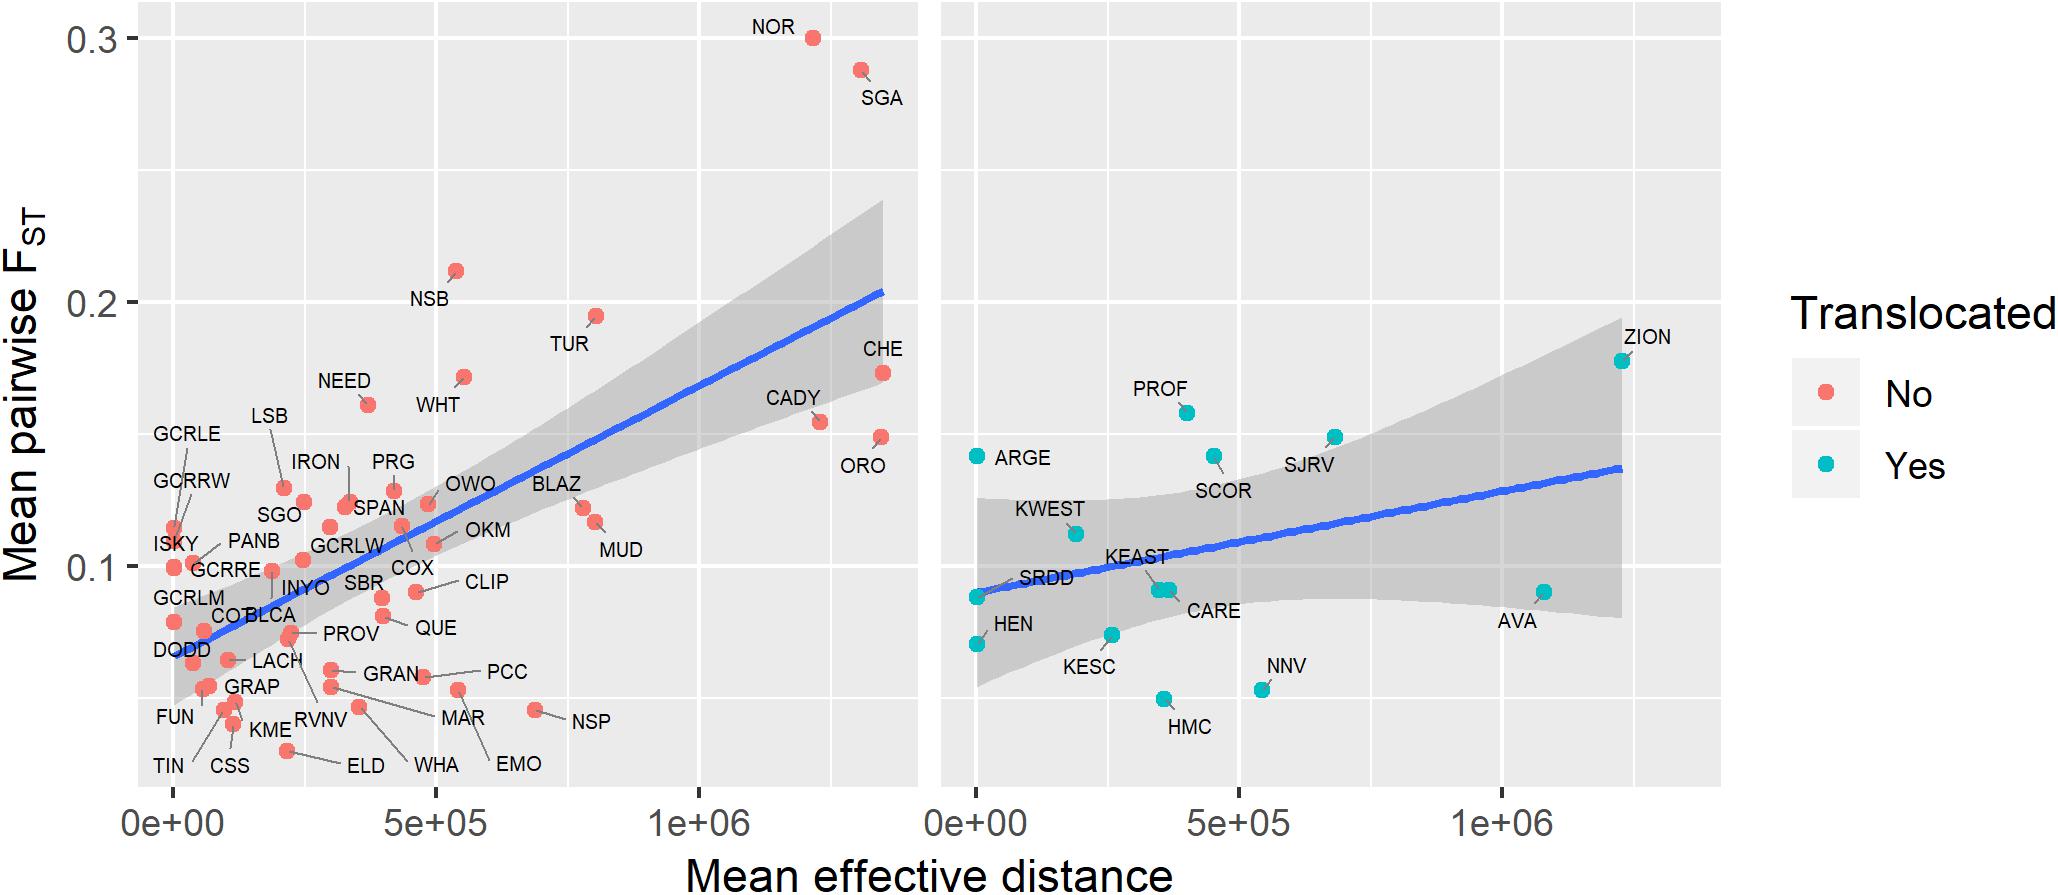
Figure 7. Relationship between genetic isolation (measured as mean pairwise FST with three nearest populations) and geographic isolation (measured as mean effective distance to nearest three neighbors) for native and translocated desert bighorn sheep populations. Blue line and dark gray band show best fit line and 95 percent confidence interval, respectively, from linear regression model. See Table 1 for full population names.
Mean forward climate velocities of populations were on average 50% higher for the RCP8.5 emissions scenario than for the RCP4.5 scenario, but velocities for the two scenarios were highly correlated (r = 0.95; Supplementary Figure S5). Because we were primarily interested in the relative differences in velocity among populations, we henceforth focus on results for the RCP4.5 scenario (but see Supplementary Figure S6). The highest forward climate velocities were observed for the southernmost populations in the study area within and around JOTR, particularly the Eagle Mts. and Orocopia Mts. populations, and for the White Mts. and Inyo Mts. populations in the northern Mojave Desert (Figure 4D). The lowest forward climate velocities were observed for populations within and around GRCA and LAKE, with low-to-moderate values for populations in the northeastern portion of GLCA, ZION, portions of DEVA, and the San Gabriel Mts. population in the western Mojave Desert.
Maximum elevation of habitat polygons ranged from 987 to 3,498 m (Table 1). Populations in the southern Mojave Desert from JOTR and MOJA east to the Colorado River (e.g., Iron Mts., S. Bristol Mts., Chemehuevi Mts. populations) had the lowest maximum elevations, while populations in the northern Mojave Desert (e.g., White Mts. and Inyo Mts. populations) and western Mojave Desert (e.g., San Gabriel Mts. and San Gorgonio Mts. populations) had the highest maximum elevations (Figure 4E). Maximum elevation and mean forward climate velocity were not related to each other (r2 = 0.003, p = 0.64), although a weak negative relationship was observed if one extreme outlier population (White Mts.) was removed from the analysis (r2 = 0.12, p = 0.006; Figure 8).
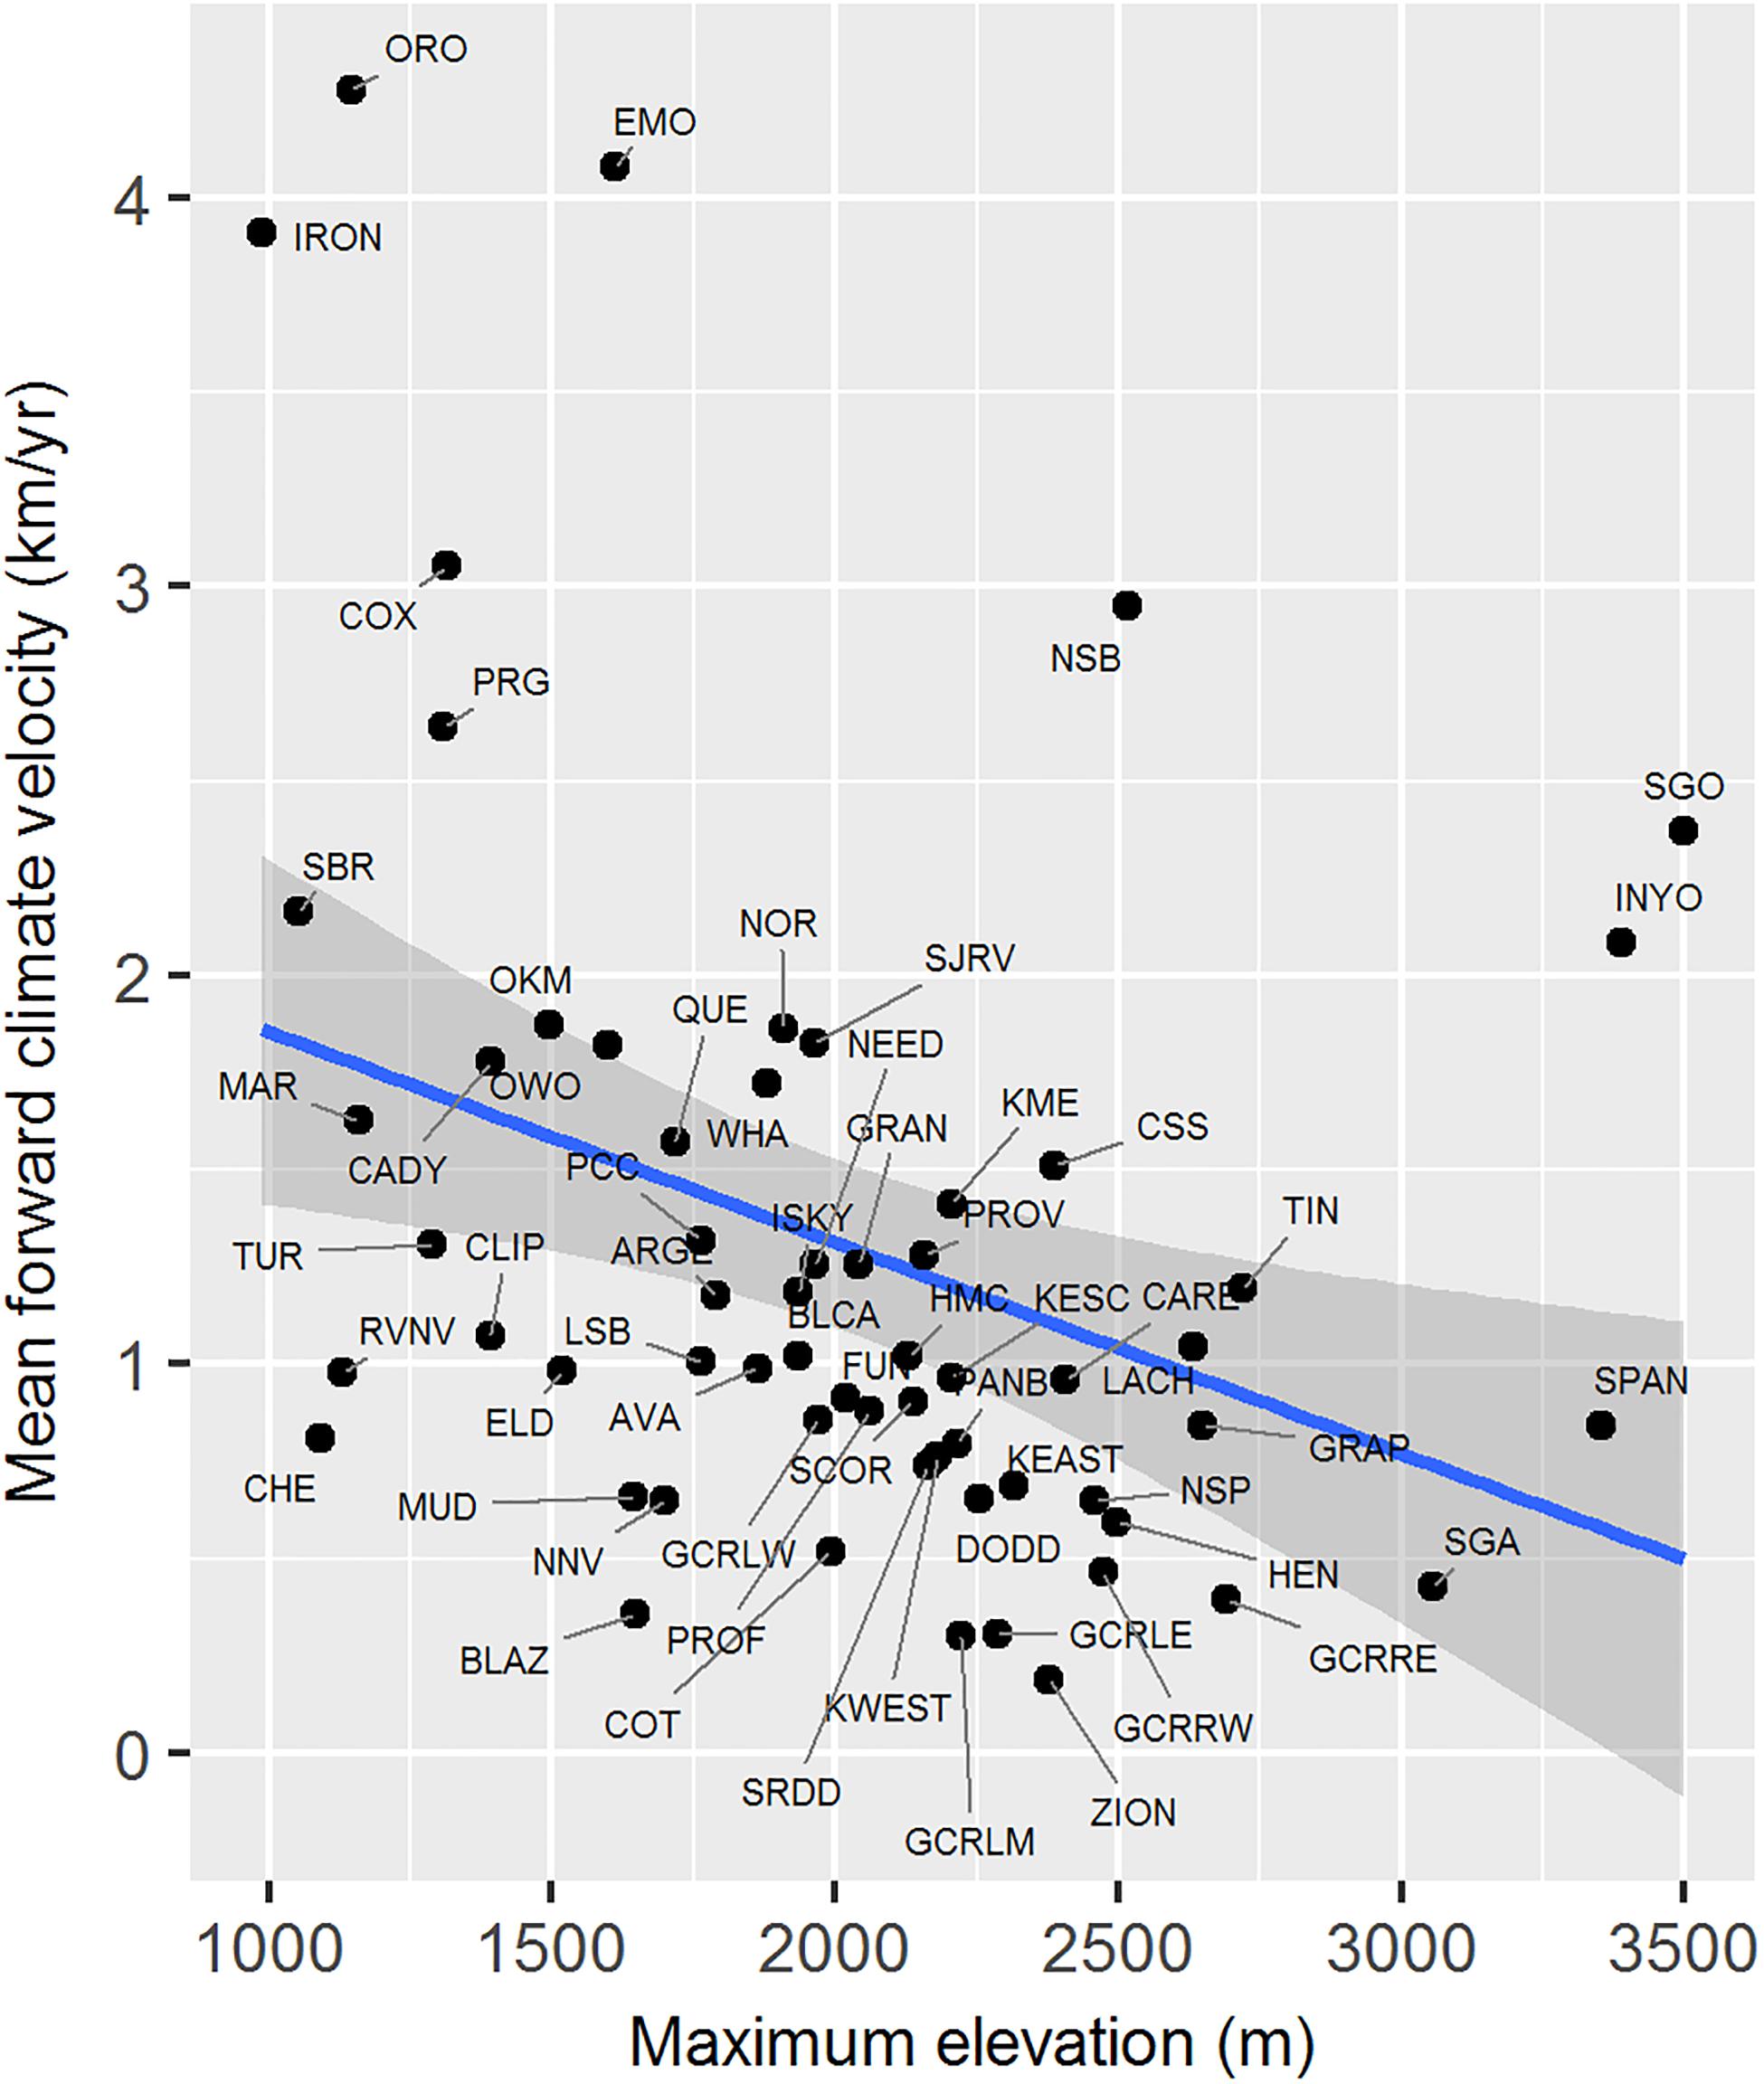
Figure 8. Relationship between mean forward climate velocity and maximum elevation of habitat polygons associated with desert bighorn sheep populations. Blue line and dark gray band show best fit line and 95 percent confidence interval, respectively, from linear regression model. See Table 1 for full population names. White Mts. population was removed as an extreme outlier (mean forward climate velocity = 12.73 km/year; maximum elevation = 4,322 m) prior to fitting regression model.
When vulnerability results were combined across all variables (i.e., genetic diversity, genetic isolation, geographic isolation, climate velocity, and maximum elevation), the populations with highest overall vulnerability were primarily located in the southern Mojave Desert and in southeastern Utah. Populations in and around DEVA and GRCA exhibited the lowest overall vulnerability (Figures 4F, 9).
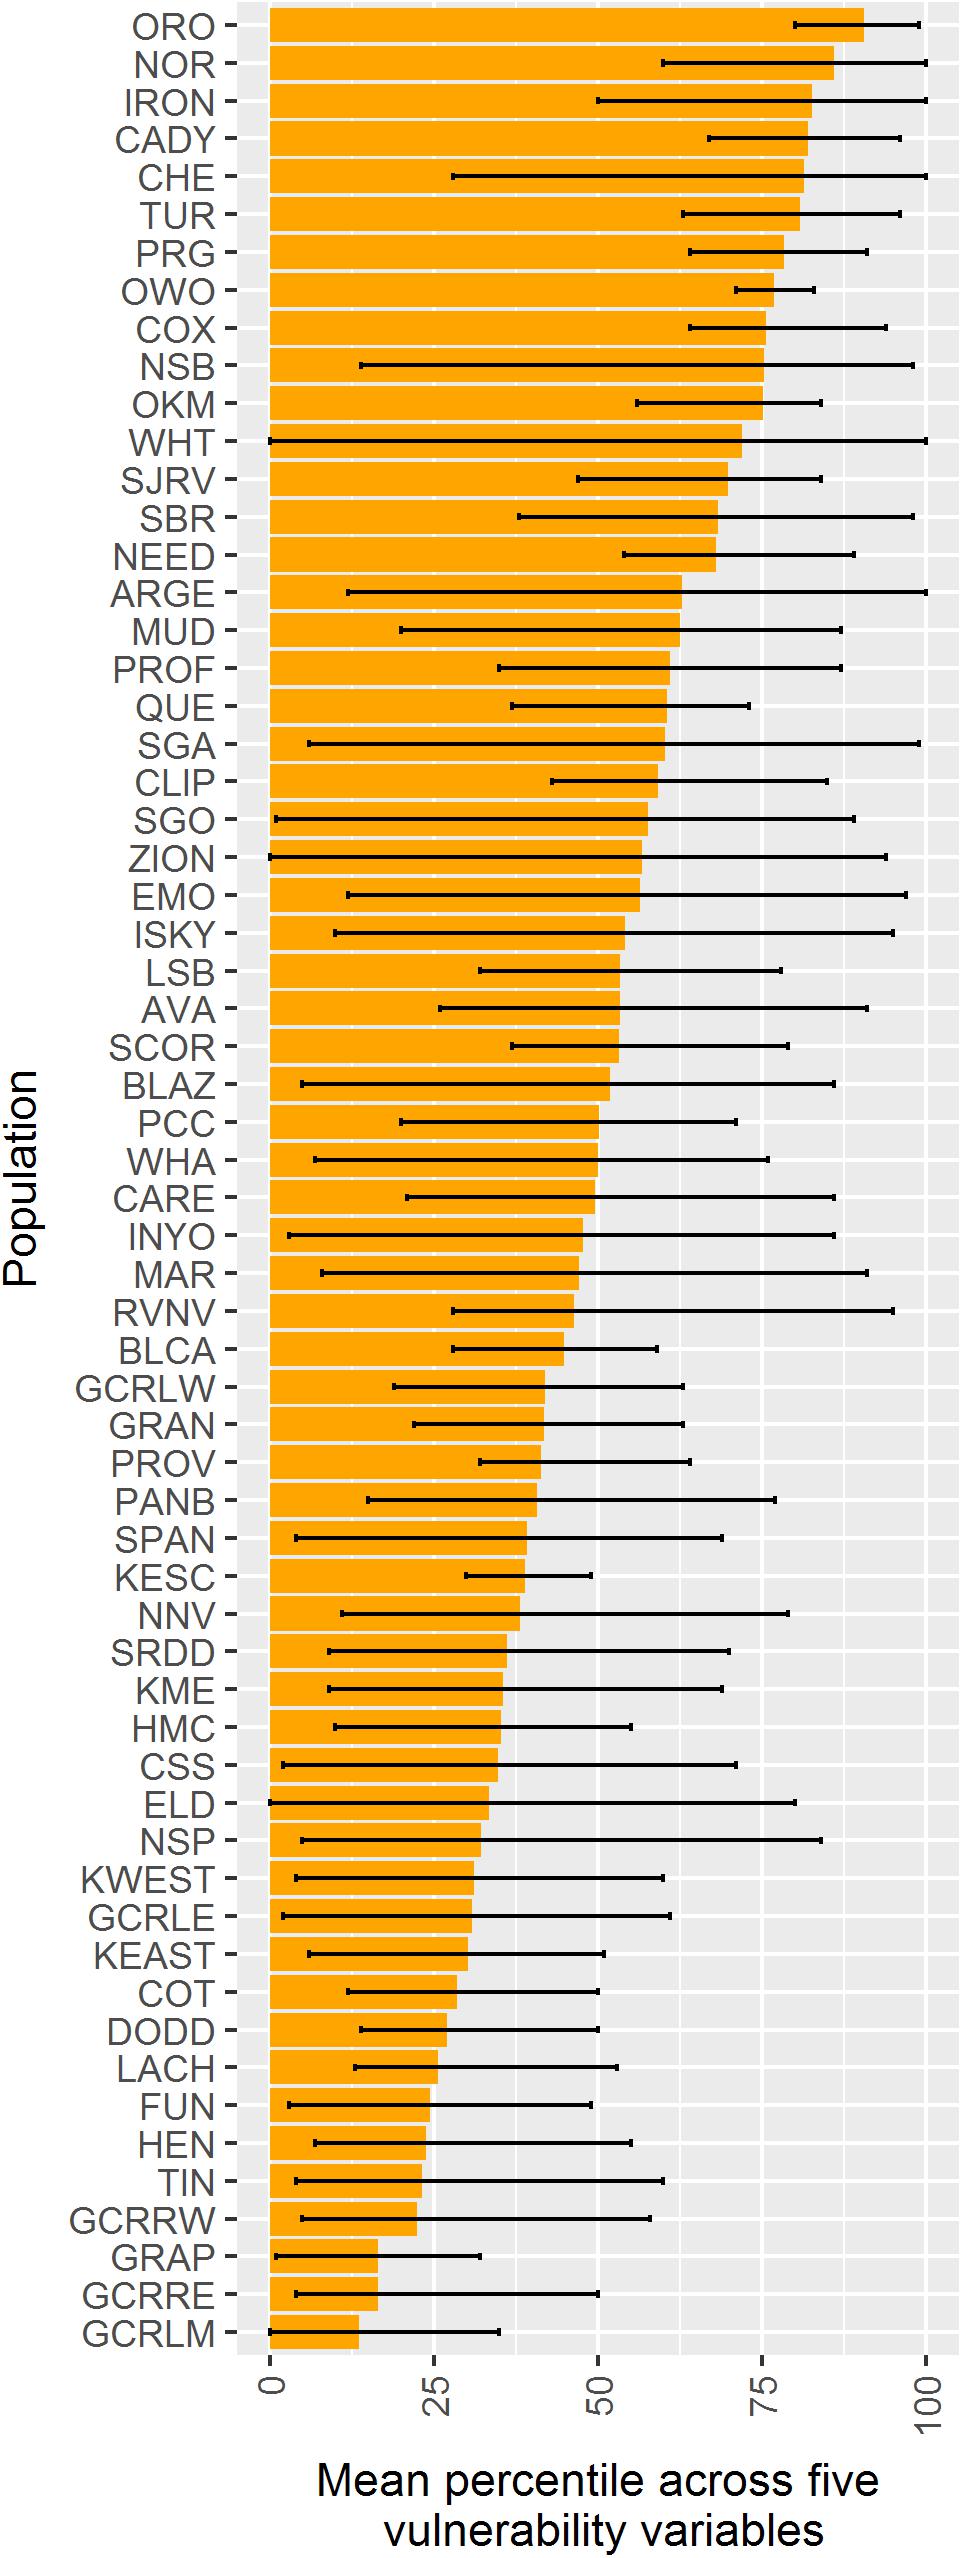
Figure 9. Comparison among 62 desert bighorn populations of overall vulnerability to climate change based on five characteristics: genetic diversity (measured as allelic richness), genetic isolation, geographic isolation, mean forward climate velocity (for RCP4.5 emissions scenario), and maximum elevation. For each characteristic, we converted population values to percentiles (with higher percentiles associated with greater vulnerability). Boxes extend to the mean percentile value for each population across all size variables; whiskers show minimum and maximum percentile across the five characteristics for each population. Populations are sorted top to bottom from highest mean percentile (i.e., greatest overall vulnerability) to lowest. See Table 1 for full population names.
Discussion
Much emphasis has recently been placed on identifying and prioritizing species that are most vulnerable to climate change (Thomas et al., 2004; Williams et al., 2008; Summers et al., 2012; Foden et al., 2013). In contrast, our analysis yielded information that may be useful in prioritizing conservation actions for populations of a single species, an approach that has been employed much less frequently in the context of climate change (but see Blair et al., 2012; Razgour et al., 2018). We found wide variation among desert bighorn sheep populations with respect to several key genetic and environmental characteristics expected to influence their vulnerability to climate change. Our analysis showed local and regional correspondence along several axes of vulnerability: for instance, the southernmost populations in the study area had the highest forward climate velocities; in that region, likewise, elevations were lowest and many populations had high isolation and low genetic diversity (Figure 4). Other areas showed low vulnerability due to low forward climate velocity, high elevation, and high genetic and geographic connectivity, such as DEVA and GRCA (Figure 4). These assessments provide important context for management of desert bighorn sheep across the region. By incorporating estimates of genetic structure and diversity, gene flow, and landscape connectivity, we were able to characterize evolutionary aspects of climate vulnerability that are often missing from commonly used correlative approaches.
Our assessment of genetic structure incorporated nearly all native populations of desert bighorn sheep found within the “Nelson” lineage described by Buchalski et al. (2016), which encompasses populations in the Mojave Desert and parts of the Great Basin and Colorado Plateau ecoregions. Concordant with being part of a single lineage of desert bighorn sheep, we found that populations throughout our study area exhibited mixed ancestry, with nearly all populations (and individuals within populations) assigning to multiple genetic clusters with non-negligible probabilities in both TESS3 and DAPC analyses (Figures 2, 3). This is consistent with the pattern of isolation by distance observed in our data set. Previous studies have in some cases suggested clearer genetic divisions, but those studies were conducted at smaller spatial extents or used different analytical approaches aimed at distinguishing recent gene flow. For instance, Jaeger and Wehausen (2012) found almost no gene flow between populations on opposite sides of the Colorado River in the LAKE region; yet our analysis suggested that populations on opposite sides of the Colorado River within either the LAKE or GRCA region were more genetically similar than were geographically distant populations located on the same side of the river. In another case, the strong genetic separation described by Epps et al. (2018) between populations north and south of Interstate 40 in southern California was much weaker according to our analysis (Figures 2, 3). These conflicting results are suggestive of hierarchical genetic structure. The previous studies conducted at smaller spatial extents revealed lower-level structure, while our analysis, which included more of the total genetic variation present within the subspecies, revealed higher-level structure. The seemingly contradictory findings may also speak to the relatively recent influence of dams on gene flow across and along the Colorado River. Prior to construction of dams in the early-to-mid twentieth century, bighorn sheep would have been able to cross the Colorado River relatively easily during periods of low streamflow. The large reservoirs and dam-regulated streamflow in recent decades appear to have largely prevented such crossings and increased genetic divergence of populations on opposite sides of the river. Thus, our current large-scale analysis reflecting longer-term patterns did not indicate a strong barrier effect of the Colorado River, while analyses using methods that characterize recent gene flow (e.g., assignment tests) suggest otherwise (Creech et al., unpublished; Wehausen et al., unpublished).
The most significant genetic division in our study area appeared to be between populations in southeastern Utah (in and around ARCH, CANY, and CARE) and all other populations (Figure 2). The history of the populations in this region provides a plausible explanation for this pattern. Nearly all populations in southeastern Utah went extinct between the late 1800s and the 1940s as a result of livestock-borne diseases, unregulated harvest, and mining activities (Singer and Gudorf, 1999), leaving only a small remnant population in CANY. This population bottleneck likely reduced genetic diversity and interrupted gene flow with adjacent regions, causing allele frequencies to diverge, and resulting in the genetic distinction of this remnant population. Reintroductions of bighorn sheep populations to southeastern Utah beginning in the mid-1970s using individuals sourced from the remnant CANY population (Utah Division of Wildlife Resources, 2013) likely did little to change the genetic distinction of this region. Other signatures of past translocation events were also present in the genetic structure results; for instance, the Zion population was most similar to populations in LAKE because it was reestablished using individuals translocated from the River Mountains in Nevada. Although southeastern Utah populations exhibited relatively low isolation and low forward climate velocity, the loss of genetic diversity due to demographic history and reintroduction significantly elevated their overall vulnerability in our assessment (Figure 4).
Genetic diversity varied strongly among populations, but was high throughout much of our study area in comparison to estimates from other parts of the range of bighorn sheep, suggesting that potential for evolutionary adaptation in these mostly native populations remains high despite small population sizes and rapid genetic drift (e.g., Epps et al., 2005). GRCA, DEVA, and LAKE contained some of the most genetically diverse bighorn sheep populations reported in the literature. Populations occupying these NPS units had mean expected heterozygosities of 0.64, 0.63, and 0.65, respectively. These estimates are higher than microsatellite-based He estimates for most desert bighorn sheep populations outside our study area: Boyce et al. (1997) reported mean He of 0.55 for populations in the Peninsular Ranges of southern California and 0.50 for populations in southern New Mexico; and Gutiérrez-Espeleta et al. (2000) found mean He of 0.57 for populations in southern Arizona. He of populations in our study area also compared favorably to reported mean He for Rocky Mountain bighorn sheep (O. c. canadensis) populations of 0.57 (Gutiérrez-Espeleta et al., 2000), 0.55 (Forbes et al., 1995), and 0.63 (Driscoll et al., 2015). We note, however, that these previous studies used sets of microsatellite loci that were similar but not identical to those used in our study, which could potentially influence these comparisons.
Our results also suggest that genetic diversity of some populations in our study area may be in flux because translocated populations have not yet reached equilibrium. As predicted, geographic isolation was negatively correlated with genetic diversity for native but not for translocated populations (Figure 6), and the negative correlation between genetic isolation and genetic diversity that we observed was stronger for native than for translocated populations (Figure 5). The stronger correlation between genetic isolation and geographic isolation for native than for translocated populations (Figure 7) was also consistent with our predictions. These results suggest that despite the small census sizes and rapid genetic drift typical for desert bighorn sheep populations (Epps et al., 2003, 2005), translocated populations do not appear to have achieved equilibrium with respect to influences of landscape connectivity on genetic diversity and genetic differentiation. Where translocation events have muddied the relationship between landscape characteristics and gene flow, geographic measures of isolation may provide a more accurate picture of potential for future gene flow. Geographic isolation measures may also be more useful where populations have not yet reached genetic equilibrium following major changes to the landscape (e.g., highway or dam construction). We therefore suggest that managers consider both geographic and genetic measures when assessing population isolation in regions where translocation efforts have occurred.
We assessed genetic diversity of populations using neutral microsatellite markers because a major goal of our research was to explore landscape influences on gene flow, and neutral markers provide unbiased estimates of demographic processes, such as gene flow and genetic drift (Holderegger et al., 2006). Evolutionary potential, however, depends on adaptive genetic variation – variation at genes that affect fitness – rather than neutral variation. While the correlation between neutral genetic variation and quantitative variation cannot always be assumed (Reed and Frankham, 2001), genetic diversity at neutral and adaptive-linked microsatellite loci were shown to be strongly correlated for desert bighorn sheep populations in the Mojave Desert (Nickerson, 2014). Heterozygosity estimates for bighorn sheep derived from microsatellites and SNPs were also correlated (Miller et al., 2014). Thus, we believe that our genetic diversity estimates may be useful if imperfect indicators of evolutionary potential of desert bighorn sheep populations. Genomic methods such as outlier tests and genotype-environment association analyses (e.g., Prunier et al., 2011; Razgour et al., 2018) could provide more direct estimates of adaptive genetic variation and also shed light on relative sensitivity of populations to climate change by revealing populations harboring alleles associated with higher fitness in novel climates. Yet, one such recent effort determined that the strong hierarchical spatial structure observed in bighorn sheep confounds interpretation of adaptive differences across many habitats (Buchalski et al., unpublished).
The forward climate velocity estimates in our analysis are subject to considerable uncertainty associated with climate model projections and emissions scenarios. This issue affects all vulnerability analyses that rely on climate projections. However, several aspects of our analysis give us confidence in our velocity-based conclusions regarding climate exposure. First, the velocity data we used were generated using a diverse set of climate variables and an ensemble of climate models, minimizing the effects of individual variables or models that behave as outliers. Second, we considered mid-term (2050s) climate projections, avoiding the increased uncertainty associated with longer-term projections. Third, we considered two emissions scenarios that bracket a wide range of possible climate trajectories. Fourth, our conclusions were based on relative differences in velocity among populations, which were largely consistent between emissions scenarios, rather than absolute magnitudes of climate velocity.
The weak relationship observed between our two measures of climate change exposure is not necessarily surprising because they were chosen to represent different components of exposure: maximum elevation as an index of current climate stress, and forward climate velocity as an index of the magnitude of expected climatic change. In some cases, these metrics indicated opposite conclusions regarding relative exposure of populations, as illustrated by the White Mts. population near the northwestern limit of our study area. This population had the highest maximum elevation, indicating low climate stress at present because the population presumably experiences relatively cool and wet conditions. The White Mts. population also had the highest mean forward climate velocity, indicating high exposure over the long term, because it already occupies the highest-elevation habitat in the vicinity and long-distance dispersal would be necessary to find suitable future habitat at even higher elevation or higher latitude. Interestingly, a recent analysis of adaptive genetic variation in desert bighorn sheep suggests that the White Mts. population has a high frequency of an allele associated with high-elevation habitat (Buchalski et al., unpublished); high-elevation habitat presents different life-history challenges due to altitude and cold stress, suggesting that local adaptation could be expected. The question of whether effects on populations will be greater in areas experiencing the largest climatic changes or in areas where climatic conditions are closest to tolerance limits has not been well explored (but see Beever et al., 2010), despite having important implications for management.
We urge caution in interpreting maximum elevation results at a range-wide scale. Evidence for the relationship between maximum elevation and population persistence comes from populations in the southern Mojave Desert, where elevation is strongly associated with precipitation and forage availability (Epps et al., 2004). Whether elevation is as strong a determinant of population persistence in other regions is not clear, nor is it clear whether cross-regional comparisons are appropriate given major differences in climate, vegetation type, and topography. We suspect that maximum elevation is most useful as a measure of differences in climate change exposure among populations within a region.
Refining Estimates of Population Vulnerability
Our assessment of vulnerability does not consider a component of adaptive capacity that is likely to be important for desert bighorn. The ability of individuals of a given genotype to modify their phenotype in response to environmental conditions, known as phenotypic plasticity, is an important mechanism for climate adaptation that can vary among individuals and populations, but it is not well understood and can be difficult to measure (Merilä and Hendry, 2014; Nicotra et al., 2015). Of the in situ mechanisms for adaptation to climate change, plastic responses may be at least as important as evolutionary responses for many species (Hoffmann and Sgro, 2011), although these two mechanisms can be difficult to distinguish (Merilä and Hendry, 2014). Experimental or observational studies of plasticity could provide useful information for prioritizing vulnerable desert bighorn populations (e.g., Renaud et al., 2019).
We avoided using correlative models in our assessment of climate vulnerability because they have several limitations with respect to desert bighorn sheep. Correlative models do not realistically reflect dispersal limitations that influence the geographic distributions of bighorn populations. They may be difficult to apply at the subspecies level because occurrence may be linked with different (and unknown) climatic variables in different parts of the highly variable historic range. Correlative models also typically have not accounted for biotic interactions or changes in vegetation type, which could be critically important for bighorn sheep given that predicted shifts from forest to shrub communities in the southwestern U.S. (Williams et al., 2010) could create new habitat for bighorn. Recent research, however, shows promise of overcoming some of these limitations. For instance, a study of forest bats by Razgour et al. (2019) incorporated information on local climate adaptations from genotype-environment association analysis directly into ecological niche models, and then combined this with a landscape genetic analysis to infer how dispersal barriers are likely to influence potential for evolutionary adaption to climate change. Innovative approaches such as that hold great promise for producing more useful and comprehensive climate vulnerability assessments. In the meantime, less complex approaches such as ours may serve wildlife managers constrained by the amount of time and resources allocated to researching climate vulnerability for any particular species or population.
Management Implications
Maintaining genetic diversity of, and gene flow among, desert bighorn populations will be critical for facilitating evolutionary adaptation to climate change, and actions to preserve or restore connectivity could be effective tools for achieving this objective. A previous simulation study of gene flow for desert bighorn sheep in parts of the study area (Creech et al., 2017) suggested that the spread of adaptive genetic variation is strongly influenced by habitat configuration, with faster spread occurring in areas less fragmented by natural and anthropogenic barriers to dispersal. Reductions in connectivity and gene flow due to anthropogenic barriers such as interstate highways can sometimes be addressed with wildlife crossing structures, although monetary costs can be very high (Corlatti et al., 2009). For example, overpasses for desert bighorn sheep constructed along Highway 93 in the Black Mountains of Arizona facilitated > 1,700 crossings in the first three years after construction (Gagnon et al., 2013). Crossing structures in other areas, such as along Interstates 10, 15, and 40 in southern California, could greatly enhance regional connectivity (Creech et al., 2014), and there may also be opportunities to improve connectivity by modifying existing infrastructure (e.g., highway fencing around underpasses). In some cases, bighorn sheep may eventually discover routes over or under such barriers on their own (Epps et al., 2018). Where connectivity challenges cannot be addressed through barrier mitigation actions, periodic translocation of individuals from nearby populations could be used to provide gene flow (Weeks et al., 2011; Hedrick and Wehausen, 2014).
Ultimately, any management action that promotes large population sizes should help to reduce vulnerability by preserving genetic diversity (Hedrick, 2011). This could include actions that target stressors, whether climatic or non-climatic, such as maintaining or adding artificial water sources (Dolan, 2006; Longshore et al., 2009), controlling predator populations (Wehausen, 1996; Ernest et al., 2002; Rominger et al., 2004), enhancing forage quality (e.g., via prescribed burning; Holl et al., 2004), reducing effects of recreation (Longshore and Thompson, 2013; Wiedmann and Bleich, 2014), or minimizing disease risk by preventing co-mingling with domestic animals (Wehausen et al., 2011). We note, however, that the feasibility of management actions may vary by jurisdiction (e.g., predator control is typically not employed on NPS lands).
Our analysis assumed that connectivity is beneficial to desert bighorn sheep populations because of its critical role in promoting gene flow and maintaining genetic diversity, but connectivity can also facilitate the spread of disease among populations (Simberloff and Cox, 1987; Hess, 1994, 1996). This threat is particularly acute for bighorn sheep, which are susceptible to diseases introduced by domestic livestock beginning with European settlement in the late 1800s (Wehausen et al., 2011). Disease has led to declines across large portions of bighorn sheep range and continues to affect bighorn populations, even within our study area; for instance, respiratory disease outbreaks have been detected in several populations in the Mojave Desert in recent years (Epps et al., 2018). Thus, the risk of disease transmission should be considered before undertaking management actions to increase dispersal among populations. This trade-off between evolutionary potential and disease risk represents one of the fundamental questions that must be clarified for management in the face of both disease and climate change.
Our results underscore the need to maintain native desert bighorn sheep populations in ecologically intact landscapes to facilitate evolutionary adaptation. Unlike other systems where restoration through translocation has dramatically influenced genetic diversity and structure (Whittaker et al., 2004; Malaney et al., 2015; e.g., Jahner et al., 2019), we found that desert bighorn in regions with few anthropogenic barriers to dispersal where populations have persisted without significant reintroduction or augmentation efforts, such as DEVA and GRCA, tended to exhibit high genetic diversity and low isolation. In contrast, populations in landscapes that are more fragmented (i.e., southern California) or heavily influenced by translocations (i.e., southeastern Utah) tended to be less genetically diverse and more isolated. This pattern is consistent with previous studies that have found low genetic diversity or fitness in reintroduced bighorn sheep populations (Whittaker et al., 2004; Wiedmann and Sargeant, 2014). Fortunately, areas that support some of the most genetically diverse and connected populations in our study area are also predicted to have relatively low climate change exposure (e.g., DEVA and GRCA).
The climate vulnerability results from our analysis should help NPS and other natural resource management agencies make more informed decisions about allocating resources among desert bighorn populations, but they do not establish an optimal management strategy. Should efforts be focused on populations with the greatest climate vulnerability in hopes of preserving populations throughout desert bighorn range? Or should managers dedicate resources primarily to bolstering populations that appear most likely to persist in the face of climate change? Current data and analysis cannot fully inform these decisions, and management priorities will also depend on a variety of factors not considered here. For instance, the contributions of genetically unique populations to the evolutionary potential of the species, the susceptibility of connected populations to disease outbreaks, and the public recreational value of populations that provide hunting and wildlife watching opportunities could all influence bighorn management strategies.
We believe the climate vulnerability assessment approach demonstrated here could be applied to the management of many wildlife species other than bighorn sheep. Species that exist in discrete populations due to naturally patchy habitat distribution or the existence of anthropogenic dispersal barriers are likely better suited to this approach than are species that are continuously distributed throughout their range. For well-studied species, previous research identifying specific environmental and climatic factors that influence exposure, sensitivity, adaptive capacity, or landscape connectivity could be used to further tailor this approach. However, vulnerability assessments for poorly studied species may need to rely more on species-neutral measures of climate vulnerability components (e.g., climate velocity or coarse-filter connectivity models based on landscape naturalness). Increasing use of genetic techniques in wildlife management and conservation (Pierson et al., 2016; Smith et al., 2016) suggests that genetic data needed to apply our approach may already exist for some species. Given the capacity for genetic data to expand our understanding of climate change vulnerability, acquiring these data for additional species and populations should be a priority.
Data Availability Statement
The datasets generated and analyzed for this study can be found in the FigShare respository at: https://doi.org/10.6084/m9.figshare.c.4998887.
Ethics Statement
Ethical review and approval was not required for the animal study because the study used non-invasive genetic sampling methods.
Author Contributions
TC, CE, and RM contributed to conception and design of the study. KL was instrumental in the development of the study that added data for 10 populations in the LAKE region. TC, CE, JW, JJ, KL, BH, WS, and RM performed the field work. RC, CE, JJ, and JW performed the lab work. TC wrote the first draft of the manuscript. TC, CE, and RC wrote sections of the manuscript. All authors contributed to manuscript revision and read and approved the submitted version.
Funding
Funding for this research was provided by a Provost’s Distinguished Graduate Fellowship from Oregon State University and NPS’s Climate Change Response Program (PMIS 162673). Sampling and data development in southern Nevada, adjacent Arizona, and southeastern California was funded by the Bureau of Land Management (Agreements FAA010017 and FAA060067) and NPS through LAKE (Coop Agreement H8R07060001, Task Agreements J8R07070011 and J8R07070012). Funding to NPS, LAKE was from the Southern Nevada Public Lands Management Act. The first sampling and data development in the DEVA region in California from the White and Inyo Mountains to Death Valley was funded by the California Department of Fish and Wildlife. Funding for sampling in GRCA was provided by NPS’s Natural Resources Preservation Program (PMIS 157851) and the Grand Canyon Conservancy.
Conflict of Interest
The authors declare that the research was conducted in the absence of any commercial or financial relationships that could be construed as a potential conflict of interest. Any use of trade, firm, or product names is for descriptive purposes only and does not imply endorsement by the U.S. Government.
Acknowledgments
We thank S. Ratchford, S. Holt, L. Manning, C. Crow, G. Lenhart, M. Miller, J. Spaak, M. Lamb, and L. Pilkington for assistance with field logistics and sample collection. C. Peterson and M. Corbin helped with genotyping samples and J. Greenwood assisted with extractions. M. Buchalski provided advice on genetic structure analyses.
Supplementary Material
The Supplementary Material for this article can be found online at: https://www.frontiersin.org/articles/10.3389/fevo.2020.00279/full#supplementary-material
References
AdaptWest Project (2015). Velocity of climate change grids for North America. Available online at: https://adaptwest.databasin.org/pages/adaptwest-velocitywna (accessed January 1, 2016).
Allendorf, F. W., and Luikart, G. (2009). Conservation and the Genetics of Populations. Chichester: John Wiley & Sons.
Anderson, R. P. (2013). A framework for using niche models to estimate impacts of climate change on species distributions. Ann. N. Y. Acad. Sci. 1297, 8–28. doi: 10.1111/nyas.12264
Araújo, M. B., and Peterson, A. T. (2012). Uses and misuses of bioclimatic envelope modeling. Ecology 93, 1527–1539. doi: 10.1890/11-1930.1
Bay, R. A., Harrigan, R. J., Underwood, V. L., Lisle Gibbs, H., Smith, T. B., and Ruegg, K. (2018). Genomic signals of selection predict climate-driven population declines in a migratory bird. Science 359, 83–86. doi: 10.1126/science.aan4380
Beever, E. A., Ray, C., Mote, P. W., and Wilkening, J. L. (2010). Testing alternative models of climate-mediated extirpations. Ecol. Appl. 20, 164–178. doi: 10.1890/08-1011.1
Bellard, C., Bertelsmeier, C., Leadley, P., Thuiller, W., and Courchamp, F. (2012). Impacts of climate change on the future of biodiversity. Ecol. Lett. 15, 365–377. doi: 10.1111/j.1461-0248.2011.01736.x
Bender, G. L. (1982). Reference Handbook on the Deserts of North America. Westport, CT: Greenwood Press.
Bender, L. C., and Weisenberger, M. E. (2005). Precipitation, density, and population dynamics of desert bighorn sheep on San Andres National Wildlife Refuge, New Mexico. Wildl. Soc. Bull. 33, 956–964. doi: 10.2193/0091-7648(2005)33[956:pdapdo]2.0.co;2
Blair, M. E., Rose, R. A., Ersts, P. J., Sanderson, E. W., Redford, K. H., Didier, K., et al. (2012). Incorporating climate change into conservation planning: identifying priority areas across a species’ range. Front. Biogeogr. 4, 157–167. doi: 10.21425/F5FBG12668
Boyce, W. M., Hedrick, P. W., Muggli-Cockett, N. E., Kalinowski, S., Penedo, M. C. T., and Ramey, R. R. (1997). Genetic variation of major histocompatibility complex and microsatellite loci: a comparison in bighorn sheep. Genetics 145, 421–433.
Brito-Morales, I., García Molinos, J., Schoeman, D. S., Burrows, M. T., Poloczanska, E. S., Brown, C. J., et al. (2018). Climate velocity can inform conservation in a warming world. Trends Ecol. Evol. 33, 441–457. doi: 10.1016/j.tree.2018.03.009
Brooker, R. W., Travis, J. M. J., Clark, E. J., and Dytham, C. (2007). Modelling species’ range shifts in a changing climate: the impacts of biotic interactions, dispersal distance and the rate of climate change. J. Theor. Biol. 245, 59–65. doi: 10.1016/j.jtbi.2006.09.033
Buchalski, M. R., Sacks, B. N., Gille, D. A., Penedo, M. C. T., Ernest, H. B., Morrison, S. A., et al. (2016). Phylogeographic and population genetic structure of bighorn sheep (Ovis canadensis) in North American deserts. J. Mammal. 97, 823–838. doi: 10.1093/jmammal/gyw011
Bush, A., Mokany, K., Catullo, R., Hoffmann, A., Kellermann, V., Sgrò, C., et al. (2016). Incorporating evolutionary adaptation in species distribution modelling reduces projected vulnerability to climate change. Ecol. Lett. 19, 1468–1478. doi: 10.1111/ele.12696
Butt, N., Possingham, H. P., De Los Rios, C., Maggini, R., Fuller, R. A., Maxwell, S. L., et al. (2016). Challenges in assessing the vulnerability of species to climate change to inform conservation actions. Biol. Conserv. 199, 10–15. doi: 10.1016/j.biocon.2016.04.020
Carroll, C., Lawler, J. J., Roberts, D. R., Hamann, A., Wilson, K. A., and Ridgely, R. S. (2015). Biotic and climatic velocity identify contrasting areas of vulnerability to climate change. PLoS One 10:e0140486. doi: 10.1371/journal.pone.0140486
Carroll, S. P., Jorgensen, P. S., Kinnison, M. T., Bergstrom, C. T., Denison, R. F., Gluckman, P., et al. (2014). Applying evolutionary biology to address global challenges. Science 346:1245993. doi: 10.1126/science.1245993
Caye, K., Jay, F., Michel, O., and François, O. (2018). Fast inference of individual admixture coefficients using geographic data. Ann. Appl. Stat. 12, 586–608. doi: 10.1214/17-aoas1106
Chapman, S., Mustin, K., Renwick, A. R., Segan, D. B., Hole, D. G., Pearson, R. G., et al. (2014). Publishing trends on climate change vulnerability in the conservation literature reveal a predominant focus on direct impacts and long time-scales. Divers. Distrib. 20, 1221–1228. doi: 10.1111/ddi.12234
Chetkiewicz, C.-L. B., and Boyce, M. S. (2009). Use of resource selection functions to identify conservation corridors. J. Appl. Ecol. 46, 1036–1047. doi: 10.1111/j.1365-2664.2009.01686.x
Corlatti, L., Hacklaender, K., and Frey-Roos, F. (2009). Ability of wildlife overpasses to provide connectivity and prevent genetic isolation. Conserv. Biol. 23, 548–556. doi: 10.1111/j.1523-1739.2008.01162.x
Creech, T. G., Epps, C. W., Landguth, E. L., Wehausen, J. D., Crowhurst, R. S., Holton, B., et al. (2017). Simulating the spread of selection-driven genotypes using landscape resistance models for desert bighorn sheep. PLoS One 12:e0176960. doi: 10.1371/journal.pone.0176960
Creech, T. G., Epps, C. W., Monello, R. J., and Wehausen, J. D. (2014). Using network theory to prioritize management in a desert bighorn sheep metapopulation. Landsc. Ecol. 29, 605–619. doi: 10.1007/s10980-014-0016-0
D’Amen, M., Zimmermann, N. E., and Pearman, P. B. (2013). Conservation of phylogeographic lineages under climate change. Glob. Ecol. Biogeogr. 22, 93–104. doi: 10.1111/j.1466-8238.2012.00774.x
Dawson, T. P., Jackson, S. T., House, J. I., Prentice, I. C., and Mace, G. M. (2011). Beyond predictions: biodiversity conservation in a changing climate. Science 332, 53–58. doi: 10.1126/science.1200303
Dobrowski, S. Z., Abatzoglou, J., Swanson, A. K., Greenberg, J. A., Mynsberge, A. R., Holden, Z. A., et al. (2013). The climate velocity of the contiguous United States during the 20th century. Glob. Chang. Biol. 19, 241–251. doi: 10.1111/gcb.12026
Dolan, B. F. (2006). Water developments and desert bighorn sheep: implications for conservation. Wildl. Soc. Bull. 34, 642–646. doi: 10.2193/0091-7648(2006)34[642:wdadbs]2.0.co;2
Douglas, C. L. (2001). Weather, disease, and bighorn lamb survival during 23 years in Canyonlands National Park. Wildl. Soc. Bull. 29, 297–305.
Driscoll, C. C., Driscoll, J. G., Hazekamp, C., Mitton, J. B., and Wehausen, J. D. (2015). A tale of two markers: population genetics of colorado rocky mountain bighorn sheep estimated from microsatellite and mitochondrial data. J. Wildl. Manage. 79, 819–831. doi: 10.1002/jwmg.895
Dyer, R. J. (2014). gstudio: Spatial Utility Functions from the Dyer Laboratory. R package version 1.2 (accessed January 1, 2016).
Epps, C. W., Bleich, V. C., Wehausen, J. D., and Torres, S. G. (2003). Status of bighorn sheep in California. Desert Bighorn Counc. Trans. 47, 20–35.
Epps, C. W., Crowhurst, R. S., and Nickerson, B. S. (2018). Assessing changes in functional connectivity in a desert bighorn sheep metapopulation after two generations. Mol. Ecol. 27, 2334–2346. doi: 10.1111/mec.14586
Epps, C. W., and Keyghobadi, N. (2015). Landscape genetics in a changing world: disentangling historical and contemporary influences and inferring change. Mol. Ecol. 24, 6021–6040. doi: 10.1111/mec.13454
Epps, C. W., McCullough, D. R., Wehausen, J. D., Bleich, V. C., and Rechel, J. L. (2004). Effects of climate change on population persistence of desert-dwelling mountain sheep in California. Conserv. Biol. 18, 102–113. doi: 10.1111/j.1523-1739.2004.00023.x
Epps, C. W., Palsbøll, P. J., Wehausen, J. D., Roderick, G. K., and McCullough, D. R. (2006). Elevation and connectivity define genetic refugia for mountain sheep as climate warms. Mol. Ecol. 15, 4295–4302. doi: 10.1111/j.1365-294x.2006.03103.x
Epps, C. W., Palsbøll, P. J., Wehausen, J. D., Roderick, G. K., Ramey, R. R., and McCullough, D. R. (2005). Highways block gene flow and cause a rapid decline in genetic diversity of desert bighorn sheep. Ecol. Lett. 8, 1029–1038. doi: 10.1111/j.1461-0248.2005.00804.x
Epps, C. W., Wehausen, J. D., Bleich, V. C., Torres, S. G., and Brashares, J. S. (2007). Optimizing dispersal and corridor models using landscape genetics. J. Appl. Ecol. 44, 714–724. doi: 10.1111/j.1365-2664.2007.01325.x
Ernest, H. B., Rubin, E. S., and Boyce, W. M. (2002). Fecal DNA analysis and risk assessment of mountain lion predation of bighorn sheep. J. Wildl. Manage. 66, 75–85.
Foden, W. B., Butchart, S. H. M., Stuart, S. N., Vié, J.-C., Akçakaya, H. R., Angulo, A., et al. (2013). Identifying the world’s most climate change vulnerable species: a systematic trait-based assessment of all birds, amphibians and corals. PLoS One 8:e65427. doi: 10.1371/journal.pone.0065427
Foden, W. B., Young, B. E., Akçakaya, H. R., Garcia, R. A., Hoffmann, A. A., Stein, B. A., et al. (2019). Climate change vulnerability assessment of species. Wiley Interdiscip. Rev. Clim. Chang. 10:e551.
Forbes, S. H., Hogg, J. T., Buchanan, F. C., Crawford, A. M., and Allendorf, F. W. (1995). Microsatellite evolution in congeneric mammals: domestic and bighorn sheep. Mol. Biol. Evol. 12, 1106–1113.
Frichot, E., and François, O. (2015). LEA: an R package for landscape and ecological association studies. Methods Ecol. Evol. 6, 925–929. doi: 10.1111/2041-210x.12382
Gagnon, J. W., Loberger, C. D., Sprague, S. C., Priest, M., Boe, S., Ogren, K., et al. (2013). “Evaluation of desert bighorn sheep overpasses along US Highway 93 in Arizona, USA,” in Proceedings of the 2013 International Conference on Ecology and Transportation, Scottsdale, AZ.
Garfin, G., Franco, G., Blanco, H., Comrie, A., Gonzalez, P., Piechota, R., et al. (2014). “Chapter 20: Southwest,” in Climate Change Impacts in the United States: The Third National Climate Assessment, eds J. M. Melillo, T. C. Richmond, and G. W. Yohe (Washington, DC: U.S. Global Climate Change Research Program), 462–486.
Gionfriddo, J. P., and Krausman, P. R. (1986). Summer habitat use by mountain sheep. J. Wildl. Manage. 50, 331–336.
Gonzalez, P., Wang, F., Notaro, M., Vimont, D. J., and Williams, J. W. (2018). Disproportionate magnitude of climate change in United States national parks. Environ. Res. Lett. 13:104001. doi: 10.1088/1748-9326/aade09
Guillot, G., Mortier, F., and Estoup, A. (2005). GENELAND: a computer package for landscape genetics. Mol. Ecol. Notes 5, 712–715. doi: 10.1111/j.1471-8286.2005.01031.x
Gutiérrez-Espeleta, G. A., Kalinowski, S. T., Boyce, W. M., and Hedrick, P. W. (2000). Genetic variation and population structure in desert bighorn sheep: implications for conservation. Conserv. Genet. 1, 3–15.
Halofsky, J. E., Peterson, D. L., and Marcinkowski, K. W. (2015). Climate Change Adaptation in United States Federal Natural Resource Science and Management Agencies: A Synthesis. Washington, DC: U.S. Global Change Research Program.
Hamann, A., Roberts, D. R., Barber, Q. E., Carroll, C., and Nielsen, S. E. (2015). Velocity of climate change algorithms for guiding conservation and management. Glob. Chang. Biol. 21, 997–1004. doi: 10.1111/gcb.12736
Hedgecock, D., Barber, P., and Edmands, S. (2007). Genetic approaches to measuring connectivity. Oceanography 20, 70–79. doi: 10.5670/oceanog.2007.30
Hedrick, P. W., and Wehausen, J. D. (2014). Desert bighorn sheep: changes in genetic variation over time and the impact of merging populations. J. Fish Wildl. Manag. 5, 3–13. doi: 10.3996/082013-jfwm-055
Hendry, A. P., Kinnison, M. T., Heino, M., Day, T., Smith, T. B., Fitt, G., et al. (2011). Evolutionary principles and their practical application. Evol. Appl. 4, 159–183. doi: 10.1111/j.1752-4571.2010.00165.x
Hess, G. (1996). Disease in metapopulation models: implications for conservation. Ecology 77, 1617–1632. doi: 10.2307/2265556
Hess, G. R. (1994). Conservation corridors and contagious disease: a cautionary note. Conserv. Biol. 8, 256–262. doi: 10.1046/j.1523-1739.1994.08010256.x
Hoban, S. (2018). Integrative conservation genetics: Prioritizing populations using climate predictions, adaptive potential and habitat connectivity. Mol. Ecol. Resour. 18, 14–17. doi: 10.1111/1755-0998.12752
Hoffmann, A. A., and Sgro, C. M. (2011). Climate change and evolutionary adaptation. Nature 470, 479–485.
Holderegger, R., Kamm, U., and Gugerli, F. (2006). Adaptive vs. neutral genetic diversity: implications for landscape genetics. Landsc. Ecol. 21, 797–807. doi: 10.1007/s10980-005-5245-9
Holl, S. A., Bleich, V. C., and Torres, S. G. (2004). Population dynamics of bighorn sheep in the San Gabriel Mountains, California, 1967–2002. Wildl. Soc. Bull. 32, 412–426. doi: 10.2193/0091-7648(2004)32[412:pdobsi]2.0.co;2
Ikeda, D. H., Max, T. L., Allan, G. J., Lau, M. K., Shuster, S. M., and Whitham, T. G. (2017). Genetically informed ecological niche models improve climate change predictions. Glob. Chang. Biol. 23, 164–176. doi: 10.1111/gcb.13470
Jaeger, J. R., and Wehausen, J. D. (2012). Development of a Habitat Management Plan to Maintain Viability of the Desert Bighorn Sheep Population in the River Mountains, Nevada: Analysis of Mitochondrial DNA Diversity and Connectivity. Final Report to the National Park Service. Las Vegas, NV: University of Nevada.
Jahner, J. P., Matocq, M. D., Malaney, J. L., Cox, M., Wolff, P., Gritts, M. A., et al. (2019). The genetic legacy of 50 years of desert bighorn sheep translocations. Evol. Appl. 12, 198–213. doi: 10.1111/eva.12708
Janes, J. K., Miller, J. M., Dupuis, J. R., Malenfant, R. M., Gorrell, J. C., Cullingham, C. I., et al. (2017). The K = 2 conundrum. Mol. Ecol. 26, 3594–3602.
Johnson, K. A. (2014). Climate Change Vulnerability Assessment for Natural Resources Management: Toolbox of Methods with Case Studies, version 2.0. Arlington, VA: U.S. Fish and Wildlife Service.
Jombart, T. (2008). adegenet: a R package for the multivariate analysis of genetic markers. Bioinformatics 24, 1403–1405. doi: 10.1093/bioinformatics/btn129
Jombart, T., Devillard, S., and Balloux, F. (2010). Discriminant analysis of principal components: a new method for the analysis of genetically structured populations. BMC Genet. 11:94. doi: 10.1186/1471-2156-11-94
Kalinowski, S. T. (2011). The computer program STRUCTURE does not reliably identify the main genetic clusters within species: simulations and implications for human population structure. Heredity 106, 625–632. doi: 10.1038/hdy.2010.95
Leberg, P. L. (2002). Estimating allelic richness: effects of sample size and bottlenecks. Mol. Ecol. 11, 2445–2449. doi: 10.1046/j.1365-294x.2002.01612.x
Linløkken, A. N. (2018). “Genetic diversity in small populations,” in Genetic Diversity and Disease Susceptibility, ed. Y. Liu (London: IntechOpen), 43–55.
Loarie, S. R., Duffy, P. B., Hamilton, H., Asner, G. P., Field, C. B., and Ackerly, D. D. (2009). The velocity of climate change. Nature 462, 1052–1055.
Longshore, K., and Thompson, D. B. (2013). Detecting short-term responses to weekend recreation activity: desert bighorn sheep avoidance of hiking trails. Wildl. Soc. Bull. 37, 698–706. doi: 10.1002/wsb.349
Longshore, K. M., Lowrey, C., and Thompson, D. B. (2009). Compensating for diminishing natural water: predicting the impacts of water development on summer habitat of desert bighorn sheep. J. Arid Environ. 73, 280–286. doi: 10.1016/j.jaridenv.2008.09.021
Lowe, W. H., and Allendorf, F. W. (2010). What can genetics tell us about population connectivity? Mol. Ecol. 19, 3038–3051. doi: 10.1111/j.1365-294x.2010.04688.x
Malaney, J. L., Feldman, C. R., Cox, M., Wolff, P., Wehausen, J. D., and Matocq, M. D. (2015). Translocated to the fringe: genetic and niche variation in bighorn sheep of the Great Basin and northern Mojave deserts. Divers. Distrib. 21, 1063–1074. doi: 10.1111/ddi.12329
McRae, B. H., and Kavanagh, D. M. (2011). Linkage Mapper. Available online at: http://www.circuitscape.org/linkagemapper (accessed January 1, 2016).
Meirmans, P., and Hedrick, P. (2011). Assessing population structure: FST and related measures. Mol. Ecol. Resour. 11, 5–18. doi: 10.1111/j.1755-0998.2010.02927.x
Merilä, J., and Hendry, A. P. (2014). Climate change, adaptation, and phenotypic plasticity: the problem and the evidence. Evol. Appl. 7, 1–14. doi: 10.1111/eva.12137
Miller, J. M., Malenfant, R. M., David, P., Davis, C. S., Poissant, J., Hogg, J. T., et al. (2014). Estimating genome-wide heterozygosity: effects of demographic history and marker type. Heredity 112, 240–247. doi: 10.1038/hdy.2013.99
Nickerson, B. S. (2014). Effects of Genetic Drift, Natural Selection, and Population Connectivity on Adaptive-Linked Genetic Diversity of Desert Bighorn Sheep. Master’s thesis, Oregon State University, Corvallis, OR.
Nicotra, A. B., Beever, E. A., Robertson, A. L., Hofmann, G. E., and O’Leary, J. (2015). Assessing the components of adaptive capacity to improve conservation and management efforts under global change. Conserv. Biol. 29, 1268–1278. doi: 10.1111/cobi.12522
Pacifici, M., Foden, W., Visconti, P., Watson, J., Butchart, S., Kovacs, K., et al. (2015). Assessing species vulnerability to climate change. Nat. Clim. Chang. 5, 215–225.
Parmesan, C., and Yohe, G. (2003). A globally coherent fingerprint of climate change impacts across natural systems. Nature 421, 37–42. doi: 10.1038/nature01286
Pearson, R. G., Stanton, J. C., and Shoemaker, K. T. (2014). Life history and spatial traits predict extinction risk due to climate change. Nat. Clim. 4, 217–221. doi: 10.1038/nclimate2113
Perez, M. F., Franco, F. F., Bombonato, J. R., Bonatelli, I. A. S., Khan, G., Romeiro-Brito, M., et al. (2018). Assessing population structure in the face of isolation by distance: Are we neglecting the problem? Divers. Distrib. 24, 1883–1889. doi: 10.1111/ddi.12816
Petit, R. J., El Mousadik, A., and Pons, O. (2008). Identifying populations for conservation on the basis of genetic markers. Conserv. Biol. 12, 844–855. doi: 10.1111/j.1523-1739.1998.96489.x
Pierson, J. C., Coates, D. J., Oostermeijer, J. G. B., Beissinger, S. R., Bragg, J. G., Sunnucks, P., et al. (2016). Genetic factors in threatened species recovery plans on three continents. Front. Ecol. Environ. 14, 433–440. doi: 10.1002/fee.1323
Porfirio, L. L., Harris, R. M. B., Lefroy, E. C., Hugh, S., Gould, S. F., Lee, G., et al. (2014). Improving the use of species distribution models in conservation planning and management under climate change. PLoS One 9:e113749. doi: 10.1371/journal.pone.0113749
Pritchard, J. K., Stephens, M., and Donnelly, P. (2000). Inference of population structure using multilocus genotype data. Genetics 155, 945–959.
Prugh, L. R. (2009). An evaluation of patch connectivity measures. Ecol. Appl. 19, 1300–1310. doi: 10.1890/08-1524.1
Prunier, J., Laroche, J., Beaulieu, J., and Bosquet, J. (2011). Scanning the genome for gene SNPs related to climate adaptation and estimating selection at the molecular level in boreal black spruce. Mol. Ecol. 20, 1702–1716. doi: 10.1111/j.1365-294x.2011.05045.x
R Development Core Team (2017). R: A Language and Environment for Statistical Computing. Vienna: R Foundation for Statistical Computing.
Razgour, O., Forester, B., Taggart, J. B., Bekaert, M., Juste, J., Ibáñez, C., et al. (2019). Considering adaptive genetic variation in climate change vulnerability assessment reduces species range loss projections. Proc. Natl. Acad. Sci. U.S.A. 116, 10418–10423. doi: 10.1073/pnas.1820663116
Razgour, O., Taggart, J. B., Manel, S., Juste, J., Ibáñez, C., Rebelo, H., et al. (2018). An integrated framework to identify wildlife populations under threat from climate change. Mol. Ecol. Resour. 18, 18–31. doi: 10.1111/1755-0998.12694
Reed, D. H., and Frankham, R. (2001). How closely correlated are molecular and quantitative measures of genetic variation? A meta-analysis. Evolution 55, 1095–1103. doi: 10.1111/j.0014-3820.2001.tb00629.x
Reed, D. H., and Frankham, R. (2003). Correlation between fitness and genetic diversity. Conserv. Biol. 17, 230–237. doi: 10.1046/j.1523-1739.2003.01236.x
Renaud, L.-A., Pigeon, G., Festa-Bianchet, M., and Pelletier, F. (2019). Phenotypic plasticity in bighorn sheep reproductive phenology: from individual to population. Behav. Ecol. Sociobiol. 73:50.
Rominger, E. M., Whitlaw, H. A., Weybright, D. L., Dunn, W. C., and Ballard, W. B. (2004). The influence of mountain lion predation on bighorn sheep translocations. J. Wildl. Manage. 68, 993–999. doi: 10.2193/0022-541x(2004)068[0993:tiomlp]2.0.co;2
Rousset, F. (1997). Genetic differentiation and estimation of gene flow from F-statistics under isolation by distance. Genetics 145, 1219–1228.
Sappington, J. M., Longshore, K. M., and Thompson, D. B. (2007). Quantifying landscape ruggedness for animal habitat analysis: a case study using bighorn sheep in the Mojave Desert. J. Wildl. Manage. 71, 1419–1426. doi: 10.2193/2005-723
Schwalm, D., Epps, C. W., Rodhouse, T. J., Monahan, W. B., Castillo, J. A., Ray, C., et al. (2016). Habitat availability and gene flow influence diverging local population trajectories under scenarios of climate change: a place-based approach. Glob. Chang. Biol. 22, 1572–1584. doi: 10.1111/gcb.13189
Sexton, J. P., Strauss, S. Y., and Rice, K. J. (2011). Gene flow increases fitness at the warm edge of a species’ range. Proc. Natl. Acad. Sci. U.S.A. 108, 11704–11709. doi: 10.1073/pnas.1100404108
Sgro, C. M., Lowe, A. J., and Hoffmann, A. A. (2011). Building evolutionary resilience for conserving biodiversity under climate change. Evol. Appl. 4, 326–337. doi: 10.1111/j.1752-4571.2010.00157.x
Simberloff, D., and Cox, J. (1987). Consequences and costs of conservation corridors. Conserv. Biol. 1, 63–71. doi: 10.1111/j.1523-1739.1987.tb00010.x
Singer, F. J., and Gudorf, M. A. (1999). Restoration of Bighorn Sheep Metapopulations in and Near 15 National Parks: Conservation of a Severely Fragmented Species. Volume I: Planning, Problem Definition, Key Findings, and Restoration. Fort Collins, CO: U.S. Geological Survey.
Smith, A. B., Beever, E. A., Kessler, A. E., Johnston, A. N., Ray, C., Epps, C. W., et al. (2019). Alternatives to genetic affinity as a context for within-species response to climate. Nat. Clim. Chang. 9, 787–794.
Smith, C. T., Adams, B., Bartron, M., Burnham-Curtis, M. K., Monroe, E., Olsen, J. B., et al. (2016). Comment on Haig et al. (2016): the conservation genetics juggling act: integrating genetics and ecology, science and policy. Evol. Appl. 9, 635–637. doi: 10.1111/eva.12374
Staudinger, M., Morelli, T., and Bryan, A. (2015). Integrating Climate Change into Northeast and Midwest State Wildlife Action Plans. Amherst, MA: Northeast Climate Science Center.
Summers, D. M., Bryan, B. A., Crossman, N. D., and Meyer, W. S. (2012). Species vulnerability to climate change: impacts on spatial conservation priorities and species representation. Glob. Chang. Biol. 18, 2335–2348. doi: 10.1111/j.1365-2486.2012.02700.x
Thomas, C. D., Cameron, A., Green, R. E., Bakkenes, M., Beaumont, L. J., Collingham, Y. C., et al. (2004). Extinction risk from climate change. Nature 427, 145–148.
Urban, M. C. (2015). Accelerating extinction risk from climate change. Science 348, 571–573. doi: 10.1126/science.aaa4984
Urban, M. C., Bocedi, G., Hendry, A. P., Mihoub, J.-B., Pe’er, G., Singer, A., et al. (2016). Improving the forecast for biodiversity under climate change. Science 353:aad8466.
Utah Division of Wildlife Resources (2013). Utah Bighorn Sheep Statewide Management Plan. Salt Lake City, UT: Utah Department of Natural Resources.
van Vuuren, D. P., Edmonds, J., Kainuma, M., Riahi, K., Thomson, A., Hibbard, K., et al. (2011). The representative concentration pathways: an overview. Clim. Change 109, 5–31. doi: 10.1007/s10584-011-0148-z
Weeks, A. R., Sgro, C. M., Young, A. G., Frankham, R., Mitchell, N. J., Miller, K. A., et al. (2011). Assessing the benefits and risks of translocations in changing environments: a genetic perspective. Evol. Appl. 4, 709–725. doi: 10.1111/j.1752-4571.2011.00192.x
Wehausen, J. D. (1996). Effects of mountain lion predation on bighorn sheep in the Sierra Nevada and Granite Mountains of California. Wildl. Soc. Bull. 24, 471–479.
Wehausen, J. D., Bleich, V. C., Blong, B., and Russi, T. L. (1987). Recruitment dynamics in a Southern California mountain sheep population. J. Wildl. Manage. 51, 86–98.
Wehausen, J. D., Kelley, S. T., and Ramey, R. R. (2011). Domestic sheep, bighorn sheep, and respiratory disease: a review of the experimental evidence. Calif. Fish Game 97, 7–24.
Wehausen, J. D., and Ramey, R. R. (2000). Cranial morphometric and evolutionary relationships in the northern range of Ovis canadensis. J. Mammal. 81, 145–161. doi: 10.1093/jmammal/81.1.145
Wehausen, J. D., Ramey, R. R., and Epps, C. W. (2004). Experiments in DNA extraction and PCR amplification from bighorn sheep feces: the importance of DNA extraction method. J. Hered. 95, 503–509. doi: 10.1093/jhered/esh068
Weir, B. S., and Cockerham, C. C. (1984). Estimating F-statistics for the analysis of population structure. Evolution 38, 1358–1370. doi: 10.1111/j.1558-5646.1984.tb05657.x
Whittaker, D. G., Ostermann, S. D., and Boyce, W. M. (2004). Genetic variability of reintroduced California bighorn sheep in Oregon. J. Wildl. Manage. 68, 850–859. doi: 10.2193/0022-541x(2004)068[0850:gvorcb]2.0.co;2
Wiedmann, B. P., and Bleich, V. C. (2014). Demographic responses of bighorn sheep to recreational activities: a trial of a trail. Wildl. Soc. Bull. 38, 773–782. doi: 10.1002/wsb.463
Wiedmann, B. P., and Sargeant, G. A. (2014). Ecotypic variation in recruitment of reintroduced bighorn sheep: implications for translocation. J. Wildl. Manage. 78, 394–401. doi: 10.1002/jwmg.669
Wiens, J. A., Stralberg, D., Jongsomjit, D., Howell, C. A., and Snyder, M. A. (2009). Niches, models, and climate change: assessing the assumptions and uncertainties. Proc. Natl. Acad. Sci. U.S.A. 106, 19729–19736. doi: 10.1073/pnas.0901639106
Wiens, J. J. (2016). Climate-related local extinctions are already widespread among plant and animal species. PLoS Biol. 14:e2001104. doi: 10.1371/journal.pbio.2001104
Wild Sheep Working Group (2015). Records of Wild Sheep Translocations - United States and Canada, 1922-Present. Available online at: https://www.wafwa.org/DocumentsandSettings/37/SiteDocuments/WorkingGroups/WildSheep/Publications/RecordsofWildSheepTranslocations-United~StatesandCanada,1922-Present-Reduced.pdf (accessed January 1, 2016).
Williams, A. P., Allen, C. D., Millar, C. I., Swetnam, T. W., Michaelsen, J., Still, C. J., et al. (2010). Forest responses to increasing aridity and warmth in the southwestern United States. Proc. Natl. Acad. Sci. U.S.A. 107, 21289–21294. doi: 10.1073/pnas.0914211107
Keywords: connectivity, genetic diversity, genetic structure, Ovis canadensis, vulnerability
Citation: Creech TG, Epps CW, Wehausen JD, Crowhurst RS, Jaeger JR, Longshore K, Holton B, Sloan WB and Monello RJ (2020) Genetic and Environmental Indicators of Climate Change Vulnerability for Desert Bighorn Sheep. Front. Ecol. Evol. 8:279. doi: 10.3389/fevo.2020.00279
Received: 12 December 2019; Accepted: 06 August 2020;
Published: 26 August 2020.
Edited by:
Vernon Bleich, University of Nevada, Reno, United StatesReviewed by:
Francesc Mestres, University of Barcelona, SpainInger Suzanne Prange, Appalachian Wildlife Research Institute (United States), United States
Copyright © 2020 Creech, Epps, Wehausen, Crowhurst, Jaeger, Longshore, Holton, Sloan and Monello. This is an open-access article distributed under the terms of the Creative Commons Attribution License (CC BY). The use, distribution or reproduction in other forums is permitted, provided the original author(s) and the copyright owner(s) are credited and that the original publication in this journal is cited, in accordance with accepted academic practice. No use, distribution or reproduction is permitted which does not comply with these terms.
*Correspondence: Tyler G. Creech, tyler@largelandscapes.org
†Present address: Tyler G. Creech, Center for Large Landscape Conservation, Bozeman, MT, United States