Time Is Not Money: Income Is More Important Than Lifestage for Explaining Patterns of Residential Yard Plant Community Structure and Diversity in Baltimore
 Meghan Avolio
 Allison Blanchette
 Nancy F. Sonti
 Dexter H. Locke
- 1Department of Earth and Planetary Sciences, Johns Hopkins University, Baltimore, MD, United States
- 2USDA Forest Service, Northern Research Station, Baltimore Field Station, Baltimore, MD, United States
Plant biodiversity is affected by limiting resources such as water, nutrients, and sunlight. In urban settings, such as residential yards, however, limiting resources may also include the social factors of time and money spent on yard care. To examine the role that these precious human resources play in determining plant community structure and diversity, we surveyed homeowners and their yards in 12 neighborhoods across Baltimore City and Baltimore County, Maryland, visiting a total of 96 residential properties. We chose neighborhoods based on residents’ median income (a proxy for money) and lifestage (a proxy for time) as determined by ESRI’s Tapestry dataset [older (>65 and most likely retired with more free time) versus younger (<65 and most likely working with less free time)]. At each residential yard, we studied four major plant types: lawn species, flowering herbaceous plants (excluding grasses), trees, and invasive species. For the flowering plants, we documented the number, size, and color of flowers, and calculated total floral area. We found that residential yards harbored high plant diversity with 89 tree species, 82 lawn species, and 80 flowering plant genera. Lawn richness was not related to the neighborhood-level lifestage of the residents or their income; rather, all lawns were equally weedy. Consistently, we found that yards in higher income neighborhoods and larger yards had greater abundance of plants and greater diversity of flowering herbaceous plants, trees, and invasive species, whereas lifestage was rarely associated with plant diversity. Additionally, we found front yards had greater floral area than back yards, while back yards had greater tree abundance and tree diversity than front yards. Finally, we found that residents who spent more time doing yard work had more flowering plants, flower colors, and floral genera. Overall, yards in high-income neighborhood, and large yards had the greatest plant biodiversity, indicating that money is the more precious human resource for creating and maintaining biodiverse residential yards.
Introduction
Residential yards provide an opportunity to study human–environment interactions in an urban setting. Residential land comprises a considerable portion of urban land area, estimated at 41% (Nowak et al., 1996), and provides an important resource for urban biodiversity (Davies et al., 2009). Given their high land cover, residential yards have been proposed to play a role in conservation of biodiversity in cities (Goddard et al., 2010; Lerman and Warren, 2011). Indeed, plant diversity in residential yards is often higher than in surrounding natural ecosystems (Pearse et al., 2018; Avolio et al., 2019b). While cultivated urban plant biodiversity is controlled, to an extent, by traditional ecological drivers such as climate (Jenerette et al., 2016; Padullés Cubino et al., 2019b; Pearse et al., 2018) and space availability (van Heezik et al., 2014; Padullés Cubino et al., 2019b), it is also shaped by residents’ preferences and management activities, which may be influenced by their learned experience and social norms (Roy Chowdhury et al., 2011; Cook et al., 2012; Politi Bertoncini et al., 2012; Avolio et al., 2018). The management activities of residents depend on the amount of money and time they have to spend on their yard. However, to our knowledge, the interaction between these important anthropogenic resources remains under-investigated.
Residents’ median household income has a positive correlation with plant species richness (Hope et al., 2003; Leong et al., 2018). One of the potential explanations for this pattern is that wealthier homeowners may have larger yards that can support more species (Hope et al., 2003). They may also be able to afford more naturally biodiverse land (Hope et al., 2003) and/or avoid contaminated land that may support fewer plant species (McClintock, 2012; Aelion et al., 2013). With a higher income, residents have the ability to spend more money purchasing plants, particularly by going to nurseries that are more expensive and provide a greater selection of plants than larger chain stores (Avolio et al., 2018). In addition, money can buy another important human resource: time for yard care.
There is some evidence that the lifestage of urban residents may impact the biodiversity found in their yards. Lifestage incorporates a person’s age and career stage (for example, whether a person has young children at home and/or whether they are working or if they are retired). Kendal et al. (2012) found greater species richness in the garden beds of older residents. This may be because lifestage relates to time spent doing yard work. Gardening has been found to be a common leisure activity for retirees, who report that it leads to greater life satisfaction (Cheng et al., 2010). Bhatti (2006) found that retired residents spend more time gardening, and that the garden helps older adults maintain a sense of home, self-identity, and independence. In another study, retired residents nearly made a new career out of their yard and garden, spending more time working on it than when they were younger (Gross and Lane, 2007). As for working residents, Goodness (2018) found that homeowners with full-time jobs cited a lack of time to do yard work and Loram et al. (2011) noted that homeowners with younger children may have less time to garden compared with those that are older and retired. Lifestage contributes to defining a person’s lifestyle; lifestyle includes age, employment status, income, race, and several other socio-demographic variables (Troy, 2008). Resident lifestyle has been found to be a good predictor of willingness to participate in tree giveaway programs (Locke and Grove, 2016) and amount of money spent on lawn care (Zhou et al., 2009), and is correlated with tree and vegetation cover (Boone et al., 2010; Grove et al., 2014), as well as lawn greenness (Zhou et al., 2009). Although links between lifestyle and urban vegetation have been explored in previous research, the associations between lifestage and patterns of urban residential biodiversity remain under-investigated.
In addition to residents’ income and lifestage, research has shown that social norms are an important driver of residential land management (Robbins et al., 2001; Robbins, 2007; Harris et al., 2012, 2013). Social norms operate through visibility of the yard, as residents believe that having a socially acceptable yard aesthetic prevents ostracization (or reduces residents’ fear of being looked down upon). Front yards are much more visible than back yards and, accordingly, the effect of social norms on yard management may also be diminished in back yards (Locke et al., 2018a, b). Indeed, researchers have found different yard management practices between front and back yards (Larsen and Harlan, 2006; Larson et al., 2009; Locke et al., 2018b). These different management practices result in different patterns of biodiversity in front versus back yards. For example, research has found fewer species of ornamental plants (Vila-Ruiz et al., 2014), and showy plants (Daniels and Kirkpatrick, 2006), but more edible species in back yards (Vila-Ruiz et al., 2014). Overall, it remains unclear how social norms interact with limiting human resources such as income and time to determine urban yard plant biodiversity.
Abiotic resources (e.g., yard size), human resources (e.g., time and money), and social pressures (e.g., front vs. back yard location) are all important drivers of yard care and biodiversity patterns, but their interacting effects are unstudied. Here, we ask: what are the relationships between income (a proxy for money available to spend on yards) and lifestage (a proxy for time available for yard work) on patterns of yard plant community structure and diversity? We hypothesized that residents with higher incomes or in a more advanced lifestage would have more plants and species in their yards than younger and lower income residents. We also hypothesized that we would see an interaction between income and lifestage, where residents who did not have time, but could pay for someone to do yard work, would also have more cultivated flower and tree biodiversity, but fewer lawn weeds and invasive species. Lastly, we hypothesized that there would be more plants and species in front versus back yards, and that this pattern would be stronger for higher income residents as a result of more intense social pressures in high-income neighborhoods. We tested these hypotheses across 96 homes in Baltimore City and County, Maryland. In this study we also created new measures of floral diversity, because residents respond strongly to flowers and floral diversity is not accurately captured with traditional measures of biodiversity.
Materials and Methods
Study Area
Baltimore, Maryland is located in the temperate deciduous forest ecoregion and is in the Chesapeake Bay watershed. It is a post-industrial city that has suffered from decades of depopulation and economic disinvestment (Boone et al., 2009; Grove et al., 2015). Baltimore City and Baltimore County, which are administratively distinct and do not overlap, have 602,000 and 828,000 residents, respectively. Residents of Baltimore City are predominantly African American (63%) while Baltimore County is mostly White (61%). Median household income in 2017 dollars was much lower in Baltimore City ($46,641) than in the County ($71,819). Baltimore City is much more densely settled, with a population per square mile of 7,671 compared to the County’s 1,345 people per square mile (U.S. Census Bureau, 2019). For this study, we determined that in Baltimore City and County, 89.3% of all property parcels are residential, representing more than 460,000 unique ownerships, which represents a plurality of land area (39.2%).
Study Design
In this study, neighborhoods are represented by year 2010 Census block groups. A market segmentation dataset called “Tapestry” was used to select block groups, hereafter neighborhoods (ESRI, 2017). Market segmentation datasets use a spatial cluster analysis of Census-derived socioeconomic and demographic variables, including age, credit card expenditures, magazine subscriptions, car registration records, and other datasets linked to home addresses to derive consumer categories (Troy, 2008), called market segments or lifestyle groups. In Tapestry, lifestyle groups are under the umbrella of LifeMode groups, which categorize lifestyles by broader common experiences, such as being part of the same generation (ESRI, 2017). Using 2017 Tapestry data (ESRI, 2017), two LifeMode groups within Baltimore City and Baltimore County were selected to represent older retired residents with more free time, “Senior Styles,” and younger working residents with less free time, “Middle Ground.” Residents in the Senior Styles LifeMode are described as “empty nesters” who “prefer print to digital media,” while those in the Middle Ground LifeMode are described as “thirty-somethings” or “millennials” who are “online all the time” (ESRI, 2017). We used these two Tapestry derived LifeModes to set up the lifestage contrast in our study design, hereafter referred to as lifestage. We then used median household income from the 2017 American Community Survey (ACS) to add an income contrast. We examined the ranges of median household income per neighborhood within each of the two lifestages, and defined middle-income as between 45 and 56K USD per year and high income as between 70 and 91K USD per year. Thus, we had four categories of neighborhoods, Senior Styles—Middle Income, Senior Styles—High Income, Middle Ground—Middle Income, and Middle Ground—High Income (Figure 1A and Table 1). In each category, we selected three neighborhoods, for a total of 12 neighborhoods. Ultimately, the average median neighborhood income—based on Census block group data—of the houses we surveyed was (mean ± SE) $81,601 USD ± 1001 for high income and $50,510 USD ± 402 for middle income. The percent of the population over 65 years of age—again based on Census block group data—was 31% ± 0.56 in Senior Styles and 14% ± 0.44 in Middle Ground.
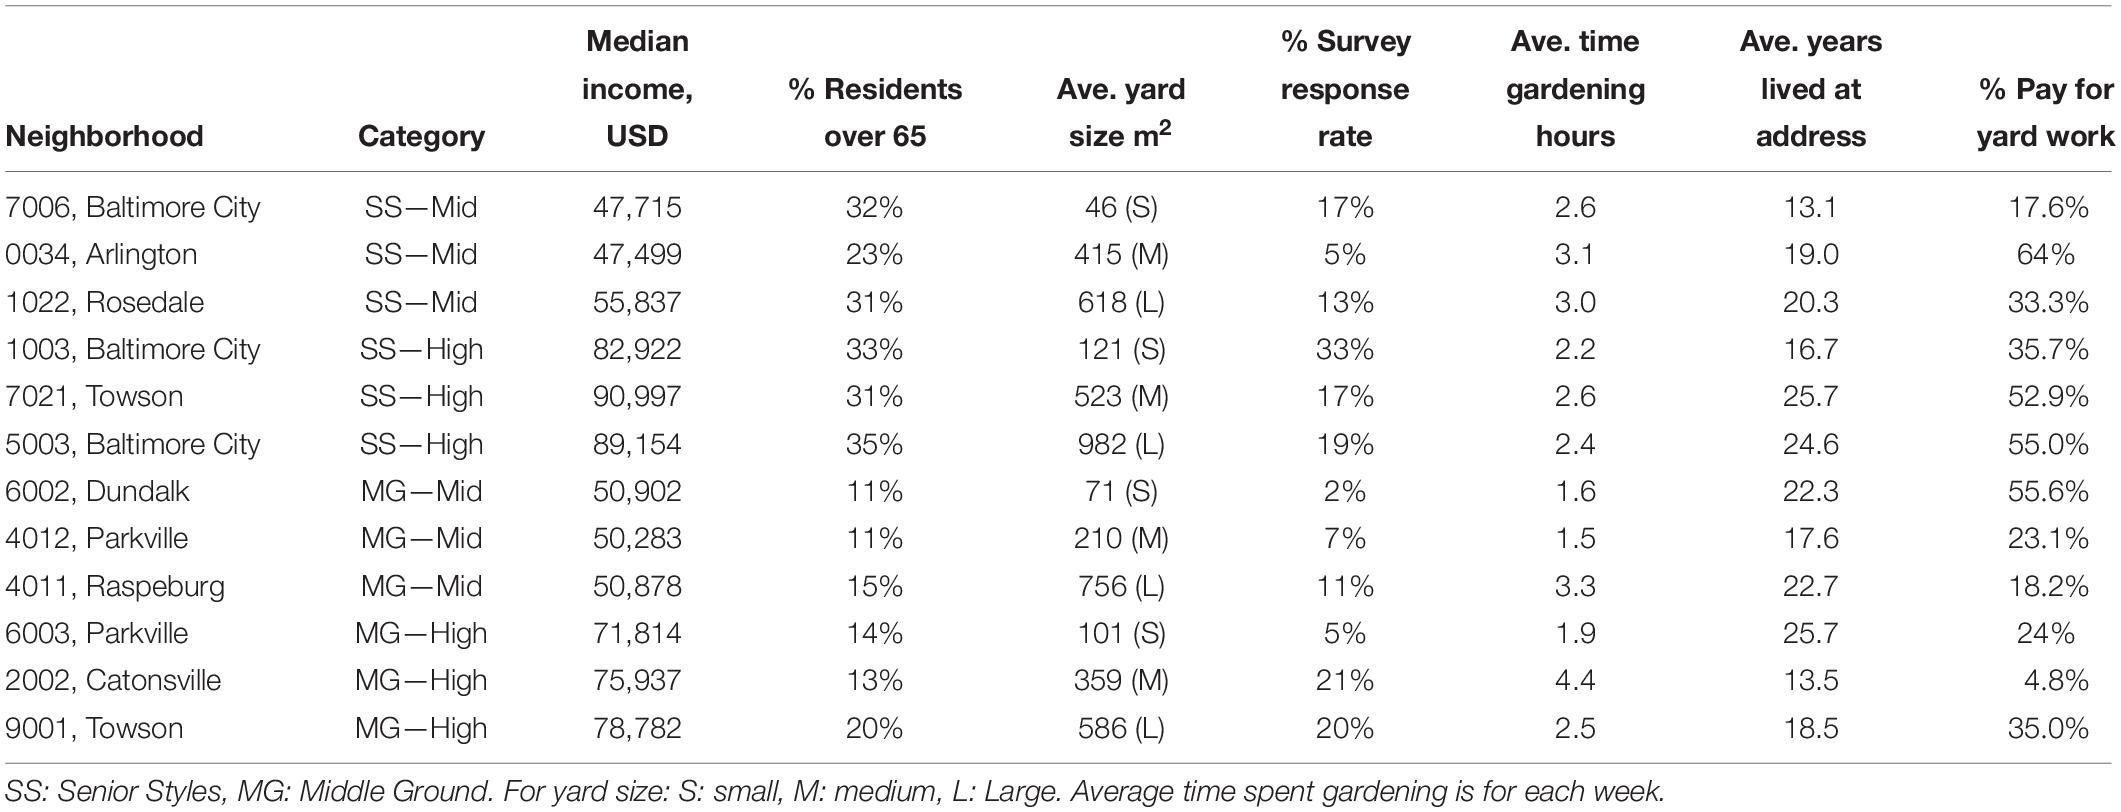
Table 1. Information on neighborhoods visited.
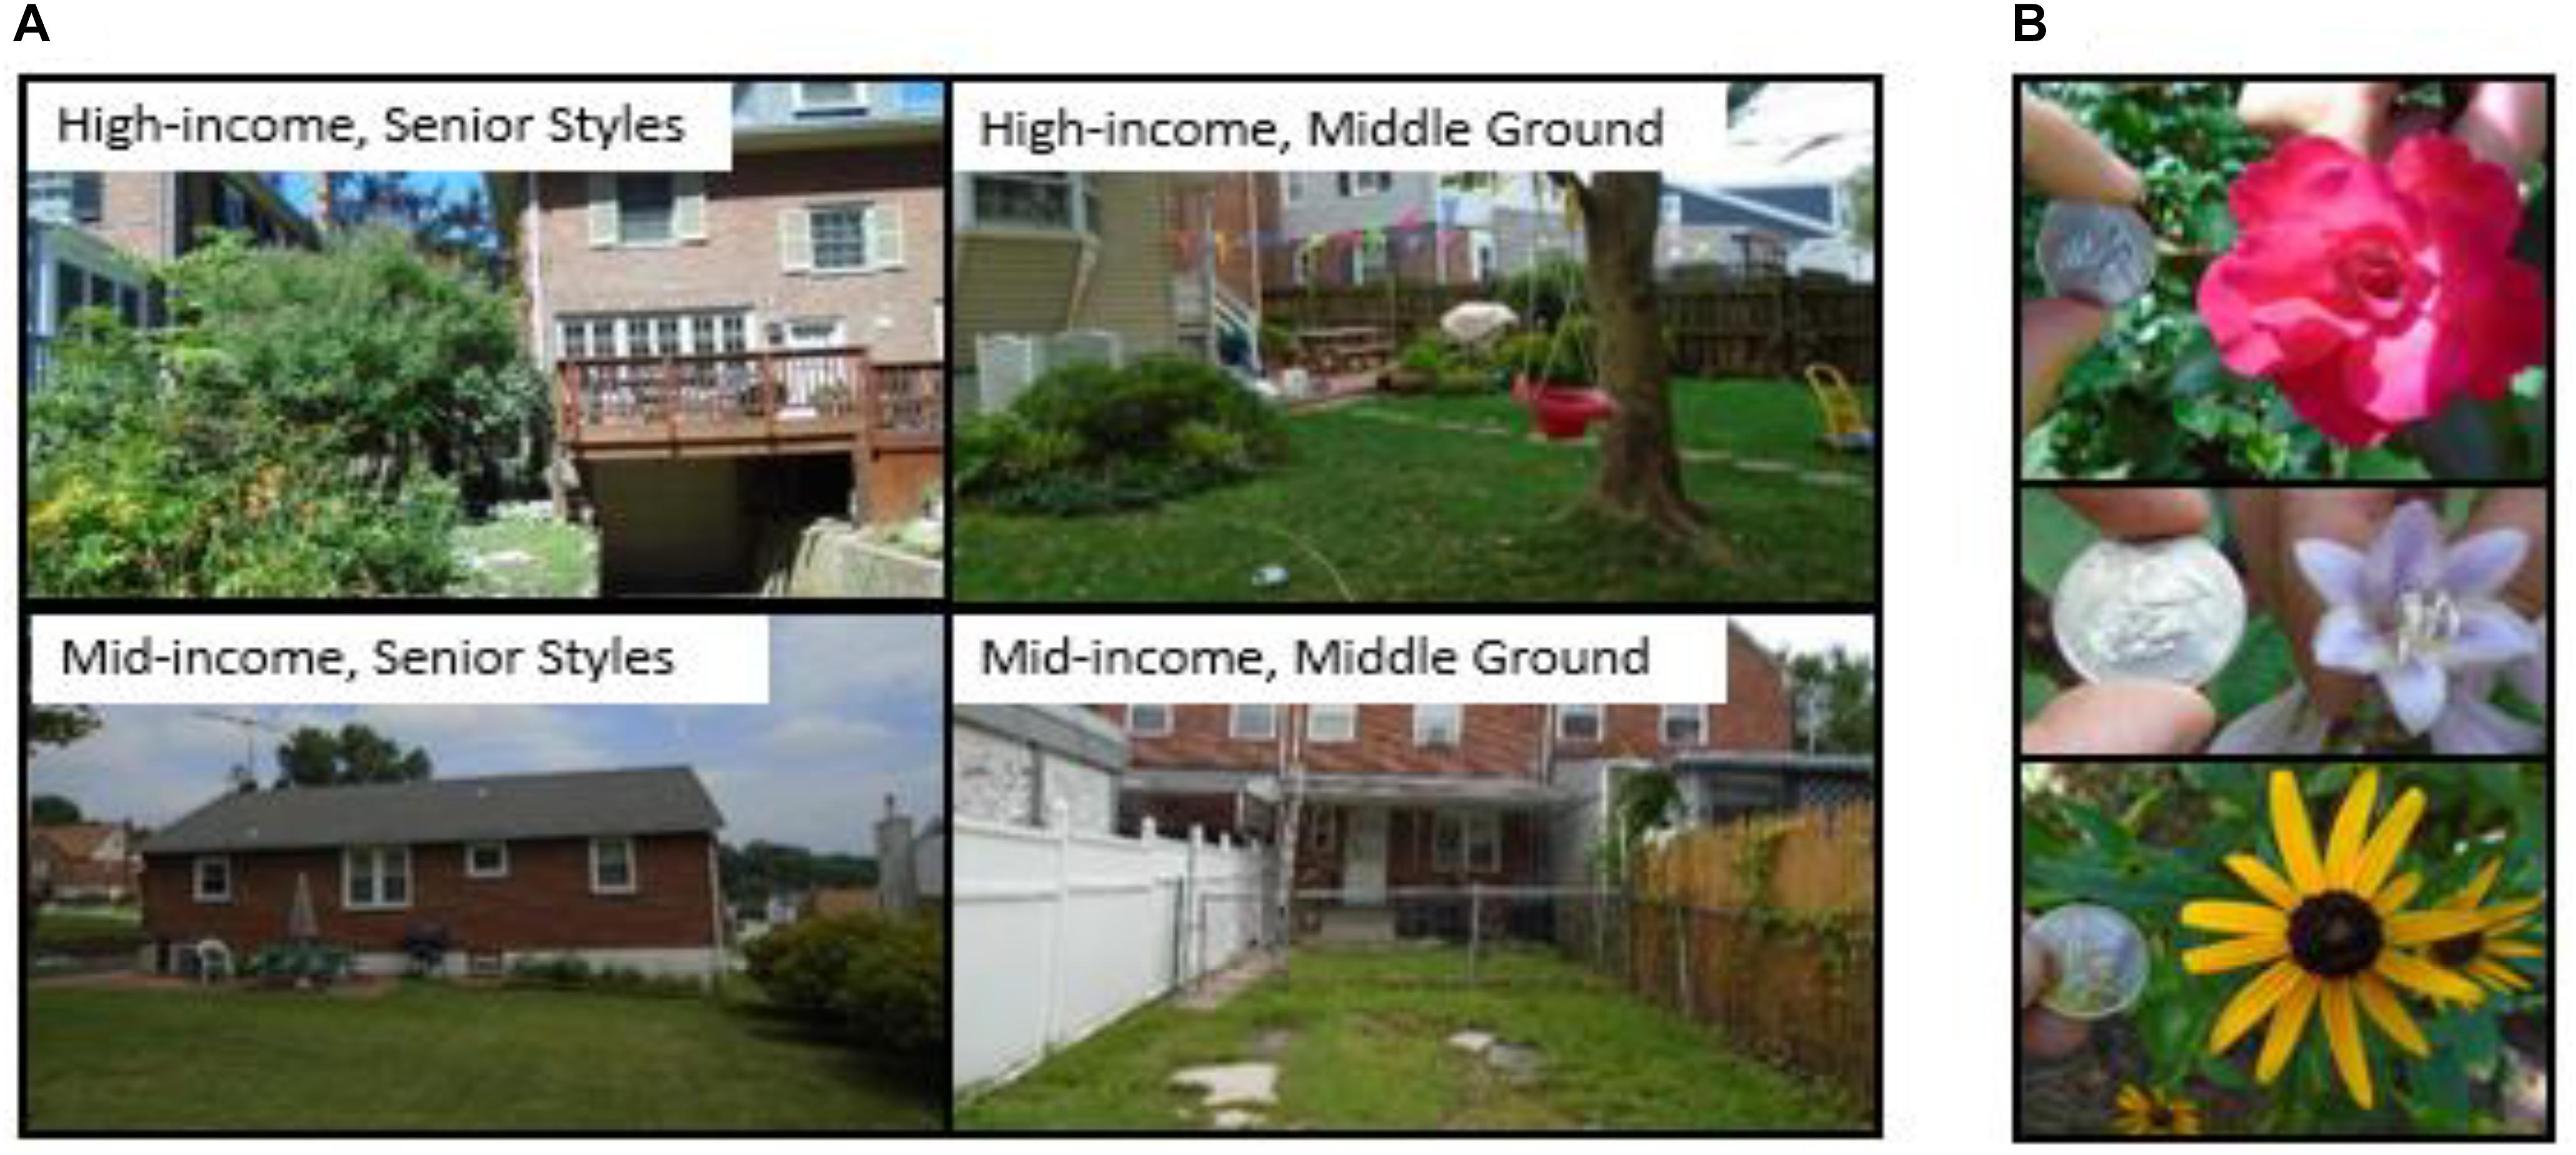
Figure 1. Examples of the each of the yard types we visited (A) and flower pictures (B). We used the flower pictures to calculate floral area and number of colors.
Because yard plant diversity has been shown to vary by residential yard size (Beninde et al., 2015), yard area was calculated for each property in the selected neighborhoods, and neighborhoods were further grouped into yard size categories (small, medium, large). Using a high-resolution (1 m2), high-accuracy land cover map (>90%) building footprints were extracted and vectorized from an existing map of the Chesapeake Bay area (Pallai and Wesson, 2017). These building footprint polygons were then erased from the parcels located within the previously selected parcels. The result is a GIS polygon layer of parcels with holes where buildings are located, the yard area is then taken as the area of this polygon. To disentangle the effect of income from yard size, we chose neighborhoods with small, medium, and large yards for both income groups (Table 1). We only selected homes that were built between 1910 and 1969, because newer yards tend to have lower biodiversity (Avolio et al., 2018). Lastly, we selected homes where the owner and parcel address were the same, to ensure resident home ownership.
Data Collection
In May of 2018, we sent surveys to 100 homes in each neighborhood. In each household survey, we asked residents “How much time do you estimate you do yard work each week?” with the possible responses being: 0 h, less than 1 h a week, 1–2 h, 2–3 h, 3–4 h, or 4+ h. If over 4 h, we asked them to provide the number of hours. We also asked residents whether they paid for yard work, including general yard work, weeding, and lawn care. At the end of the survey, we asked for permission to assess the vegetation on the property. When responses came back to us that marked the home as vacant, we sent more surveys to new homes until we were sure 100 residents received our letter. We received 191 completed responses out of 1,200 mailed (16% response rate; Table 1). In the neighborhoods where we did not receive enough responses, we went door to door, asking residents for permission to measure their yard plant community structure and diversity. We collected plant data at eight homes in each neighborhood, for a total of 96 homes. Out of the 96 homes, 58 responded to the survey, permitting us to assess their yards, and 38 were recruited by going door to door.
In July and August 2018, we collected plant data on front and back yards focusing on four major plant types: lawn species, flowering herbaceous plants, trees, and invasive species.
Lawns
We assessed species percent cover by using four 1 m2 quadrats per house, two in the front yard and two in the back. Lawn species were identified and categorized as intentional turf grass or weed. We define a weed species as one that is not intentionally planted. In the lawns, we found 77 weed species, five of which were also invasive (see below).
Flowering Herbaceous Plants
All herbaceous plants (excluding grasses) that were in flower at the time of data collection, hereafter referred to as flowering plants, were identified to genus. We did not identify to species because of the high prevalence of hybrids, intraspecific cultivars, and interspecific similarities in many genera. We grouped flowering plants by genus, color, and front/back yard location. For example, Hosta plants can have white, blue, or purple flowers. Blue and white Hosta plants were assessed separately in both front and back yards. Per flowering plant group, we counted the total number of individual plants (e.g., four white Hosta plants in the front yard), total number of flowering stems (e.g., 20 flowering white Hosta stems in the front yard), and average number of flowers per three stems (e.g., three assessed white Hosta stems had eight, three, and two flowers per stem, = 4.33). We refer to flower as the single reproductive unit, composed of the petals, stamen, and carpel. We also photographed a representative flower of each assessed plant next to a U.S. quarter coin for scale (Figure 1B), using Sony CyberShot DSC-W800 camera.
Trees
We identified each tree species in a yard (excluding street trees), recorded its front/back yard location, and measured its diameter at breast height (DBH).
Invasive Species
In each yard, we searched for 21 common invasive species in Maryland from the Department of Natural Resources (DNR) (Werner and Wixted, 2019). The list contained: Acer platanoides, Ailanthus altissima, Alliaria petiolata, Ampelopsis brevipedunculata, Bambusa vulgaris, Berberis thunbergii, Celastrus orbiculatus, Clematis terniflora, Elaeagnus umbellata, Ficaria verna, Hedera helix, Iris pseudacorus, Ligustrum obtusifolium, Lonicera japonica, Miscanthus sinensis, Paulownia tomentosa, Persicaria perfoliata, Pueraria montana, Pyrus calleryana, Rosa multiflora, and Rubus phoenicolasius. Finally, we assessed whether each of these species was growing spontaneously or was intentionally cultivated.
Data Analyses
All statistical analyses were conducted in R (R Core Team, 2019) using an alpha of 0.05 and code can be found on github at mavolio/BESTimeVMoney. We ran two-way ANOVAs to test for the effect of lifestage and income on time spent doing yard work and whether a resident paid for yard work.
Within ArcGIS, the sampled parcels were manually cut into front and back yards via manual digitizing to accurately calculate front and back yard area. Front yards were, on average, 108 m2 smaller than back yards. We used the community_strucure() function in the codyn package (Hallett et al., 2019) to calculate species richness and evenness using Evar, a measure of evenness (Smith and Wilson, 1996; Avolio et al., 2019a).
Because we think residents choose plants based on flowering traits, we created several new measures of floral diversity. We calculated the number of flowers, number of flower colors, and floral area for each flowering plant group (grouped by genus, color, and yard location) based on field photos and collected data. The number of flowers was determined by multiplying the total number of flowering stems by average number of flowers per stem. In the case of plants that have a large inflorescence with many florets (e.g., hydrangeas), we counted each floret. To calculate colors, we developed a new method of measuring floral color diversity by assigning each photographed flower one or two colors, using a standard 12-color wheel. Color choices were limited to: red, red-purple, purple, purple-blue, blue, blue-green, green, green-yellow, yellow, yellow-orange, orange, red-orange, and white. We then calculated floral area of each color in a yard. If a flower only had one assigned color, then 100% of its floral area was used in the summation. If a flower had two assigned colors, then 50% of the total floral area was applied to each color for the summation. For floral area, the program Image J was used to calculate the area of a single flower of each plant based on the field photos, using a U.S. quarter for scale (Figure 1B). Floral area for each plant group was then calculated by multiplying the number of flowers by this area. To calculate both the number of flowering plant genera found in a yard and the number of unique colors, we used commuity_structure().
To assess whether the community composition of lawns, trees, and flowering plants differed by neighborhood-level lifestage and income, we ran permutational analysis of variance (PERMANOVA) based on a Bray–Curtis dissimilarity matrix and using the adonis() function in the vegan package (Oksanen et al., 2019). Next, we tested whether there were greater differences in plant community composition by performing a test of multivariate homogeneity of group dispersions using the betadisper() function in the vegan package based on a Bray–Curtis dissimilarity matrix. For both of these analyses, each yard was considered a replicate because front and back yard data were combined, n = 96. Because not all yards have a lawn, flowering plants, or trees, sample size was different for different plant types: n = 84 for lawns, n = 82 for flowering plants, and n = 77 for trees. Next, to visualize these patterns, we performed a non-metric multidimensional scaling (NMDS) analysis on the average abundance (cover or number) of each species or genera averaged by neighborhood (n = 12).
Second, we ran separate analysis of covariance (ANCOVA) tests to assess the associations between neighborhood-level lifestage (a proxy for time to spend on yard care), neighborhood-level income (a proxy for money to spend on the yard), yard location (front or back yard), and yard size on each plant response variable. In these models, lifestage, income, and yard location were fixed effects with yard size as the continuous covariate. Each visited front or back yard was considered a replicate (n = 192). The model allowed for interactions among lifestage, income, and yard location. All plant response variables were log transformed for normality except lawn richness and number of invasive species, which included: lawn species evenness, number of trees, tree species richness, average tree DBH, number of flowering plants, number of flowers, number of flower colors, floral area, and genus richness of flowering plants. Third, to study the effect of time spent gardening on patterns of biodiversity, we correlated the time the resident spent gardening with each plant response variable. Fourth, to assess how similar various measures of flowering plant diversity were, we ran correlations among each diversity measure using Pearson’s correlations.
Results
Resident Yard Practices
Surveyed Baltimore residents spend an average of 2.6 h a week doing some form of yard work, and this varied across neighborhoods (min = 1.5, max = 4.4; Table 1). There was no association between lifestage (F = 0.14; p = 0.710) or income (F = 0.29; p = 0.592) and time spent gardening, but there was a significant interaction (F = 4.03; p = 0.046). In the Middle Ground lifestage, higher income residents spent more time doing yard work compared with Senior Styles lifestage, where higher income residents spent less time doing yard work; 34% of residents paid for some form of yard work (weeding, lawn care or general yard work), and this also varied across neighborhoods (Table 1). There was an effect of lifestage on whether a resident paid for yard work (F = 6.46; p = 0.012), where Senior Styles residents were more likely to pay for yard work than residents in the Middle Ground lifestage. There was no effect of income (F = 0.01; p = 0.907) and there was no interaction between lifestage and income (F = 1.99; p = 0.160).
Species Composition of Yards
Residential yards in Baltimore harbor many plant species. We found 82 plant species growing in lawns, of which only five were planted turf grass species (Festuca arundinacea, Festuca rubra, Lolium perenne, Poa pratensis, and Zoysiagrass), and the rest of the species found were weeds. The most common weeds, in terms of both number of houses they were found at (frequency), and their total abundance across all yards were Trifolium repens, Cynodon dactylon, and Digitaria sanguinalis (Figures 2A,B). We found 80 genera of flowering plants; Hydrangea and Rosa were found in the most yards (Figure 2C), while Catharanthus and Hemerocallis were most abundant (Figure 2D). We also found 89 tree species; Cornus florida and Lagerstroemia indica were found in the most yards (Figure 2E), while Ilex opaca was the most abundant species (Figure 2F). From our target list of invasive species, we found at least one invasive species at 88% of homes visited. Based on our assessment of where the plant was found and how it was being managed, the majority of invasive plants we found (75%) were growing spontaneously rather than being intentionally cultivated. The most commonly encountered invasive species were H. helix, A. brevipedunculata, A. altissima, and R. phoenicolasius.
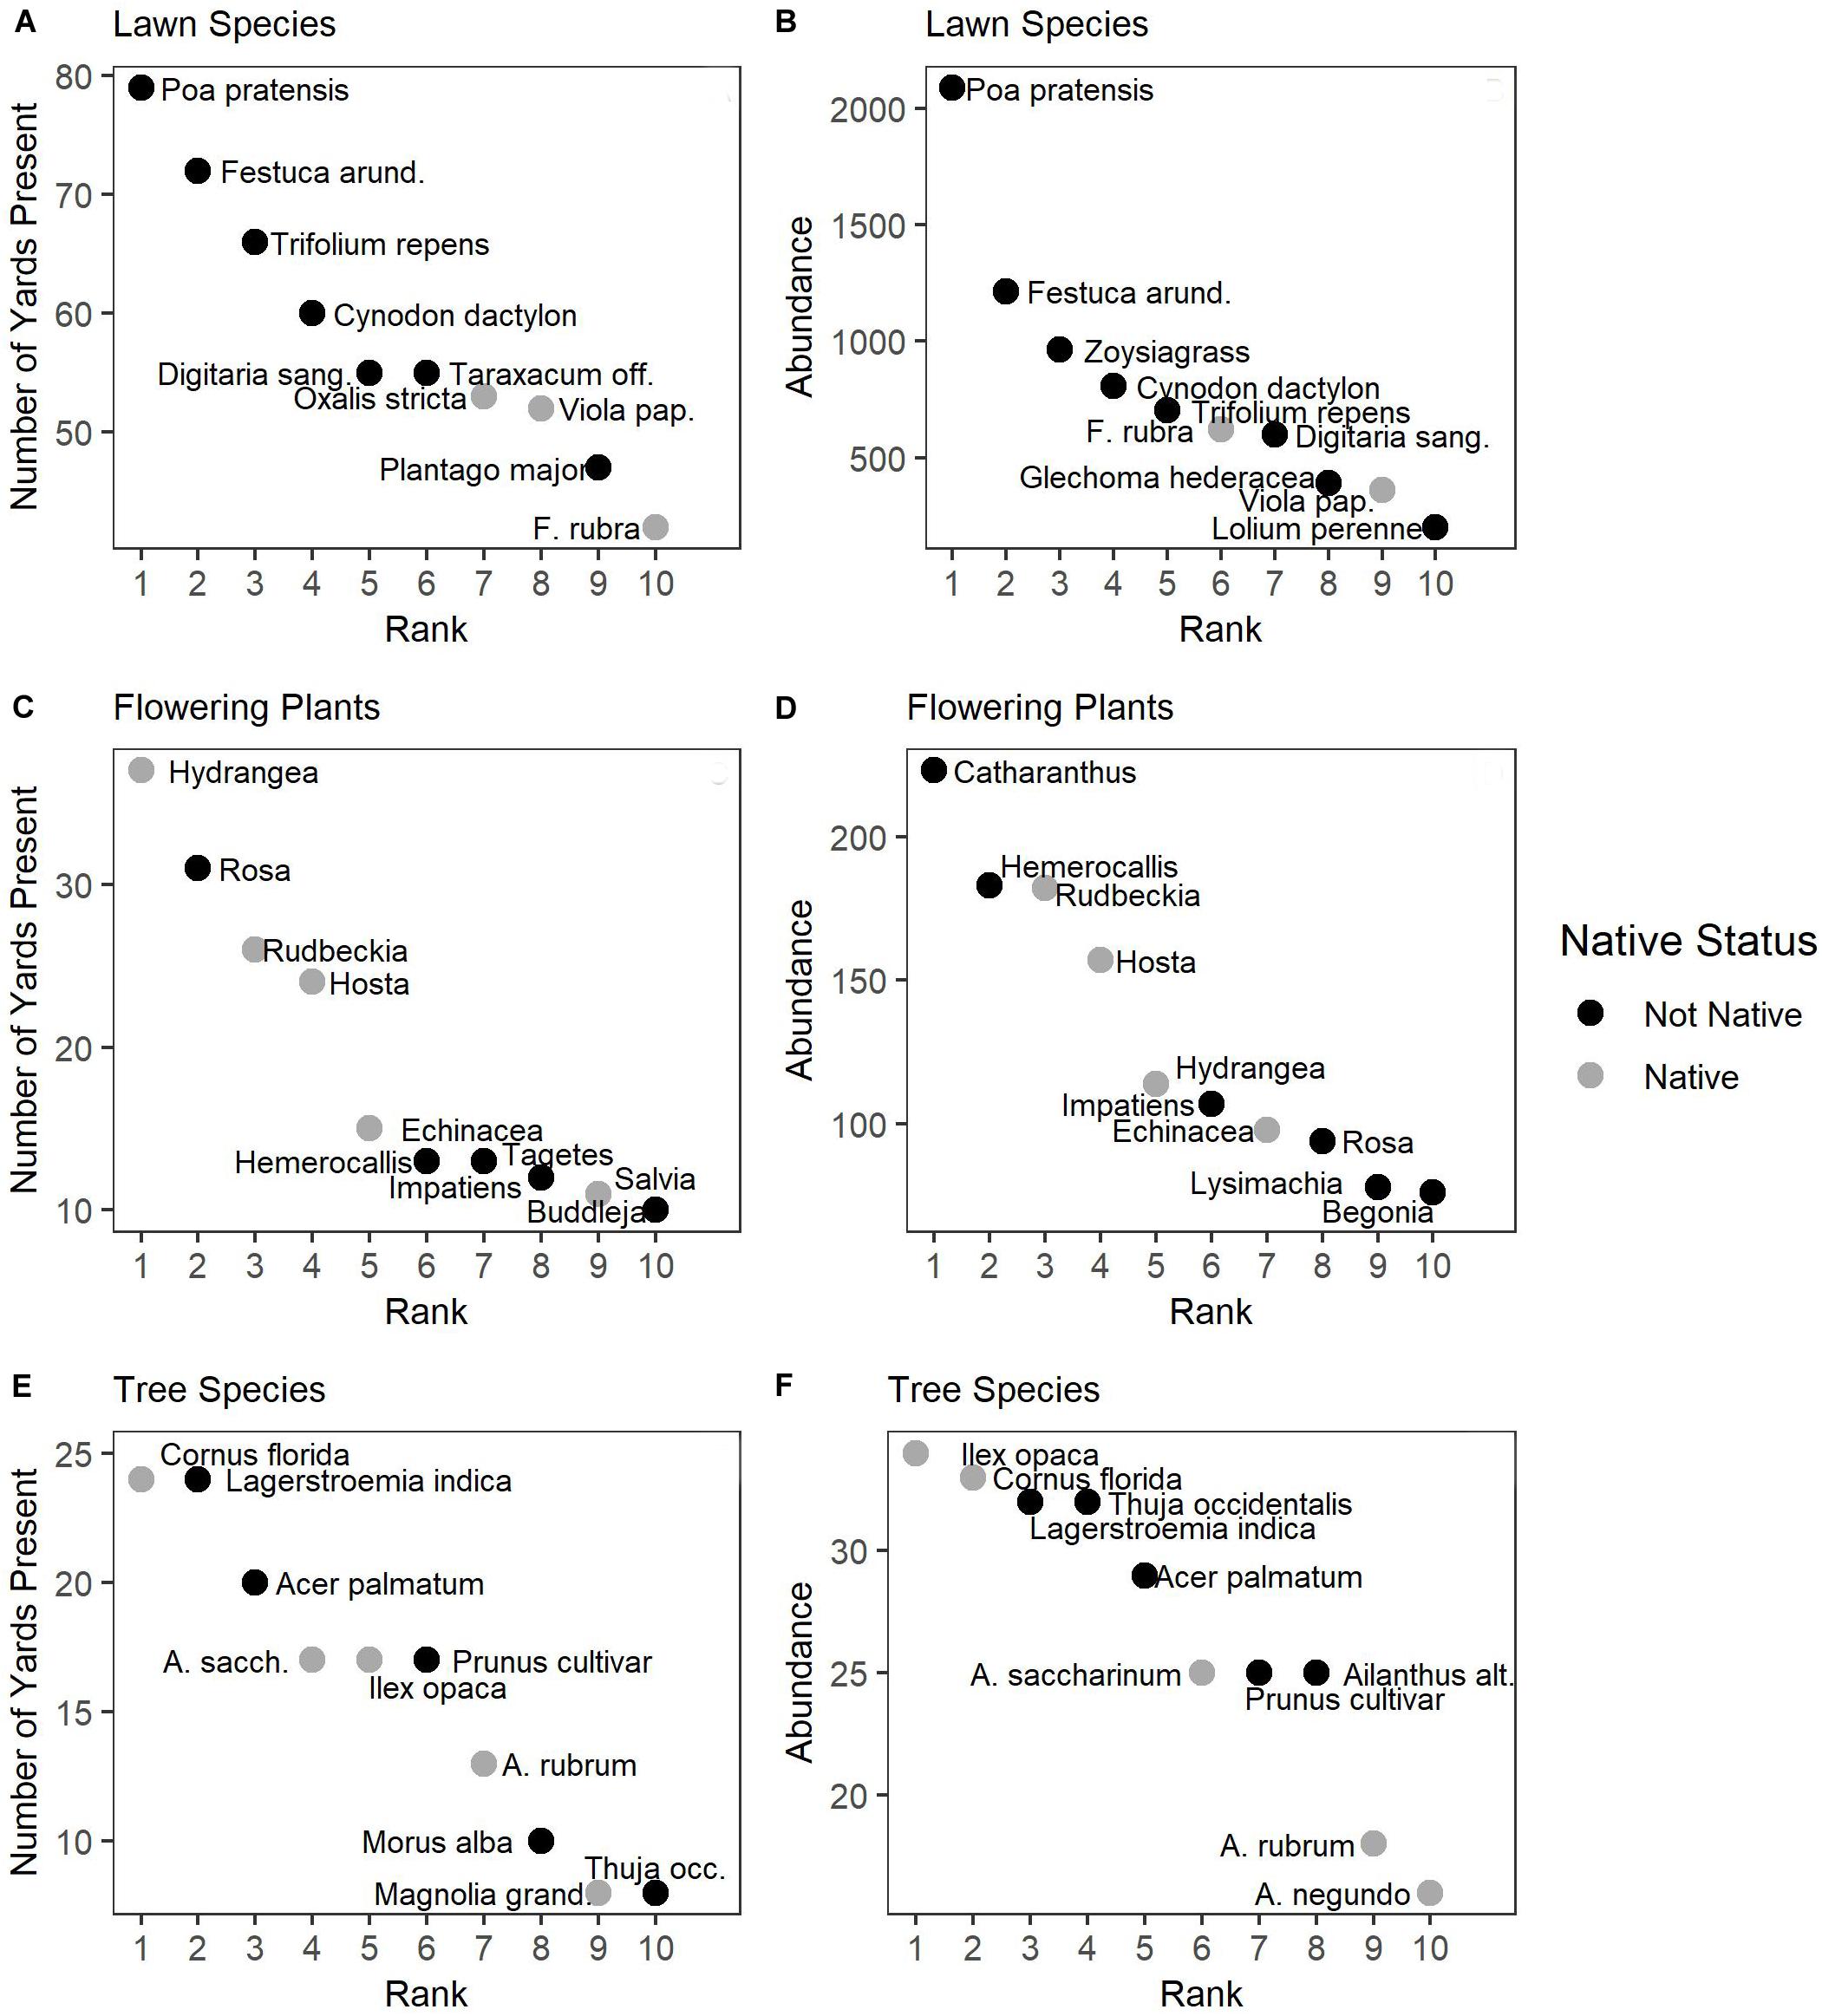
Figure 2. Rank abundance curves of the top 10 species in terms of frequency [(A,C,E); the number of yards where the species was found] and abundance [(B,D,F); the total cover for lawn species or the total number of individuals for flowering plants and trees]. Species abbreviations are as follows: Festuca arund. = F. arundinacea; Digitaria sang. = D. sanguinalis; Viola pap. = V. papilionaceae; Magnolia grand. = M. grandiflora; Ailanthus alt. = A. altissima.
The community composition of plants was associated with income (Table 2). Lawns (Figure 3A) and flowering plants (Figure 3B) were comprised of different species (lawns) and genera (flowering plants) depending on income, but not lifestage. The community composition of trees (Figure 3C) was not associated with income or lifestage (Table 2). In lawns, communities were less similar to one another (greater dispersion) in high versus mid-income yards (Table 2 and Figure 3A), demonstrating that lawn communities in mid-income yards were more similar to one another than in high-income yards. There was no difference in dispersion for flowering plant or tree communities (Table 2).
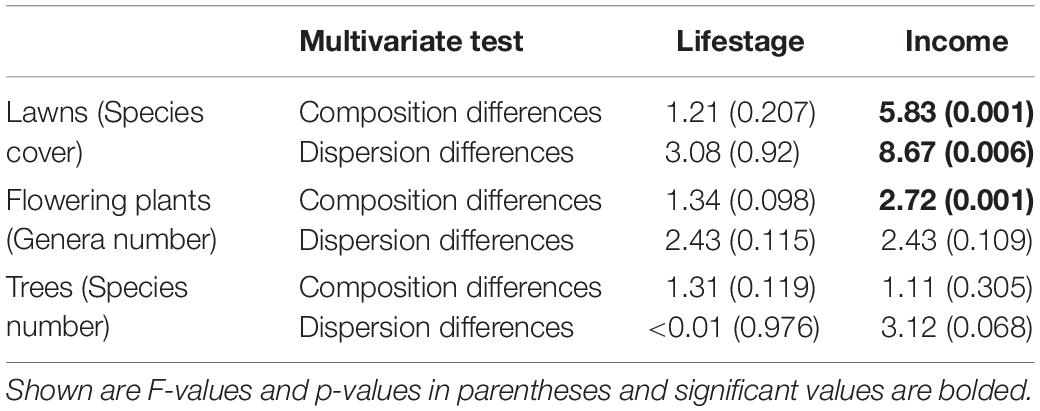
Table 2. Effect of income and lifestage on community composition (permanova) and variability of communities (tests of homogeneity of dispersions).
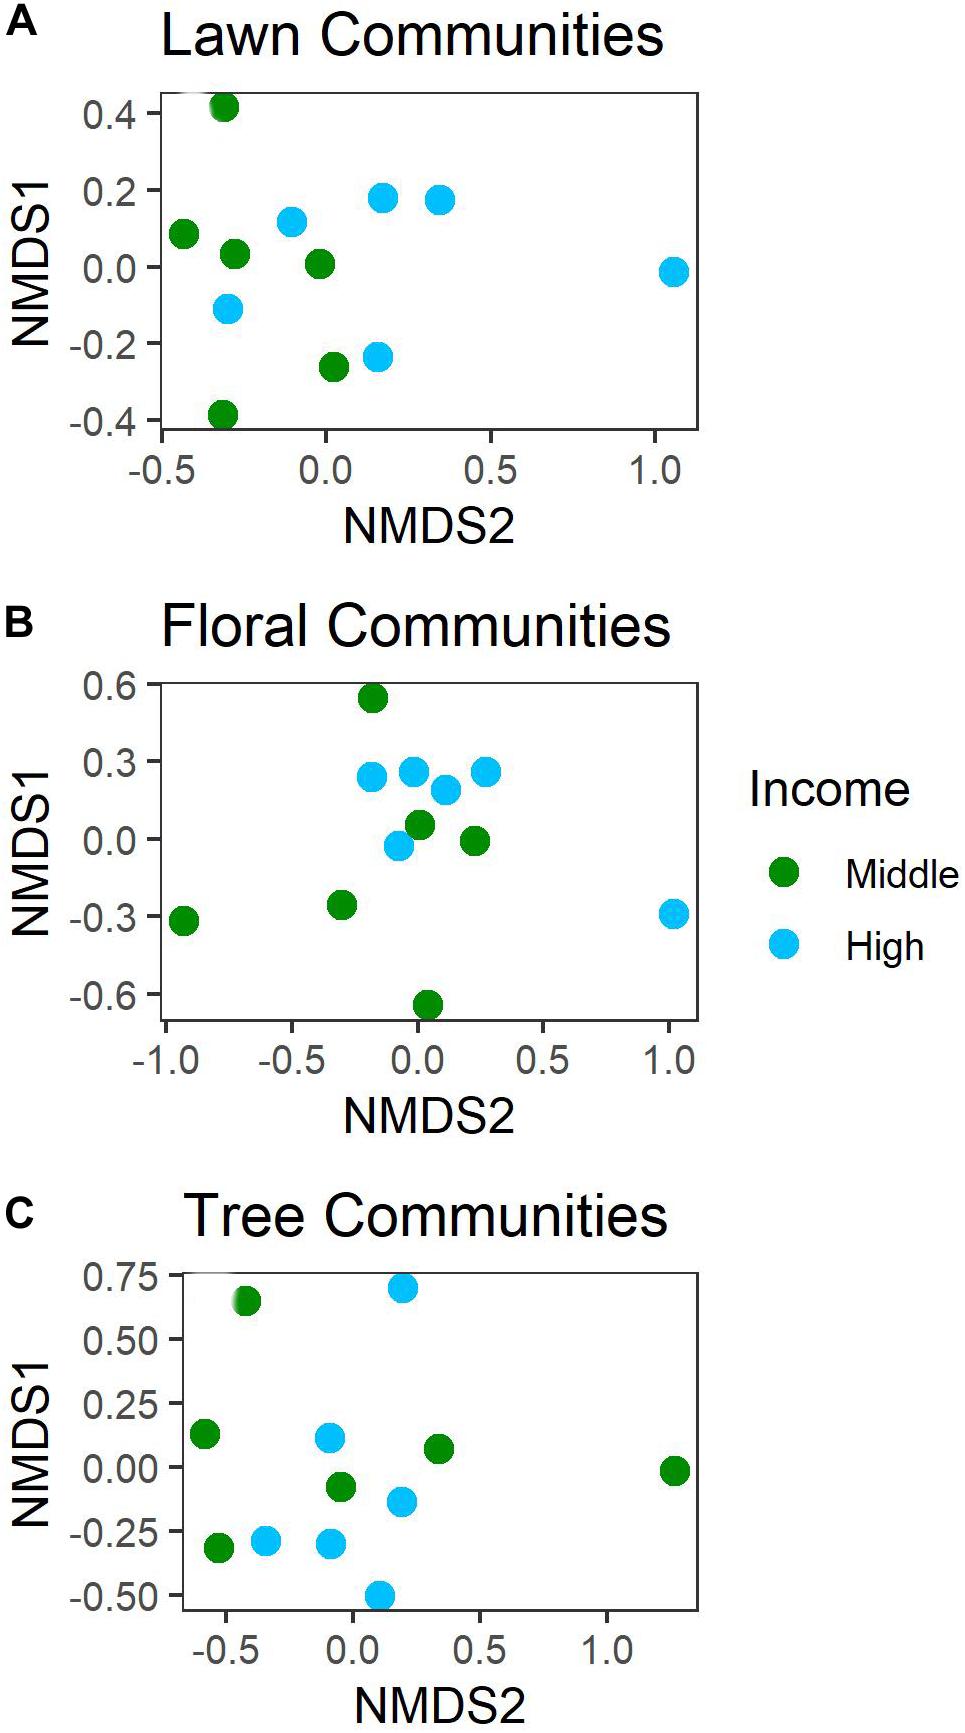
Figure 3. NMDS of (A) lawn, (B) floral, and (C) tree communities in mid- and high-income yards.
Plant Community Structure and Diversity in Residential Yards
We found no differences in lawn species richness or evenness across yards (Table 3); every lawn was equally weedy with an average of 8.5 species ± 0.34 (SE) found in a 1 m2 plot. For all other plant types (flowering plants, trees, and invasive species), we found that larger yards had more plants and higher diversity (Table 3 and Figure 4). We also found consistent effects of income on plant biodiversity. Higher income yards had more flowering plants, flowers, colors of flowers, floral area, and flowering plant genera (Table 3 and Figure 4A). Floral area was over three times higher in high- versus mid-income yards (Figure 5), with the most common colors being blues and purples. Trees were also more abundant, diverse, and larger in higher income yards (Table 3 and Figure 4B) and there were more invasive species in higher income yards (Table 3). We found few effects of lifestage. We only found greater floral area in the Senior Styles lifestage category compared with Middle Ground (Table 3 and Figure 4C). For invasive species, we found an interaction between lifestage and yard size. There was a much stronger association between yard size and invasive species richness among yards of residents in the Middle Ground lifestage compared with yards of residents in the Senior Styles lifestage (Figure 4D). We found greater floral area in front versus back yards (Table 3 and Figure 4E), but more trees, more tree species, and larger trees in the back versus front yards (Table 3 and Figure 4F).
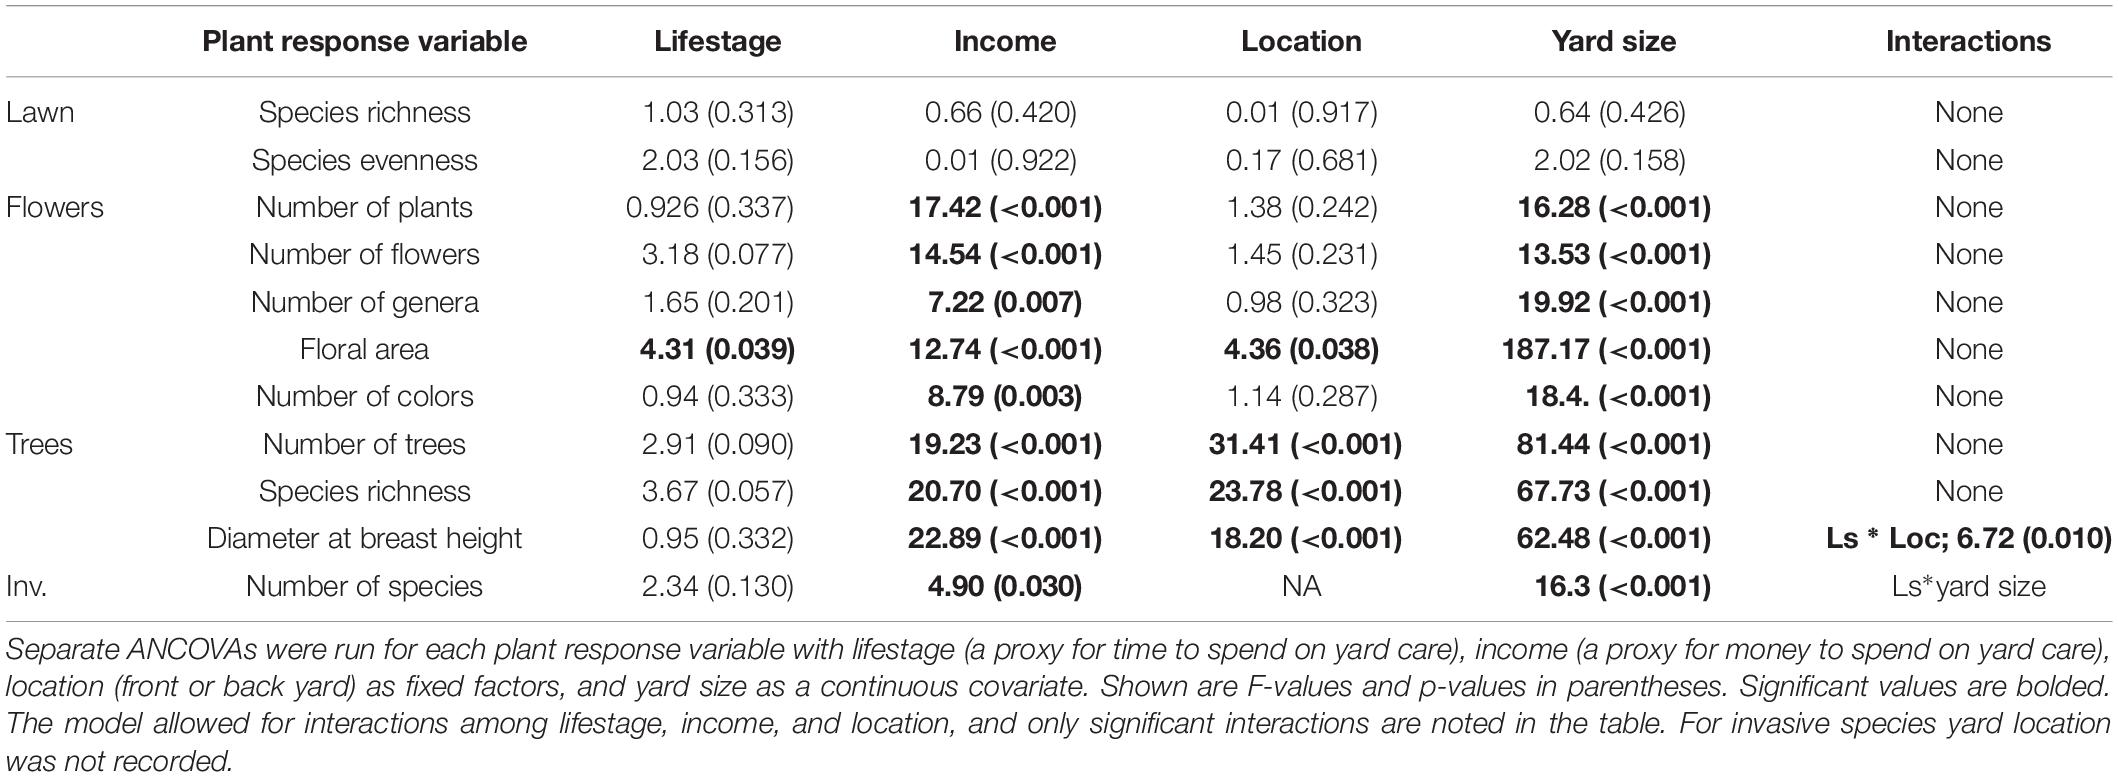
Table 3. Summary of ANCOVAs.
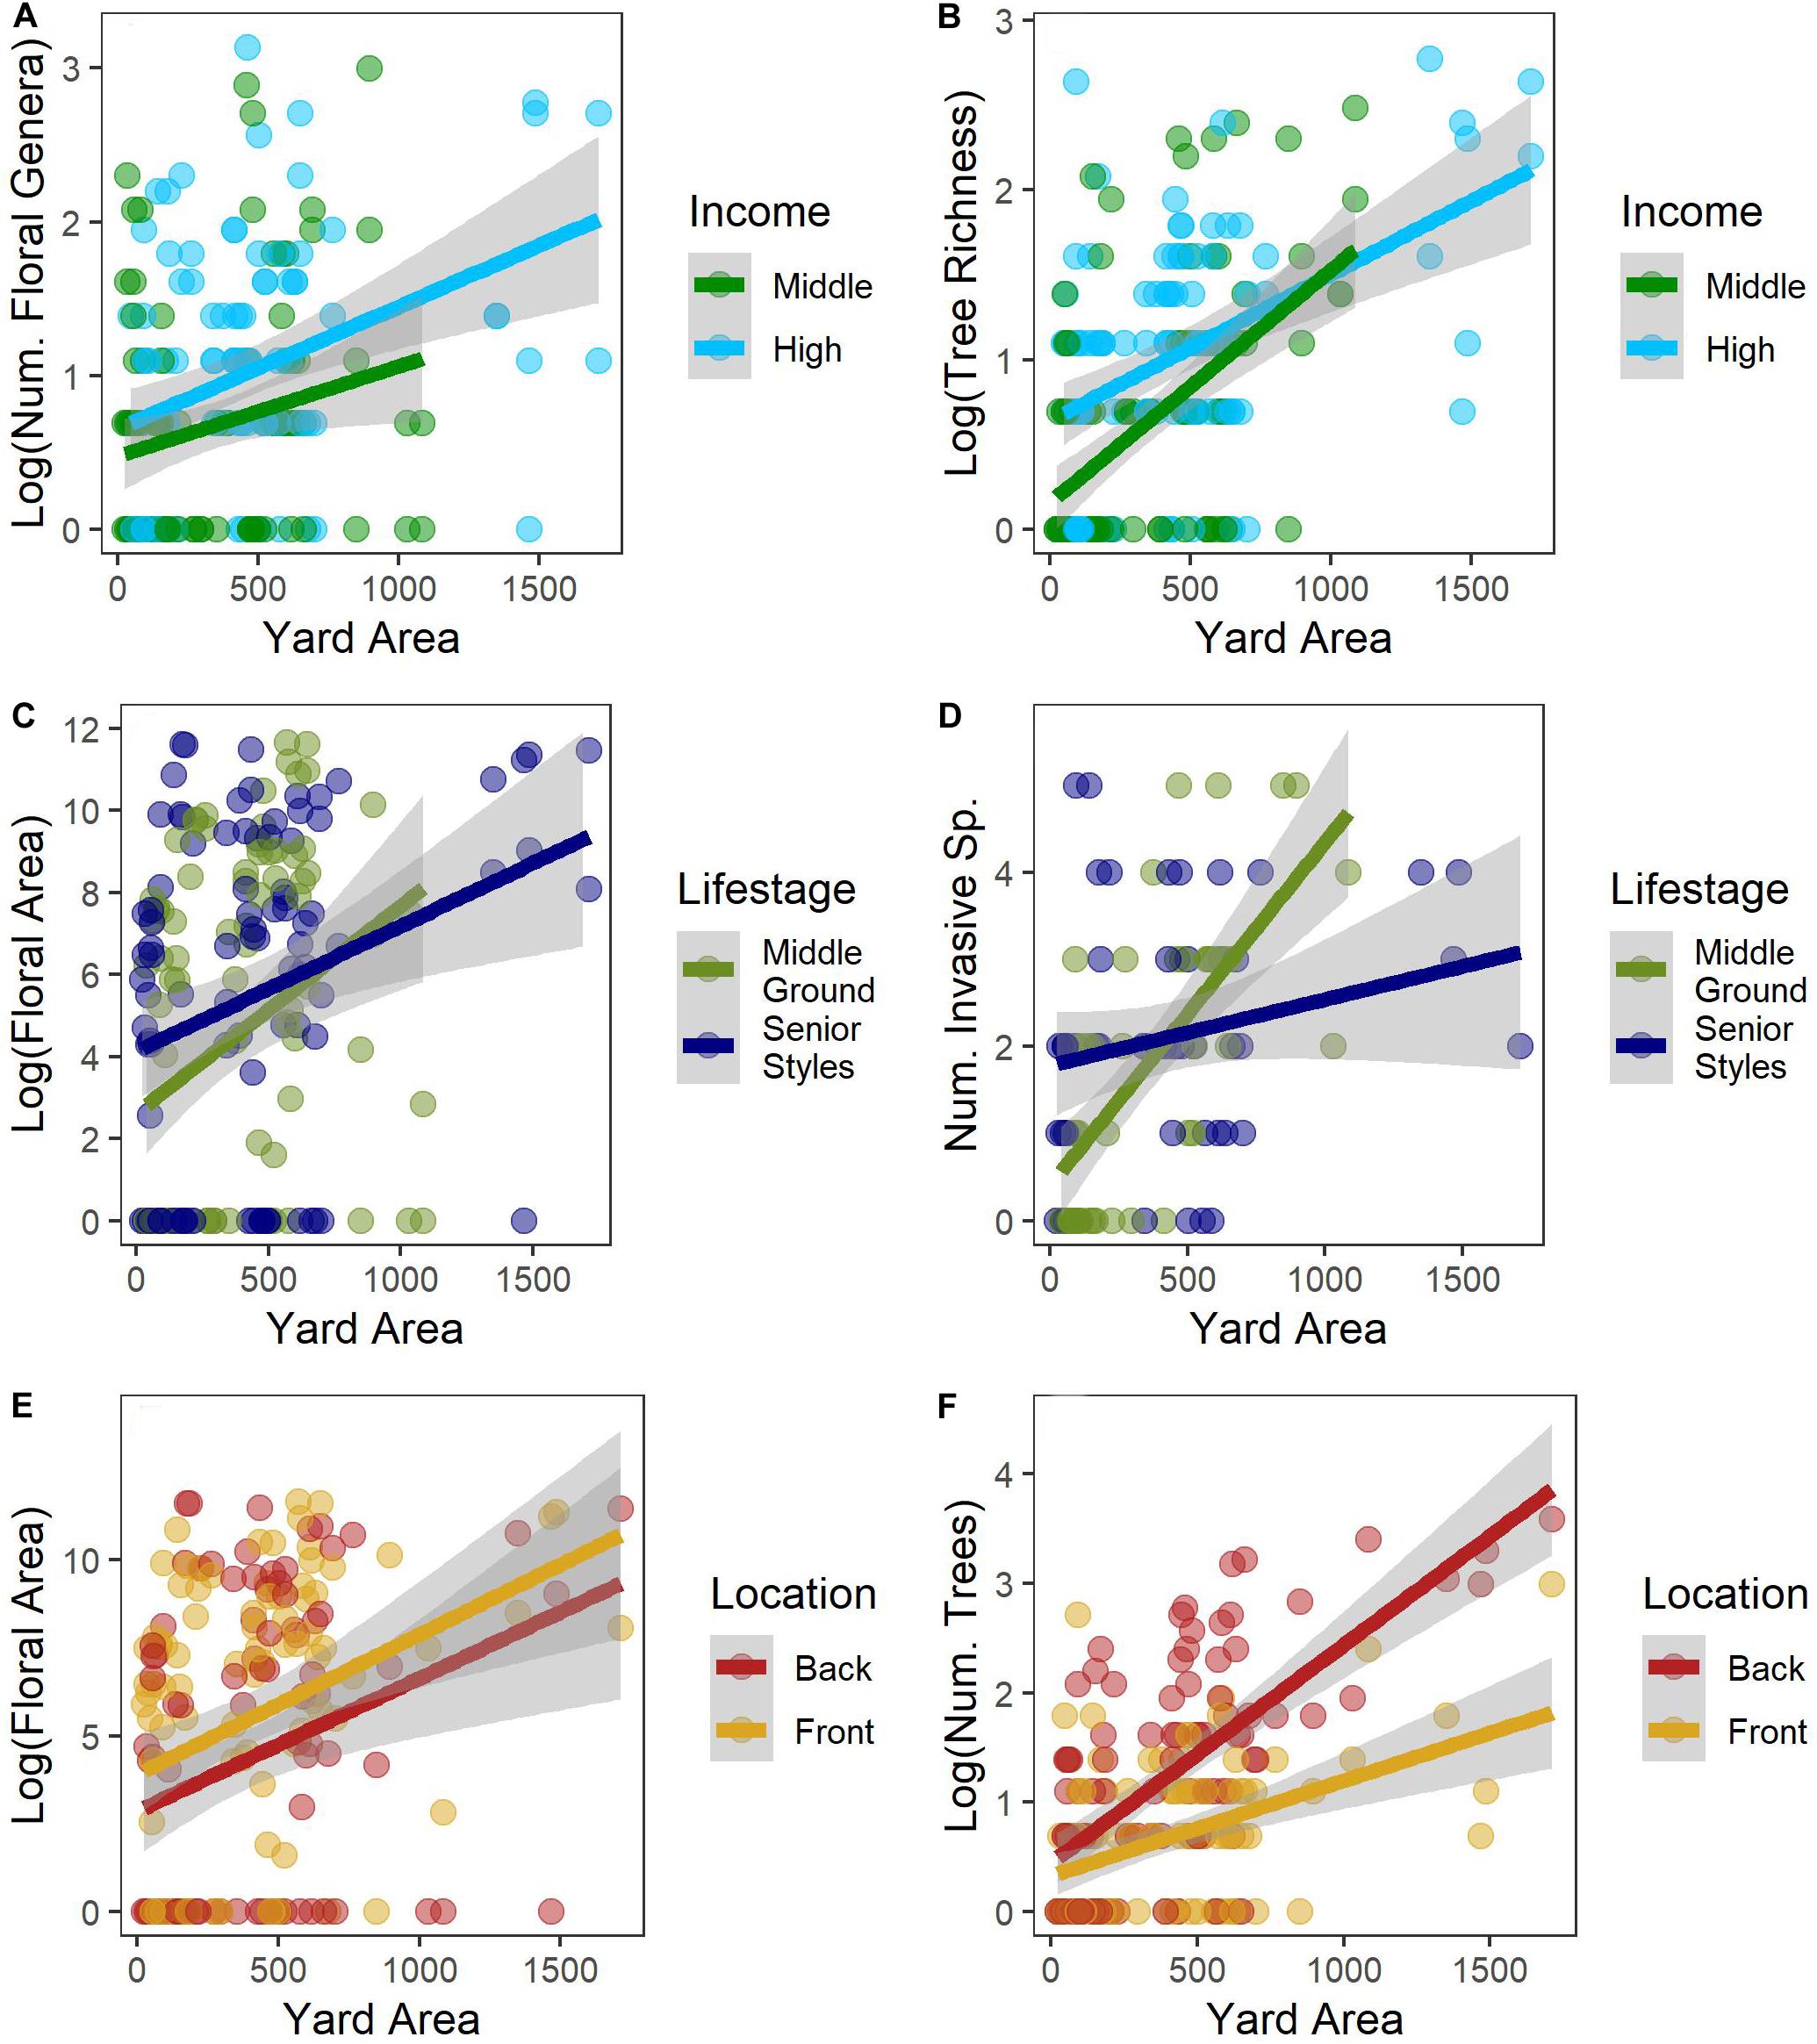
Figure 4. Relationship between yard size and income (A,B), lifestage (C,D), and yard location (E,F) on several measures of community structure and diversity.
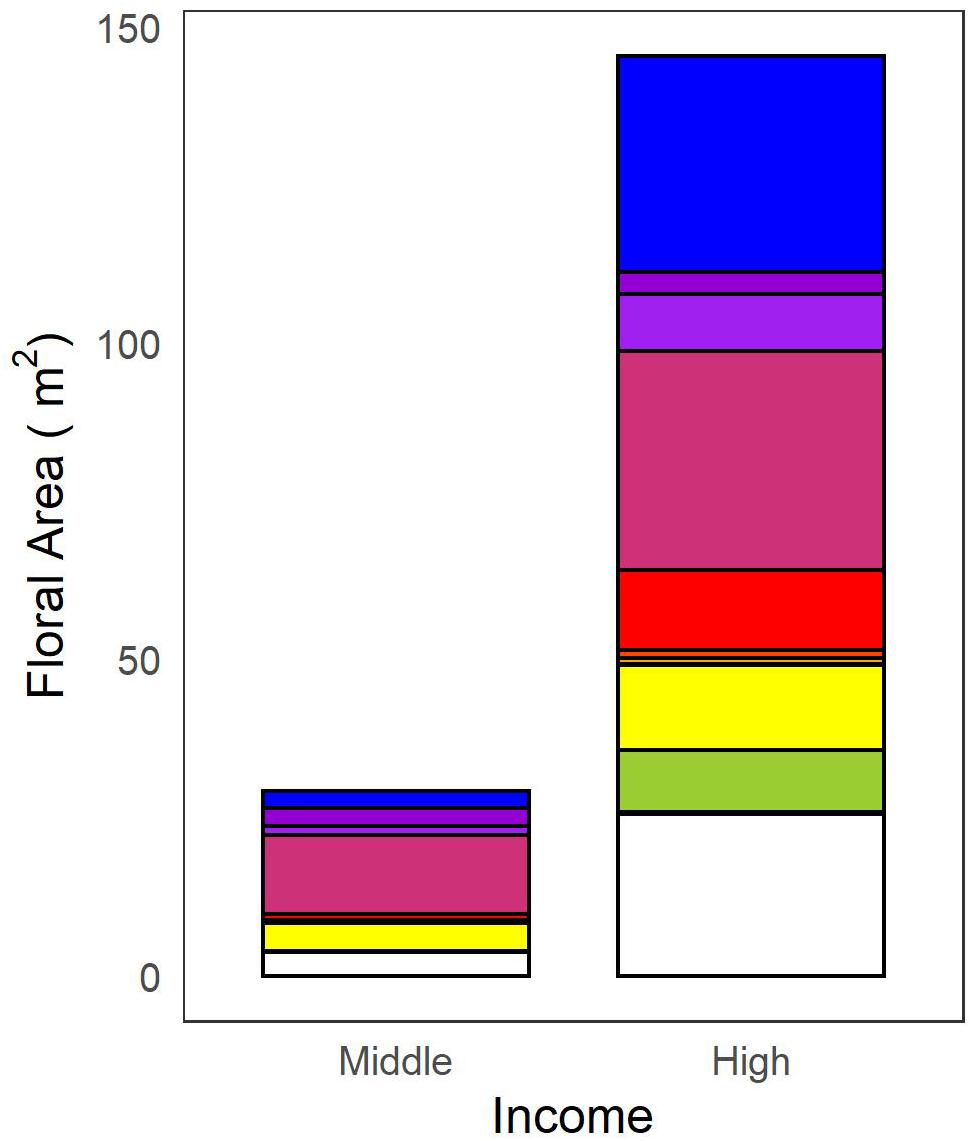
Figure 5. Total floral area of mid- and high-income yards. Total area is subdivided into the observed colors.
Lastly, regardless of lifestage or income, we investigated whether self-reported time spent gardening affected plant diversity (Table 4). We found that more time spent gardening was correlated with having more flowering plants, flower colors, and floral general. However, there was no correlation between time spent gardening and aspects of lawn, tree, or invasive species community structure or diversity.
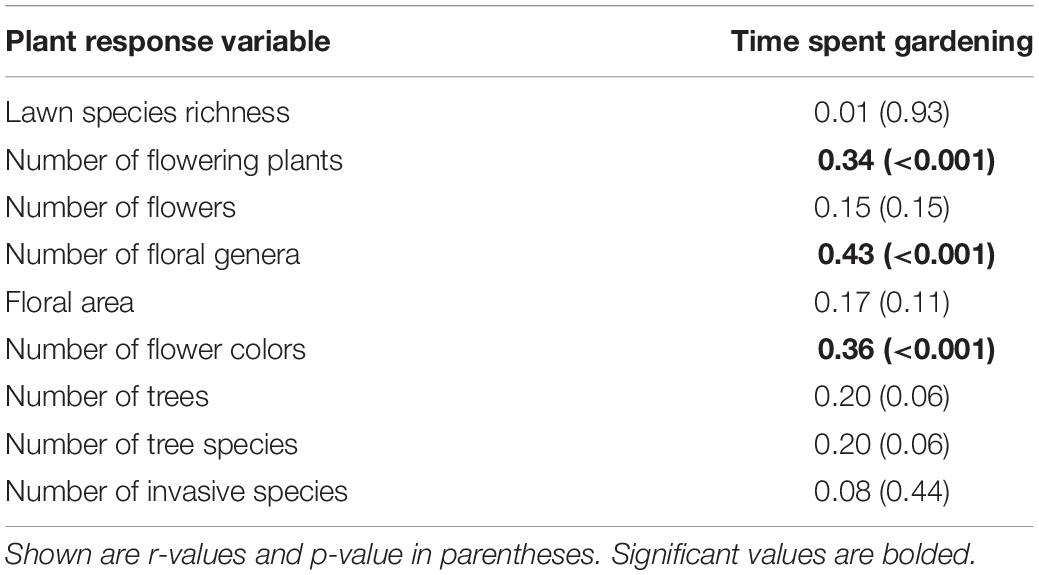
Table 4. Correlations between yard biodiversity and time spent gardening each week.
Measures of Floral Diversity
In this paper, we also present new diversity measures for flowering plants, focusing on floral characteristics. We found that these measures, while correlated, are not redundant (r < 0.90), and each detects a unique aspect of flowering plant diversity (Figure 6). Number of flowering plant genera was strongly correlated with the number of colors found in a yard, and the number of flowering plants and floral area were strongly correlated with the number of flowers.
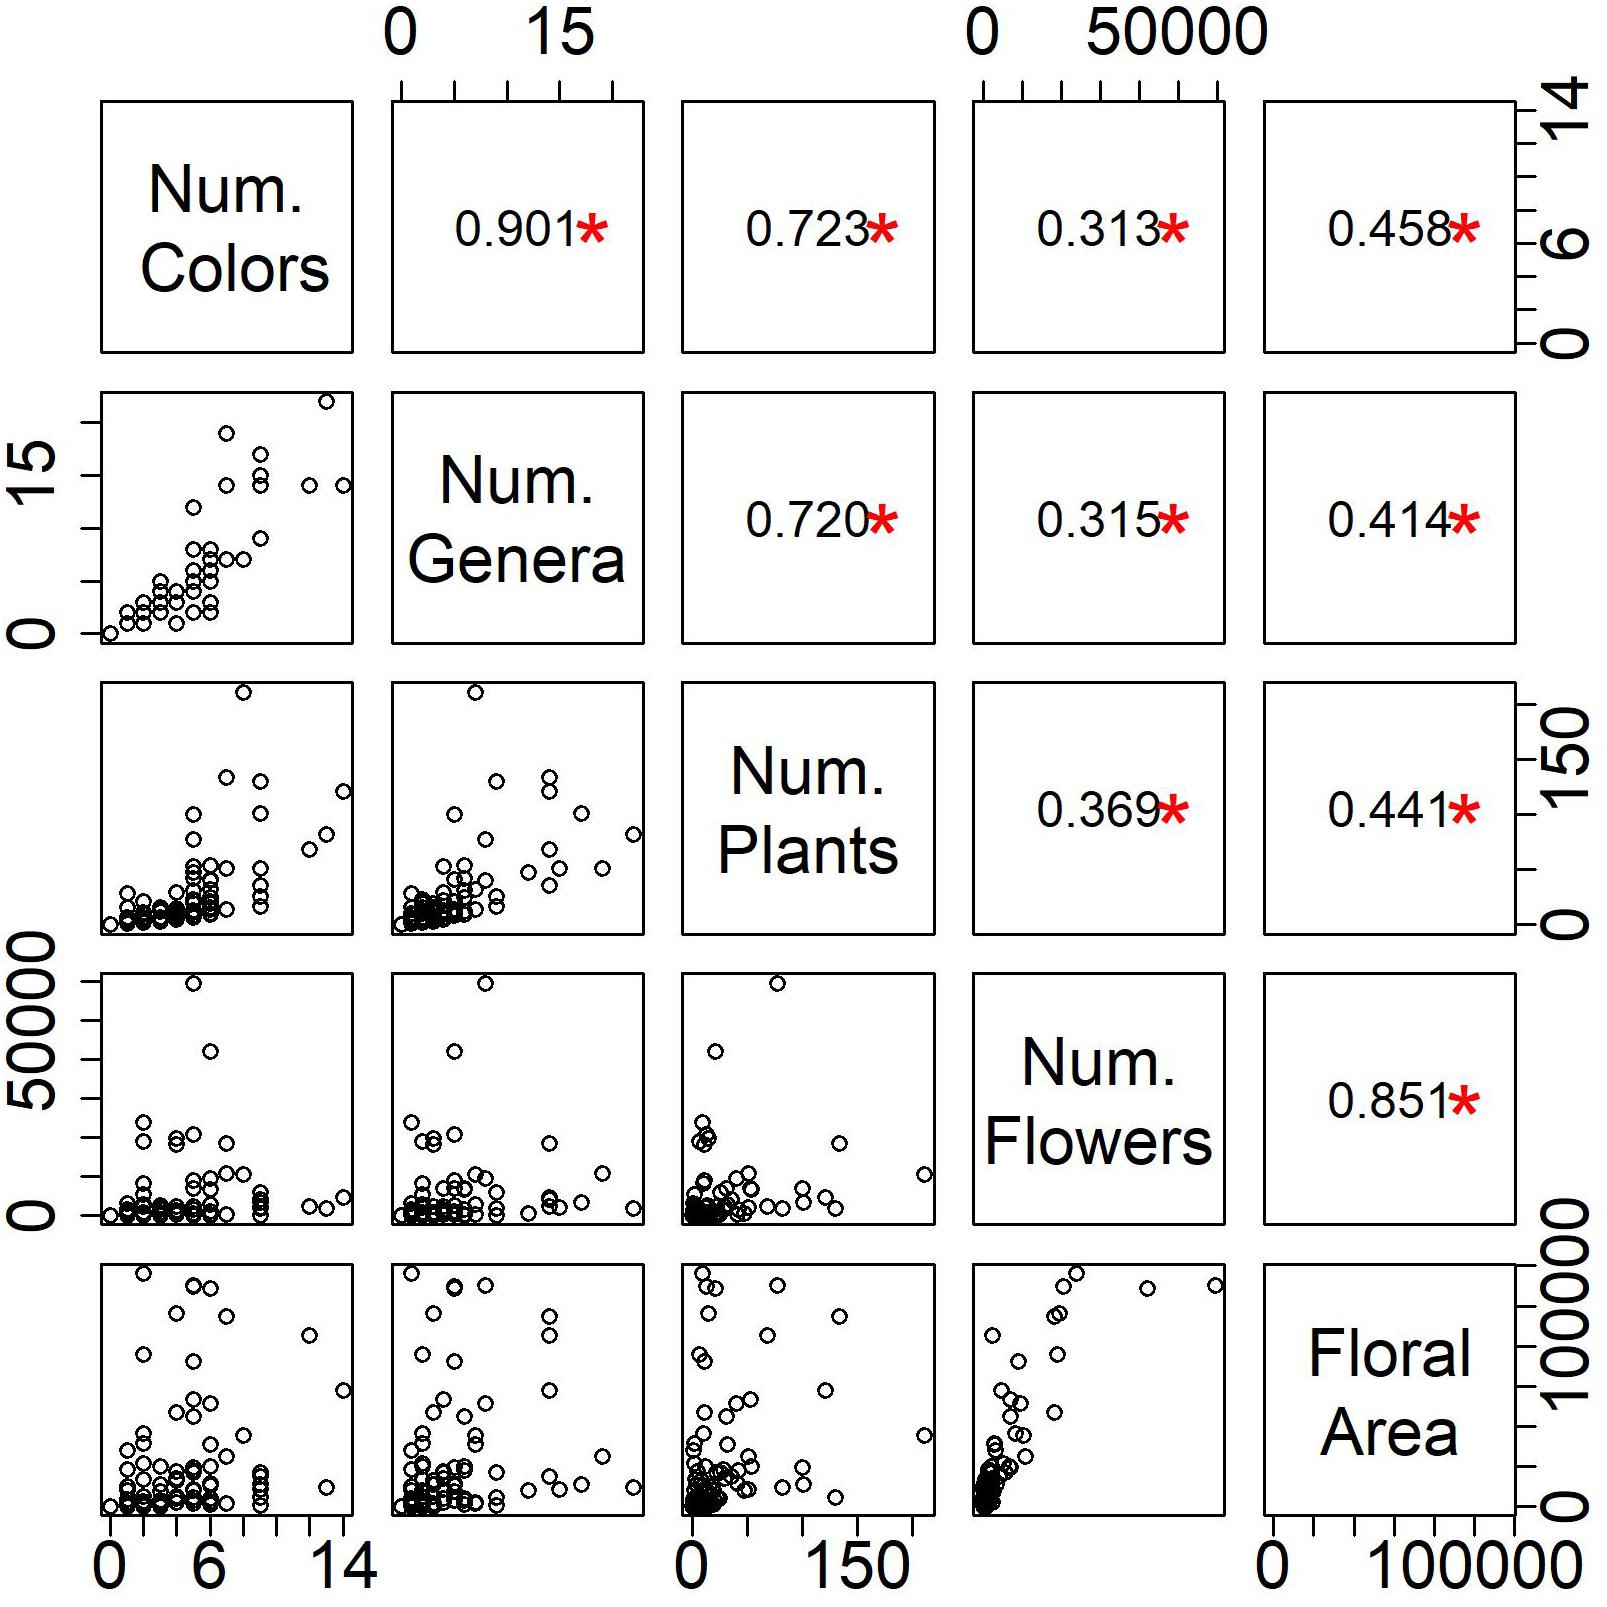
Figure 6. Relationship among measures of floral biodiversity. In the upper panel, the r-value from a Pearson’s correlation is displayed and a red asterisk denotes a significant correlation at p < 0.05.
Discussion
Patterns of Plant Community Structure and Biodiversity in Baltimore Residential Yards
Residential yards are an ecosystem type that collectively makes up a macrosystem across the United States (Groffman et al., 2017). For example, in Baltimore, like many cities, residential yards account for 39% of land area. Patterns of urban biodiversity can be affected by both environmental and socio-economic drivers (Cook et al., 2012; Avolio et al., 2015). Studying four different aspects of urban plant biodiversity (trees, lawns, flowering plants, and invasive species), we found that yard area (environmental driver) and income (socio-economic driver) were consistently associated with greater plant biodiversity. That larger yards had a higher diversity of plants supports several other studies that have shown that area is important for biodiversity in urban spaces (Thompson et al., 2004; Meléndez-Ackerman et al., 2014; van Heezik et al., 2014; Beninde et al., 2015; Padullés Cubino et al., 2019b). However, another socio-economic factor, lifestage, which we considered to be a proxy for time, had a weaker association with yard biodiversity. When studying self-reported gardening practices, we found that time spent gardening was correlated with more floral diversity but not with fewer invasive species. Our findings highlight the importance of residential yards in urban ecosystems and the role of human resources, such as money, in managing these areas.
Species Composition of Yards
We found 251 species in 96 yards totaling 3.8 hectares across Baltimore City and County. This is a conservative estimate of the number of plant species because we did not sample all plant types in the yard, such as shrubs and food plants, and for flowering plants we only identified genus of individuals in flower. Residential yards around the world have been shown to harbor a high number of plant species, including understudied areas such as cities in India (Jaganmohan et al., 2012), Burundi (Bigirimana et al., 2012), Turkey (Acar et al., 2007), China (Wang et al., 2015), and South Africa (Lubbe et al., 2011). In Baltimore, the most common lawn species were non-native turf grasses, with P. pratensis being found at 83% of homes we visited. We also found that several species in residential yards, including three of the most common lawn species (in terms of either frequency or abundance), were native. Five of the flowering plant genera and six of the tree species documented were native and planted, demonstrating that yards can be refuges for native species in urban areas. The suitability of typical residential yards for native species might vary geographically, however, as Padullés Cubino et al. (2019a) found more native species in mesic versus arid cities. In addition to harboring native species, we found that residential yards can also be a source of invasive species (Reichard and White, 2001; Ward and Amatangelo, 2018), as two of the most common flowering plant genera we documented, Buddleja and Hemerocallis, are actually invasive. In addition to cultivated plants that can escape yards, we consistently found invasive weedy species at the homes we visited. Our investigation of invasive species is conservative assessment, as we were only looking for common invasive species on the Maryland DNR invasive species list.
Plant Community Structure and Diversity in Residential Yards
We found consistently strong plant community associations with income, where yards in higher-income neighborhoods had higher biodiversity, supporting the luxury effect (Hope et al., 2003; Martin et al., 2004; Avolio et al., 2018). The community composition of lawn plant species and flowering plants in our study was also associated with income. Other studies have found that the community composition of residential lands was associated with socio-economic variables as well, such as income in Burundi (Bigirimana et al., 2012), housing type in Turkey (Acar et al., 2007), and whether it was a primary or secondary home in Spain (Padullés Cubino et al., 2016). Legacies of previous owners can also affect current patterns of biodiversity (Torres-Camacho et al., 2016), which we did not assess here. Having higher income can result in greater input into lawn care (Zhou et al., 2009) and more purchases of flowering plants, although we did not find an effect of income on tree community composition. It is important to note that the associations we found with income were not driven by yard size, which we controlled for by surveying homes with small, medium, and large yards in both our high- and mid-income categories. Instead, we think the effect of income relates to the ability to spend more money on plants and yard maintenance resources. We also found higher income yards were more colorful, adding a new dimension of urban biodiversity to typically used measures. We found no interaction between neighborhood income and lifestage, which does not support our hypothesis that those with more money but less time will spend money to have others do their yard care. It is possible that our high-income neighborhood category was not high enough to capture residents that frequently pay for yard care. Future studies should encompass a broader range of incomes as well as explore relationships between income and specific yard care practices.
We found few statistically significant relationships between lifestage and plant community structure or diversity, despite the widespread observation that older residents generally spend more time gardening (Gross and Lane, 2007) and have greater species richness in their garden beds (Kendal et al., 2012). We did find greater floral areas in the Senior Styles yards, suggesting that the older homeowners learned how to increase the productivity of their flowering plants through years of experience gardening. The two lifestage groups had a similar number of plants and species composition in their yards, indicating that actual management of flowering plants is driving the greater flora area. Loram et al. (2011) found that residents who had lived at their homes for longer were more likely to dead-head plants, although they did not study the age of residents. We also found that the number of invasive species increased with yard size, but that this had a significant interaction with resident lifestage. There was a much stronger association between yard size and invasive species richness among yards of residents in the Middle Ground lifestage compared with yards of residents in the Senior Styles lifestage, again suggesting different management practices between these lifestages. As most of the invasive plants were growing spontaneously in yards, it is likely that invasive plants were suppressed by residents in Senior Styles yards rather than introduced by residents in Middle Ground yards.
When directly studying the amount of time doing yard work, we found that spending more time working in yards did result in higher cultivated plant diversity. It is unclear if more gardening directly results in more biodiversity, or if those that want more diversity also spend more time gardening. Loram et al. (2011) also found that time spent doing various aspects of gardening had more natives and generally more plant species. Time spent gardening was not correlated with having fewer invasive species, however. Anecdotally, we found that most invasive species were in the relatively unmanaged areas of yards, which might explain why time spent doing yard did not reduce invasive species.
Lastly, we found significant differences for some, but not all, aspects of plant community structure and diversity between front and back yards. Social theory predicts that there are more social pressures for an outward display of conformity in front yards compared to back yards (Robbins, 2007; Locke et al., 2018b). Consistent with findings across Australian (Daniels and Kirkpatrick, 2006) and Puerto Rican (Vila-Ruiz et al., 2014) neighborhoods, we found that front yards had more floral area. Greater floral area in front versus back yards suggests that residents are managing front yards to display a flowering, colorful aesthetic to their neighbors. We also found more trees, more tree species, and larger trees in back versus front yards, which is consistent with prior field-based research in Syracuse, New York (Richards et al., 1984). Remote sensing-based research in the greater Boston metropolitan region has documented more tree canopy cover and taller trees in back yards than front yards (Ossola et al., 2019). Yard area may explain our finding of more trees in the back yard versus front yards, as back yards were statistically larger than front yards. Residents may be more likely to plant smaller ornamental tree species in front yards or may be more likely to remove and replace trees in the front yard before they grow very large, whereas trees in the backyard may be larger native tree species and allowed to reach maturity senescence before they are removed. Future research should continue to examine patterns of community structure and diversity in ways that link to the social processes that drive those patterns, in part by explicitly sampling front and back yards as distinct components of the urban ecosystem.
Methodological Approaches
Tapestry LifeMode
The lack of a significant lifestage effect in many of our analyses may be explained by the actual demographic differences between the Tapestry LifeMode groups used in our study design. While residents in the Senior Styles lifestage were older than those in the Middle Ground lifestage (Senior Styles median age 50, Middle Ground median age 37), only 30% of the Senior Styles population was actually over 65, as opposed to 14% in Middle Ground. Tapestry LifeMode categories are based on Census block groups, which can have a lot of demographic variability. Our research focused on individual households, their yards, and the plants they contain. For example, one of our Senior Styles neighborhoods was partially made up of elderly retirees and partially made up of large families with young children. To date, lifestyle categories have typically been used for assessing broader patterns of ecosystem structure, such as tree cover (Boone et al., 2010; Grove et al., 2014). Researchers should consider how parcel-based characteristics may relate to their associated block group, and within-block group variation when conducting future studies. A final consideration of lifestages is that being over 65 may not be a good indicator of whether a resident is retired, especially for lower income residents. However, given all these difficulties, we did find that residents in the Senior Styles lifestage paid for more yard work than those in Middle Ground.
Flowering Plant Diversity
In this study, we introduced several measures of flowering plant diversity. We studied number of flowers, number of flower colors, and floral area in addition to more common measures of flowering plant abundance and number of genera. We focused on flowering plant diversity because flowers are associated with positive emotions, likely to be cultivated intentionally (Haviland-Jones and Rosario, 2005), easy to identify, and are associated with higher species richness (Southon et al., 2018). Our measure of floral color diversity is a conservative estimate of the number of colors in yards, because we used a 12-color wheel to reduce human bias. A different approach might be to digitally quantify flower colors using color spaces (Kendal et al., 2013), and calculate an average color space of each yard. However, it is unclear how this would translate to number of floral colors or other measures of flowering plant variety. It is important to note that our approach targeted colors as seen by the human manager and did not account for colors in relation to pollinators. Regardless of method, these approaches aim to identify colors relevant to human managers and not pollinators. We found that our new measures and more traditional measures of diversity, while correlated, are not redundant, and that each detected a unique aspect of flowering plant diversity. Further, we found that floral area was more responsive to lifestage and yard location than other flowering plant measures. We suggest future studies on yard biodiversity include more resident-perceived diversity measures, such as number of flower colors, in addition to species richness.
Conclusion
Our study adds to a growing body of evidence that residential yards harbor high plant biodiversity, including native, non-native, and invasive species. We found that yard size and neighborhood-level income were consistently related to residential yard plant community structure and diversity, while neighborhood-level lifestage and yard (i.e., front vs back) location were not. Larger yards and yards in higher income areas had more plants and more species (or genera) of plants. Lifestage was related to floral area and number of invasive species, suggesting that plant and yard management practices do differ between resident lifestages. We also found additional evidence for the influence of societal norms on yard plant diversity, with greater floral area in front yards than back yards. Overall, our research demonstrates that there is a complex interaction among environmental conditions and human resources, which shapes patterns of urban plant diversity. More research studying the consequences of resident management practices on yard plant community structure and diversity are necessary to better understand the linkages between resident management actions and urban biodiversity.
Data Availability Statement
The datasets generated for this study are available on request to the corresponding author.
Ethics Statement
The studies involving human participants were reviewed and approved by the Homewood IRB of Johns Hopkins University. Written informed consent for participation was not required for this study in accordance with the national legislation and the institutional requirements.
Author Contributions
MA conceived of the study, analyzed the data, and wrote the manuscript with contributions and input from all co-authors. MA, NS, and DL designed the study. MA and AB contacted homeowners and collected the data with assistance from NS and DL.
Funding
This work was supported by the Johns Hopkins University, and Baltimore Ecosystem Study (BES) DEB-1637661 and DEB-1855277.
Conflict of Interest
The authors declare that the research was conducted in the absence of any commercial or financial relationships that could be construed as a potential conflict of interest.
Acknowledgments
The findings and conclusions in this paper are those of the authors and should not be construed to represent any official USDA or U.S. Government determination or policy. We thank Preston Betz, Eric Yee, Shasha Jiang, and Siraj Faruqee for their assistance in the field.
References
Acar, C., Acar, H., and Eroğlu, E. (2007). Evaluation of ornamental plant resources to urban biodiversity and cultural changing: a case study of residential landscapes in Trabzon city (Turkey). Build Environ. 42, 218–229. doi: 10.1016/j.buildenv.2005.08.030
Aelion, C. M., Davis, H. T., Lawson, A. B., Cai, B., and McDermott, S. (2013). Associations between soil lead concentrations and populations by race/ethnicity and income-to-poverty ratio in urban and rural areas. Environ. Geochem. Health 35, 1–12. doi: 10.1007/s10653-012-9472-0
Avolio, M., Carroll, I., Collins, S., Houseman, G. R., Hallet, L. M., Isbell, F., et al. (2019a). A comprehensive approach to analyzing community dynamics using rank abundance curves. Ecosphere 10:e02881.
Avolio, M., Pataki, D. E., Jenerette, G. D., Pincetl, S., Clarke, L. W., Cavender-Bares, J., et al. (2019b). Urban plant diversity in Los Angeles, California: species and functional type turnover in cultivated landscapes. Plants People Planet 2, 144–156. doi: 10.1002/ppp3.10067
Avolio, M. L., Pataki, D. E., Gillespie, T. W., Jenerette, G. D., McCarthy, H. R., Pincetl, S., et al. (2015). Tree diversity in southern California’s urban forest: the interacting roles of social and environmental variables. Front. Ecol. Evol. 3:73. doi: 10.3389/fevo.2015.00073
Avolio, M. L., Pataki, D. E., Trammell, T. L. E., and Endter-Wada, J. (2018). Biodiverse cities: the nursery industry, homeowners, and neighborhood differences drive urban tree composition. Ecol. Monogr. 88, 259–276. doi: 10.1002/ecm.1290
Beninde, J., Veith, M., and Hochkirch, A. (2015). Biodiversity in cities needs space: a meta-analysis of factors determining intra-urban biodiversity variation (N Haddad. Ed). Ecol. Lett. 18, 581–592. doi: 10.1111/ele.12427
Bhatti, M. (2006). “When I’m in the Garden I Can Create My Own Paradise”: Homes and Gardens in Later Life. Sociol. Rev. 54, 318–341. doi: 10.1111/j.1467-954x.2006.00616.x
Bigirimana, J., Bogaert, J., De Cannière, C., Bigendako, M.-J., and Parmentier, I. (2012). Domestic garden plant diversity in Bujumbura, Burundi: role of the socio-economical status of the neighborhood and alien species invasion risk. Landsc. Urban Plan. 107, 118–126. doi: 10.1016/j.landurbplan.2012.05.008
Boone, C. G., Buckley, G. L., Grove, J. M., and Sister, C. (2009). Parks and people: an environmental justice inquiry in Baltimore, Maryland. Ann. Assoc. Am. Geogr. 99, 767–787. doi: 10.1080/00045600903102949
Boone, C. G., Cadenasso, M. L., Grove, J. M., Schwarz, K., and Buckley, G. L. (2010). Landscape, vegetation characteristics, and group identity in an urban and suburban watershed: why the 60s matter. Urban Ecosyst. 13, 255–271. doi: 10.1007/s11252-009-0118-7
Cheng, E. H., Patterson, I., Packer, J., and Pegg, S. (2010). Identifying the satisfactions derived from leisure gardening by older adults. Ann. Leis. Res. 13, 395–419. doi: 10.1080/11745398.2010.9686855
Cook, E. M., Hall, S. J., and Larson, K. L. (2012). Residential landscapes as social-ecological systems: a synthesis of multi-scalar interactions between people and their home environment. Urban Ecosyst. 15, 19–52. doi: 10.1007/s11252-011-0197-0
Daniels, G. D., and Kirkpatrick, J. B. (2006). Comparing the characteristics of front and back domestic gardens in Hobart, Tasmania, Australia. Landsc. Urban Plan. 78, 344–352. doi: 10.1016/j.landurbplan.2005.11.004
Davies, Z. G., Fuller, R. A., Loram, A., Irvine, K. N., Sims, V., and Gason, K. J. (2009). A national scale inventory of resource provision for biodiversity within domestic gardens. Biol. Conserv. 142, 761–771. doi: 10.1016/j.biocon.2008.12.016
ESRI (2017). Tapestry Segmentation Reference Guide - Esri. Available online at: https://clermontcountyohio.biz/wp-content/uploads/sites/3/esritapestrysegmen tation.pdf (accessed June, 2018).
Goddard, M. A., Dougill, A. J., and Benton, T. G. (2010). Scaling up from gardens: biodiversity conservation in urban environments. Trends Ecol. Evol. 25, 90–98. doi: 10.1016/j.tree.2009.07.016
Goodness, J. (2018). Urban landscaping choices and people’s selection of plant traits in Cape Town, South Africa. Environ. Sci Policy 85, 182–192. doi: 10.1016/j.envsci.2018.02.010
Groffman, P. M., Avolio, M., Cavender-Bares, J., Bettez, N. D., Grove, J. M., Hall, S. J., et al. (2017). Ecological homogenization of residential macrosystems. Nat. Ecol. Evol. 22, 1–3. doi: 10.1038/s41559-017-0191
Gross, H., and Lane, N. (2007). Landscapes of the lifespan: exploring accounts of own gardens and gardening. J. Environ. Psychol. 27, 225–241. doi: 10.1016/j.jenvp.2007.04.003
Grove, J. M., Cadenasso, M. L., Pickett, S. T. A., Machlis, G. E., and Burch, W. R. (2015). The Baltimore School of Urban Ecology: Space, Scale, and Time for the Study of Cities. New Haven, CT: Yale University Press.
Grove, J. M., Locke, D. H., and O’Neil-Dunne, J. P. M. (2014). An ecology of prestige in New York City: examining the relationships among population density, socio-economic status, group identity, and residential canopy cover. Environ. Manage. 54, 402–419. doi: 10.1007/s00267-014-0310-2
Hallett, L. M., Avolio, M. L., Carroll, I., et al. (2019). codyn: Community Dynamics Metrics. Available online at: https://github.com/NCEAS/codyn/ (accessed June, 2019).
Harris, E. M., Martin, D. G., Polsky, C., Denhardt, L., and Nehrig, A. (2013). Beyond “Lawn People”: the role of emotions in suburban yard management practices. Prof. Geogr. 65, 345–361. doi: 10.1080/00330124.2012.681586
Harris, E. M., Polsky, C., Larson, K. L., Gorvoille, R., Martin, D. G., Burmand, J., et al. (2012). Heterogeneity in Residential Yard Care: evidence from Boston, Miami, and Phoenix. Hum. Ecol. 40, 735–749. doi: 10.1007/s10745-012-9514-3
Haviland-Jones, J., and Rosario, H. (2005). An environmental approach to positive emotion: flowers. Evol. Psychol. 3, 104–132. doi: 10.1177/2382120519899148
Hope, D., Gries, C., Zhu, W., Fagan, W. F., Redman, C. L., Grimm, N. B., et al. (2003). Socioeconomics drive urban plant diversity. Proc. Natl. Acad. Sci. U.S.A. 100, 8788–8792. doi: 10.1073/pnas.1537557100
Jaganmohan, M., Vailshery, L. S., Gopal, D., and Nagendra, H. (2012). Plant diversity and distribution in urban domestic gardens and apartments in Bangalore, India. Urban Ecosyst. 15, 911–925. doi: 10.1007/s11252-012-0244-5
Jenerette, G. D., Clarke, L. W., Avolio, M. L., Pataki, D. E., Gillespie, T. W., Pincetl, S., et al. (2016). Climate tolerances and trait choices shape continental patterns of urban tree biodiversity. Glob. Ecol. Biogeogr. 25, 1367–1376. doi: 10.1111/geb.12499
Kendal, D., Hauser, C. E., Garrard, G. E., Jellinek, S., Giljohann, K. M., and Moore, J. L. (2013). Quantifying plant colour and colour difference as perceived by humans using digital images. PLoS One 8:e72296. doi: 10.1371/journal.pone.0072296
Kendal, D., Williams, N. S. G., and Williams, K. J. H. (2012). Drivers of diversity and tree cover in gardens, parks and streetscapes in an Australian city. Urban Urban Green 11, 257–265. doi: 10.1016/j.ufug.2012.03.005
Larsen, L., and Harlan, S. L. (2006). Desert dreamscapes: residential landscape preference and behavior. Landsc. Urban Plan. 78, 85–100. doi: 10.1016/j.landurbplan.2005.06.002
Larson, K. L., Casagrande, D., Harlan, S. L., and Yabiku, S. T. (2009). Residents’ yard choices and rationales in a desert city: social priorities, ecological impacts, and decision tradeoffs. Environ. Manage. 44, 921–937. doi: 10.1007/s00267-009-9353-1
Leong, M., Dunn, R. R., and Trautwein, M. D. (2018). Biodiversity and socioeconomics in the city: a review of the luxury effect. Biol. Lett. 14:20180082. doi: 10.1098/rsbl.2018.0082
Lerman, S. B., and Warren, P. S. (2011). The conservation value of residential yards: Linking birds and people. Ecol. Appl. 21, 1327–1339. doi: 10.1890/10-0423.1
Locke, D. H., Avolio, M., Trammel, T., Roy Chowdhury, R., Grove, J. M., Rogan, J., et al. (2018a). A multi-city comparison of front and backyard differences in plant species diversity and nitrogen cycling in residential landscapes. Landsc. Urban Plan. 178, 102–111. doi: 10.1016/j.landurbplan.2018.05.030
Locke, D. H., and Grove, J. M. (2016). Doing the Hard Work Where it’s Easiest? Examining the relationships between Urban greening programs and social and ecological characteristics. Appl. Spat. Anal. Policy 9, 77–96. doi: 10.1007/s12061-014-9131-1
Locke, D. H., Roy Chowdhury, R., Grove, J. M., Martin, D. G., Goldman, E., Rogan, J., et al. (2018b). Social norms, yard care, and the difference between front and back yard management: examining the landscape mullets concept on Urban residential lands. Soc. Nat. Resour. 31, 1169–1188. doi: 10.1080/08941920.2018.1481549
Loram, A., Warren, P., Thompson, K., and Gaston, K. (2011). Urban domestic gardens: the effects of human interventions on garden composition. Environ. Manage. 48, 808–824. doi: 10.1007/s00267-011-9723-3
Lubbe, C., Siebert, S., and Cilliers, S. (2011). Floristic analysis of domestic gardens in the Tlokwe City Municipality, South Africa. Bothalia 41, 351–361. doi: 10.4102/abc.v41i2.78
Martin, C. A., Warren, P. S., and Kinzig, A. P. (2004). Neighborhood socioeconomic status is a useful predictor of perennial landscape vegetation in residential neighborhoods and embedded small parks of Phoenix, AZ. Landsc. Urban Plan. 69, 355–368. doi: 10.1016/j.landurbplan.2003.10.034
McClintock, N. (2012). Assessing soil lead contamination at multiple scales in Oakland, California: implications for urban agriculture and environmental justice. Appl. Geogr. 35, 460–473. doi: 10.1016/j.apgeog.2012.10.001
Meléndez-Ackerman, E. J., Santiago-Bartolomei, R., Vila-Ruiz, C. P., Santiago, L. E., García-Montiel, D., Verdejo-Ortiz, J. C., et al. (2014). Socioeconomic drivers of yard sustainable practices in a tropical city. Ecol. Soc. 19:20.
Nowak, D. J., Rowntree, R. A., McPherson, E. G., Sisinni, S. M., Kerkmann, E. R., and Stevens, J. C. (1996). Measuring and analyzing urban tree cover. Landsc. Urban Plan. 36, 49–57. doi: 10.1016/s0169-2046(96)00324-6
Oksanen, J., Blanchet, F. G., Friendly, M., Kindt, R., Legendre, P., McGlinn, D., et al. (2019). vegan: Community Ecology Package. Available at: http://CRAN.R-project.org/package=vegan
Ossola, A., Locke, D. H., Lin, B., and Minor, E. S. (2019). Yards and home gardens increase connectivity of urban landscapes. Landsc. Ecol. 34, 2935–2948. doi: 10.1007/s10980-019-00923-7
Padullés Cubino, J., Cavender-Bares, J., Hobbie, S. E., Hall, S. J., Trammell, T. L. E., Neill, C., et al. (2019a). Contribution of non-native plants to the phylogenetic homogenization of U.S. yard floras. Ecosphere 10:e02638. doi: 10.1002/ecs2.2638
Padullés Cubino, J., Cavender-Bares, J., Hobbie, S. E., Pataki, D. E., Avolio, M. L., Darling, L. E., et al. (2019b). Drivers of plant species richness and phylogenetic composition in urban yards at the continental scale. Landsc. Ecol. 34, 63–77. doi: 10.1007/s10980-018-0744-7
Padullés Cubino, J., Vila Subirós, J., and Barriocanal Lozano, C. (2016). Floristic and structural differentiation between gardens of primary and secondary residences in the Costa Brava (Catalonia, Spain). Urban Ecosyst. 19, 505–521. doi: 10.1007/s11252-015-0496-y
Pallai, C., and Wesson, K. (2017). Chesapeake Bay Program Partnership High-Resolution Land Cover Classification Accuracy Assessment Methodology. Available at: https://chesapeakeconservancy.org/wp-content/uploads/2017/01/Chesapeake_Conservancy_Accuracy_Assessment_Methodology (accessed June 27, 2018).
Pearse, W. D., Cavender-Bares, J., Hobbie, S. E., Avolio, M. L., Bettez, N., Roy Chowdhury, R., et al. (2018). Homogenization of plant diversity, composition, and structure in North American urban yards. Ecosphere 9: e0215.
Politi Bertoncini, A., Machon, N., Pavoine, S., and Muratet, A. (2012). Local gardening practices shape urban lawn floristic communities. Landsc. Urban Plan. 105, 53–61. doi: 10.1016/j.landurbplan.2011.11.017
R Core Team, (2019). R: A Language and Environment for Statistical Computing. Vienna: R Foundation for statistical computing.
Reichard, S. H., and White, P. (2001). Horticulture as a pathway of invasive plant introductions in the United States. Bioscience 51, 103–113. doi: 10.3732/ajb.1300061
Richards, N., Mallette, J., Simpson, R., and Macie, E. (1984). Residential greenspace and vegetation in a mature city: Syracuse, New York. Urban Ecol. 8, 99–125. doi: 10.1016/0304-4009(84)90009-3
Robbins, P. (2007). Lawn People: How Grasses, Weeds, and Chemicals Make Us Who We Are. Philadelphia, PA: Temple University Press.
Robbins, P., Polderman, A., and Birkenholtz, T. (2001). Lawns and toxins: an ecology of the City. Cities 18, 369–380. doi: 10.1016/s0264-2751(01)00029-4
Roy Chowdhury, R., Larson, K., Grove, J. M., Polsky, C., Cook, E., Onested, J., et al. (2011). A multi-scalar approach to theorizing socio-ecological dynamics of urban residential landscapes. Cities Environ. 4:6.
Southon, G. E., Jorgensen, A., Dunnett, N., Hoyle, H., and Evans, K. L. (2018). Perceived species-richness in urban green spaces: Cues, accuracy and well-being impacts. Landsc. Urban Plan. 172, 1–10. doi: 10.1016/j.landurbplan.2017.12.002
Thompson, K., Hodgson, J. G., Smith, R. M., Warren, P. H., and Gaston, J. K. (2004). Urban domestic gardens (III): composition and diversity of lawn floras. J. Veg. Sci. 15, 373–378. doi: 10.1111/j.1654-1103.2004.tb02274.x
Torres-Camacho, K. A., Meléndez-Ackerman, E. J., Díaz, E., Correa, N., Vila-Ruiz, C., Olivero-Lora, S., et al. (2016). Intrinsic and extrinsic drivers of yard vegetation in urban residential areas: implications for conservation planning. Urban Ecosyst. 20, ages403–ages413.
Troy, A. R. (2008). “Geodemographic segmentation,” in Encyclopedia of GIS, eds S. Shekhar and H. Xiong (Boston, MA: Springer).
U.S. Census Bureau, (2019). U. S. Census Bureau QuickFacts. Balitiore County, MD: U.S. Census Bureau.
van Heezik, Y. M., Freeman, C., Porter, S., and Dickinson, K. J. M. (2014). Native and exotic woody vegetation communities in domestic gardens in relation to social and environmental factors. Ecol. Soc. 19:17.
Vila-Ruiz, C. P., Meléndez-Ackerman, E., Santiago-Bartolomei, R., Garcia-Montile, D., Lastra, L., Figuerola, C. E., et al. (2014). Plant species richness and abundance in residential yards across a tropical watershed: implications for urban sustainability. Ecol. Soc. 19:art22.
Wang, H.-F., Qureshi, S., Knapp, S., Friedman, C. R., and Hubacek, K. (2015). A basic assessment of residential plant diversity and its ecosystem services and disservices in Beijing, China. Appl. Geogr. 64, 121–131. doi: 10.1016/j.apgeog.2015.08.006
Ward, S. G., and Amatangelo, K. L. (2018). Suburban gardening in Rochester, New York: exotic plant preference and risk of invasion. Landsc. Urban Plan. 180, 161–165. doi: 10.1016/j.landurbplan.2018.09.004
Werner, C., and Wixted, K. (2019). Common Invasive Plants Easy ID Cards. Available online at: https://dnr.maryland.gov/wildlife/Documents/Invasive_plants_cards.pdf (accessed July, 2018).
Keywords: urban biodiversity, ESRI Tapestry, residential land management, retired, lawns, city trees, flowering plants
Citation: Avolio M, Blanchette A, Sonti NF and Locke DH (2020) Time Is Not Money: Income Is More Important Than Lifestage for Explaining Patterns of Residential Yard Plant Community Structure and Diversity in Baltimore. Front. Ecol. Evol. 8:85. doi: 10.3389/fevo.2020.00085
Received: 02 November 2019; Accepted: 12 March 2020;
Published: 23 April 2020.
Edited by:
Sonja Knapp, Helmholtz Centre for Environmental Research (UFZ), GermanyReviewed by:
Francesca Bretzel, Italian National Research Council, ItalyElvia Melendez-Ackerman, University of Puerto Rico, Río Piedras Campus, Puerto Rico
Copyright © 2020 Avolio, Blanchette, Sonti and Locke. This is an open-access article distributed under the terms of the Creative Commons Attribution License (CC BY). The use, distribution or reproduction in other forums is permitted, provided the original author(s) and the copyright owner(s) are credited and that the original publication in this journal is cited, in accordance with accepted academic practice. No use, distribution or reproduction is permitted which does not comply with these terms.
*Correspondence: Meghan Avolio, meghan.avolio@jhu.edu
†ORCID: Meghan Avolio, orcid.org/0000-0002-2649-9159; Allison Blanchette, orcid.org/0000-0002-0492-9584; Nancy F. Sonti, orcid.org/0000-0001-8581-8124; Dexter H. Locke, orcid.org/0000-0003-2704-9720