Hidden Diversity of African Yellow House Bats (Vespertilionidae, Scotophilus): Insights From Multilocus Phylogenetics and Lineage Delimitation
 Terrence C. Demos
 Paul W. Webala2
  Michael Bartonjo
 Bruce D. Patterson
- 1Integrative Research Center, Field Museum of Natural History, Chicago, IL, United States
- 2Department of Forestry and Wildlife Management, Maasai Mara University, Narok, Kenya
- 3Mammalogy Section, National Museums of Kenya, Nairobi, Kenya
The genus Scotophilus contains 21 currently recognized species ranging throughout Africa and Southeast Asia. Among the 13 species recognized from continental Africa, systematic relationships remain poorly understood. Taxonomic uncertainty regarding names, suggestions of polytypic species complexes, and undescribed cryptic diversity all contribute to the current confusion. To gain insights into the systematics of this group, we inferred single locus and multi-locus phylogenies and conducted lineage delimitation analyses using seven unlinked genes for specimens from across Africa. Recent collections from Kenya allowed us to carry out population-level analyses for the diverse assemblage of East African Scotophilus. Multi-locus coalescent delimitation methods indicated strong support for three recently named lineages thought to be restricted to Kenya and Tanzania; it also uncovered two new distinctive lineages at present known only from Kenya. Subsequent taxonomic assessments that integrate these genetic data with phenotypic, distributional, and/or ecological traits are needed to establish these lineages as valid species. Nevertheless, as many as 15 Scotophilus species may occur in continental Africa, 10 of these in Kenya alone. Our analysis highlights the importance of population-level surveys for the detection of cryptic diversity in understudied regions such as the Afrotropics.
Introduction
Species constitute fundamental ecological and historical units in biological systems (Coyne and Orr, 2004). Accurate determination of species limits is critical for effective assessments of ecosystems services (Gascon et al., 2015), biodiversity hotspots (Mittermeier et al., 2011), and as units in community ecological and macroecological studies (Loreau et al., 2001). At the largest scale, accuracy is needed for inferring the Tree of Life and understanding the processes responsible for drastic differences in species numbers among groups of organisms (Wiens, 2017). As an example, it has been shown that the relationship between species richness and geography, the basis of determining global biodiversity hotspots, can be greatly biased if the number of species is underestimated (Hortal et al., 2015). These knowledge gaps in species-level taxonomy, the so-called Linnean shortfall, are particularly prevalent in tropical species (e.g., Hughes et al., 2017); they also characterize recently diverged and morphologically conservative clades where cryptic species are present (Fišer et al., 2018) and incomplete lineage sorting is expected due to recency of common ancestry (Hudson and Coyne, 2002). Coalescent species delimitation methods take advantage of multi-locus sequence data now available for many taxa in need of systematic revision and offer more objective assessments of diversity in these groups (Fujita et al., 2012; Yang and Rannala, 2014). However, care must be taken in applying these methods and understanding their limitations.
It has been shown that multispecies multilocus coalescent delimitation methods actually diagnose genetic structure, not species, and these methods cannot statistically distinguish structure associated with population isolation from species boundaries (see review in Sukumaran and Knowles, 2017). “Species delimitations” by these methods actually constitute statements of population structure, and hence of independent evolutionary lineages. Integrative taxonomic assessments using multiple independent datasets from voucher specimens are needed before the resulting groups warrant taxonomic recognition as species. Independent data, such as morphology, vocalizations, ecology, and geographic distribution, can be used to evaluate the relationships of groups once they are delimited. The results of delimitation studies can provide a strong foundation for subsequent integrative taxonomic revisions and should be especially valuable in cases involving taxonomic confusion or uncertainty of the samples.
Yellow house bats are particularly fitting subjects for species delimitation analyses. Scotophilus species (Chiroptera: Vespertilionidae) are distributed throughout the tropical and subtropical parts of the Eastern Hemisphere. Known for two centuries, the genus now includes twice the number of species (21) that were recognized only 15 years ago (cf. Simmons, 2005; Burgin et al., 2018). Both literature and GenBank records for African species of Scotophilus are rife with identification errors, especially regarding the 19th-century names S. dinganii A. Smith, 1833 and S. viridis Peters, 1852 (Simmons, 2005; Jacobs et al., 2006; Trujillo et al., 2009; Vallo et al., 2011; Patterson and Webala, 2012). Prior workers constructed polytypic species complexes (e.g., Hayman and Hill, 1971; Robbins et al., 1985) with few qualitative or mensural characters differentiating species and thus likely contain cryptic species. A recent phylogenetic study of African species using mitochondrial and nuclear sequences (Trujillo et al., 2009) helped clarify some of these issues, demonstrating the paraphyly of both S. dinganii and S. viridis as those names were being applied. These authors also identified deeply divergent clades within what had been called S. dinganii. However, this clarity was short-lived. Brooks and Bickham (2014) subsequently coined four new species names for clades identified by Trujillo and colleagues—three of them based on Kenyan records—without distinguishing their new species from previously-named taxa. For example, S. nigrita colias Thomas, 1904 was also described from Kenya and was treated as a species-level clade by Vallo et al. (2011), and S. leucogaster, S. nigrita, and S. nux were also registered as occurring within Kenya (Aggundey and Schlitter, 1984). Still other names might also apply to East African yellow house bat lineages (Vallo and Van Cakenberghe, 2017). To the rather straightforward question “How many species of African Scotophilus are there?” must now be added “And which names apply to which lineages?” Here we address the former question and defer the latter (and more complicated) one to a full-scale taxonomic revision.
Recent surveys of Kenyan bats have documented Scotophilus populations throughout the country, providing substantial new material for the evaluation of both phylogenetic relationships and species limits. Scotophilus diversity in Kenya is among the highest documented in Africa. We sought to clarify species limits and phylogenetic relationships of East African Scotophilus and evaluate the potential evolutionary independence of lineages. Here, we use genetic markers and species delimitation methods on mitochondrial and nuclear sequences to identify a number of evolutionarily significant lineages of yellow house bats. These are presented as hypothetical species-level clades for future studies to arbitrate using morphology, development, vocalizations, ectoparasites, and the like.
Materials and Methods
Taxon Sampling
The majority of specimens newly sequenced for this study (n = 101) were from specimens collected by the junior authors (PWW, MB, and BDP) using mistnets and harp traps set on flyways or hand-held nets at roosts during field surveys in Kenya. We sampled as broadly within the country as we could. Initial identifications were based on the African bat key in Patterson and Webala (2012). Field methods followed disciplinary guidelines (Sikes, 2016 and predecessors) and were approved by Field Museum of Natural History's IACUC (2012-003). Kenyan work was permitted by the Kenya Wildlife Service (KWS/4001) and the Kenya Forest Service (RESEA/1/KFS/75). An additional 132 cytochrome-b (cyt-b) sequences of Scotophilus sampled from across Africa and Asia were downloaded from GenBank (see Appendix 1, Supplemental Material, for voucher numbers, locality data, and GenBank accession numbers).
We take a conservative approach to the nomenclatural consequences of our analyses and, where a group's taxonomic identity is unknown or ambiguous, refer to it merely as a numbered clade. The taxa S. andrewreborii, S. livingstonii, and S. trujilloi (all named by Brooks and Bickham, 2014) could each be unambiguously applied to clades in our analyses through the genetic sampling of Trujillo et al. (2009). We use these names as explicit labels for our analysis but cannot vouch for their validity with respect to older taxa that would have nomenclatural priority. Morphological diagnoses of the various lineages indicated by our analyses will be needed to determine which (if any) existing name applies to them.
DNA Extraction, Amplification, and Sequencing
Whole genomic DNA was extracted from tissue samples using the Wizard SV 96 Genomic DNA Purification System (Promega Corporation, WI, USA). Specimens were sequenced for mitochondrial Cytochrome-b (cyt-b), using the primer pair LGL 765F and LGL 766R that amplify the entire cyt-b gene (Bickham et al., 1995, 2004), and six unlinked autosomal nuclear introns: ABHD11 intron 5 (ABHD11), ACOX2 intron 3 (ACOX2), ACPT intron 4 (ACPT), COPS7A intron 4 (COPS7A), and ROGDI intron 7 (ROGDI; Salicini et al., 2011); and STAT5A intron 16 (STAT5A; Eick et al., 2005; Table 1, Supplemental Material). PCR amplifications were carried out in 25 μl reaction volumes as follows: 1–2 μl of template DNA (approx. 5–25 ng), 12.5 μl of OneTaq 2X Master Mix with Standard Buffer (New England BioLabs Inc.), and 1 μl of 10 μM forward and reverse primers. Thermal conditions for the cyt-b gene consisted of an initial denaturation step at 95°C for 3 min, followed by 36 cycles consisting of 45 s at 95°C, 30 s at 50°C, and 2.5 min at 70°C, followed by a final extension step of 5 min at 70°C as in Trujillo et al. (2009). Thermal conditions for the ACOX2, ACPT, and COPS7A consisted of an initial denaturing step at 95°C for 3 min; 1 cycle of 95°C for 15 s, 65°C for 30 s, and 72°C for 1 min; followed by 1 cycle each at annealing temperature in 1°C decrements from 65°C (64–56°C); 32 cycles of 95°C for 15 s, 55°C for 30 s, and 72°C for 1 min; followed by a final extension step of 5 min at 72°C as in Dool et al. (2016). Thermal conditions for ABHD11, ROGDI, and STAT5A consisted of an initial denaturing step at 95°C for 3 min; 1 cycle of 95°C for 15 s, 60°C for 30 s, and 72°C for 1 min; followed by 1 cycle each at annealing temperature in 1°C decrements from 60°C (59°C−51°C); 32 cycles of 95°C for 15 s, 55°C for 30 s, and 72°C for 1 min; followed by a final extension step of 5 min at 72°C as in Dool et al. (2016). Amplified products were purified using ExoSAP-IT (Thermo Scientific, MA, USA). Sequencing was carried out in both directions on an ABI 3100 thermocycler (Applied Biosystems, CA, USA) at the Pritzker Laboratory for Molecular Systematics and Evolution (FMNH).
Chromatographs were checked manually, assembled, and edited using GENEIOUS PRO 10.1 (Biomatters Ltd.). Sequences from each locus were aligned independently using the MUSCLE algorithm (Edgar, 2004) with default settings in GENEIOUS. Sequence data from cyt-b were translated into amino acids and inspected for deletions, insertions, and premature stop codons to exclude paralogous sequences. Alignments for all data sets were inspected visually and determined to be unambiguous. Several gaps were included in the alignments of the nuclear introns, but their positions were not found to be ambiguous. Nuclear alleles were statistically resolved using PHASE 2.1.1 (Stephens et al., 2001) under default parameters, except that the haplotype acceptance threshold was adjusted to 0.70, which has been shown to reduce the number of unresolved genotypes with no increase in false positives (Garrick et al., 2010). Input files for PHASE were generated using the SEQPHASE web server (Flot, 2010). PHASE was run for 1,000 iterations with a burn-in of 500 and a thinning interval of 1.
Molecular Data and Phylogenetic Analyses
The best-supported models of nucleotide substitution for cyt-b and each unpartitioned nuclear intron were determined using the BIC on the maximum-likelihood topology estimated independently for each model in jMODELTEST2 (Darriba et al., 2012) on CIPRES Science Gateway v.3.1 (Miller et al., 2010). We calculated interspecific uncorrected sequence divergences (p-distances) for cyt-b in MEGA v.7.0.26 (Kumar et al., 2016). Sample sizes of cyt-b sequences were small for 5 species/clades (n = 2–3), thus likely underestimating intraspecific variation for these groups.
Maximum-likelihood estimates of cyt-b gene trees and concatenated gene trees were made using the program RAxML-HPC v.8 (Stamatakis, 2014) on the CIPRES portal. We conducted analyses using the rapid bootstrapping algorithm and searched for best-scoring ML tree algorithm under the GTRGAMMA model with 1,000 bootstrap replicates. Bayesian gene-tree analyses used MRBAYES v.3.2.6 (Ronquist et al., 2012) on the CIPRES portal to infer individual gene trees for cyt-b and the six individual nuclear introns in addition to concatenated alignments of (1) cyt-b plus six introns and (2) six introns only. Two replicates were run to ensure proper mixing had occurred. Nucleotide substitution models were unlinked across partitions and then allowed to evolve at individual rates for each locus in the concatenated alignment. Four Markov chains with default heating values were conducted for 1 × 10⁷ generations and sampled every 1,000th generation. Stationarity was assessed using TRACER v.1.6 (Rambaut et al., 2014). The first 2,500 samples were discarded as burn-in and the remaining 15,000 samples comprised the posterior probability (PP) distributions. Majority rule consensus trees were generated for each analysis.
Results obtained from gene-tree analyses were used to define populations to be used as “species” (as in Demos et al., 2014, 2016) in a coalescent-based species-tree approach implemented in StarBEAST2 (Ogilvie et al., 2017), an extension of BEAST v.2.4.8 (Drummond et al., 2012; Bouckaert et al., 2014). Species-tree analysis was carried out using the six phased nuclear intron alignments and the cyt-b alignment. The substitution, clock, and tree models were unlinked across all loci. The random local clock model was applied to each locus using a Yule tree prior and a constant root population size model. Four replicate analyses were conducted with random starting seeds and chain lengths of 5 × 10⁷ generations, with parameters sampled every 5,000 steps. For the StarBEAST2 analyses, convergence of model parameters was assessed based on ESS values > 200 and examination of trace files in Tracer v.1.7. The initial 20% of each run was discarded as burn-in, and separate runs were assembled using LOGCOMBINER v.2.4.7 and TREEANNOTATOR v.2.4.7 (Drummond et al., 2012).
Lineage Delimitation
Two different Bayesian coalescent species-tree approaches were used as tests of putative species boundaries. We carried out delimitation analyses using the most recent version of Bayesian Phylogenetics and Phylogeography (BPP v.3.3; Yang and Rannala, 2014; Yang, 2015) and implementation of the SpeciesDelimitationAnalyser tool in the “Species Tree And Classification Estimation, Yarely” (STACEY) extension of BEAST 2 (Jones, 2017). These two methods use a multispecies coalescent model to evaluate support for alternative hypotheses of species delimitation and species tree phylogeny in a Bayesian framework, while accounting for incomplete lineage sorting and gene-tree/species-tree conflict. Our motivation in carrying out these tests is to orient future investigations of the preliminary limits inferred here, using an integrative species delimitation approach that includes linear and geometric morphometrics, vocalizations, ectoparasitic assemblages, and distributional data.
We conducted joint independent lineage delimitation and species-tree estimation using the program BPP v.3.3 (Yang and Rannala, 2014; Yang, 2015). BPP analyses were carried on the populations obtained from the gene-tree analyses that were identical to the lineages used in the species-tree analyses. We designated each population from each gene-tree clade as a putative independent lineage, effectively putting a maximum on the number of lineages that could be delimited. We tested the validity of our assignment of individuals to lineages (potential species) using the guide-tree-free algorithm (A11) in BPP to avoid specifying a guide tree in advance. We ran three replicates each for four different combinations of priors on divergence depth and effective population sizes (τ and θ, respectively; Table 2) as BPP has been shown to be sensitive to effective population size and divergence time priors in determining the probability of delimitation (Leaché and Fujita, 2010; Yang and Rannala, 2010). All BPP analyses were run for 105 generations, with a burn-in of 104 generations and samples drawn every 10th generation. In total, 12 BPP runs were carried out for each of two datasets: combined mitochondrial (cyt-b) and phased nuclear (6 introns) sequence data and the phased nuclear data alone.
We conducted combined species-tree estimation and lineage-delimitation analyses using STACEY in BEAST 2 (Jones, 2017). This method is an extension of the multispecies coalescence model used in *BEAST (Heled and Drummond, 2010) in which a birth-death-collapse model is used for species-tree estimation (Jones et al., 2015). This method maximizes species-tree likelihood over Bayesian tree space by using a Markov chain Monte Carlo (MCMC) model in which terminals on the tree can be merged to minimal clusters in order to estimate a species or minimal cluster (SMC) tree (Jones, 2017). This method does not require assignment of individuals to populations (putative species) or assignment of an a priori guide tree.
Four independent STACEY analyses were run for 5 × 10⁷ generations with parameters sampled every 5 × 10³ steps using two datasets: cyt-b + phased nuclear sequence data and the phased nuclear sequence data alone. Convergence of parameters was assessed in TRACER and the initial 20% of each run was discarded as burn-in. Separate runs were assembled using LOGCOMBINER v.2.4.7 and TREEANNOTATOR v.2.4.7 (Drummond et al., 2012). Cluster analyses were performed using SpeciesDelimitationAnalyser (Jones 2017) for two heights below which nodes were collapsed: 3 × 10⁻⁴ and 3 × 10⁻⁵. Employing a wide range of values for collapse height (10−4-10−7) has been found to produce similar delimitation results (Jones et al., 2015). As values for collapse height are increased to 10−3 and higher, merging of all individuals from multiple species in an analysis will eventually occur so that it will not be possible to detect recent divergences (Jones et al., 2015). We took the conservative course of also testing for clusters using node heights at the upper limits of the range suggested by Jones et al. (2015), in keeping with other recent empirical studies (e.g., Vitecek et al., 2017). Sequence alignments used in this study have been made available on DRYAD (doi: 10.5061/dryad.f3j6f8g). All newly generated sequences were deposited in GenBank with accession numbers MH299498–MH299784; (see also Appendix 1, Supporting Material).
Results
The total number of base pairs (bp) for the alignment of 233 cyt-b sequences used in the ML and BI gene-tree analyses ranged from 534 to 1,140 bp. The number of bp for the 31 sequence alignments used in the individual ML and BI gene trees, Bayesian species trees, and coalescent lineage delimitation methods was: cyt-b, 976–1,140 bp; ABHD11, 438 bp; ACOX2, 373–384 bp; ACPT, 215–233 bp; COPS7A, 571–615 bp; ROGDI, 481–483 bp; STAT5A, 328–387 bp; 6 intron concatenated alignment, 2,480–2,540 bp, and cyt-b + 6 intron concatenated alignment, 3,456–3,669 bp. The best-fit models of nucleotide substitution for each locus estimated by jMODELTEST2 were: 233 sequence cyt-b = HKY + I + G; 31 sequence cyt-b = HKY + G; ABHD11 and STAT5A = HKY, ACOX2 = TrN; ACPT = HKY + I; COPS7A and ROGDI = K80. Uncorrected mitochondrial p-distances for African Scotophilus in the 233 sequence cyt-b alignment ranged from 0.009 to 0.142 between species/delimited clades, whereas intra-specific/within clade distances evident in our sampling scheme ranged from 0.000 to 0.017 (Table 1).
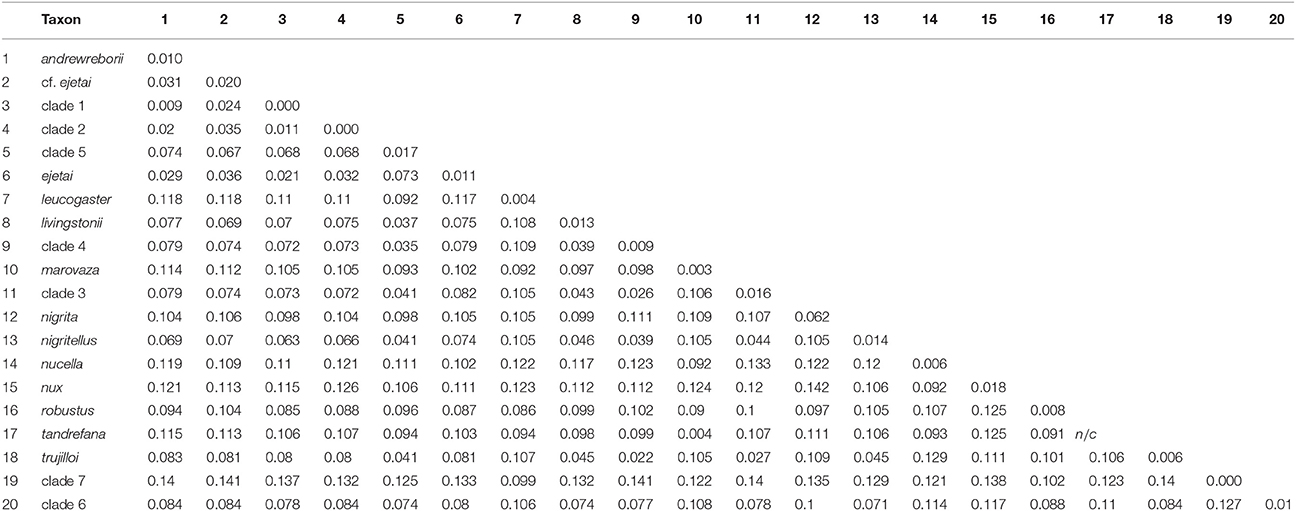
Table 1. Uncorrected cyt-b p-distances among (below diagonal) and within (numbers on diagonal) African Scotophilus clades calculated in MEGA 7.0.26 (Tamura et al., 2013).
Mitochondrial Gene Trees
The Bayesian (BI) and maximum likelihood (ML) phylogenetic estimates recovered very similar topologies; the BI gene tree is shown for the 233 sequence cyt-b alignment of 20 Scotophilus species/clades (Figure 1; individual gene trees for the 31 sequence cyt-b BI and ML analyses are shown in Figure 1, Supplemental Material). In the cyt-b gene tree, all taxa plus numbered clades were strongly supported as monophyletic (i.e., maximum-likelihood bootstrap support [BS] ≥ 70%, Bayesian posterior probability [PP] ≥ 0.95) with the exceptions of S. tandrefana + S. marovaza, two individuals with uncertain relationships to S. andrewreborii and S. ejetai (cf. ejetai in Figure 1), and individuals from Zambia in clades 3 and 5 (cf. clade 3 and cf. clade 5). For continental African Scotophilus, our analysis revealed two major geographic haplogroups: (a) a Kenya + Ethiopia + Yemen-distributed clade that includes S. andrewreborii, clade 1, clade 2, S. cf. ejetai, and S. ejetai; and (b) an Eastern + Southern African distributed clade that includes S. livingstonii, S. trujilloi, and clades 3–6 (Figure 1). Most of the deeper nodes are supported by high posterior probabilities (PP ≥ 0.95) and high bootstrap values (BS ≥ 70%), exceptions being the relationships of the S. leucogaster + S. heathii + clade 7, S. marovaza + S. tandrefana, and S. robustus + clade 6).
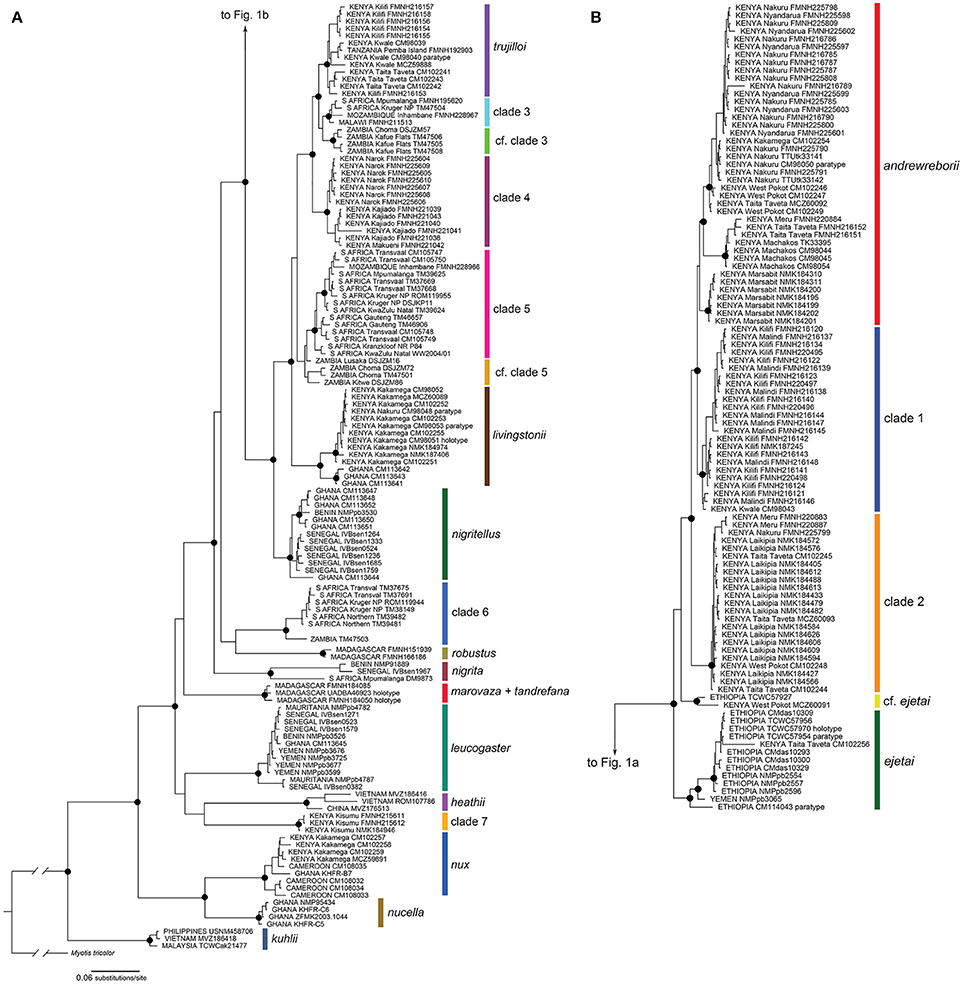
Figure 1. Bayesian phylogeny of mitochondrial cytochrome b sequences of Scotophilus (A) continued on (B). The phylogeny was inferred in MrBayes and its topology was very similar to the maximum likelihood phylogeny calculated in RAxML. Filled circles on nodes denote Bayesian posterior probabilities ≥ 95% and ML bootstrap values ≥ 70%. Support values at nodes for most minor clades not shown. Specimen localities include counties for Kenya and provinces for South Africa. Museum acronyms are defined in Appendix 1, Supplemental Material.
Concatenated Gene Trees
The ML gene tree obtained from the concatenation of the six nuclear genes ABHD11, ACOX2, ACPT, COPS7A, ROGDI, and STAT5A with cyt-b (31 specimens, complete matrix) is shown in Figure 2A. This tree was very similar to the Bayesian tree and most nodes are well supported. However, this tree is not directly comparable to the larger cyt-b gene trees because only 11 of 21 species/clades were included. Nevertheless, topological similarities exist including strong support for the grouping of S. trujilloi + S. livingstonii + clades 3–5 (BS = 100%, PP = 1.0). The Kenyan clade that includes S. andrewreborii + clade 1 + clade 2 is poorly resolved, and S. andrewreborii and clade 1 are paraphyletic. The ML gene tree obtained from the six concatenated nuclear genes only is shown in Figure 2B. This phylogeny is less well supported in comparison to the mitochondrial + nuclear concatenated tree (Figure 2A). Topological similarities include strong support for the monophyly of S. livingstonii, S. trujilloi, S. marovaza, and clade 7. S. andrewreborii, clade 1, and clade 2 cluster together in a well-supported Bayesian inference clade, although ML bootstrap support is < 70%. Clades 3 and 4 are paraphyletic although recovered near individuals of their own respective clades. Paraphyly is not unexpected at these shallow levels of divergence due to potential incomplete lineage sorting and/or recent gene flow (Figures 1A–L, Supplemental Material).
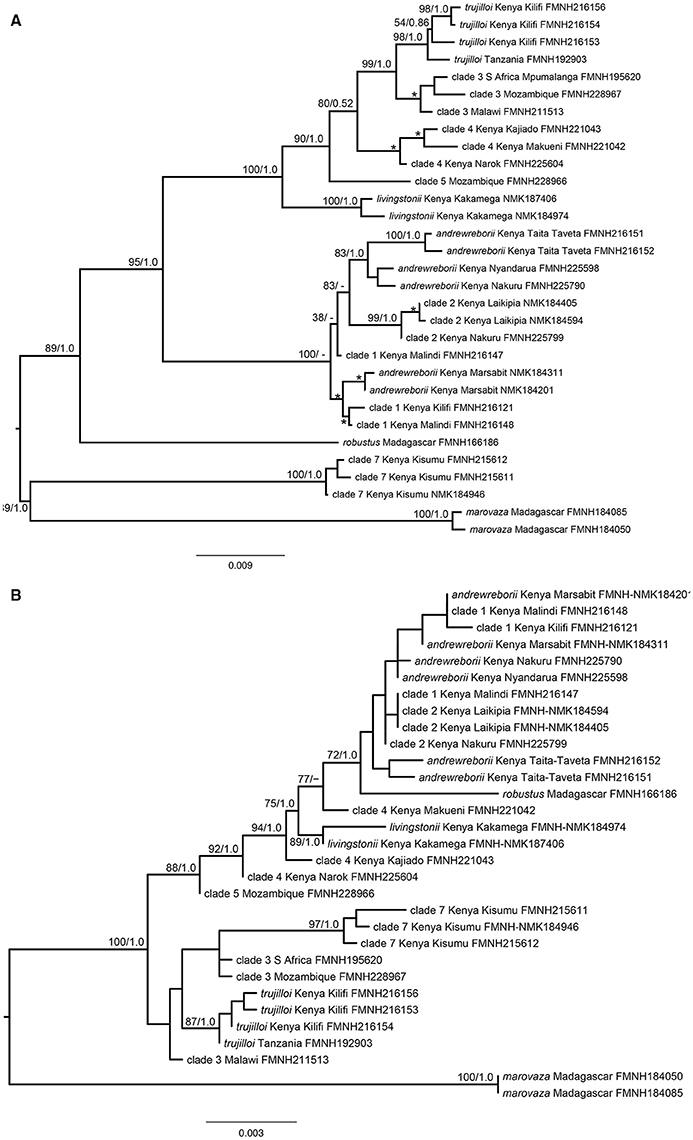
Figure 2. (A) Concatenated maximum likelihood phylogeny of mitochondrial cytochrome b and six nuclear introns of Scotophilus and, (B) Concatenated maximum likelihood phylogeny of six nuclear introns of Scotophilus. Maximum likelihood bootstrap support (BP; left) and Bayesian posterior probability (PP; right) are represented above branches. Minor nodes with BP ≥ 70% and PP ≥ 95% are indicated by *.
Species Trees
All four StarBEAST2 runs for the multilocus coalescent species tree analyses appeared to converge within 2 × 10⁶ generations. We conservatively discarded the first 20% of each run, leaving 8,000 trees in the posterior distributions. ESS values for all parameters exceeded 200 in the species tree analysis. The species tree (Figure 3) is only partly in agreement with the mitochondrial + nuclear concatenated tree (Figure 2A), (a) strongly supporting the sister relationship of S. trujilloi + clade 3; (b) moderately supporting a clade including S. andrewreborii + clade 1 + clade 3; and (c) strongly supporting the East + South African species group that includes all sampled African mainland species/clades as distantly related to clade 7 from western Kenya. Most nodes have low to moderate statistical support.
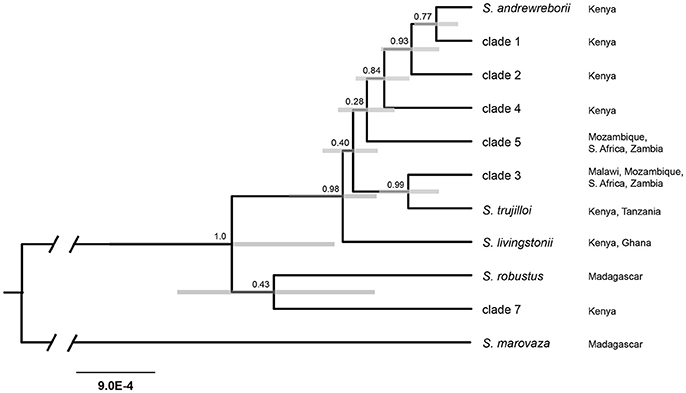
Figure 3. Species tree estimated in StarBEAST2 using the mitochondrial cytochrome b and six nuclear intron dataset. Numbers above nodes indicate posterior probabilities and gray bars represent 95% highest-posterior density interval for node height. Branch lengths indicate substitutions/site. Localities refer to distribution based on available genetic data.
Lineage Delimitation
Results from a series of replicated BPP and STACEY analyses were in agreement using the seven-locus dataset, but differed in probability of lineage delimitation using nuclear genes alone (summarized in Table 3). Prior choice had no effect on delimitation probabilities for the nine clades included in the seven-locus BPP analyses. With a threshold of 0.95 PP, all nine putative clades were delimited under the four Prior Schemes tested (see Table 2 for prior scheme definitions). STACEY analyses of four replicate species-tree runs using the same seven-locus dataset as BPP delimited all nine putative clades under two different collapse-height priors. Results from replicated BPP and STACEY analyses using nuclear genes alone did exhibit an effect of prior choice on probability of lineage delimitation. In the BPP analyses both Prior Schemes 1 and 2 failed to delimit S. andrewreborii (PP < 0.95), while none of the Prior Schemes delimited clades 1 or 2. In the STACEY analyses, choice of collapse height in SpeciesDelimitationAnalyser affected the probability of lineage determination. Using a collapse height of 3 × 10⁻⁴, STACEY failed to delimit S. andrewreborii, clade 1, and clade 2. Distinguishing robustly defined lineages by congruence between both datasets and across all Prior Schemes and STACEY collapse heights, S. andrewreborii, clade1, and clade 2 are united as a single composite entity but the other six clades remain delimited. These delimited clades are candidates to be evaluated later as species under an integrative taxonomy using independent data.

Table 2. Prior Schemes (PS) used in pairwise BPP analyses.
Discussion
Scotophilus Phylogenetic Relationships
The phylogenetic relationships of Scotophilus species inferred here using the mitochondrial dataset resemble those of the only prior analysis with nearly comprehensive taxon sampling of continental African species (Trujillo et al., 2009). Key differences include the addition of numerous Scotophilus samples from Kenya and new mitochondrial sequences from GenBank, including representatives of S. nucella (Vallo et al., 2016). As in the cyt-b phylogenies of Trujillo et al. (2009) and Agnarsson et al. (2011) and the concatenated mitochondrial and nuclear supermatrix phylogenetic estimates of Shi and Rabosky (2015) and Amador et al. (2018), Eurasian S. kuhlii is well supported as sister to all African Scotophilus species and S. nux is well supported as sister to the remaining continental African + Madagascar species (Figure 1). Asian S. heathii is nested deep within African Scotophilus, suggesting multiple colonizations of both continents. Trujillo et al. (2009) recovered individuals identified as S. dinganii in four well supported clades in three deeply diverged sections of their cyt-b tree and individuals identified as S. viridis in two well supported and deeply divergent clades. Based on that topology, Brooks and Bickham (2014) described four new Scotophilus species. The three S. dinganii clades distributed outside South Africa were assigned to S. andrewreborii (Kenya), S. livingstonii (Kenya and Ghana), and S. ejetai (Ethiopia and Yemen). The clade formerly identified as S. viridis from Kenya (Aggundey and Schlitter, 1984; Trujillo et al., 2009) was named S. trujilloi (Brooks and Bickham, 2014). The validity of these four new species deserves scrutiny as they were described without comparisons to type material or possible synonyms and were not accompanied by comparative morphometric analyses. Compounding matters, individuals lacking genetic data were assigned as holotypes for S. andrewreborii and S. trujilloi, a regrettable decision in view of the taxonomic confusion that has resulted from purely morphological appraisals and the frequent coexistence of two or even three Scotophilus species at individual localities.
Our multi-locus concatenated gene-tree and species-tree analyses included only those continental African lineages for which we could assemble all mitochondrial and nuclear loci, complicating comparisons to other phylogenetic studies of Scotophilus. Nonetheless, East African taxa are well represented and their phylogenetic relationships can be compared to the cyt-b phylogeny of Trujillo et al. (2009) and our expanded cyt-b gene tree. A well-supported major clade including S. trujilloi, S. livingstonii, and clades 3–5 is recovered in the concatenated ML and BI phylogenies. This clade is well-supported as sister to S. andrewreborii + clade 1 + clade 2. This topology is also recovered in our cyt-b gene tree analyses and the Bayesian phylogeny of Trujillo et al. (2009), allowing for taxonomic differences in the respective analyses. Comparison between the mitochondrial and concatenated gene trees and the species tree reveal consistent support for a clade comprising S. andrewreborii (Kenya) + clade 1 (Kenya) + clade 2 (Kenya) and S. trujilloi (Kenya and Tanzania) as well-supported sister to clade 3 (Malawi, Mozambique, South Africa, Zambia). In all phylogenetic analyses, clade 7, newly uncovered in western Kenya, is deeply diverged from other Scotophilus taxa and its phylogenetic relationship to other species in the genus is unclear. It is a part of a polytomy in the mitochondrial gene tree that also includes S. leucogaster from Africa and Yemen, and S. heathii from Asia.
Biogeographic Patterns
Several distinct and repeated patterns are apparent in the geographic distribution and phylogenetic relationships among co-distributed Scotophilus lineages. While we refrain from designating the lineages resulting from coalescent delimitation analyses as “species,” these analyses strongly support several distinct clades whose distribution appears limited to Kenya and northern Tanzania. The lineages labeled Scotophilus andrewreborii + clade 1 + clade 2, S. trujilloi, clade 4, and clade 7 each represent potentially valid species, each deserving integrative taxonomic assessment. The high species richness of this region can be attributed both to its equatorial location as well as to the geography of African biomes. The biotas of the Horn of Africa, the Eastern and Southern savannas of Africa, and the West and Central African rainforests all converge in this region (Patterson and Webala, 2012; Happold and Lock, 2013). Biome-scale geographic replacements evident in our mitochondrial phylogeny include several African biome paired relationships. East African replacement of Southern African elements include (1) S. trujilloi (Kenyan coast) sister to clade 3 (Southern Africa), (2) these two groups in a sister relationship with clade 4 (savanna Kenya), and (3) S. trujilloi + clade 3 + clade 4 as sister to clade 5. East African replacements of Western and Central African forms are evident in the strongly supported genetic structure within S. nux and S. livingstonii, both with divergent populations in Eastern Africa (Kenya) and West African Guineo-Congolian forests.
Few African bat genera in this region have well documented phylogeographic patterns. However, geographic species replacement across Kenya is apparent in the free-tailed bat genus Otomops, where the recently described O. harrisoni from Kenya, Ethiopia, Djibouti, and Yemen (Ralph et al., 2015) replaces O. martiensseni from Western, Central, and Southern Africa across a broad region of Kenya and northern Tanzania (Patterson et al., 2018). Other species pairs that exhibit replacement across the East African suture zone between Southern Africa and the Horn of Africa include Somali and Common ostrich (Struthio molybdophanes and S. camelus), Reticulated and Maasai giraffe (Giraffa reticulata and G. tippelskirchi), Beisa and Fringe-eared oryx (Oryx beisa and O. callotis), and Guenther's and Kirk's dikdiks (Madoqua güentheri and M. kirkii). Whether these patterns of divergence are driven by Plio-Pleistocene climatic fluctuations and concomitant forest expansion and isolation, or through the process of divergence with gene flow across environmental gradients is unknown to date, although these are reasonable hypotheses to be tested (cf. Tolley et al., 2011; Demos et al., 2014, 2015).
Lineage Delimitation and Taxonomic Reappraisal
Improved sampling from East Africa and multilocus molecular analyses indicate that Scotophilus species diversity in sub-Saharan Africa remains underestimated, despite a recent flurry of taxonomic descriptions. In the most recent world checklist, Simmons (2005) listed six continental African species of Scotophilus. Subsequent indications of undescribed cryptic Scotophilus lineages (Jacobs et al., 2006; Vallo et al., 2011, 2013, 2015) and the recent description of four new Scotophilus from Kenya and Ethiopia (Brooks and Bickham, 2014) indicate that as many as 13 species of Scotophilus may be present in continental Africa (Figure 1; Burgin et al., 2018). However, our study, based on additional sampling in East Africa, indicates up to 15 species may be present. Using multi-species coalescent delimitation analyses in BPP and STACEY, we delimited two additional undescribed lineages from Kenya, clades 4 and 7, which appear to be undescribed species (Table 3, Figure 3). Field sampling in a single country allowed us to document clades 1-2, clade 4, clade 7, S. andrewreborii, S. trujilloi, and S. livingstonii.
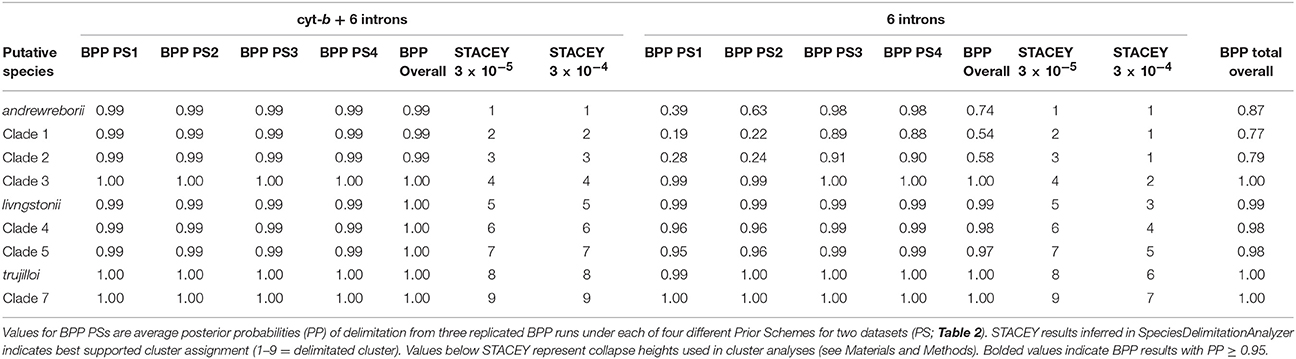
Table 3. Summary of BPP and STACEY results for two datasets: cyt-b + 6 introns and 6 introns.
BPP and STACEY analyses consistently delimited 6 of the 9 tested clades/species across replicates, prior schemes and parameters, and molecular datasets; the notable exception was the S. andrewreborii + clade 1 + clade 2 cluster (Table 3). These three clades were strongly supported as sisters in the cyt-b gene tree (Figure 1) and moderately supported as sisters in the species tree (Figure 3). However, S. andrewreborii and clade 1 were not supported as monophyletic in the concatenated gene tree (Figures 2A,B). BPP and STACEY analyses do not support these lineages as genetically isolated. Average pairwise cyt-b genetic distances were low between these three lineages (p-distance = 0.9–2.0%), and incomplete lineage sorting is evident in individual intron gene trees (Figure 1, Supplemental Material). S. andrewreborii and clade 2 co-occur in 4 of 9 Kenyan counties sampled (Appendix 1, Supplemental Material), and the two were found together at Bwatherongi Campground in Meru National Park and at Monkey Bridge Campsite and Serena Elementaita Lodge, both on the Soysambu Conservancy (Nakuru County). Both putative species are well supported as monophyletic in the cyt-b gene tree and are 2% cyt-b distant, suggesting either recent range expansion of allopatric populations or potential incipient speciation. Clade 1 is not known to overlap in Kenya with either S. andrewreborii or clade 2. Additional geographic sampling should be used to test isolation by distance as an explanation for differences between members of this clade.
With respect to the taxonomy of African Scotophilus, results from multi-locus, multi-species coalescent delimitation methods suggest that separately evolving lineages are present in clade 3 (Malawi, Mozambique, South Africa, Zambia), clade 4 (Kenya), clade 5 (Mozambique, South Africa, Zambia), and clade 7 (Kenya). Scotophilus andrewreborii, S. livingstonii, and S. trujilloi were all named using incomplete morphological comparisons and inadequate diagnoses, but are supported as potential species. Valid names for these lineages must await morphological diagnoses and comparisons with senior names now considered synonyms, including Nycticejus murino-flavus Heuglin, 1861 (from Eritrea), Nycticejus flavigaster Heuglin, 1861 (from Eritrea), Scotophilus nigrita colias Thomas, 1904 (from Kenya), and Scotophilus altilis G.M. Allen, 1914 (from Sudan). Despite some disagreement among datasets and models, our results offer evidence that continental African Scotophilus comprise at least 15 genetically divergent populations, with large parts of the continent grossly undersampled. South Africa and Kenya represent the only sizeable African regions well sampled for Scotophilus, so that additional regions must be surveyed to complete taxonomic revisions for the S. dinganii, S. viridis, and S. leucogaster complexes.
Debate continues over the value of probabilistic models in coalescent-based species delimitation. Some contend that they provide an objective test of alternative hypotheses of evolutionary independence (sensu Fujita et al., 2012 and references therein), while others argue that they diagnose population genetic structure rather than species limits (Sukumaran and Knowles, 2017). These discussions serve as a caution that the results from delimitation models should be considered hypotheses to be tested with independent data using an integrative taxonomic approach.
Conclusions
In this study, we examined the diversity of African yellow house bats, Scotophilus, using coalescent and phylogenetic analyses of one mitochondrial and six nuclear genes. Maximum likelihood and Bayesian inference methods confirmed and extended existing phylogenetic relationships, including support for two newly discovered evolutionarily isolated lineages whose distributions at present are only known from Kenya. Multi-species, multi-locus coalescent delimitation methods offered strong support for three recently described species. Taxonomic confusion surrounding the names S. dinganii and S. viridis was addressed by assigning individuals from these polyphyletic species complexes to unnamed clades in our analyses. Integrative taxonomic assessment utilizing phenotypic, distributional, and ecological data is needed to corroborate or falsify Bayesian “species” delimitation results that distinguish up to 15 potential Scotophilus species in Africa, 10 of them occurring in Kenya. We suspect that intensive surveys of understudied regions of Africa may reveal more undescribed Scotophilus diversity. Finally, although phylogenetic analysis of the genus was not the goal of this study, it is clear that despite incorporating seven independent loci, phylogenetic relationships among the subset of African species included here in species tree analyses remain unresolved and almost certainly indicate multiple dispersal to or invasions from Asia. Better understanding of relationships within the genus would benefit from studies of phylogenomic markers.
Author Contributions
TD and BP conceived the ideas for this study. BP, PW, and MB conducted the fieldwork. TD conducted the laboratory work. TD and BP led the writing of the manuscript, with assistance from PW and MB.
Funding
Our field work was supported by the JRS Biodiversity Foundation through a project entitled Bats of Kenya: distribution, status, ecology, and public health as well as by the Africa Council and the Barbara E. Brown Fund for Mammal Research of Field Museum. The support and assistance of Orlin and Onnolee Trapp were essential to our training programs in both Kenya and Chicago. The funders had no role in study design, data collection and analysis, decision to publish, or preparation of the manuscript.
Conflict of Interest Statement
The authors declare that the research was conducted in the absence of any commercial or financial relationships that could be construed as a potential conflict of interest.
The reviewer MF and handling Editor declared their shared affiliation.
Acknowledgments
We gratefully acknowledge the support and facilitation of the National Museums of Kenya, particularly Directors-General Idle Farah and Mzalendo Kibunjia, as well as Ruth Makena, Richard Yego, Bernard Agwanda, Aziza Zuhura, and Simon Musila of Mammalogy. We are grateful for the assistance of Beryl Makori of Karatina University, and Carl Dick and Jake Fose of Western Kentucky University. We are also grateful for the logistical support of the Kenya Wildlife Service, especially Samuel Kasiki, Robert Mwasya, and Isaac Mugo, as well as the Kenya Forest Service, courtesy of D. K. Mbugua and James Mwangómbe. Steve Goodman permitted us to sequence four Scotophilus specimens that he collected, and Adam Ferguson and John Phelps helped to coordinate the acquisition of new samples. New genetic data were generated in the FMNH Pritzker Laboratory, managed by Kevin Feldheim. Three reviewers offered useful suggestions for improving the manuscript.
Supplementary Material
The Supplementary Material for this article can be found online at: https://www.frontiersin.org/articles/10.3389/fevo.2018.00086/full#supplementary-material
References
Aggundey, I. R., and Schlitter, D. A. (1984). Annotated checklist of the mammals of Kenya. I. Chiroptera. Ann. Carnegie Museum 53, 119–161.
Agnarsson, I., Zambrana-Torrelio, C. M., Flores-Saldana, N. P., and May-Collado, L. J. (2011). A time-calibrated species-level phylogeny of bats (Chiroptera, Mammalia). PLoS Curr. 3:RRN1212. doi: 10.1371/currents.RRN1212
Amador, L. I., Arévalo, R. L. M., Almeida, F. C., Catalano, S. A., and Giannini, N. P. (2018). Bat systematics in the light of unconstrained analyses of a comprehensive molecular supermatrix. J. Mammal. Evol. 25, 37–70. doi: 10.1007/s10914-016-9363-8
Bickham, J. W., Patton, J. C., Schlitter, D. A., Rautenbach, I. L., and Honeycutt, R. L. (2004). Molecular phylogenetics, karyotypic diversity, and partition of the genus Myotis (Chiroptera: Vespertilionidae). Mol. Phylogenet. Evol. 33, 333–338. doi: 10.1016/j.ympev.2004.06.012
Bickham, J. W., Wood, C. C., and Patton, J. C. (1995). Biogeographic implications of cytochrome b sequences and allozymes in sockeye (Oncorhynchus nerka). J. Heredity 86, 140–144. doi: 10.1093/oxfordjournals.jhered.a111544
Bouckaert, R., Heled, J., Kühnert, D., Vaughan, T., Wu, C. H., Xie, D., et al. (2014). BEAST 2: a software platform for Bayesian evolutionary analysis. PLoS Comput. Biol. 10:e1003537 doi: 10.1371/journal.pcbi.1003537
Brooks, D. M., and Bickham, J. W. (2014). New species of Scotophilus (Chiroptera: Vespertilionidae) from Sub-Saharan Africa. Occas. Papers Mus. Tex. Tech Univ. 326, 1–21.
Burgin, C. J., Colella, J. P., Kahn, P. L., and Upham, N. S. (2018). How many species of mammals are there? J. Mammal. 99, 1–14. doi: 10.1093/jmammal/gyx147
Darriba, D., Taboada, G. L., Doallo, R., and Posada, D. (2012). JModelTest 2: more models, new heuristics and parallel computing. Nat. Methods 9:772. doi: 10.1038/nmeth.2109
Demos, T. C., Achmadi, A. S., Giarla, T. C., Handika, H., and Maharadatunkamsi Rowe, K. C. (2016). Local endemism and within-island diversification of shrews illustrate the importance of speciation in building Sundaland mammal diversity. Mol. Ecol. 25, 5158–5173. doi: 10.1111/mec.13820
Demos, T. C., Kerbis Peterhans, J. C., Agwanda, B., and Hickerson, M. J. (2014). Uncovering cryptic diversity and refugial persistence among small mammal lineages across the Eastern Afromontane biodiversity hotspot. Mol. Phylogenet. Evol. 71, 41–54. doi: 10.1016/j.ympev.2013.10.014
Demos, T. C., Kerbis Peterhans, J. C., Joseph, T. A., Robinson, J. D., and Hickerson, M. J. (2015). Comparative population genomics of African montane forest mammals support population persistence across a climatic gradient and Quaternary climatic cycles. PLoS ONE 10:e0131800. doi: 10.1371/journal.pone.0131800
Dool, S. E., Puechmaille, S. J., Foley, N. M., Allegrini, B., Bastian, A., Mutumi, G. L., et al. (2016). Nuclear introns outperform mitochondrial DNA in inter-specific phylogenetic reconstruction: lessons from horseshoe bats (Rhinolophidae: Chiroptera). Mol. Phylogenet. Evol. 97, 196–212. doi: 10.1016/j.ympev.2016.01.003
Drummond, A. J., Suchard, M. A., Xie, D., and Rambaut, A. (2012). Bayesian phylogenetics with BEAUti and the BEAST 1.7. Mol. Biol. Evol. 29, 1969–19673. doi: 10.1093/molbev/mss075
Edgar, R. C. (2004). MUSCLE: multiple sequence alignment with high accuracy and high throughput. Nucleic Acids Res. 32, 1792–1797. doi: 10.1093/nar/gkh340
Eick, G. N., Jacobs, D. S., and Matthee, C. A. (2005). A nuclear DNA phylogenetic perspective on the evolution of echolocation and historical biogeography of extant bats (Chiroptera). Mol. Biol. Evol. 22, 1869–1886. doi: 10.1093/molbev/msi180
Fišer, C., Robinson, C. T., and Malard, F. (2018). Cryptic species as a window into the paradigm shift of the species concept. Mol. Ecol. 00, 27, 613–635. doi: 10.1111/mec.14486
Flot, J. F. (2010). SEQPHASE: a web tool for interconverting phase input/output files and fasta sequence alignments. Mol. Ecol. Resour. 10, 162–166. doi: 10.1111/j.1755-0998.2009.02732.x
Fujita, M. K., Leaché, A. D., Burbrink, F. T., McGuire, J. A., and Moritz, C. (2012). Coalescent-based species delimitation in an integrative taxonomy. Trends Ecol. Evol. 27, 480–488. doi: 10.1016/j.tree.2012.04.012
Garrick, R. C., Sunnucks, P., and Dyer, R. J. (2010). Nuclear gene phylogeography using PHASE: dealing with unresolved genotypes, lost alleles, and systematic bias in parameter estimation. BMC Evol. Biol. 10:118. doi: 10.1186/1471-2148-10-118
Gascon, C., Brooks, T. M., Contreras-MacBeath, T., Heard, N., Konstant, W., Lamoreux, J., et al. (2015). The importance and benefits of species. Curr. Biol. 25, 431–438. doi: 10.1016/j.cub.2015.03.041
Happold, D., and Lock, J. M. (2013). “The biotic zones of Africa,” in Mammals of Africa Volume 1. Introductory chapters and Afrotheria, eds J. Kingdon, D. Happold, T. Butynski, M. Hoffmann, M. Happold, and J. Kalina (London: Bloomsbury), 57–74.
Hayman, R. W., and Hill, J. E. (1971). “Part 2. Order Chiroptera,” in The Mammals of Africa: An Identification Manual, eds J. Meester and H.W. Setzer (Washington, DC: Smithsonian Institution Press), 1–73.
Heled, J., and Drummond, A. J. (2010). Bayesian inference of species trees from multilocus data. Mol. Biol. Evol. 27, 570–580. doi: 10.1093/molbev/msp274
Hortal, J., de Bello, F., Diniz-Filho, J. A. F., Lewinsohn, T. F., Lobo, J. M., and Ladle, R. J. (2015). Seven shortfalls that beset large-scale knowledge on biodiversity. Annu. Rev. Ecol. Evol. Syst. 46, 523–549. doi: 10.1146/annurev-ecolsys-112414-054400
Hudson, R. R., and Coyne, J. A. (2002). Mathematical consequences of the genealogical species concept. Evolution 56, 1557–1565. doi: 10.1111/j.0014-3820.2002.tb01467.x
Hughes, D. F., Tolley, K. A., Behangana, M., Lukwago, W., Menegon, M., Maximilian Dehling, J., et al. (2017). Cryptic diversity in Rhampholeon boulengeri (Sauria: Chamaeleonidae), a pygmy chameleon from the Albertine Rift biodiversity hotspot. Mol. Phylogenet. Evol. 122, 125–141. doi: 10.1016/j.ympev.2017.11.015
Jacobs, D. S., Eick, G. N., Schoeman, M. C., and Mathee, C. A. (2006). Cryptic species in an insectivorous bat, Scotophilus dinganii. J. Mammal. 87, 161–170. doi: 10.1644/04-MAMM-A-132R2.1
Jones, G. (2017). Algorithmic improvements to species delimitation and phylogeny estimation under the multispecies coalescent. J. Math. Biol. 74, 447–467. doi: 10.1007/s00285-016-1034-0
Jones, G., Aydin, Z., and Oxelman, B. (2015). DISSECT: an assignment-free Bayesian discovery method for species delimitation under the multispecies coalescent. Bioinformatics 31, 991–998. doi: 10.1093/bioinformatics/btu770
Kumar, S., Stecher, G., and Tamura, K. (2016). MEGA7: molecular evolutionary genetics analysis version 7.0 for bigger datasets. Mol. Biol. Evol. 33, 1870–1874. doi: 10.1093/molbev/msw054
Leaché, A. D., and Fujita, M. K. (2010). Bayesian species delimitation in West African forest geckos (Hemidactylus fasciatus). Proc. R. Soc. B Biol. Sci. 277, 3071–3077. doi: 10.1098/rspb.2010.0662
Loreau, M., Naeem, S., Inchausti, P., Bengtsson, J., Grime, J. P., Hector, A., et al. (2001). Biodiversity and ecosystem functioning: current knowledge and future challenges. Science 294, 804–808. doi: 10.1126/science.1064088
Miller, M. A., Pfeiffer, W., and Schwartz, T. (2010). “Creating the CIPRES science gateway for inference of large phylogenetic trees,” in Gateway Computing Environments Workshop (GCE) (New Orleans, LA: IEEE).
Mittermeier, R. A., Turner, W. A., Larsen, F. W., Brooks, T. M., and Gascon, C. (2011). “Global biodiversity conservation: the critical role of hotspots,” in Biodiversity Hotspots: Distribution and Protection of Conservation Priority Areas, eds F. E. Zachos, and J. C. Habel (Berlin: Springer-Verlag), 3–22.
Ogilvie, H. A., Bouckaert, R. R., and Drummond, A. J. (2017). StarBEAST2 brings faster species tree inference and accurate estimates of substitution rates. Mol. Biol. Evol. 34, 2101–2114. doi: 10.1093/molbev/msx126
Patterson, B. D., and Webala, P. W. (2012). Keys to the bats (Mammalia: Chiroptera) of East Africa. Fieldiana Life Earth Sci. 6, 1–63. doi: 10.3158/2158-5520-12.6.1
Patterson, B. D., Webala, P. W., Bartonjo, M., Nziza, J., Dick, C. W., and Demos, T. C. (2018). On the taxonomic status and distribution of African species of Otomops (Chiroptera: Molossidae). PeerJ 6:e4864 doi: 10.7717/peerj.4864
Ralph, T. M. C., Richards, L. R., Taylor, P. J., Napier, M. C., and Lamb, J. M. (2015). Revision of Afro-Malagasy Otomops (Chiroptera: Molossidae) with the description of a new Afro-Arabian species. Zootaxa 4057, 1–49. doi: 10.11646/zootaxa.4057.1.1
Rambaut, A., Suchard, M. A., Xie, D., and Drummond, A. J. (2014). Tracer v1.6. Available online at: http://beast.bio.ed.ac.uk/Tracer
Robbins, C. B., De Vree, F., and Van Cakenberghe, V. (1985). A systematic revision of the African bat genus Scotophilus (Vespertilionidae). Ann. Musée R. Afr. Cent. Sci. Zool. 246, 53–84.
Ronquist, F., Teslenko, M., van der Mark, P., Ayres, D. L., Darling, A., Hohna, S., et al. (2012). MrBayes 3.2: efficient bayesian phylogenetic inference and model choice across a large model space. Syst. Biol. 61, 539–542. doi: 10.1093/sysbio/sys029
Salicini, I., Ibáñez, C., and Juste, J. (2011). Multilocus phylogeny and species delimitation within the Natterer's bat species complex in the Western Palearctic. Mol. Phylogenet. Evol. 61, 888–898. doi: 10.1016/j.ympev.2011.08.010
Shi, J. J., and Rabosky, D. L. (2015). Speciation dynamics during the global radiation of extant bats. Evolution 69, 1528–1545. doi: 10.1111/evo.12681
Sikes, R. S. (2016). Guidelines of the American society of mammalogists for the use of wild mammals in research and education. J. Mammal. 97, 663–688. doi: 10.1093/jmammal/gyw078
Simmons, N. (2005). “Order Chiroptera,” in Mammal Species of the World: A Taxonomic and Geographic Reference, 3rd Edn., eds D. E. Wilson and D. M. Reeder (Baltimore, MD: The Johns Hopkins University Press), 312–529.
Stamatakis, A. (2014). RAxML version 8: a tool for phylogenetic analysis and post-analysis of large phylogenies. Bioinformatics 30, 1312–1313. doi: 10.1093/bioinformatics/btu033
Stephens, M., Smith, N. J., and Donnelly, P. (2001). A new statistical method for haplotype reconstruction from population data. Am. J. Hum. Genet. 68, 978–989. doi: 10.1086/319501
Sukumaran, J., and Knowles, L. L. (2017). Multispecies coalescent delimits structure, not species. Proc. Natl. Acad. Sci. U.S.A. 114, 1607–1612. doi: 10.1073/pnas.1607921114
Tamura, K., Stecher, G., Peterson, D., Filipski, A., and Kumar, S. (2013). MEGA6: molecular evolutionary genetics analysis Version 6.0. Mol. Biol. Evol. 30, 2725–2729. doi: 10.1093/molbev/mst197
Tolley, K. A., Tilbury, C. R., Measey, G. J., Menegon, M., Branch, W. R., and Matthee, C. A. (2011). Ancient forest fragmentation or recent radiation? Testing refugial speciation models in chameleons within an African biodiversity hotspot. J. Biogeogr. 38, 1748–1760. doi: 10.1111/j.1365-2699.2011.02529.x
Trujillo, R. G., Patton, J. C., Schlitter, D. A., and Bickham, J. W. (2009). Molecular phylogenetics of the bat genus Scotophilus (Chiroptera: Vespertilionidae): perspectives from paternally and maternally inherited genomes. J. Mammal. 90, 548–560. doi: 10.1644/08-MAMM-A-239R2.1
Vallo, P., Benda, P., Cervený, J., and Koubek, P. (2013). Conflicting mitochondrial and nuclear paraphyly in small-sized West African house bats (Vespertilionidae). Zool. Scr. 42, 1–12. doi: 10.1111/j.1463-6409.2012.00563.x
Vallo, P., Benda, P., Červený, J., and Koubek, P. (2015). Phylogenetic position of the giant house bat Scotophilus nigrita (Chiroptera, Vespertilionidae). Mammalia 79, 225–231. doi: 10.1515/mammalia-2013-0137
Vallo, P., Benda, P., and Reiter, A. (2011). Yellow-bellied or white-bellied? Identity of Arabian house bats (Vespertilionidae: Scotophilus) revealed from mitochondrial DNA and morphology. Afr. Zool. 46, 350–361. doi: 10.3377/004.046.0214
Vallo, P., Nkrumah, E. E., Tehoda, P., Benda, P., Badu, E. K., and Decher, J. (2016). Nutlet is a little nut: disclosure of the phylogenetic position of Robbins' house bat Scotophilus nucella (Vespertilionidae). Folia Zool. Brno. 65, 302–309. doi: 10.25225/fozo.v65.i4.a2.2016
Vallo, P., and Van Cakenberghe, V. (2017). Advances in taxonomy of African house bats (Scotophilus, Vespertilionidae). Afr. Bat Conserv. News 46, 1–6.
Vitecek, S., Kučinic, M., Previšic, A., Zivic, I., Stojanovic, K., Keresztes, L., et al. (2017). Integrative taxonomy by molecular species delimitation: multi-locus data corroborate a new species of Balkan Drusinae micro-endemics. BMC Evol. Biol. 17:129. doi: 10.1186/s12862-017-0972-5
Wiens, J. J. (2017). What explains patterns of biodiversity across the tree of life? Bioessays 39, 1–10. doi: 10.1002/bies.201600128
Yang, Z. (2015). The BPP program for species tree estimation and species delimitation. Curr. Zool. 61, 854–865. doi: 10.1093/czoolo/61.5.854
Yang, Z., and Rannala, B. (2010). Bayesian species delimitation using multilocus sequence data. Proc. Natl. Acad. Sci. U.S.A. 107, 9264–9269. doi: 10.1073/pnas.0913022107
Keywords: Chiroptera, cryptic diversity, East Africa, Kenya, phylogeny, species complex, species tree, taxonomy
Citation: Demos TC, Webala PW, Bartonjo M and Patterson BD (2018) Hidden Diversity of African Yellow House Bats (Vespertilionidae, Scotophilus): Insights From Multilocus Phylogenetics and Lineage Delimitation. Front. Ecol. Evol. 6:86. doi: 10.3389/fevo.2018.00086
Received: 12 March 2018; Accepted: 31 May 2018;
Published: 12 July 2018.
Edited by:
Enrique P. Lessa, University of the Republic, UruguayReviewed by:
Jason Malaney, Austin Peay State University, United StatesManuel Ruedi, Natural History Museum of Geneva, Switzerland
Matias Feijoo, University of the Republic, Uruguay
Copyright © 2018 Demos, Webala, Bartonjo and Patterson. This is an open-access article distributed under the terms of the Creative Commons Attribution License (CC BY). The use, distribution or reproduction in other forums is permitted, provided the original author(s) and the copyright owner(s) are credited and that the original publication in this journal is cited, in accordance with accepted academic practice. No use, distribution or reproduction is permitted which does not comply with these terms.
*Correspondence: Terrence C. Demos, tdemos@fieldmuseum.org