Environmental regulation effects from the perspective on the industrial chain: evidence from energy enterprises in China
 Su Zhang1
  Xin Huang
- 1College of Business Administration, Zhejiang Institute of Economics and Trade, Hangzhou, China
- 2School of Economics, Zhejiang University of Finance and Economics, Hangzhou, China
- 3School of Management Engineering and E-commerce, Zhejiang Gongshang University, Hangzhou, China
More attention has been paid to environmental regulation of greenhouse gas emissions in the energy industry under the transformation of industrial structure. This paper takes microdata of Chinese energy enterprises from 1998 to 2012 as a sample to build a duty-sharing model, analyzes the effect of environmental regulations on the industrial chain, and explains the “double growth” phenomenon that occurred in China, which is nothing short of miraculous in terms of the environment and economy. In the industrial chain, the environmental obligations and responsibilities will be shared between upstream and downstream enterprises due to trade linkages. This paper finds that environmental responsibilities will move forward through the industrial chain when environmental regulations are strengthened. Downstream companies will loosen “relative” control constraints, thereby expanding output but increasing demand for upstream products. Different from the existing research, we claim that, since environmental regulation has a differential effect on the industrial chain, it will promote the growth of output in the entire chain, in contrast to the theory of “cost compliance”, which claims that environmental regulation will inevitably lead to the output. Based on this research, this paper puts forward some suggestions and insights on how the government implements environmental regulations.
1 Introduction
In the early stages of reform and opening up, China’s rapid economic growth was characterized by a extensive development model marked by high energy consumption, high pollution, and low efficiency. As China’s economic growth model transitions from rapid growth to high-quality development, the country has been actively embracing the concept of sustainable development of natural resources, encapsulated in the phrase “clear waters and green mountains are as valuable as mountains of gold and silver.” The negative externalities of environmental pollution and the scarcity of natural endowments have led to societal demand for government environmental regulation. Because enterprises focus too much on private costs and ignore social costs, the production process generates huge negative environmental externalities and causes the market mechanism to fail. Environmental regulation, as an effective public policy and instrument of the government, imposes effective external constraints on enterprises and endogenizes social costs, thus realizing the use of the “visible” hand of the government to correct the effective operation of the market mechanism. To this end, China has enacted and promulgated a large number of laws, regulations, and norms to thoroughly improve the ecological environment and eliminate the serious problems caused by pollution, forming a comprehensive system of environmental regulation policies. “Environmental protection inspectors” have demonstrated China’s determination and confidence in tackling environmental pollution problems (Liu et al., 2022a; Li et al., 2022; Liu and Sun, 2023). The study of the effects of environmental regulation has not only been widely debated in the theoretical community but has also become a focus of attention for the government and practitioners.
Regarding the effects of environmental regulation, academic circles are mainly concentrated on cost effects (Posner and Landes, 1985; Hazilla and Kopp, 1990; Jaffe and Palmer, 1997; Brännlund et al., 1998; Pickman, 1998; Ederington and Minier, 2003; Gray and Shadbegian, 2003). In addition, according to the innovation compensation effect (Porter and Linde, 1995; Hamamoto, 2006; Ashford and Hall, 2011; Kneller and Manderson, 2012; Ford et al., 2014), the “cost follow” and “innovation compensation” are then derived. Specifically, the “cost follow” theory holds that after the internalization of social costs, enterprises cannot digest the burden through production or operation, which in turn causes output and competitiveness to decline. The theory of “innovation compensation” holds that after facing the external impact of the policy, firms can effectively adjust production and operation strategies and then form a loss of effects caused by long-term efficiency improvements and the increase in compensation costs. However, from the perspective of the development of the industry, the industrial sector with the most concentrated environmental regulations has no sign of the so-called output attenuation in the theory of “cost follow”. According to the statistics of the China National Bureau of Statistics in 2020, the profit of industrial enterprises above a designated size was 6451.6 billion yuan, an increase of 4.1% compared with the previous year; and the manufacturing industry achieved a profit of 5579.5 billion yuan, an increase of 7.6%. Environmental regulation had the greatest effect on the energy raw materials and energy products industries, nonmetallic mineral products industries, and black metal smelting and pressure-proclaiming industries, with increases of 3.4%, 2.8%, and 6.7%, respectively. Of the 596 major industrial product statistics, 376 were achieved year-on-year, with a growth surface of 63.1%. From the perspective of environmental regulation, energy conservation, and emission reduction will improve environmental quality and improve overall industrial output (Jin et al., 2016; Chen and Xu, 2021; Wu and Gao, 2021; Chen et al., 2022) but do not form the technical effect proposed by the theory of “innovation compensation" (Dou and Han, 2019; Tian et al., 2021; Wang et al., 2023). It can be seen that the “cost follow” theory and “innovation compensation” doctrine cannot explain the phenomenon of “dual growth” of China’s environment and economy.
Following the proposal of China’s “dual carbon” targets, research related to environmental regulation has been enriched. Many scholars have pointed out that command-and-control environmental regulatory policies, such as the “Two Control Zones,” tend to lead to campaign-style emission reduction activities, such as shutdowns and production halts (Cai et al., 2016). In contrast, market-incentive environmental regulatory policies, such as the pollution rights trading system, carbon emission trading system, and energy use rights trading system, can promote energy conservation, emission reduction, and pollution control through clear property rights delineation (Chen and Lin, 2021; Che and Wang, 2022; Huang et al., 2022). Additionally, public participation environmental regulatory policies, such as the disclosure of environmental information, can effectively complement the top-down government regulation and bottom-up public supervision in the environmental protection domain (Chu et al., 2022).
Therefore, based on the perspective of the industrial chain, this paper analyzes the difference in the policy effect of environmental regulation upstream and downstream of the industrial chain by taking the environmental protection of the energy industry in 2006 as the research sample and then analyzing the “relative” deregulation effect of environmental regulation. Different from the existing studies, the possible innovations and academic contributions of this paper are as follows: 1) Establish an upstream and downstream environmental responsibility-sharing model, analyze enterprises under the industrial chain framework, and then find that environmental regulatory policies have heterogeneous effects on the industrial chain, and put forward theoretical hypotheses. 2) Using micro-data and econometric methods, this paper verifies theoretical hypotheses, proposes hypotheses on the effect of “relative” deregulation of environmental regulations, and explains the phenomenon of “double growth” of China’s environment and economy. 3) The regional heterogeneity of the impact of environmental regulatory policies on firm performance is further explored.
The remainder of this article is organized as follows: The second part explains the implementation strategy of environmental protection regulatory policies in the energy industry in 2006, builds the industrial chain upstream and downstream environmental regulation responsibility-sharing models, and proposes the corresponding assumptions. Based on the inspection and analysis of the double method, the assumptions on the sharing model of environmental regulation responsibility are proposed. The fourth part summarizes the corresponding research conclusions and puts forward targeted policy suggestions.
2 Theoretical model and research hypothesis
First, this article systematically reviews the implementation strategy of environmental inspection in 2006 to refine the corporate-related strategies. Second, based on abstract environmental regulations and corporate strategies, this article draws on the research ideas of Hay and Spier (2005), Helland et al. (2020) to build an enterprise environmental responsibility-sharing model for the industrial chain of the energy industry and introduces environmental regulations to the industry. In the chain research framework, the “relative” relaxation control effect focuses on the implementation of environmental regulations.
2.1 Environmental regulation strategies for implementing the energy industry
The pollution incident in the Songhua River basin in November 2005 sparked national attention. In January 2006, the State Environmental Protection Administration (SEPA) issued “the Notice on Checking the Environmental Risks of New Energy and Petroenergy Projects” (No. 42006) to conduct a nationwide inspection and remediation of the energy industry. Since February 2006, SEPA has dispatched five inspection teams to inspect key energy and petrol energy projects worth more than 450 billion yuan in 127 sensitive areas. The key contents of the investigation mainly include environmental risk and prevention implementation, environmental sensitivity investigation of project site selection, the project’s danger, toxicity, and risk investigation of materials and products, and the risk sources such as project environmental accidents and the risk reduction of enterprises to reduce risk. The environmental investigation organization’s main methods include data review and on-site inspection of the combination of the two ways, local environmental protection administrative departments by the principle of territorial self-inspection, the state Environmental Protection Administration sent by the inspection team by the relevant standards of key energy projects (about 20) for investigation. The handling methods of the investigation results mainly include supplementing and rectifying the environmental risk assessment report within a specified time limit and handing over the original environmental impact assessment report to the approval department for review. If the “three simultaneous " (Three steps of a project are carried out simultaneously) of the construction project fail to pass the acceptance inspection, it is necessary to supplement the corresponding environmental risk emergency plan and update on the implementation of accident prevention measures.
Judging from the implementation of environmental protection investigations organized by the State Environmental Protection Administration of the People’s Republic of China in 2006, environmental protection investigations mainly adopt enterprise reports and inspection team verifications. It can be seen that corporate reports and data verification are particularly important. Therefore, when this article constructs the theoretical model, the corresponding enterprise reports the environmental emissions coefficient and the enterprise reporting strategy and environmental regulation intensity are used as strategic variables for corporate environmental responsibility.
2.2 Economic environment and main body setting
It is assumed that enterprises in the market are divided into upstream and downstream. Upstream enterprises produce goods with negative environmental externalities and sell them to downstream enterprises in different regions. The number of goods sold by the upstream enterprise to the downstream enterprise in region
where
2.3 Strategic behavior and analysis of economic subjects
2.3.1 Upstream enterprises
Since the upstream enterprise implements a multiregional sales strategy and has a certain market pricing power, its objective function is:
where
From Formula (2), the optimal report of the corresponding upstream enterprise can be found to be the outer part of the environment, which is recorded as
where
As companies report that the environmental externalities coefficient of
2.3.2 Downstream enterprises
For downstream enterprises in a perfectly competitive market, their target profit function is:
After optimization treatment of Eq. 5, the following can be obtained:
For Eq. 6, if the upstream enterprise is in a perfectly competitive market with homogeneous environmental regulations, Eq. 6 can be translated into:
It can be seen that in this case, environmental regulation has no effect on the behavior of downstream enterprises. Therefore, when the intensity of environmental regulation is increased, the regulation of upstream enterprises is actually strengthened. Furthermore, this paper carries out a comparative static analysis between the optimal
As
When the upstream market is a perfectly competitive market, then
At this time, due to
3 Empirical analysis and discussion
3.1 Construction of measurement models
To test environmental regulations in the industrial chain, the upstream and downstream enterprises in the industrial chain can implement the increase in output value before and after environmental protection inspection in 2006 to determine the role of environmental regulation policies on the enterprise in the industrial chain (Liu et al., 2022b). However, this method will not be able to exclude the output value of energy enterprises due to other aspects, and it is impossible to identify environmental regulatory policies to form a heterogeneity effect in upstream and downstream enterprises. Therefore, this article will be evaluated by dual differential methods. On the one hand, the parallel trend can be used to reflect the environmental protection policies of the energy industry in upstream enterprises to judge the heterogeneity of the effects of environmental regulations on the industrial chain. On the other hand, the interference of other policies is excluded through placebo inspection.
Among the 61,000 observation samples in this article from 1998 to 2012, a total of 18,412 basic energy enterprises (upstream enterprises in the energy industry) were influenced by the 2006 environmental supervision policy, which provided us with a good “quasi-natural” opportunity for the experiment. Specifically, of the 61000 samples, we use 18412 basic energy enterprises as a policy processing group and the remaining downstream enterprises as control groups. At the same time, due to the influence of environmental protection inspection policies in the energy industry in 2006, we used a policy comparison period before 2006 and an experimental period after 2006. The corresponding virtual variable is set as follows:
In this way, we will build a dual fixed-effects differential model and test the impact of the 2006 energy environment regulation policy on the output value of the energy industry:
Among them,
3.2 Data, variables, and descriptive statistics
This study analyzes the impact of environmental regulation on energy enterprises from the perspective of the industrial chain and provides a detailed analysis of the difference in this effect between the eastern and western regions of China. In addition, considering that enterprise output value is also affected by other economic factors, other control variables will be introduced in this paper. See Table 1 for the specific variable setting methods.
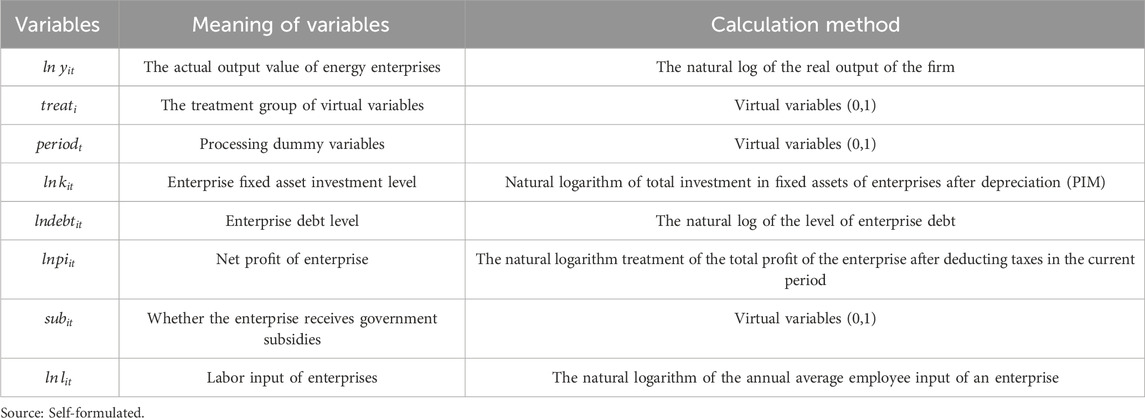
Table 1. The meaning and calculation method of related variables.
3.2.1 Explained variables
The explained variable in this paper is mainly the natural logarithm of output value
3.2.2 Core explanatory variables
The core explanatory variable of this paper is the dummy variable of environmental protection policy, which is divided according to the energy industry chain, and the upstream enterprises are regarded as the enterprises in the treatment group. This industry is mainly based on basic energy raw material manufacturing, and its three-level national economic industry classification code is 261. Four-level subdivided industries are inorganic acid (2611), inorganic base (2612), inorganic salt manufacturing (2613), organic energy raw material manufacturing (2614), and other basic energy raw material manufacturing (2619). The downstream enterprises are taken as the control group. The three levels of national economic industry classification of these enterprises mainly include fertilizer manufacturing (262), pesticide manufacturing (263), paint, ink, pigment, and similar products (264), synthetic materials manufacturing (265), specialized energy products (266), explosives, pyrotechnics and fireworks products (267), and daily energy products (268). See Figure 1 for details.
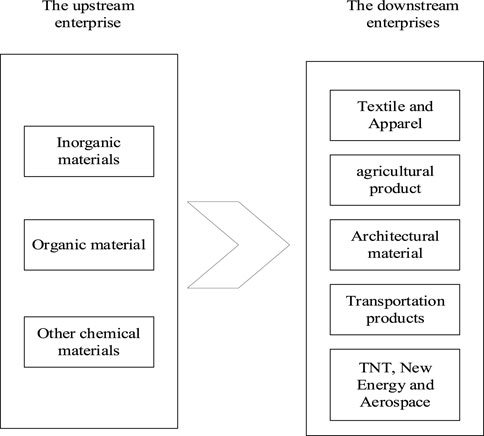
Figure 1. Energy industry chain upstream and downstream enterprise distribution.
3.2.3 Control variables
The control variables selected in this paper mainly reflect three types of enterprise capabilities. The first type of index is the enterprise production factor input capacity, which mainly includes net fixed asset investment (
In this paper, the data samples are micro panel data of energy enterprises in China from 1998 to 2012. There are two main reasons for determining this interval: first, much data are missing, such as labor input indicators, in the database of Chinese industrial enterprises after 2012, so the data before 2012 are selected. Second, after 2013, a new round of environmental protection supervision measures began due to the increasing haze and other events. To avoid the estimation bias caused by the overlapping interference of policies, this paper did not select microenterprise panel data from 2013 to 2014. Finally, all the original data in this paper are from the China Industrial Enterprise Database, and descriptive statistics of the variables involved are summarized in Table 2.
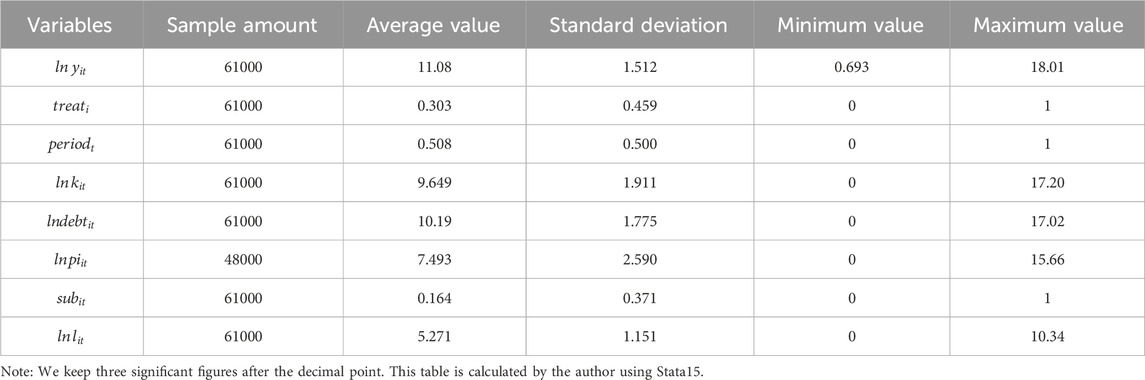
Table 2. Descriptive statistics of relevant variables.
3.3 Parallel trend test
To ensure that the estimated results of the DID are accurate, the experimental group and the control group need to pass a parallel trend inspection to show that there is no structural difference between the experimental group and the control group before the policy implementation. The development trend is significantly different; otherwise, the estimate will inevitably cause deviation. This article draws on the practice of Beck et al. (2010). Based on calculating energy enterprises’ relative period of environmental protection “supervisory enterprise” policy, the abovementioned benchmark DID model is used for the relative period of processing effects, and the corresponding parameter drawing is shown in Figure 2. It is found that the estimated processing effect of the estimated process is significantly zero in the first seven phases of the implementation of the policy of strict environmental regulation policies, which shows that the experimental group and the control group before the implementation of environmental policies meet the same changes. Correspondingly, in the seventh phase of the implementation of environmental regulation policies, the estimated treatment effects have significantly different structural effects. On the one hand, it shows that the impact of environmental regulation policies on upstream enterprises has significant effects. Policies significantly increase the output value of upstream energy companies.
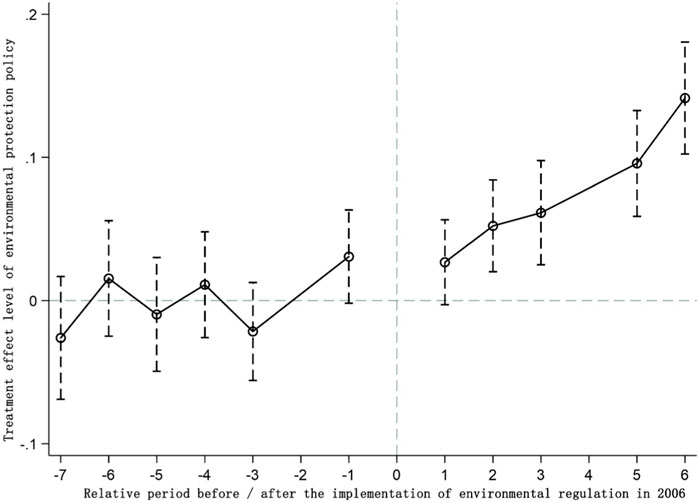
Figure 2. The parallel trend test.
3.4 Empirical results and the discussion
This paper first estimates the impact of environmental protection supervision in the energy industry on the whole energy industry chain to test the hypotheses removed from the theoretical model above. The regression results of DID (Differences in Differences) in the benchmark simultaneous equation model are shown in Table 3. Models (1)—(3) in Table 3 use high-dimensional regression, fixed effects panel regression, and OLS algorithms to estimate the estimation results of the DID model (Greene, 2003). The results show that regardless of which algorithm and estimation strategy are adopted, the treatment effect of energy environmental protection policy presents a positive relationship at the significance level of 1%. This shows that the output value of the energy industry increased by 4.20% after environmental regulation. This conclusion verifies the hypothesis of the mathematical model above; that is, when the government strengthens environmental regulations, the demand of downstream enterprises for upstream products will increase, so the output of upstream enterprises will also significantly increase. Among the control variables, fixed asset input, labor input, debt, and enterprise profit all show a positive relationship at the confidence level of 1%, indicating that the energy industry enterprise output value and factor input, enterprise operation status, and enterprise financing ability all show a significant positive relationship, which is consistent with previous studies (Bendoly et al., 2009; Kolupaieva et al., 2019; Yuan and Pan, 2022).
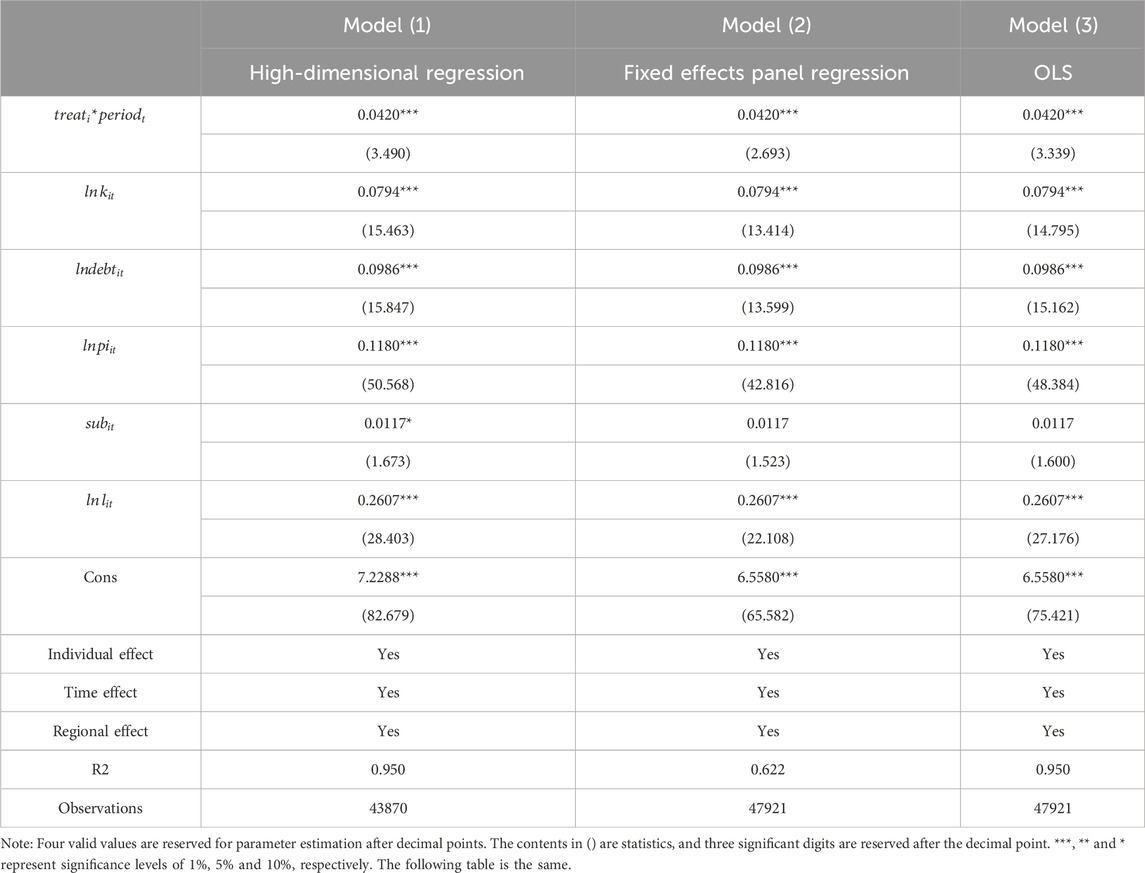
Table 3. Estimation results of the DID.
However, from the statistical results of government subsidy variables, energy enterprises show a significant positive relationship at the 10% confidence level in the high-dimensional regression equation, indicating that energy enterprises will significantly expand their reproduction and significantly increase their output value by approximately 1.17% after receiving local government subsidies.
3.5 Placebo test
To avoid the effect of other policies on the purchase restriction policy, a placebo test was used to simulate the effect of the policy under different conditions to exclude the influence of other random factors. In essence, the placebo test estimates whether the estimated results under different fictitious situations are significantly different from the original estimated results by constructing a virtual policy time or treatment group (Abadie et al., 2010). If there are significant differences, it indicates that the changes in the explained variables are only due to the implementation of the policy and are not affected by other policy changes or random factors. The article conducted a placebo inspection because since 2003 the northeast area has been promoting the revitalization of the northeast old industrial base strategy. The energy industry in northeast China will also be affected by the environment, so this article will eliminate the northeast energy industry and downstream enterprises, corresponding to regression analysis.
The test results in Table 4 show that the significance of the treatment effect of environmental regulation policies in the energy industry is significantly consistent with the real situation after the samples in northeast China are excluded. Specifically, excluding the samples from northeast China, the treatment effect of implementing environmental regulation policies is 0.0382 at the 1% confidence level. It can be seen that the output value treatment effect produced by the environmental regulation policy is not affected by the northeast revitalization policy. Therefore, it shows that the DID simultaneous model passes the placebo test; the influence of other policies or random factors is excluded, while the treatment effect level of environmental regulation policies is verified.
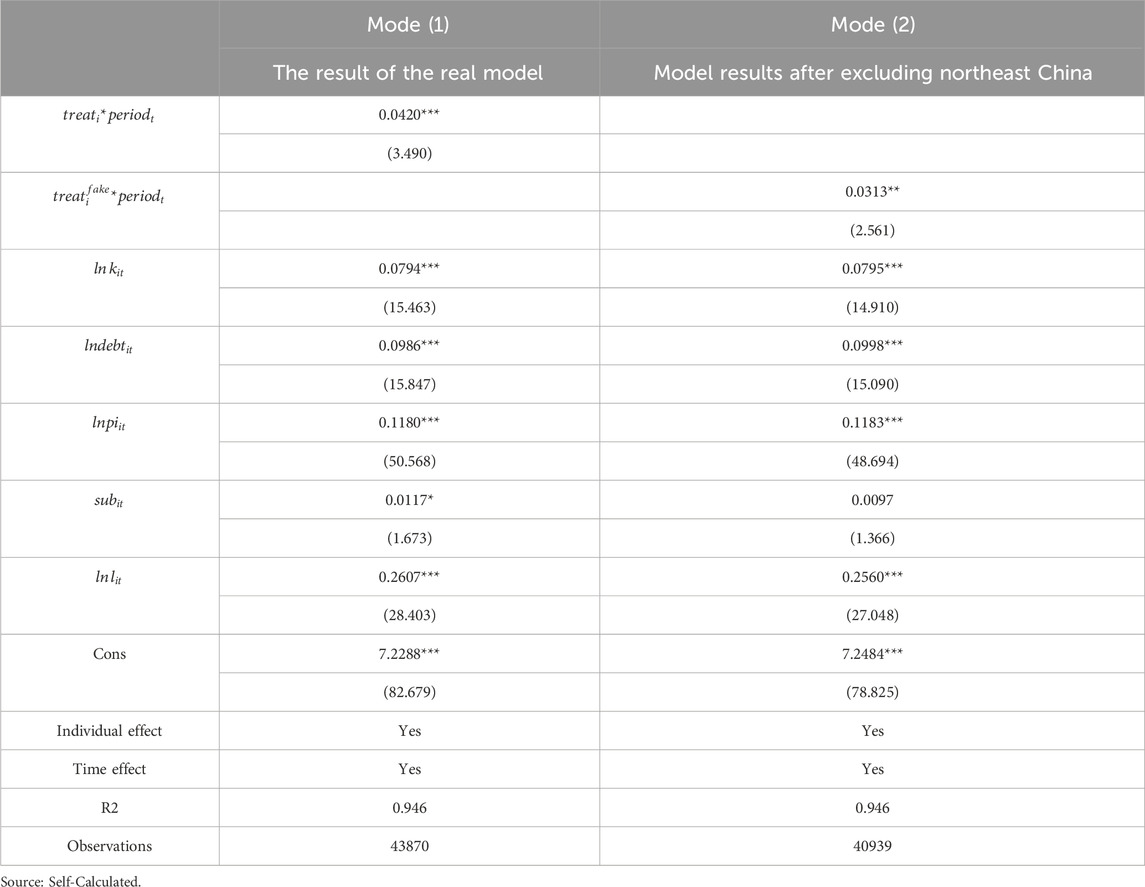
Table 4. Placebo test.
3.6 Heterogeneity analysis: the eastern, central and western regions of China
Considering the significant differences in resource endowments among China’s eastern, central, and western regions, the eastern region is economically developed, with energy supply primarily dependent on energy transportation from the central and western regions and overseas energy imports. The central region, rich in coal resources, serves as a traditional base for energy and raw materials. In contrast, the western region is abundant in renewable energy resources such as hydropower, wind energy, and solar energy. Environmental regulation strategies should be designed and implemented based on local resource endowments, economic development conditions, and environmental issues, aiming to achieve a harmonious and sustainable development of the economy and environment. This paper further analyzes the heterogeneity of the eastern, central, and western regions. First, this paper refers to the classification standard of China’s eastern, central, and western regions by the National Bureau of Statistics in 2003. The eastern regions include the following 12 provinces (municipalities and autonomous regions): Beijing, Tianjin, Shanghai, Zhejiang, Guangdong, Liaoning, Hebei, Shandong, Jiangsu, Fujian, Guangxi and Hainan. The central region includes nine provinces (autonomous regions): Shanxi, Inner Mongolia, Jilin, Heilongjiang, Anhui, Jiangxi, Henan, Hubei, and Hunan. The western region includes nine provinces (autonomous regions): Sichuan, Guizhou, Yunnan, Tibet, Shaanxi, Gansu, Ningxia, Qinghai and Xinjiang. Second, this paper performs DID model regression (high-dimensional regression strategy) for the eastern, central, and western regions, and the estimated results are shown in Table 5. From the estimated information in Table 5, the core explanatory variables, environmental regulation policies, all show a significant positive relationship, which again verifies the hypothesis put forward by the theoretical model in this paper. However, from the treatment effect of the actual policy, there are obvious differences between the eastern, central, and western regions. Specifically, the environmental regulation policy has the most significant net policy impact in the western region, where the output value of energy industry enterprises increased by 7.49% at the 1% confidence level. This is followed by the eastern region, where the output value of energy industry enterprises increased by 3.4% at the 5% confidence level. Finally, in the central region, the output value of energy industry enterprises increased by 1.75% at the 10% confidence level. This result is mainly because the western region is dominated by the basic energy industries, that is, the upstream enterprises in the industrial chain, so the effect of environmental regulation policies is more pronounced. The eastern region is dominated by downstream enterprises, which are closer to the terminal market, so the effect of “relative” deregulation is stronger. However, the central region does not occupy a dominant position upstream of the energy industry chain; at the same time, it does not form a strong downstream or terminal market, so the effect of environmental regulation policy in the central region is the least. From the control variables in the eastern, central, and western regions, first, their significance and coefficient direction are consistent with the above, which shows the robustness of the model and shows that the selected variables have strong explanatory power.
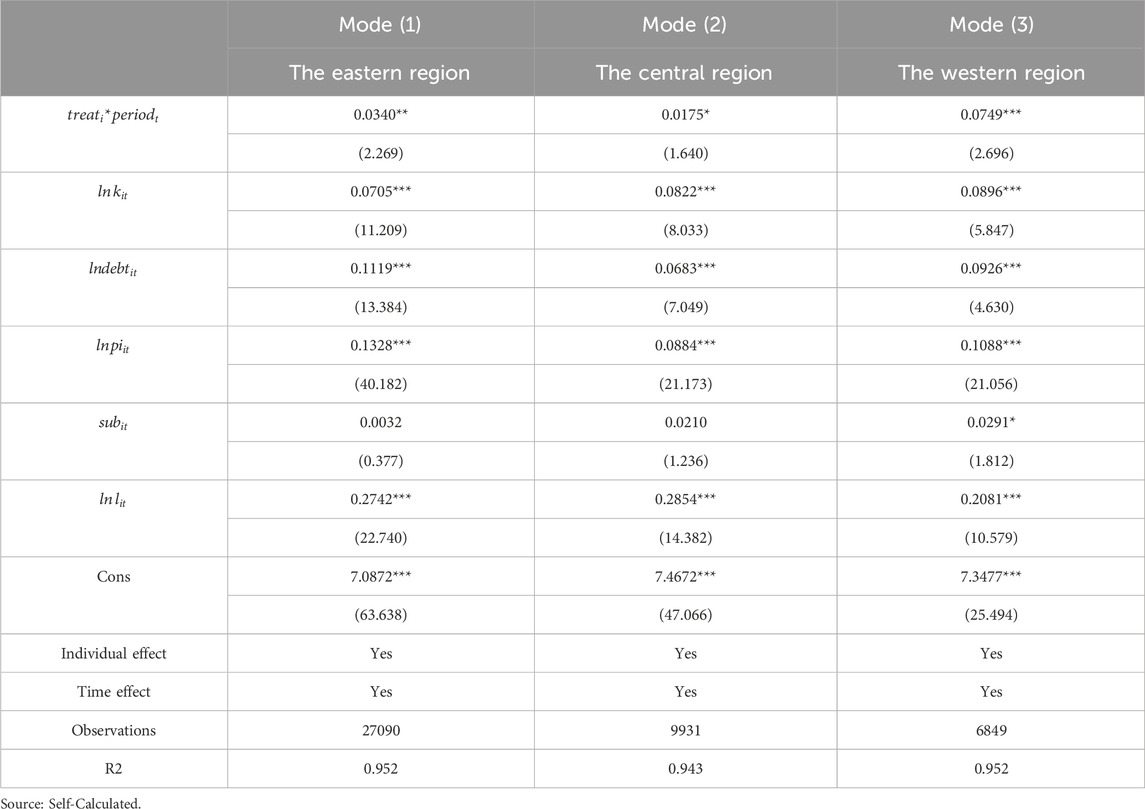
Table 5. Estimated results of eastern, central and western regions of China.
4 Conclusion and policy implications
Haze, water pollution, dust, and other types of pollution seriously affect people’s quality of life, and environmental regulation for environmental protection has become an important starting point for environmental control. However, how to balance environmental quality and economic growth has long been a challenging issue for governments. Regarding the effect of environmental regulation, academic research has been pursuing the “cost compliance” theory and the “innovation compensation” theory. In reality, however, neither of the theories adequately explains the unique phenomenon of “double growth” of the economy and environment in China. On this basis, this paper tries to jump out of the “cost to follow” and “innovation” theory framework and establish an environmental responsibility allocation model in the industrial chain. Using energy enterprise microdata in China from 1998 to 2012 as samples, we analyze the effects of environmental regulation on the industry chain to explain China’s economic and environmental “growth” phenomenon. The research finds that in the industrial chain, upstream and downstream enterprises share environmental obligations and responsibilities due to trade associations. When environmental regulation is strengthened, the environmental responsibility will move forward through the industrial chain, and the regulation on upstream enterprises will be “relatively” strengthened, while the regulation on downstream enterprises will be “relatively” relaxed, thus expanding the output but increasing demand for upstream products. Different from previous studies, this paper argues that environmental regulation will promote output growth of the entire industrial chain due to its differential effect on the industrial chain. This is in contrast with the view of the “cost compliance” theory that environmental regulation will inevitably lead to an output decline. Based on this research, this paper puts forward the following policy implications and suggestions.
First, we should fully acknowledge the heterogeneous effect of environmental regulation on the industrial chain and accept the development goals of both the environment and the economy. There is still a gap in the research on the differential effect of environmental regulation in the industrial chain, so it is beneficial to understand the spillover effect of environmental regulation. Since 2018, a storm of environmental protection inspections has swept the country. Some local governments have used simple administrative measures to shut down enterprises, causing structural economic problems and social instability. This type of unsustainable administrative interference seriously destroys the regulation transmission effect throughout the industrial chain and greatly reduces the policy effect of environmental regulation. Therefore, based on the research conclusions of this paper, it is proposed that the administrative approach of “one size fits all” that ignores enterprise heterogeneity in the industrial chain should be eliminated immediately. In the context of the “three critical battles” determined by the 19th National Congress of the Communist Party of China, the government should guide the transformation of polluting enterprises instead of shutting them down and establish a strict environmental certification and accountability system to correct the chaos of environmental governance, to improve the efficiency and the methods of government supervision.
Secondly, enhancing the disclosure of environmental information and raising public awareness of environmental protection are essential for fostering a conducive atmosphere for social supervision. On one hand, the government should establish and improve the environmental information disclosure system, requiring companies to regularly publish information on their environmental performance, pollution discharge, and environmental protection measures. This would increase the transparency of industrial pollution and enable the public and media to access information about corporate environmental behavior through official channels. On the other hand, the government should strengthen mechanisms for public participation in environmental protection, such as through public hearings and the disclosure of environmental impact assessments. This would allow the public to engage in the decision-making process of environmental protection and effectively supervise enterprises or industries with negative environmental externalities, thereby continuously promoting the output of environmentally friendly products.
Data availability statement
Publicly available datasets were analyzed in this study. This data can be found here: China Industrial Enterprise Database.
Author contributions
SZ: Conceptualization, Data curation, Formal Analysis, Funding acquisition, Investigation, Methodology, Resources, Supervision, Visualization, Writing–original draft. QY: Data curation, Formal Analysis, Funding acquisition, Investigation, Project administration, Resources, Software, Supervision, Visualization, Writing–review and editing. XH: Conceptualization, Formal Analysis, Funding acquisition, Investigation, Methodology, Project administration, Software, Supervision, Validation, Visualization, Writing–review and editing. BY: Funding acquisition, Resources, Supervision, Visualization, Investigation, Software, Writing–review and editing.
Funding
The author(s) declare financial support was received for the research, authorship, and/or publication of this article. This research is supported by the National Social Science Fund of China (Grant No. 21BTJ023).
Conflict of interest
The authors declare that the research was conducted in the absence of any commercial or financial relationships that could be construed as a potential conflict of interest.
Publisher’s note
All claims expressed in this article are solely those of the authors and do not necessarily represent those of their affiliated organizations, or those of the publisher, the editors and the reviewers. Any product that may be evaluated in this article, or claim that may be made by its manufacturer, is not guaranteed or endorsed by the publisher.
References
Abadie, A., Diamond, A., and Hainmueller, J. (2010). Synthetic control methods for comparative case studies: estimating the effect of California’s tobacco control program. J. Am. Stat. Assoc. 105, 493–505. doi:10.1198/jasa.2009.ap08746
Ashford, N. A., and Hall, R. P. (2011). The importance of regulation-induced innovation for sustainable development. Sustainability 3, 270–292. doi:10.3390/su3010270
Beck, T., Levine, R., and Levkov, A. (2010). Big bad banks? The winners and losers from bank deregulation in the United States. J. Finance 65, 1637–1667. doi:10.1111/j.1540-6261.2010.01589.x
Bendoly, E., Rosenzweig, E. D., and Stratman, J. K. (2009). The efficient use of enterprise information for strategic advantage: a data envelopment analysis. J. Operations Manag. 27, 310–323. doi:10.1016/j.jom.2008.11.001
Brännlund, R., Chung, Y., Färe, R., and Grosskopf, S. (1998). Emissions trading and profitability: the Swedish pulp and paper industry. Environ. Resour. Econ. 12, 345–356. doi:10.1023/a:1008285813997
Cai, X., Lu, Y., Wu, M., and Yu, L. (2016). Does environmental regulation drive away inbound foreign direct investment? Evidence from a quasi-natural experiment in China. J. Dev. Econ. 123, 73–85. doi:10.1016/j.jdeveco.2016.08.003
Che, S., and Wang, J. (2022). Policy effectiveness of market-oriented energy reform: experience from China energy-consumption permit trading scheme. Energy 261, 125354. doi:10.1016/j.energy.2022.125354
Chen, H., and Xu, Y. (2021). Environmental regulation and exports: evidence from the comprehensive air pollution policy in China. Int. J. Environ. Res. Public Health 18, 1316. doi:10.3390/ijerph18031316
Chen, X., and Lin, B. (2021). Towards carbon neutrality by implementing carbon emissions trading scheme: policy evaluation in China. Energy Policy 157, 112510. doi:10.1016/j.enpol.2021.112510
Chen, Z., Paudel, K. P., and Zheng, R. (2022). Pollution halo or pollution haven: assessing the role of foreign direct investment on energy conservation and emission reduction. J. Environ. Plan. Manag. 65, 311–336. doi:10.1080/09640568.2021.1882965
Chu, Z., Bian, C., and Yang, J. (2022). How can public participation improve environmental governance in China? A policy simulation approach with multi-player evolutionary game. Environ. Impact Assess. Rev. 95, 106782. doi:10.1016/j.eiar.2022.106782
Dey-Chowdhury, S. (2008). Methods explained: perpetual inventory method (pim). Econ. Labour Mark. Rev. 2, 48–52. doi:10.1057/elmr.2008.140
Dou, J., and Han, X. (2019). How does the industry mobility affect pollution industry transfer in China: empirical test on Pollution Haven Hypothesis and Porter Hypothesis. J. Clean. Prod. 217, 105–115. doi:10.1016/j.jclepro.2019.01.147
Ederington, J., and Minier, J. (2003). Is environmental policy a secondary trade barrier? An empirical analysis. Can. J. Economics/Revue Can. d'économique 36, 137–154. doi:10.1111/1540-5982.00007
Ford, A., Moodie, C., MacKintosh, A. M., and Hastings, G. (2014). Adolescent perceptions of cigarette appearance. Eur. J. Public Health 24, 464–468. doi:10.1093/eurpub/ckt161
Gray, W. B., and Shadbegian, R. J. (2003). Plant vintage, technology, and environmental regulation. J. Environ. Econ. Manag. 46, 384–402. doi:10.1016/s0095-0696(03)00031-7
Hamamoto, I. (2006). Positive-energy one-particle levels in quadrupole-deformed Woods-Saxon potentials. Phys. Rev. C 73, 064308. doi:10.1103/physrevc.73.064308
Hay, B., and Spier, K. E. (2005). Manufacturer liability for harms caused by consumers to others. Am. Econ. Rev. 95, 1700–1711. doi:10.1257/000282805775014416
Hazilla, M., and Kopp, R. J. (1990). Social cost of environmental quality regulations: a general equilibrium analysis. J. Political Econ. 98, 853–873. doi:10.1086/261709
Helland, E., Lakdawalla, D., Malani, A., and Seabury, S. A. (2020). Unintended consequences of products liability: evidence from the pharmaceutical market. J. Law, Econ. Organ. 36, 598–632. doi:10.1093/jleo/ewaa017
Huang, W., Wang, Q., Li, H., Fan, H., Qian, Y., and Klemeš, J. J. (2022). Review of recent progress of emission trading policy in China. J. Clean. Prod. 349, 131480. doi:10.1016/j.jclepro.2022.131480
Jaffe, A. B., and Palmer, K. (1997). Environmental regulation and innovation: a panel data study. Rev. Econ. statistics 79, 610–619. doi:10.1162/003465397557196
Jin, Y., Andersson, H., and Zhang, S. (2016). Air pollution control policies in China: a retrospective and prospects. Int. J. Environ. Res. Public Health 13, 1219. doi:10.3390/ijerph13121219
Kneller, R., and Manderson, E. (2012). Environmental regulations and innovation activity in UK manufacturing industries. Resour. Energy Econ. 34, 211–235. doi:10.1016/j.reseneeco.2011.12.001
Kolupaieva, I., Pustovhar, S., Suprun, O., and Shevchenko, O. (2019). Diagnostics of systemic risk impact on the enterprise capacity for financial risk neutralization: the case of Ukrainian metallurgical enterprises. Oeconomia Copernic. 10 (3), 471–491. doi:10.24136/oc.2019.023
Li, H., Zhou, M., Xia, Q., and Wang, J. (2022). Has central environmental protection inspection promoted high-quality economic development? a Case study from China. Sustainability 18, 11318. doi:10.3390/su141811318
Lin, C., and Sun, W. (2023). Central environmental protection inspection, environmental quality, and economic growth: evidence from China. Appl. Econ. 55, 5956–5974. doi:10.1080/00036846.2022.2140776
Liu, J., Zhao, M., and Wang, Y. (2020). Impacts of government subsidies and environmental regulations on green process innovation: a nonlinear approach. Technol. Soc. 63, 101417. doi:10.1016/j.techsoc.2020.101417
Liu, X., Zhong, S., Li, S., and Yang, M. (2022a). Evaluating the impact of central environmental protection inspection on air pollution: an empirical research in China. Process Saf. Environ. Prot. 160, 563–572. doi:10.1016/j.psep.2022.02.048
Liu, Z., Qian, Q., Hu, B., Shang, W., Li, L., Zhao, Y., et al. (2022b). Government regulation to promote coordinated emission reduction among enterprises in the green supply chain based on evolutionary game analysis. Resour. Conservation Recycl. 182, 106290. doi:10.1016/j.resconrec.2022.106290
Pickman, H. A. (1998). The effect of environmental regulation on environmental innovation. Bus. Strategy Environ. 7, 223–233. doi:10.1002/(sici)1099-0836(199809)7:4<223::aid-bse164>3.3.co;2-j
Porter, M. E., and Linde, C. (1995). Toward a new conception of the environment-competitiveness relationship. J. Econ. Perspect. 9, 97–118. doi:10.1257/jep.9.4.97
Posner, R. A., and Landes, W. M. (1985). A positive economic analysis of products liability. J. Leg. Stud. 14, 535–567. doi:10.1086/467785
Shelenko, D., Balaniuk, I., Sas, L., Malik, M., Matkovskyi, P., Levandivskyi, O., et al. (2021). Forecasting of net profit and the area of land of private enterprises. Manag. Theory Stud. Rural Bus. Infrastructure Dev. 43, 500–516. doi:10.15544/mts.2021.45
Tian, Y., Song, W., and Liu, M. (2021). Assessment of how environmental policy affects urban innovation: evidence from China’s low-carbon pilot cities program. Econ. Analysis Policy 71, 41–56. doi:10.1016/j.eap.2021.04.002
Wang, A., Si, L., and Hu, S. (2023). Can the penalty mechanism of mandatory environmental regulations promote green innovation? Evidence from China's enterprise data. Energy Econ. 125, 106856. doi:10.1016/j.eneco.2023.106856
Wu, X., and Gao, M. (2021). Effects of different environmental regulations and their heterogeneity on air pollution control in China. J. Regul. Econ. 60, 140–166. doi:10.1007/s11149-021-09436-1
Yuan, S., and Pan, X. (2022). Corporate carbon disclosure, financing structure, and total factor productivity: evidence from Chinese heavy polluting enterprises. Environ. Sci. Pollut. Res. 29, 40094–40109. doi:10.1007/s11356-021-18383-5
Zhu, Y., Wang, Z., Qiu, S., and Zhu, L. (2019). Effects of environmental regulations on technological innovation efficiency in China’s industrial enterprises: a spatial analysis. Sustainability 11 (7), 2186. doi:10.3390/su11072186
Keywords: environmental regulation, industrial chain, energy industry, relative deregulation, DID model
Citation: Zhang S, Yan Q, Huang X and Yan B (2024) Environmental regulation effects from the perspective on the industrial chain: evidence from energy enterprises in China. Front. Environ. Sci. 12:1396288. doi: 10.3389/fenvs.2024.1396288
Received: 05 March 2024; Accepted: 10 April 2024;
Published: 02 May 2024.
Edited by:
Zhangqi Zhong, Guangdong University of Foreign Studies, ChinaReviewed by:
Jing Zhao, Zhejiang Agriculture and Forestry University, ChinaLeying Wu, Henan University, China
Copyright © 2024 Zhang, Yan, Huang and Yan. This is an open-access article distributed under the terms of the Creative Commons Attribution License (CC BY). The use, distribution or reproduction in other forums is permitted, provided the original author(s) and the copyright owner(s) are credited and that the original publication in this journal is cited, in accordance with accepted academic practice. No use, distribution or reproduction is permitted which does not comply with these terms.
*Correspondence: Xin Huang, hx150867@163.com