Reconstructing the ecological restoration pattern from the perspective of ecosystem health assessment in a typical black soil region of Northeast China
 Duo Feng
 Panpan Zhou*
 - College of Earth Sciences, Jilin University, Changchun, China
Assessments on the spatial pattern of ecological restoration potential provide insights into the current status of ecosystem health, facilitate the identification of hotspots of ecosystem degradation, and further serves as a link that bridges regional ecological planning with specific restoration efforts. The goal of this study was to reconstruct the ecological restoration pattern, through establishing an ecosystem health assessment model encompassing four elements of vigor, organization, resilience and service of an ecosystem. Siping City, a typical black soil region located in central Jilin Province of Northeast China, was selected as the study area, and ecological protection and restoration units were identified based on temporal changes in ecosystem health levels from 2000 to 2020. Getis-Ord Gi* analysis was adopted to classify the restoration zones and depict the spatial pattern of ecological restoration. From 2000 to 2020, the ecosystem health index of Siping City generally increased from 0.49 to 0.51 due to increases in forestland area and precipitation, but a fraction of suburban areas also experienced decreases. Four different restoration zones were delineated, including the windbreak and sand-fixing zone in the western part, the black soil protection and reclamation zone in the middle part, the Daheishan ecological shelter zone in the central and eastern part, and the water restoration zone in the eastern part, which account for 28.12%, 37.05%, 16.53% and 18.29% of the total area. The protection units covered an area of 1,189.83 km2 and the restoration units covered an area of 2009.83 km2, which could be further classified into 10 types and accounted for 31.24% of the total area. It was suggested that the restoration methods applied to different units should be tailored towards specific restoration objectives. This proposed methodological framework serves as a basis for reconstructing ecological restoration in the black soil region, and a reference for making restoration plans elsewhere.
1 Introduction
Degradation of agricultural and urban ecosystems has become an important global issue, hindering the maintenance of food security and sustainable development (King and Hobbs, 2006; Turner et al., 2016). In recent decades, China has seen rapid economic development by relying on high-intensity resource utilization, which has caused increasingly serious environmental problems, as evidenced by accelerated loss of key ecological functions and the encroachment of ecological space (Cui et al., 2021; Deng and Yang, 2021). Based on the ecological civilization development strategy, China has put forward the concept of territorial ecological restoration, which provides solutions to maintaining regional ecological and environmental stability and sustainability. In particular, the restoration of terrestrial ecosystems requires a more comprehensive and systematic planning, with more focus given to searching nature-based development solutions (Fu, 2021). It also explores restoration measures that conform to both the natural ecological integrity and socio-economic development (Gong et al., 2020). A successful implementation of ecosystem restoration measures will contribute to alleviating regional ecological conflicts, restoring damaged ecosystems, and preventing further degradation of ecosystems (Jackson and Hobbs, 2009; Suding, 2011).
Numerous studies have been conducted targeting the assessments of ecological restoration patterns, but much focus have been given to single elements or specific types of ecosystems, which usually aim at promoting local ecological environment, for instance by means of soil remediation (Wang et al., 2016), reforestation (Honig and Fulé, 2012) and habitat improvement (Roilo et al., 2023). For instance, the Ministry of Natural Resources in China has organized 44 “Shanshui Projects” to restore nationwide ecosystem functions from inland mountains to coastal estuaries, by integrating elements and resources of mountain, water, forest, farmland, lake and grassland systems. In this context, multi-aspect assessment on the ecological restoration pattern could be more conducive to realizing coordinated regional resource allocation and to maintaining the ecosystem health at large-scale and from a long-term perspective.
Spatial zoning of territorial ecological restoration offers the possibility to assess ecological degradation from a spatial perspective, and further provides assistance to enhance ecosystem integrity and sustainability (Cao et al., 2019; Peng et al., 2020). A wide variety of approaches for ecological restoration zoning have been adopted, including depiction of landscape ecological pattern, dominant functional partition and ecological security evaluation, with the goal of achieving targeted remediation and management (Cai et al., 2020; Fu et al., 2020; Ni et al., 2020). As an effective method to assess ecosystem status, ecosystem health assessment can help identify ecological problems by detecting “hotspots” of land degradation and biodiversity loss. The concept of ecosystem health originated from the concept of “land health” put forward by Leopold (1941). Rapport et al. (1998) extended the definition from the perspective of ecological economics, which became widely accepted and applied (Li et al., 2021; Wu et al., 2021; Lei et al., 2023). Studies on ecosystem health assessments started emerging in China around 2000. With the increasingly close connection between intensifying human activities and changing ecological environment, assessment on ecological environments has gradually extended from environmental evaluation that relies on physical and chemical indicators to the “health” of an entire ecosystem. The evaluation object has also developed from a single ecosystem to the regional complex ecosystem. Specific models of regional ecosystem health assessment mainly include the Vigor-Organization-Resilience model (VOR) and its derived models (Peng et al., 2017; Xiao et al., 2019), PSR model (pressure-state-response) (Hazbavi et al., 2020; Spiegel et al., 2001), and fuzzy evaluation model (Gu et al., 2002).
The black soil region in Northeast China serves as an important breadbasket for the country, but now is suffering severe ecosystem degradation due to intensive cropland cultivation and urban expansion. To better assess the spatial pattern of ecosystem restoration potential and to assist targeted measures of black soil protection, this study selected Siping city, located in central Jilin Province of Northeast China, as the study area. The spatial pattern of ecological restoration was formulated based on an evaluation index system centering around the concept of ecosystem health. The objective was to demonstrate the status and dynamic changes of the ecosystem health from 2000 to 2020, so as to laying the foundation for regional ecological restoration zoning, and for the identification of ecological protection and restoration units. The research outcome could therefore offer effective reference for detecting local hotspots of ecosystem degradation, and further inform the planning of ecological restoration and the implementation of specific ecological restoration efforts in the study area and beyond.
2 Materials and methods
2.1 Study area
Siping City, consisting of five counties, is located in central Jilin Province of Northeast China, with an altitude of 100–500 m above sea level (Figure 1). It has a temperate monsoon climate, with an average annual temperature of 5.7°C, an average annual precipitation of 567 mm, and an average frost-free period of approximately 130 days. Siping is located in the transition zone between Songliao Plain and low hills of the branch of Changbai Mountain. The overall elevation of the study area is high in the east and low in the west. In the east, hills and alluvial plains interlaced with each other, which are the main source of forest resources in Siping City. The fertile black soils, as characterized by Phaeozems and Chernozems according to the FAO WRB classification, are mainly located in the central part, which plays an essential role in grain production. The western part is adjacent to Horqin Grassland, in which both agriculture and animal husbandry are important.

FIGURE 1. Geographical location and the digital elevation model of Siping City.
2.2 Data sources and processing
A variety of remote sensing data were downloaded from the Geospatial data cloud (https://www.gscloud.cn/) and subsequently processed for model development. Landsat-5 and Landsat-8 remote sensing images with cloud coverage <10% and a spatial resolution of 30 m in 2000 and 2020 were acquired and processed. Data on precipitation and wind speed was from China Meteorological Data Network (https://data.cma.cn/), while the data on snow depth and evapotranspiration were obtained from the European Meteorological Center ERA5-Land data set (https://cds.climate. copernicus. eu/), with a spatial resolution of 0.1°. Data on potential evaporation was provided by the National Tibetan Plateau Scientific Data Center (https://data.tpdc. ac.cn/home), with a spatial resolution of 1 km. Net Primary Productivity (NPP) and Normalized Difference Vegetation Index (NDVI) data were extracted from the MODIS17A3H data set and the MODIS13A1 data set of NASA (https://www.earthdata.nasa.gov/), and the spatial resolution is 500 m. Soil data was from Harmonized World Soil Database (HWSD) released by the UN Food and Agriculture Organization (https://www.fao.org/soils-portal/en/), with a spatial resolution of 1 km. Lastly, data on grain output was extracted from the Siping City Statistic Yearbook in 2000 and 2020.
Landsat images in 2000 and 2020 were used as the data source for land use classification, which was performed using the supervised classification approach provided in the ENVI 5.3 software. Taking the land use/cover classification system of the Chinese Academy of Sciences for reference, the study area was classified into cultivated land, forestland, grassland, water area, construction land, and unexploited land. The accuracy of the classification was verified by the survey results of land use of Siping City in 2019 and also by high-resolution Google Earth images. The classification accuracy was 87.9% and 89.3% for 2000 and 2020. Raster data for wind speed and precipitation was obtained via ordinary kriging. Maximum NDVI composites during the period of July-September in 2000 and 2020 were also synthesized using ArcGIS 10.7 software. The spatial resolution of all spatial data was resampled to 30 m, and the projection was unified to CGCS 2000_3_Degree_GK_Zone_41.
2.3 Research methods
The methodological framework proposed in this study comprises two key steps: (1) first the assessment of ecosystem health from the four different elements of vigor, organization, resilience and service and (2) the reconstruction of ecological restoration pattern based on the assessment results in the first step. Detailed procedure of the method is given in Figure 2.
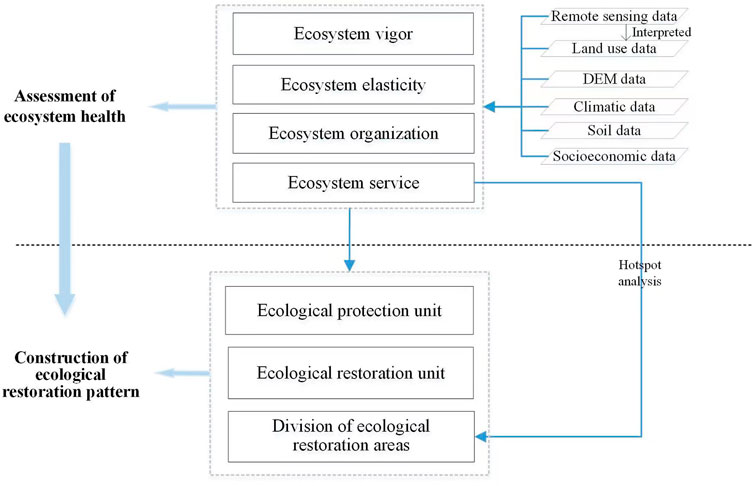
FIGURE 2. Flowchart for reconstructing the spatial pattern of ecological restoration.
2.3.1 Assessment of regional ecosystem health
Ecosystem Service was incorporated into the traditional “VOR” ecosystem health assessment framework, and a new ecosystem health assessment model based on “vigor, organization, resilience and service” (VORS) was established. The ecosystem health of Siping City was assessed from the natural health state and integrated services of ecosystems (equations 1) and 2) (Peng et al., 2017).
where
To eliminate differences in the nature and magnitude of each index, the minimum-maximum method was adopted for standardization (Singh and Singh, 2020). Finally, according to scores of the ecosystem health assessment and the actual characteristics of ecosystems, all the assessed units were classified into five levels, corresponding to very healthy, healthy, normal, unhealthy and very unhealthy ecosystem health status (Table 1).
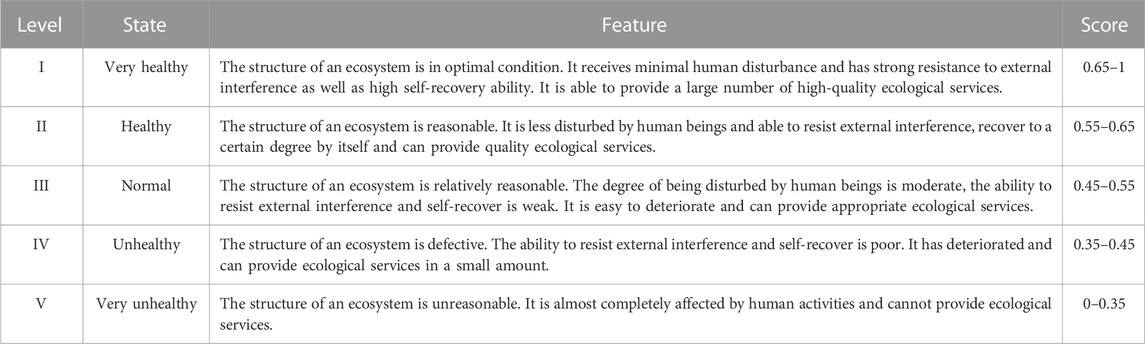
TABLE 1. Ecosystem health grading standards.
2.3.1.1 Natural index of ecosystem health
The natural index of ecosystem health is represented by vigor, organization and resilience. Ecosystem vigor is used to describe the metabolism and primary productivity of an ecosystem. In this study, NPP and NDVI were selected to represent the ecosystem vigor. Ecosystem organization is mainly used to describe the stability of an ecosystem’s structure, which is generally represented by the landscape pattern index related to landscape spatial heterogeneity, landscape connectivity and habitat connectivity. Using studies of Peng et al. (2018) and Pan et al. (2020) as references, we chose Shannon Diversity Index (SHDI) and area-average weighted patch fractal index (AWMPFD) to represent landscape spatial heterogeneity and used contagion index (CONTAG) and Number of Patches (NP) to reflect landscape connectivity, and applied Class Area (CA) and COHESION index of forestland, grassland and water areas to reflect the habitat connectivity. The above landscape pattern indexes were calculated by the moving window method using the fragstats 4.3 software. Ecosystem resilience is used to reflect the ability of an ecosystem to resist external disturbances and to keep its original structure and functions after being disturbed by external factors, namely abilities of resistance and resilience. We assigned the resistance coefficient (R1) and resilience coefficient (R2) of different types of land use and used area-weighted average for quantification (Peng et al., 2018). Finally, the weight of the assessment index was calculated according to previous studies and experts’ scoring methods (Table 2) (Peng et al., 2017; 2018; Xiao et al., 2019; Pan et al., 2020).
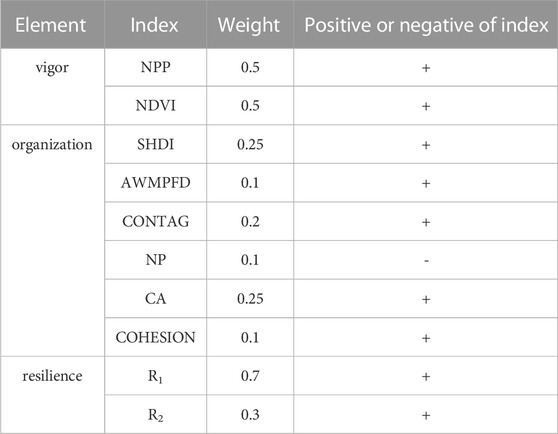
TABLE 2. Assessment index and weight of the natural health of ecosystems.
2.3.1.2 Index for ecosystem services
The ecosystem services was evaluated from water conservation, soil conservation, windbreak and sand fixation, biodiversity protection and food production capacity, considering its natural ecological conditions of Siping City. The specific calculation methods are shown in Table 3. It was assumed that the different ecosystem services contributed equally to the overall ecosystem function of Siping City, so the assessment weight of each index was assigned as 0.2. After the calculation of ecosystem service index, the final statistic was then obtained at 1.5 ⅹ1.5 km resolution.
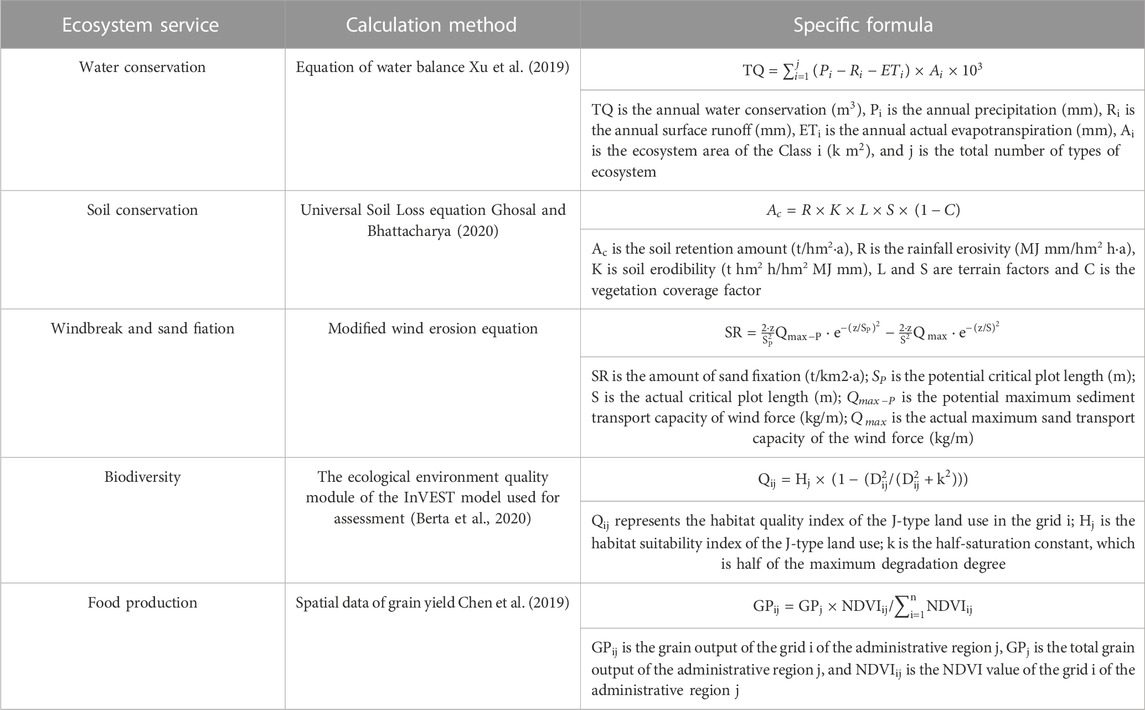
TABLE 3. Comprehensive assessment index and weight of ecosystem service.
2.3.2 Classification of ecological restoration areas
In order to delineate and classify the ecological restoration areas in Siping City, the hotspot analysis tool (Getis-Ord Gi *) in ArcGIS 10.7 was used to analyze the spatial pattern of the above-mentioned five types of ecosystem service indexes, with the aim to explore their spatial heterogeneity features and spatial distribution pattern. Superposition analysis was then applied to the detected hotspot areas, providing each ecosystem service together with the consideration of the respective land use feature, climate characteristics, and soil types. Finally, spatial classification of the ecological restoration areas was performed.
3 Results
3.1 Spatial and temporal variation of land use
The land use map in 2020 showed that the area of cultivated land was 6,983.32 km2, accounting for 68.19% of the city’s total land area, followed by forestland and construction land, which were 1715.73 km2 and 1,064.73 km2. Forestland was mainly distributed in the eastern hilly area of the city and mostly characterized as natural forests. Grassland concentrated in Shuangliao where natural and artificial grassland coexis. Area of the unexploited land was the smallest, accounting for only 0.83% of the total land area. They are mainly saline-alkali land, distributed in the northwest of Siping City, and most of them are adjacent to grassland (Figure 3).
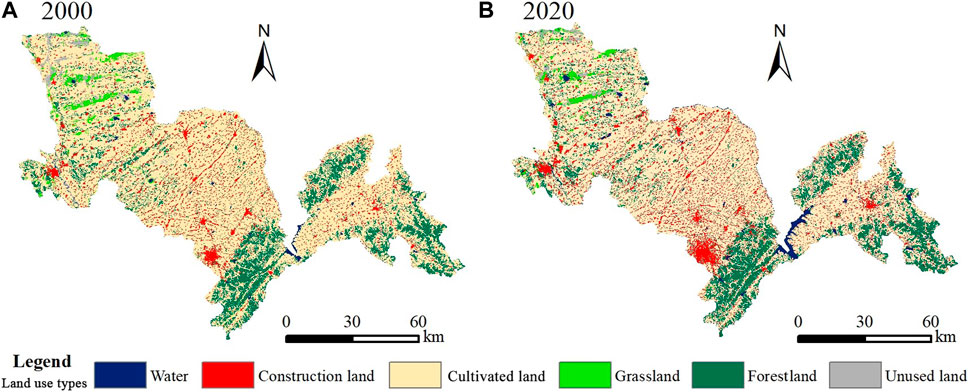
FIGURE 3. Land use map of Siping City in (A) 2000 and (B) 2020.
Compared to 2000, water areas increased the most in 2020, followed by construction land and forestland (Table 4), while unexploited land decreased the most (46.09%), followed by grassland (20.99%) and cultivated land (5.65%). Although a small relative change in percentage, the area of cultivated land decreased by 418.47 km2 from 2000 to 2020, due to the conversion into construction land and forestland. The area of unexploited land decreased only by 75.51 km2, which was mainly converted into cultivated land and construction land. Grassland decreased by 49.74 km2 and was mainly transformed into cultivated land and construction land. The large increase in water areas was mainly due to the abundant precipitation in 2020, leading to increase in water storage in the reservoirs. Furthermore, there was a marked increase in the area of construction land due to accelerating urbanization during the past 20 years, particularly in the urban areas of Siping, Shuangliao, Yitong and Lishu. The area of forestland increases because of the construction of the northwest-north-northeast China network of shelterbelts and the policy implementation of returning farmland to forests.
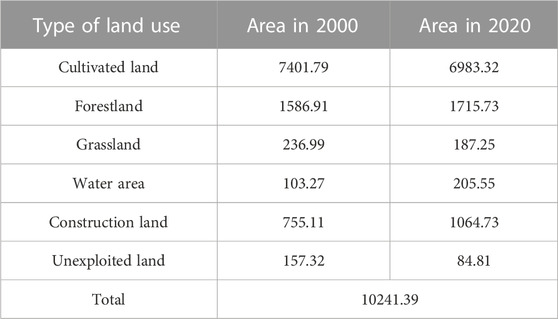
TABLE 4. Area of different land use types in Siping City in 2000 and 2020 (km2).
3.2 Results of ecosystem health assessment
3.2.1 Natural health changes of ecosystem
The spatial and temporal distribution of the natural health index of the ecosystem of Siping City in 2000 and 2020 is shown in Figure 4. From the spatial perspective, the health index in central and eastern hilly areas was higher than that in the central and western plains and was generally above 0.65. The natural health index was lower than 0.55 in most low-relief areas, especially in the urban areas of Shuangliao, Yitong County, and Lishu, in which the health index was mostly lower than 0.35. This is because the land use type for these areas was homogenous and did not have a diverse structure, which resulted in decreases in the vigor and organization of the ecosystem.
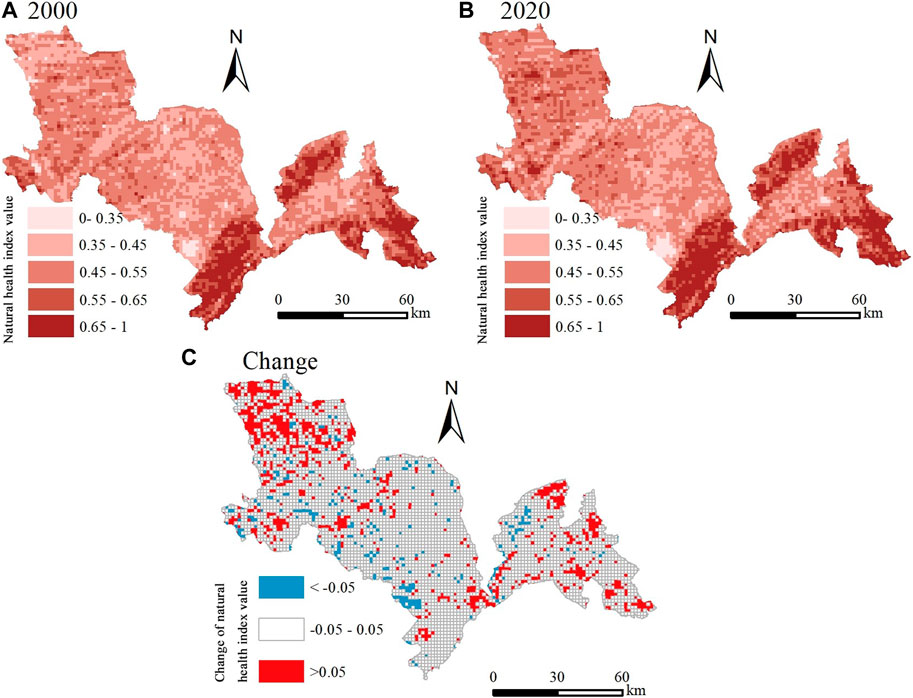
FIGURE 4. Natural index of ecosystem health in (A) 2000 and (B) 2020, and (C) its temporal changes.
From the temporal perspective, the mean value of the natural health index was 0.51 in 2000 and 0.53 in 2020, indicating that the level of ecosystem health slightly increased. The trend of improvement was obvious especially in western Shuangliao. In this county, the increasing areas of forestland, grassland and water areas tended to be spatially concentrated, resulting in the increase of the ecosystem’s vigor, organization and resilience. The health level in the central part showed little change as a whole, only improving in the areas around the newly added forestland while decreasing in the areas where the construction land expanded. In the eastern part, the natural health of the ecosystem was generally better than other parts and also displayed an increasing trend from 2000 to 2020.
3.2.2 Changes of the ecosystem service index
As depicted in Figure 5, the ecosystem services in Siping City demonstrated substantial spatiotemporal variations. More specifically, the eastern hilly area and the southwest part where forestland and grassland are concentrated provided the best ecosystem service in 2020, and the service index was generally above 0.25. The ecosystem service index in other plain areas was poor (<0.15), especially around the densely populated urban areas and townships and in the northwest where unexploited land was concentrated. Regarding the temporal changes, the average ecosystem service index slightly increased from 0.21 in 2000 to 0.23 in 2020. Improvements in ecosystem services were particularly visible in the central and eastern parts of the city, while in area surrounding key cities and other newly built areas, the ecosystem services declined.
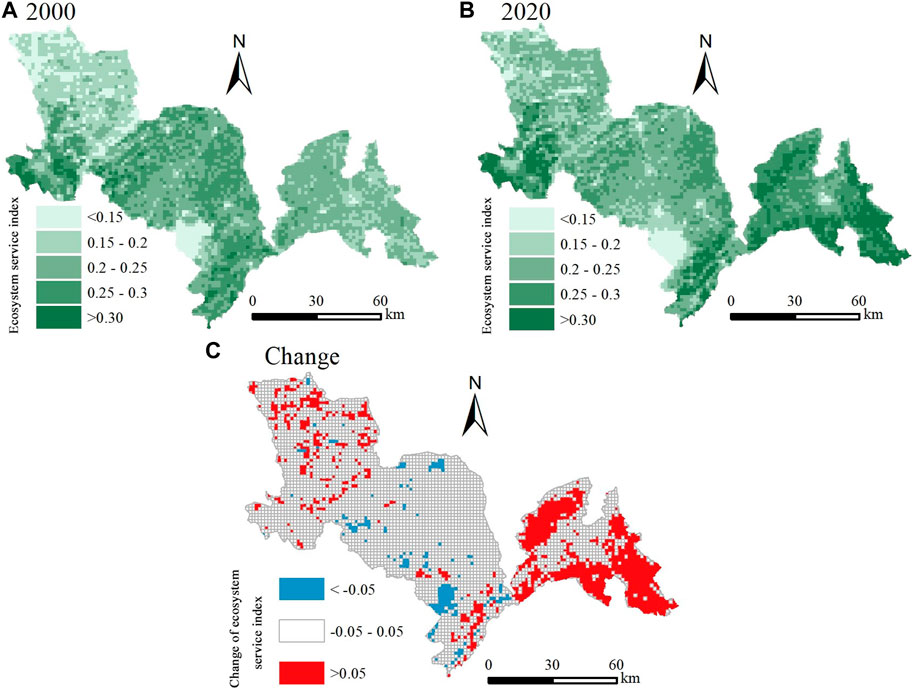
FIGURE 5. Ecosystem service index in (A) 2000 and (B) 2020, and (C) its temporal changes.
The specific ecosystem service function maps in 2000 and 2020 are shown in Figure 6. In summary, the ecosystem’s functions for water conservation, soil conservation and food production of the study area improved, while the functions for biodiversity protection and wind prevention and sand fixation deteriorated. From the spatial perspective, the eastern part mainly provided services of water conservation, soil conservation and biodiversity protection, while windbreak and sand fixation were the most important service in the western part. For the central part, especially Lishu, food production was the most important function due to its vast areas of cultivated land. Additionally, due to the lack of precipitation in 2000, a considerable difference in soil conservation and grain production was observed between the two periods, indicating that the ability to resist disasters needs to be strengthened in this region (Figure 6).
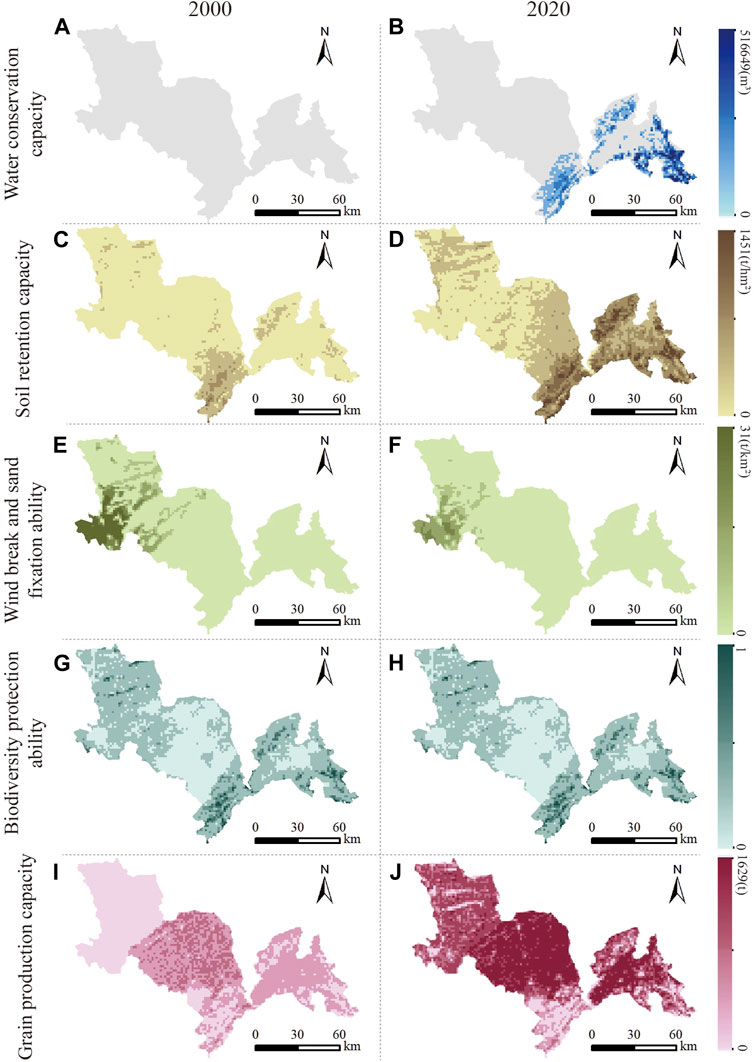
FIGURE 6. Assessments of ecosystem services in 2000 and 2020 for water conservation capacity (A, B), soil retention capacity (C, D), wind break and sand fixation capacity (E, F), biodiversity protection ability (G, H), and grain production capacity (I, J).
3.2.3 Changes of comprehensive ecosystem health
The average comprehensive ecosystem health index in the study was 0.51 in 2020 and 0.53 in 2020, showing that both investigated years had a medium level of ecosystem health. The comprehensive ecosystem health index was classified into five levels, I-V, referring to the health status of very healthy, healthy, normal, unhealthy and very healthy. The number of grids of I-V levels were 538, 814, 2594, 755 and 252, accounting for 10.86%, 16.43%, 52.37%, 15.24% and 5.09% of the total number of grids, respectively. In terms of spatial distribution, the grids of level I and level II were mainly distributed in the eastern mountainous area and the southwest artificial shelterbelt area. Level III covered the largest area, including the middle of Yitong, Lishu and the northern plain of Shuangliao. Level IV and level V were mainly distributed in the central and western parts of Siping City, and also concentrated in Yitong (Figure 7).
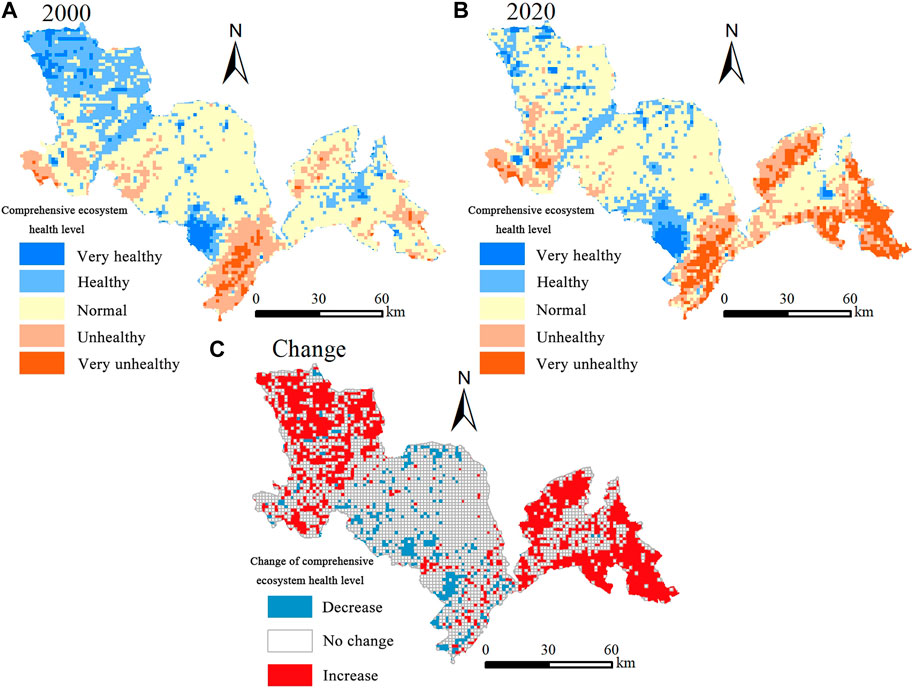
FIGURE 7. The comprehensive ecosystem health level in (A) 2000 and (B) 2020, and (C) its temporal changes.
There was a slight increase in the comprehensive health index from 2000 to 2020. More specifically, the number of Level I grids increased by 413, while the level IV and V grids decreased by 466 and 70. The most identifiable increase occurred again in the eastern and western parts of the study area, while the western part mainly improved from level IV to level III. The level of comprehensive ecosystem health in the central part of the city remained basically unchanged, although there were some decreases in ecosystem health in some patches due to the influence of urban expansion.
3.3 Ecological restoration pattern
3.3.1 Ecological restoration zone
Ecological restoration zones were classified based on hotspot analysis, which was used to analyse the spatial pattern of ecosystem services of water conservation, soil conservation, windbreak and sand fixation, biodiversity protection and food production, as can be seen in Figure 8. The hotspots of water conservation service were mainly distributed in Daheishan and its western area, where there were abundant precipitation and extensive river networks, most of which were also hotspots for soil conservation service. The hotspots of windbreak and sand fixation service were distributed in the west of Siping City, most of which were in Shuangliao. The climate in these areas is relatively dry and windy weather is frequent in spring and autumn. The hotspots of biodiversity protection service were found mainly in the east, in accordance with water conservation and soil conservation services. Hotspots of the food production service were mainly located in Lishu, which is a major grain production county, famous for its conservation tillage model known as the “Lishu model”. Based on the analysis of the superposition of the hotspot maps of various ecosystem services, together with the consideration of the climatic conditions of Siping City, the division of ecological restoration areas of Siping City was obtained through smooth processing (Figure 8F).
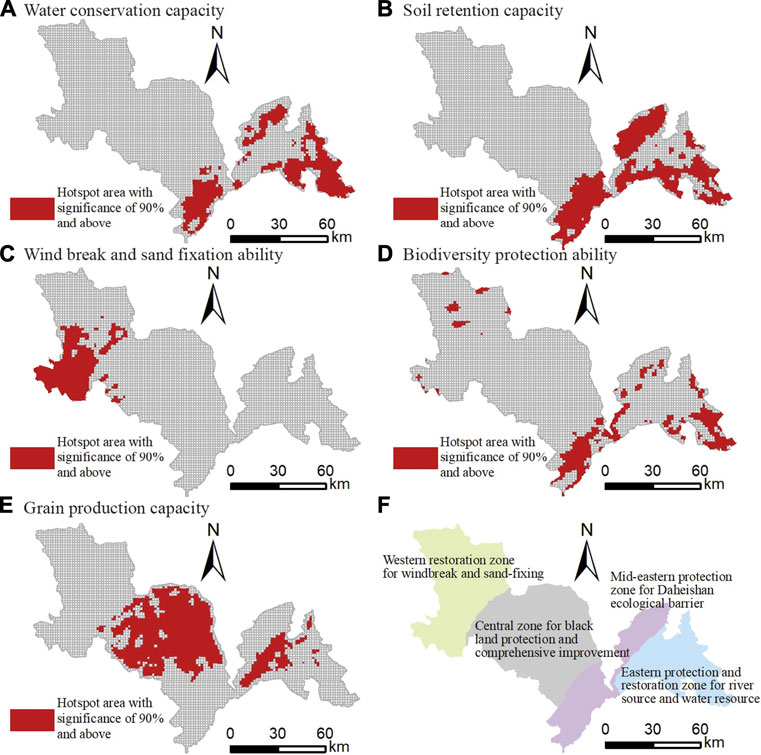
FIGURE 8. (A–E) Hotspot distribution of five types of ecosystem services and (F) ecological restoration areas.
Based on the results from hotspot analysis, the entire study area was divided into four ecological restoration zones (Figure 8), including the windbreak and sand-fixing in the western part, the black soil protection and reclamation zone in the middle part, the Daheishan ecological shelter zone in the central and eastern part and the water restoration zone in the eastern part, which account for 28.12%, 37.05%, 16.53% and 18.29% of the total area. Specifically, the black soil protection zone, which was located in central plains, serves as an important grain production base. The ecological shelter zone in the central and eastern part was mainly distributed along Daheishan and has equal importance to biodiversity protection and soil conservation. Precipitation in the water restoration zone in the eastern part is abundant and mainly responsible for water conservation, as well as soil conservation and biodiversity protection.
3.3.2 Ecological protection units
Based on the results of the ecosystem health assessment for 2020, grids with a very healthy state were identified as the ecological protection units. Considering that Erlongshan Reservoir covers a large area and is an important area for drinking water protection in Siping City, grids covered by the reservoir were also identified as ecological protection units. The total area of ecological protection units was 1,189.83 km2, accounting for 11.62% of the total area of Siping City.
Based on the comprehensive consideration of ecosystem services provided by each ecological protection unit, the specific service with normalized value above 0.8 was regarded as the main function for each unit. Erlongshan Reservoir protection unit was directly identified as the protection unit for water conservation, and other units were divided according to their main functions. Based on the aforementioned criteria, the protection units were divided into 5 types, namely, water conservation-biodiversity protection units, soil conservation-biodiversity protection units, soil conservation units, water conservation units and windbreak and sand fixation units, with areas of 534.69 km2, 324.94 km2, 172.59 km2, 68.54 km2 and 89.07 km2, accounting for 5.22%, 3.17%, 1.69%, 0.67% and 8.70% of the total area.
Water conservation and biodiversity protection units are mainly distributed in the eastern part of Yitong County, which has equal important for maintaining water supply and biodiversity. The soil conservation-biodiversity protection units are mainly distributed in the south of Daheishan, which is home to Banla Mountain National Forest Park, thus playing an important role for preserving the biodiversity in this region. Water conservation units are mainly distributed in the area where Erlongshan Reservoir is located, which is the main water supply source of Siping City and is also important for water storage and flood control. The windbreak and sand fixation units are mainly located in the south of Sishuangliao City, where there are plenty of artificial shelter forests formed by the construction of the Three-North Forest Protection System (Figure 9A).
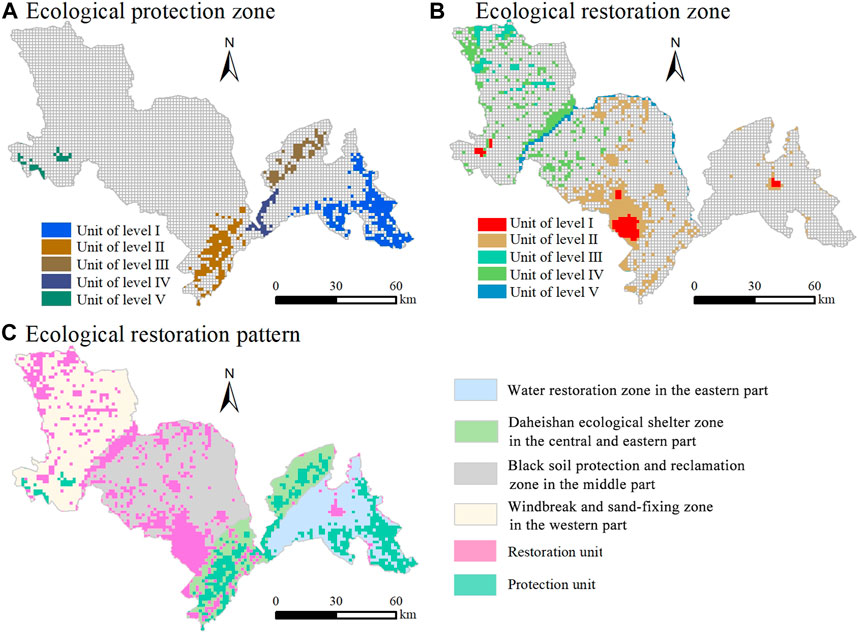
FIGURE 9. Delineation of (A) ecological protection and (B) restoration zones and (C) the ecological restoration pattern of Siping City.
3.3.3 Ecological restoration units
Contrary to the protection units, grids which were identified to be unhealthy and very unhealthy as well as grids with decreasing health index were identified as ecological restoration units. Its total area was 2009.38 km2, accounting for 19.62% of the total study area.
Considering the causes for the damage of ecological restoration units and degraded ecosystem services, those with the largest normalized value were taken as services that each unit needs to improve. Units located in the built-up area of each county were identified as the urban restoration units, those located in nature reserves and wetland-grassland ecosystems were determined as biodiversity protection units, the units located in the East Liao River region were determined as East Liao River restoration units for water environment protection, and the other units were divided according to functions which are needed to improve. Eventually, restoration units were divided into 5 types, namely, urban restoration units, restoration units for soil conservation, biodiversity protection units, restoration units for windbreak and sand fixing and East Liao River restoration units for water environment protection, with areas of 178.63 km2, 919.83 km2, 178.70 km2, 640.38 km2 and 91.84 km2, accounting for 1.74%, 8.98%, 1.74%, 6.25% and 0.90% of the total area of Siping City, respectively.
Urban restoration units were mainly distributed in the urban areas of Siping, Lishu, Yitong and Shuangliao. The type of land use in these areas was not diverse, the degree of land hardening was high, the degree of vegetation coverage was low, and the ecological space within the city was insufficient. Restoration units for soil conservation were mainly distributed in the central plain and the eastern mountain valleys. In the central area, farmland was cultivated intensively, leading to thinner soil layers with degraded soil physical structure and deteriorated soil fertility. For the eastern mountain valleys, as influenced by terrain and human activities, the degree of vegetation coverage decreased and the service for soil conservation therefore needs improvement. Biodiversity protection units were mainly distributed in the north part of Shuangliao, where there are important wetlands such as Shuangliao Baihe Provincial Nature Reserve and the National Wetland Park of Jiashu Taihu. However, these units are currently facing threats such as soil salinization and insufficient ecological flow of wetland water resources. Restoration units for windbreak and sand fixing were mainly located in Shuangliao and the east of Lishu, the eastern edge of Horqin, and are regarded as the “front position” and the “first line of defence” for the prevention and control of desertification expansion in Jilin Province. Due to the implementation of the “Three-north Forest Protection Project”, there are a large number of shelter forests for farmland planted at present. However, there are still some problems such as the damage of shelter forests in these areas. East Liao River restoration units for water environment protection were mainly along the East Liao River. As an important tributary of the Liao River, affected by agricultural irrigation over the years, the water volume had decreased significantly, most of the buffer zone of the river bank has transformed into cultivated land, and the water pollution was also serious (Figure 9B). Finally, the ecological restoration areas, ecological protection and restoration units were integrated to form the ecological restoration pattern of the entire study area (Figure 9C).
4 Discussion
4.1 Analysis of ecosystem health assessment results
From 2000 to 2020, the ecosystem health of Siping City displayed an overall improvement, which could be largely attributed to the increase in forestland area as well as precipitation. Due to the fourth and fifth phases of the “Three-north Forest Protection Project” and the Grain-to-Green policy (Wang et al., 2017; Wang et al., 2020), the forested area of Siping City increased by 128.82 km2, and the shelterbelt increased as well. More importantly, the landscape connectivity in forestland in Daheishan area enhanced during the past 20 years. In addition, the difference in precipitation between the two investigated periods contributed to the enlarged water area and the abundant reservoir stock, which proved to be beneficial for water conservation, food production and other important ecosystem services (Grizzetti et al., 2019). However, following rapid urbanization, the ecosystem health in rapidly expanded areas was deteriorated, especially around the central urban area of Siping City. These areas experienced large conversions from cultivated or forestland to construction land, and therefore lost significant ecosystem services, thus needing urgent restoration (Jamean and Abas, 2023; Ren C. Y. et al., 2023).
4.2 Selection of specific ecological restoration measures
The delineation of restoration areas and ecological restoration units was achieved by an integrated methodological framework. The windbreak and sand-fixing zone was located in the agro-pasture ecotone where the ecosystems are vulnerable. This area is also characterized by severe soil salinization, grassland degradation and shrinking wetland. Therefore, the principal restoration method should be restoring the ecological functions of grassland and wetland (Kuang et al., 2022), and biodiversity thus could be preserved along with the improvement of habitat quality (Liu et al., 2023). The black soil protection and reclamation zone in the middle part was situated in places where human activities were active with high intensity of agricultural production. It is also plagued by black soil degradation, soil erosion, and other ecological problems (Wen et al., 2021). In this regard, the restoration purpose should be improving soil quality, controlling soil loss, and enhancing water preservation (Du et al., 2023; Wang N. et al., 2023). The Daheishan ecological shelter zone in the central and eastern part was characterized by hilly regions and also experienced soil loss in areas with low vegetation coverage. In the meantime, it was also distributed with abandoned mines in between mountains. The corresponding restoration method should therefore be controlling excessive soil loss, increasing the area of forest land, and pollution regulation (Yevugah et al., 2021). The water restoration zone in the eastern part was fragmented by the mountains, the Yidan, and the Gushan Rivers, which was also an important area for protecting water resources and biodiversity for Siping City. The restoration purpose should be water preservation, controlling soil loss, and conserving biodiversity (Liu et al., 2023; Ren D. F. et al., 2023).
Forestland, grassland, and water sources are the protection priorities in each unit. Production and development should be strictly restricted, and buffer zones should be established to reduce the impact of human activities as well as to maintain and improve ecosystem health (Qi et al., 2023; Wang S. et al., 2023). The target of the urban restoration units was the dispersedly distributed forestland and rivers. Specific measures such as increasing urban parks (Zeng and Liu, 2023), expanding urban green areas (Li F. Z. et al., 2020), restoring natural revetments and building ecological buffers alongside rivers to conserve water resources (Li W. B. et al., 2020). In addition, restoration of ecological corridors such as urban greenways and watercourses is also worthy of attention (Ren D. F. et al., 2023). The restoration target in the soil conservation and restoration units mainly consisted of forests and farmland. Sloping farmland with serious soil loss should be processed with wide field terraces and ecological grass gullies (Taleb and Kayed, 2021). Engineering restoration should be performed for erosion gullies, and for areas characterized by larger slopes, measures such as returning farmland to forest or grassland and afforestation should be further implemented (Wang et al., 2017). As for human-impacted forests with low vegetation coverage, restricted disturbance areas should be delimited to promote the natural restoration (Wang et al., 2020). Seriously damaged areas, such as abandoned mines, appropriate engineering methods should be adopted first to promote vegetation restoration (Yevugah et al., 2021).
In the windbreak and sand fixation restoration unit, targets are mainly forestland and grassland. The construction of windbreak forest belt should be strengthened (Taleb and Kayed, 2021). Also, previously planted forests should be protected. Moreover, in order to restore the ecosystem function of grassland, measures such as artificial grass planting, fences for banning grazing and saline-alkali land regulation should be implemented in the degraded areas according to the underlying causes (Yang et al., 2022). The restoration objectives in the biodiversity restoration unit are wetland and forestland. Nature reserves and monitoring stations should be built for protected species (Zhang et al., 2023). Expanding the water area, forestland and grassland in the protected area is also considered necessary. Ecological corridors should be established to enhance the connectivity of habitats to fulfil migration needs of species.
4.3 Limitations and prospects
The assessment methods proposed in this study made a comprehensive assessment of the regional ecosystem health and could help identify the ecological protection and restoration units in the black soil region. However, limitations of the proposed method include that the selection of vitality indicators did not include water ecosystems, which might have resulted in lower assessment results. Second, due to limited data availability, habitat quality assessment in the InVEST model were adopted to represent the function of an ecosystem to maintain biodiversity, which might be different to the actual situation (Hu et al., 2023). It could be replaced with a species distribution model for better fitting. Third, the ecological protection and restoration units were identified, but the sequence of restoration had not been considered yet. Future studies should therefore try to include the sequence of ecological restoration, in order to better inform the planning of ecological restoration measures.
5 Conclusion
The comprehensive ecosystem health based on the VORS concept slightly improved in the study area from 2000 to 2020, with the natural index of ecosystem health increasing from 0.51 to 0.53, and the ecosystem service index increasing from 0.21 to 0.23. Areas with improved ecosystem health were mainly distributed in the east part of Yitong and the west part of Shuangliao, while degraded areas were mainly around the built-up areas Based on hotspot analysis of the ecosystem health, Siping City was divided into four ecological restoration zones, namely, the windbreak and sand-fixing zone in the western part, the black soil protection and reclamation zone in the middle part, the Daheishan ecological shelter zone in the central and eastern part and the water restoration zone in the eastern part, accounting for 28.12%, 37.05%, 16.53% and 18.29% of the total area. Ecological protection units and restoration units were identified, and further sub-classified into 10 units, which can serve as references for targeted soil and water conservation, biodiversity protection and urban restoration measures to improve ecosystem stability and sustainability. This proposed methodological framework serves as a basis for reconstructing ecological restoration in the black soil region, and a reference for making restoration plans elsewhere.
Data availability statement
The original contributions presented in the study are included in the article/Supplementary Material, further inquiries can be directed to the corresponding author.
Author contributions
Conceptualization, DF, PZ, and DW; data curation, DF and PZ; formal analysis, DF and PZ; funding acquisition, DW; methodology, DF, PZ, DW, and PS; writing—original draft: DF, PZ, and PS; writing—review and editing, DF, PZ, DW, and PS; supervision, DW and PS.
Funding
This study was funded by the Natural Science Foundation of Jilin Province, China (grant number 20230101079JC).
Conflict of interest
The authors declare that the research was conducted in the absence of any commercial or financial relationships that could be construed as a potential conflict of interest.
Publisher’s note
All claims expressed in this article are solely those of the authors and do not necessarily represent those of their affiliated organizations, or those of the publisher, the editors and the reviewers. Any product that may be evaluated in this article, or claim that may be made by its manufacturer, is not guaranteed or endorsed by the publisher.
References
Berta, A., Noszczyk, T., Soromessa, T., and Elias, E. (2020). The InVEST habitat quality model associated with land use/cover changes: A qualitative case study of the winike watershed in the omo-gibe basin, southwest Ethiopia. Remote Sens. 12, 1103. doi:10.3390/rs12071103
Cai, H. S., Chen, Y., Zha, D. P., Zeng, H., Shao, H., and Hong, S. L. (2020). Principle and method for ecological restoration zoning of territorial space based on the dominant function. Trans. Chin. Soc. Agric. Eng. 36 (15), 261–270+325.
Cao, Y., Wang, J. Y., and Li, G. Y. (2019). Ecological restoration for territorial space: Basic concepts and foundations. China Land Sci. 33 (07), 1–10. doi:10.11994/zgtdkx.20190625.083700
Chen, W. X., Ye, X. Y., Li, J. F., Fan, X., Liu, Q. S., and Dong, W. C. (2019). Analyzing requisition-compensation balance of farmland policy in China through telecoupling: A case study in the middle reaches of yangtze river urban agglomerations. Land Use Policy 83, 134–146. doi:10.1016/j.landusepol.2019.01.031
Cui, W. H., Liu, J. G., Jia, J. L., and Wang, P. F. (2021). Terrestrial ecological restoration in China: Identifying advances and gaps. Environ. Sci. Eur. 33 (1), 123. doi:10.1186/S12302-021-00563-2
Deng, Y. X., and Yang, R. (2021). Influence mechanism of production-living-ecological space changes in the urbanization process of guangdong Province, China. Land 10 (12), 1357. doi:10.3390/land10121357
Du, P. F., Huang, D. H., Liu, B., and Qin, W. (2023). Using source fingerprinting techniques to investigate sediment sources during snowmelt and rainfall erosion events in a small catchment in the black soil region of Northeast China. Land 12 (3), 542. doi:10.3390/land12030542
Fu, B. J. (2021). Several key points in territorial ecological restoration. Bull. Chin. Acad. Sci. 36 (01), 64–69. doi:10.16418/j.issn.1000-3045.20201222001
Fu, Y. J., Shi, X. Y., He, J., and Qu, L. L. (2020). Identification and optimization strategy of county ecological security pattern: A case study in the loess plateau, China. Ecol. Indic. 112, 106030. doi:10.1016/j.ecolind.2019.106030
Ghosal, K., and Bhattacharya, S. D. (2020). A review of RUSLE model. J. Indian Soc. Remote. 48 (4), 689–707. doi:10.1007/s12524-019-01097-0
Gong, Q. H., Zhang, H. O., Ye, Y. Y., and Yuan, S. X. (2020). Planning strategy of land and space ecological restoration under the framework of man-land system coupling: Take the Guangdong-Hong Kong-Macao Greater BayArea as an example. Geogr. Res. 39 (09), 2176–2188. doi:10.11821/dlyj020200413
Grizzetti, B., Liquete, C., Pistocchi, A., Vigiak, O., Zulian, G., Bouraoui, f., et al. (2019). Relationship between ecological condition and ecosystem services in European rivers, lakes and coastal waters. Sci. Total Environ. 671, 452–465. doi:10.1016/j.scitotenv.2019.03.155
Gu, X. R., Yang, J. R., and Mao, X. Q. (2002). Ecological analysis on urban sustainability-Guangzhou as a case city. Urban Environ. Urban Ecol. 3, 26–28.
Hazbavi, Z., Sadeghi, S. H., Gholamalifard, M., and Davudirad, A. A. (2020). Watershed health assessment using the pressure–state–response (PSR) framework. Land Degrad. Dev. 31 (1), 3–19. doi:10.1002/ldr.3420
Honig, K. A., and Fulé, P. Z. (2012). Simulating effects of climate change and ecological restoration on fire behaviour in a south-Western USA ponderosa pine forest. Int. J. Wildland Fire 21 (6), 731–742. doi:10.1071/WF11082
Hu, N., Xu, D., Zou, N., Fan, S. X., Wang, P. Y., and Li, Y. Y. (2023). Multi-scenario simulations of land use and habitat quality based on a PLUS-InVEST model: A case study of baoding, China. Sustainability 15 (1), 557. doi:10.3390/SU15010557
Jackson, S. T., and Hobbs, R. J. (2009). Ecological restoration in the light of ecological history. Science 325 (5940), 567–569. doi:10.1126/science.1172977
Jamean, E. S., and Abas, A. (2023). Valuation of visitor perception of urban forest ecosystem services in kuala lumpur. Land 12 (3), 572. doi:10.3390/land12030572
King, E. G., and Hobbs, R. J. (2006). Identifying linkages among conceptual models of ecosystem degradation and restoration: Towards an integrative framework. Restor. Ecol. 14 (3), 369–378. doi:10.1111/j.1526-100X.2006.00145.x
Kuang, W. H., Liu, J. Y., Tian, H. Q., Shi, H., Dong, J. W., Song, C. Q., et al. (2022). Cropland redistribution to marginal lands undermines environmental sustainability. Natl. Sci. Rev. 9 (1), nwab091–78. doi:10.1093/nsr/nwab091
Lei, D., Zhang, Y., Ran, Y., Gao, L., Li, J., Li, Z., et al. (2023). Assessment of ecosystem health based on landscape pattern in ecologically fragile regions at different spatial scales: A case study of dianchi lake basin, China. Front. Environ. Sci. 11, 1076344. doi:10.3389/fenvs.2023.1076344
Li, F. Z., Li, F. Y., Li, S. J., and Long, Y. (2020). Deciphering the recreational use of urban parks: Experiments using multi-source big data for all Chinese cities. Sci. Total Environ. 701, 134896. doi:10.1016/j.scitotenv.2019.134896
Li, W. B., Wang, D. Y., Liu, S. H., Zhu, Y. L., and Yan, Z. R. (2020). Reclamation of cultivated land reserves in Northeast China: Indigenous ecological insecurity underlying national food security. Int. J. Environ. Res. Public Health 17 (4), 1211. doi:10.3390/ijerph17041211
Li, W., Wang, Y., Xie, S., and Cheng, X. (2021). Coupling coordination analysis and spatiotemporal heterogeneity between urbanization and ecosystem health in Chongqing municipality, China. Sci. Total Environ. 791, 148311. doi:10.1016/j.scitotenv.2021.148311
Liu, W., Zhan, J. Y., Zhai, Y. B., Zhao, F., Asiedu, K. M., Wang, C., et al. (2023). Linking ecosystem service supply and demand to evaluate the ecological security in the pearl river delta based on the pressure-state-response model. Int. J. Environ. Res. Public Health 20 (5), 4062. doi:10.3390/ijerph20054062
Ni, Q. L., Hou, H. P., Ding, Z. Y., Li, Y. B., and Li, J. R. (2020). Ecological remediation zoning of territory based on the ecological security pattern recognition: Taking Jiawang district of Xuzhou city as an example. J. Nat. Resour. 35 (01), 204–216. doi:10.31497/zrzyxb.20200117
Pan, Z. Z., He, J. H., Liu, D. F., and Wang, J. W. (2020). Predicting the joint effects of future climate and land use change on ecosystem health in the Middle Reaches of the Yangtze River Economic Belt, China. Appl. Geogr. 124, 102293. doi:10.1016/j.apgeog.2020.102293
Peng, J., Li, B., Dong, J. Q., Liu, Y. X., Lv, D. N., Du, Y. Y., et al. (2020). Basic logic of territorial ecological restoration. China Land Sci. 34 (05), 18–26. doi:10.11994/zgtdkx.20200427.124442
Peng, J., Liu, Y. X., Li, T. Y., and Wu, J. S. (2017). Regional ecosystem health response to rural land use change: A case study in lijiang city, China. Ecol. Indic. 72, 399–410. doi:10.1016/j.ecolind.2016.08.024
Peng, J., Yang, Y., Liu, Y. X., Hu, Y. N., Du, Y. Y., Meersmans, J., et al. (2018). Linking ecosystem services and circuit theory to identify ecological security patterns. Sci. Total Environ. 644, 781–790. doi:10.1016/j.scitotenv.2018.06.292
Qi, L. L., Shi, P., Dvorakova, K., Van, O. K., Sun, Q., Yu, H. Q., et al. (2023). Detection of soil erosion hotspots in the croplands of a typical black soil region in Northeast China: Insights from sentinel-2 multispectral remote sensing. Remote Sens. 15 (5), 1402. doi:10.3390/RS15051402
Rapport, D. J., Costanza, R., and Mcmichael, A. J. (1998). Assessing ecosystem health. Trends Ecol. Evol. 13 (10), 397–402. doi:10.1016/S0169-5347(98)01449-9
Ren, C. Y., Jiang, H. L., Xi, Y. B., Liu, P., and Li, H. Y. (2023). Quantifying temperate forest diversity by integrating GEDI LiDAR and multi-temporal sentinel-2 imagery. Remote Sens. 15 (2), 375. doi:10.3390/rs15020375
Ren, D. F., Cao, A. H., and Wang, F. Y. (2023). Response and multi-scenario prediction of carbon storage and habitat quality to land use in liaoning Province, China. Sustainability 15 (5), 4500. doi:10.3390/su15054500
Roilo, S., Engler, J. O., Václavík, T., and Cord, A. F. (2023). Landscape-level heterogeneity of agri-environment measures improves habitat suitability for farmland birds. Ecol. Appl. 2720, e2720. doi:10.1002/eap.2720
Singh, D., and Singh, B. (2020). Investigating the impact of data normalization on classification performance. Appl. Soft Comput. 97, 105524. doi:10.1016/j.asoc.2019.105524
Spiegel, J. M., Bonet, M., Yassi, A., Molina, E., Concepcion, M., and Mas, P. (2001). Developing ecosystem health indicators in Centro-Habana a community-basedapproach. Ecosyst. Health 7 (1), 15–26. doi:10.1046/j.1526-0992.2001.710015.x
Suding, K. N. (2011). Toward an era of restoration in ecology: Successes, failures, and opportunities ahead. Annu. Rev. 42 (1), 465–487. doi:10.1146/annurev-ecolsys-102710-145115
Taleb, H. M., and Kayed, M. (2021). Applying porous trees as a windbreak to lower desert dust concentration: Case study of an urban community in Dubai. Urban For. Urban Gree 57, 126915. doi:10.1016/j.ufug.2020.126915
Turner, K. G., Anderson, S., Gonzales-Chang, M., Costanza, R., Courville, S., Dalgaard, T., et al. (2016). A review of methods, data, and models to assess changes in the value of ecosystem services from land degradation and restoration. Ecol. Model. 319, 190–207. doi:10.1016/j.ecolmodel.2015.07.017
Wang, B., Gao, P., Niu, X., and Sun, J. N. (2017). Policy-driven China’s grain-to-green program: Implications for ecosystem services. Ecosyst. Serv. 27, 38–47. doi:10.1016/j.ecoser.2017.07.014
Wang, C., Chu, X., Zhan, J. Y., Wang, P., Zhang, F., and Xin, Z. L. (2020). Factors contributing to efficient forest production in the region of the Three-North shelter forest program, China. Sustainability 12 (1), 302. doi:10.3390/su12010302
Wang, N., Sun, M., Ye, J., Wang, J., Liu, Q., Li, M., et al. (2023). Spatial downscaling of forest above-ground biomass distribution patterns based on Landsat 8 OLI images and a multiscale geographically weighted regression algorithm. Forests 14 (3), 526. doi:10.3390/f14030526
Wang, S., Xu, X. L., and Huang, L. (2023). Spatial and temporal variability of soil erosion in Northeast China from 2000 to 2020. Remote Sens. 15 (1), 225. doi:10.3390/rs15010225
Wang, T., Kang, F. F., Cheng, X. Q., Han, H. R., and Ji, W. J. (2016). Soil organic carbon and total nitrogen stocks under different land uses in a hilly ecological restoration area of North China. Soil & Till. Res. 163, 176–184. doi:10.1016/j.still.2016.05.015
Wen, Y. R., Kasielke, T., Li, H., Zhang, B., and Zepp, H. (2021). May agricultural terraces induce gully erosion? A case study from the black soil region of Northeast China. Sci. Total Environ. 750, 141715. doi:10.1016/j.scitotenv.2020.141715
Wu, J., ChengXu, D. Y., Huang, Q., and Feng, Z. (2021). Spatial-temporal change of ecosystem health across China: Urbanization impact perspective. J. Clean. Prod. 326, 129393. doi:10.1016/j.jclepro.2021.129393
Xiao, R., Liu, Y., Fei, X. F., Yu, W. X., Zhang, Z. H., and Meng, Q. X. (2019). Ecosystem health assessment: A comprehensive and detailed analysis of the case study in coastal metropolitan region, eastern China. Ecol. Indic. 98, 363–376. doi:10.1016/j.ecolind.2018.11.010
Xu, J., Xiao, Y., and Xie, G. D. (2019). Analysis on the spatio-temporal patterns of water conservation services in beijing. J. Resour. Ecol. 10 (4), 362–372. doi:10.5814/j.issn.1674-764x.2019.04.003
Yang, S., Hao, X. H., Xu, Y. M., Yang, J. J., and Su, D. R. (2022). Meta-analysis of the effect of saline-alkali land improvement and utilization on soil organic carbon. Life 12 (11), 1870. doi:10.3390/life12111870
Yevugah, L. L., Darko, G., and Bak, J. (2021). Does mercury emission from small-scale gold mining cause widespread soil pollution in Ghana? Environ. Pollut. 284, 116945. doi:10.1016/J.ENVPOL.2021.116945
Zeng, L. G., and Liu, C. Q. (2023). Exploring factors affecting urban park use from a geospatial perspective: A big data study in fuzhou, China. Int. J. Environ. Res. Public Health 20 (5), 4237. doi:10.3390/ijerph20054237
Keywords: ecosystem restoration, ecological health assessment, black soil region, Northeast China, ecosystem services
Citation: Feng D, Zhou P, Wang D and Shi P (2023) Reconstructing the ecological restoration pattern from the perspective of ecosystem health assessment in a typical black soil region of Northeast China. Front. Environ. Sci. 11:1184517. doi: 10.3389/fenvs.2023.1184517
Received: 11 March 2023; Accepted: 31 March 2023;
Published: 11 April 2023.
Edited by:
Yingnan Zhang, Zhejiang University, ChinaReviewed by:
Yuhan Zheng, Hunan University, ChinaKun Zhang, The University of Hong Kong, Hong Kong SAR, China
Copyright © 2023 Feng, Zhou, Wang and Shi. This is an open-access article distributed under the terms of the Creative Commons Attribution License (CC BY). The use, distribution or reproduction in other forums is permitted, provided the original author(s) and the copyright owner(s) are credited and that the original publication in this journal is cited, in accordance with accepted academic practice. No use, distribution or reproduction is permitted which does not comply with these terms.
*Correspondence: Panpan Zhou, zhoupp20@mails.jlu.edu.cn