Construction of an ecological security pattern for the Guanzhong Plain urban agglomeration: Scale perspective and hierarchy demand
 Hao Ye
 Yongyong Song
 Dongqian Xue1
  Siyou Xia
- 1School of Geography and Tourism, Shaanxi Normal University, Xi’an, China
- 2Key Laboratory of Regional Sustainable Development Modeling, Institute of Geographic Sciences and Natural Resources Research, Chinese Academy of Sciences, Beijing, China
- 3College of Resources and Environment, University of Chinese Academy of Sciences, Beijing, China
As areas of dense populations and high economic activity, urban agglomerations have driven an overall increase in economic efficiency; however, the associated ecological risks are becoming increasingly apparent. The construction of ecological security patterns (ESPs) is an important approach for ensuring the ecological security of urban agglomerations, thereby achieving coordinated development of society, economy and ecology. Previous studies on ESPs have rarely considered the demand for ecosystem services at multiple scales and have accordingly failed to accurately identify important ecological sources. Here, we propose a novel method based on multi-scale ecosystem service demand to identify ecological sources, which can more accurately identify the ecological source meeting the regional sustainable development. Selecting the Guanzhong Plain urban agglomeration (GPUA) as study area, we constructed a resistance surface by comprehensively considering natural and anthropogenic disturbances. We found high resistance areas are mainly concentrated in highly urbanized areas with Xi’an as the core. In addition, we performed minimum cumulative resistance and gravity model to obtain and classify ecological corridors. The results revealed that the ecological sources identified in this study can enhance the connectivity of the inner regions of the GPUA and the linkage between north and south ecological corridors. The ecological sources were found to be concentrated in the southern Qinling Mountains, with an area of 28,780.02 km2, accounting for 26.85% of entire region. Furthermore, we identified 121 potential ecological corridors, 47 ecological nodes, and 49 ecological breakpoints, and established that the extent of land with a high level of ecological security accounts for 21.98% of the entire regional area. This study offers a new perspective for ESPs construction, which can provide a scientific basis and policy guidance for the optimization of spatial structure and the maintenance of ecological security in ecologically fragile urban agglomerations.
1 Introduction
Ecological security refers to the state in which the natural environment on which human depend is free from external interference and can continue to provide ecological services (Ma et al., 2004). Maintaining ecological security is the bottom line necessary for humans to achieve sustainable development in the Anthropocene era, and its essence is to provide a safe and stable environment for maintaining a viable human society (Guo et al., 2007). The construction of ecological security patterns (ESPs) is related to the harmony of the social activities and ecological protection. Moreover, it represents an important approach for ensuring the sustainable development of ecosystem services and maintenance of ecological security (Yu et al., 2009). As the main bodies promoting the new urbanization of the country and the most dynamic and potential core areas of economic development, whether urban agglomerations can achieve healthy, coordinated, and sustainable development will profoundly affect the developmental trajectory of China’s future social economy (Fang, 2014; Song et al., 2022). In recent years, rapid urbanization has brought substantial social and economic benefits, although in doing so has also created a series of negative impacts. High intensity urban construction and inappropriate land use have led to the imbalance of ecological space, the decline of ecosystem functions, and loss of biodiversity, thereby threatening the coordinated development of the social, economic, and ecological facets of urban agglomerations (Cao et al., 2020; Xiao et al., 2021; Li G D et al., 2022). Consequently, the scientific construction of ESPs for urban agglomerations and coordination of the contradiction between ecosystem protection and socio-economic development are of considerable significance for safeguarding national ecological security, promoting China’s ecological civilization construction, and striving to achieve United Nations sustainable development goals 9 and 15 (DESA, 2018; Xiong et al., 2021).
ESPs are an important embodiment of the integrity and health of natural ecosystems. It takes landscape ecology as the theoretical support and fully considers the mutual feedback between ecological elements and ecosystems (Gaaff and Reinhard, 2012; Saura et al., 2017). As early as the end of the 19th century, Howard proposed the theory of “Garden Cities” as a reference for urban planning, with the aim of achieving improvements in the living environment (Ahern, 1995). Subsequently, there has been a development in research focusing on ecological networks and green infrastructure construction integrated into urban planning strategies (Alexander, 2007; Fumagalli and Toccolini, 2012). Since the 1990s, rampant industrialization and urbanization have contributed to widening the disparity between China’s regional economic development and environmental regulation. In order to alleviate human–land conflicts and reduce regional ecological risks, domestic scholars, based on the theory of “anti-planning” (Yu, 1996), ecosystem services (Jin et al., 2021), landscape pattern optimization (Han et al., 2021), and other theories, have conducted in-depth research on ESPs from different perspectives, including ecological red line division (Lin et al., 2021), ecosystem service supply and demand (Zhang et al., 2019), and social equity (Cui et al., 2022). At present, research on the construction of ESPs covers a wide range of different spatial scales (national, regional, and landscape), involving typical regions such as arid areas in northwest China (Zhang and Wei, 2019), rapidly urbanizing areas (Ding et al., 2022), and agricultural pastoral ecotones (Wang et al., 2014). Generally, however, studies have tended to focus on river basin units, counties, towns, and other levels, particularly in urban areas, characterized by intense human activity and in which the economy is relatively well developed. In contrast, comparatively little attention has been devoted to typical areas of urban agglomeration characterized by fragile ecological environments. In addition, research to date has mainly focused on the construction of ESPs at a single scale (Chen et al., 2017; Zhang et al., 2022), which is limited by administrative boundaries. This approach not only fails to consider spatial unity of the natural conditions and the spatial spread of environmental pollution but also ignores the scale of correlation between landscape elements (Zhu et al., 2020; Yu et al., 2021). Therefore, it is essential to gain a more comprehensive theoretical understanding of the existing ESPs from a multi-scale perspective and broaden the empirical examination of ESPs.
The construction of ESPs can make an important contribution to the maintenance ecosystem service functions and biodiversity, and also represents an important planning approach for coordinating the relationship between social production and ecological maintenance (Peng et al., 2017). With the continued expansion of the scale of research on landscape ecological security patterns, the methodology of ESP construction has become increasingly more mature. At present, the research framework based on “source identification–resistance surface construction–ecological corridors extraction” has been widely applied in the ESPs construction (Wu et al., 2017; Guo et al., 2019). In this study, an ecological source refers to those habitat patches which have significant ecological security significance and provide high-level ecosystem services (Xie et al., 2020) and the objective of ESP construction is the identification of these sources. Research to date has mainly adopted two identification methods, one of which involves directly selecting woodland and grassland in landscape types as ecological sources (Aminzadeh and Khansefid, 2010; Vergnes et al., 2013), whereas the second entails the establishment of comprehensive evaluation indicators to obtain important ecological sources (Mandle et al., 2016; Yang et al., 2017; Peng et al., 2018a). Although quantitative assessments based on ecosystem services can be effective in identifying sources, owing to a lack of recognized evaluation criteria and indicator weighting methods, the assessment results tend to be subjective and some sources with high ecological service value can go unidentified (Peng et al., 2017).
Resistance surfaces provide a basis for corridor extraction, which can reflect the degree of obstacles to the expansion of ecological sources in space (Avon and Bergès, 2016). Generally, such resistance can be assigned in the light of land use types, although this approach does not reflect the process of human activities hindering the diffusion of ecological flow. Consequently, current research in increasingly being based the combined application of factors disturbing natural and social system to construct resistance surfaces (Ma et al., 2019; Dong et al., 2020). Ecological corridors serve as important conduits of flow and renewal of ecological elements in the ecological network, and can also provide migration channels for organisms. As such, they are of considerable significance from the perspectives of protecting biodiversity and maintaining landscape connectivity (Rushdi and Hassan, 2015; Santos et al., 2018). Minimum cumulative resistance (MCR) models (DiLeo et al., 2017) are characterized by simple processing, a convenient algorithm, and visual structure (Peng et al., 2018b), and MCR model can be employed to fully represent the minimum cost path of species migration in space and is the main method used to identify potential corridors. In addition, gravity model is often combined with MCR model to determine the relative importance of different corridors. With respect to the construction of ESPs for urban agglomerations, research mainly focuses on the macro-ESPs of urban agglomerations and the ecological support for overall regional development (Guo et al., 2007; Yang et al., 2017). However, it fails to fully take into consideration the demand of urban residents for ecosystem services, and has yet to establish correlations between the ecosystem processes, structures and functions at different scales, such as urban agglomerations and cities (Peng et al., 2017). Consequently, for scientific optimization of land spatial organization and the realization of ecological safety and healthy development in urban agglomerations, it is necessary to develop a new approach to research on the ESPs construction in urban agglomerations based on the scale perspective and hierarchical needs.
The Guanzhong Plain urban agglomeration (GPUA) is not only the core growth area leading the northwestern region of China to maximize economic benefits, but also an important zone to promote exchange between eastern and western China. It has a strategic location as a pilot area for inland ecological civilization construction (National Development and Reform Commission and Ministry of Housing and Urban-Rural Development, 2018). As a consequence of ongoing rampant urbanization and industrialization, the regional ecosystem of the GPUA has been detrimentally affected by human development and construction activities, resulting in ecological environment damage, habitat fragmentation, and increased risk of natural disasters, thereby posing a prominent threat to the healthy and efficient development of the region and ecological harmony (Song et al., 2020; Yang and Cai, 2020; Ye et al., 2022). Regional air quality is also notably poor, with severe pollution being of frequent occurrence, and the environmental capacity is close to threshold level (Chen et al., 2022). In recent years, scholars have constructed ESPs for the GPUA from the perspectives of resource supply (Hao et al., 2015; Yang et al., 2017), thereby providing an important scheme for the spatial planning and layout optimization of the urban agglomeration. However, research to date has rarely identified ecological sources from multiple levels of needs, and has tended to ignore the effects of disturbance caused by all kinds of human activities to the ecological system and the threat to ecological security. Consequently, our primary purposes were to: 1) confirm ecological sources via multi-scale ecological environment importance assessment; 2) develop a comprehensive indicator system by coupling environment and social development factors, then construct resistance surface; and 3) obtain potential ecological corridors based on MCR and identify the core ecological corridor by using gravity model. The research results will not only provide the basis for the ecological space restoration planning and ecological protection policy formulation of the GPUA, but also offer a scientific guideline and policy guidance for land space optimization and ecological environment protection, and ensure the harmonious coexistence of human and nature in ecologically fragile urban agglomeration areas worldwide.
2 Materials and methods
2.1 The study area
The Guanzhong Plain urban agglomeration (GPUA) is located in the inland center of China, extending across an area of approximately 107,100 km2 (Figure 1). The central part of this region is covered by a vast plain area irrigated by natural water bodies such as Wei, Fen, and Jing rivers. The area is strategically located, and it has a strong connection role. The region has a an average annual rainfall of between 400 and 800 mm, and is characterized by a temperate semi-humid monsoon climate. It supports a rich diversity of animal and plant resources which are well protected by the state. With the Xi’an metropolitan area at its core, the GPUA provides an important basis for creating a new pattern of western development and sustainable and healthy development within the Yellow River basin. As of 2020, the regional permanent population had reached 38.87 million, and the total GDP had risen to 2.19 trillion yuan. The per capita GDP was 5.63 million yuan, and the rate of urbanization was 61.83%. However, the process of urbanization has been marked by a growing conflict between human activities and the status of the ecological environment. Population growth and industrial agglomeration has contributed to a range of environmental problems, including habitat destruction, environmental pollution, and resource shortages (Yang and Cai, 2020), and increasingly, regional sustainable development and ecological security are being seriously threatened. Consequently, the scientifically based construction of an ESP for the GPUA is of considerable significance for improving habitat quality and human wellbeing, as well as alleviating the contradiction between social production and environmental protection.
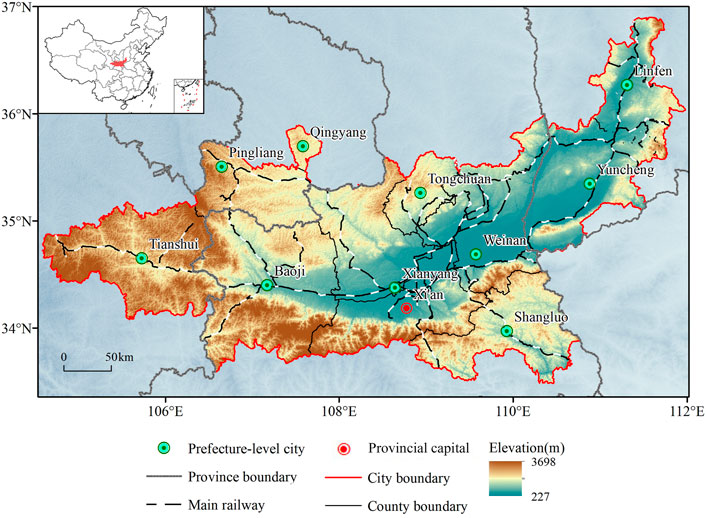
FIGURE 1. Overview of the study area.
2.2 Data sources
The precision, processing, and sources of the primary data used to bulid EPSs are shown in Table 1. The data mainly include basic natural condition data, such as digital elevation data (DEM) and soil data, socio-economic data and other data. For the purposes of analysis, the land-use data were re-classified into cultivated land, woodland, grassland, water bodies, construction land, and unused land. Slope and slope length values were calculated based on the DEM data. Grain output data were mainly derived from the 2018 statistical annual reports of cities and counties in the provinces of Shaanxi, Gansu, and Shanxi. Population and economic density data were the main sources used to construct a resistance surface. Forest parks, historical and cultural reserves and other related data were obtained from the planning of the main functional areas in Shaanxi, Gansu, and Shanxi provinces. All these data were adjusted to a unified spatial reference (WGS 1984, Krasovsky_1940_Albers), and resampled to standardized data for 1 km × 1 km grid cells based on the nearest neighbor method.
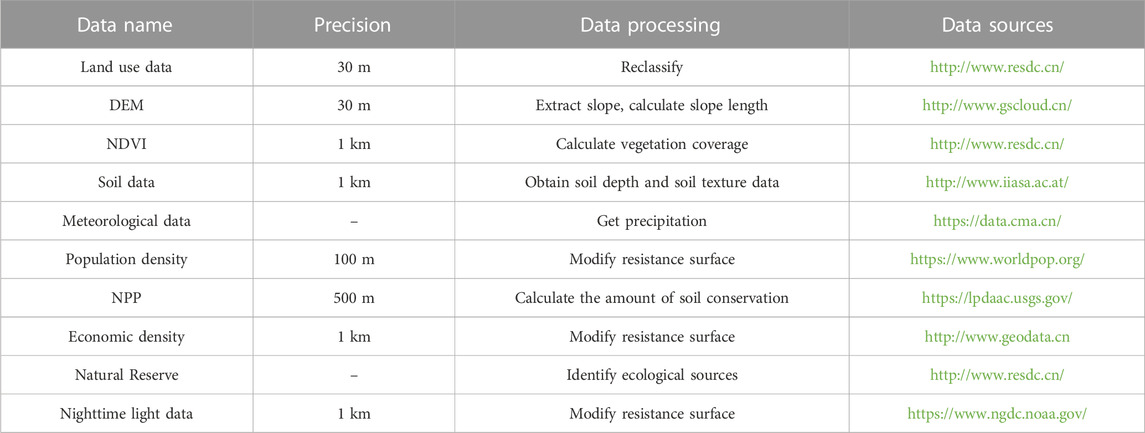
TABLE 1. Description of the data.
2.3 Methodology
On the basis of the research paradigm “source identification-resistance surface construction-ecological corridors extraction,” we constructed an ESP for the GPUA with respect to regional ecosystem characteristic and human–land coupling relationships. The construction of ESP consists of three steps.
The identification of ecological sources is the first step for the construction of ESP. The base of ecological source is essentially ecological patches with high ecosystem service value and high sensitivity, which are mainly composed of woodland, grassland, waters and other ecological land. We identified ecological sources from the perspective of ecosystem services at different scales. In terms of spatial processing, we mainly use the spatial overlay analysis and normalization processing methods in ArcGIS software to calculate the importance of urban agglomeration ecosystem services and ecological environment sensitivity. In addition, we weight and grade the evaluation results to identify the macro-ecological sources. For the identification of micro-ecological sources, we use inverse distance weighted interpolation and buffer method to calculate the importance of entertainment and cultural services and ecological recreation services, and use the natural breaks method to divide the results into five levels.
The second step is to build resistance surface by comprehensively considering the difference of natural conditions and the interference of social activities on the ecosystem, and divided the ecological security areas of different levels. By assigning resistance values to various elements and overlaying them with grid calculator in ArcGIS software, we construct the basic resistance surface of GPUA, which can reflect the resistance degree of material exchange and energy transfer between ecological units.
The last step involves MCR model to extract potential corridors, and gravity model to classify these ecological corridors, so as to construct an ESP that coordinates economic development with ecological protection. In the extraction process of ecological corridor, MCR model is mainly used to calculate the shortest path between ecological sources through the minimum cost path tool in ArcGIS software. Moreover, gravity model can identify important ecological corridors through the intensity of interaction between ecological patches.
The research framework can be seen from Figure 2. It can not only reflect the whole process of building the ecological security pattern in GPUA, but also include related methods and indicators used in each step.
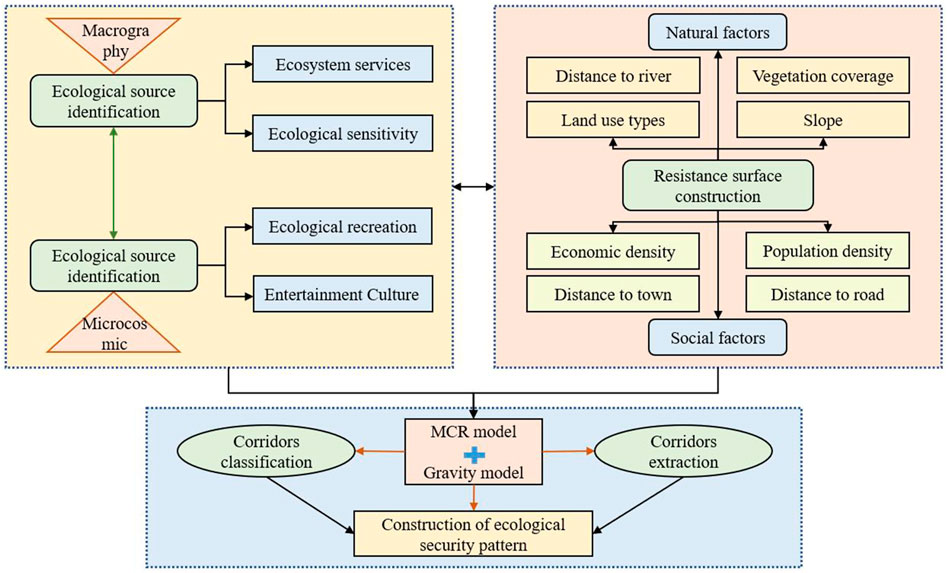
FIGURE 2. Research framework.
2.3.1 Identification of ecological sources
An ecological source is defined as ecological patches that provide significant ecosystem services, and serves as important habitats for species survival and reproduction (Peng et al., 2018a). Owing to differences in aspects such as patch area, ecosystem service function, and landscape pattern, ecological sources will have a significant impact on ESP construction. Scale is a core issue in ecological research, with regional landscape characteristics, ecological process mechanisms, and regional pattern structures differing due to different scale effects at different observational scales. Only by comprehensively considering key ecosystem services at different scales can ecological problems be satisfactorily solved (Hao et al., 2015). Given that ecological security is determined by the key ecosystem services supporting urban development, and different ecosystem services involve different scale processes, it is necessary to consider the demands for ecosystem services at different scales in order to maintain regional ecological harmony.
From this perspective of assessing ecosystem services at multiple scales and considering the natural conditions and mankind’s activity of the GPUA (Figure 3), we determined main ecological sources at the macro-level in combination with ecosystem services and eco-environmental sensitivity assessments. The construction of ecological security pattern under this scale is aimed at achieving the sustainable development of urban agglomeration and identifying the basis for the healthy and stable development of macro-regions. In addition, at micro-level, by undertaking an assessment of cultural entertainment services and cultural recreation services, we identified ecological sources and supplemented these with the macro-level ecological source identification results. In this scale, we mainly focus on human needs and comprehensively consider the impact of improving cultural and leisure activities on the quality of life of urban residents, with the purpose of improving the living environment and improving the wellbeing of residents.
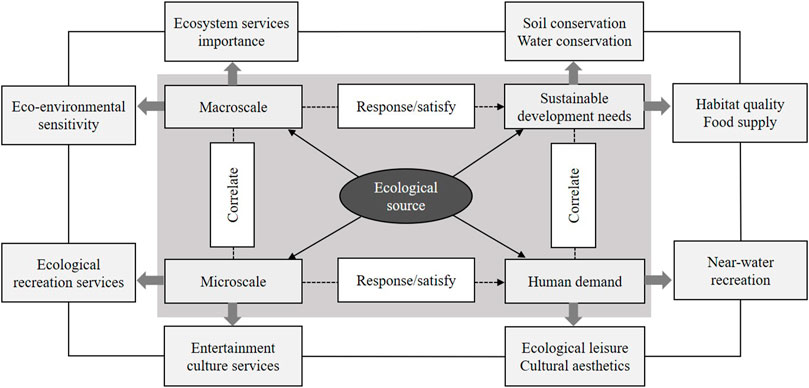
FIGURE 3. Identification of ecological sources based on scale perspective and hierarchical needs.
2.3.1.1 Identification of macro-ecological sources
2.3.1.1.1 Assessment of ecosystem services importance
The northern part of GPUA encompasses the Loess Plateau, a region characterized by a relatively fragile ecological environment and notable loss of soil. The southern part contains the Qinling Biological Reserve and Water Containment Area, which has high vegetation cover, whereas the central area is covered by a vast plain, with numerous watersheds and large areas of cultivated land. In recent years, rapid urbanization has led to ecological problems such as soil and air pollution and the loss of biodiversity. On the basis of these regional environmental characteristics, we quantitatively evaluated four ecosystem services, namely, soil conservation, water conservation, habitat quality, and food supply.
Soil conservation is among the important regulatory services provided by forests, grasslands, and other ecosystems, which contribute to reducing the rate at which soil is eroded. The Revised Universal Soil Loss Equation (RUSLE) was used to calculate the amount of soil conservation. The formula is as follows:
where Spro is the index of ecosystem soil conservation service capacity, NPPmean is the annual average net primary productivity of vegetation, K is soil erodible factor, and Fslo is slope factor.
Water conservation is an ecological function performed by forests that contributes to retaining precipitation and regulating river runoff, which is mainly manifested in the interception of precipitation by tree crowns and the storage of water in soil (Zhang et al., 2009). In this regard, as an evaluation index, we used the ecosystem water conservation service capacity index, calculated using the following formula:
where WR represents the capacity of the ecosystem to store water, Fsic is the soil infiltration, and Fpre is the average annual rainfall.
Habitat quality is of considerable significance with respect to the maintenance of biodiversity and favourable ecological environment. Moreover, habitat quality is affected to varying degrees by anthropogenic disturbance, thereby reducing biodiversity to differing extents. The calculation formula is as follows:
where Qxj represents the value of habitat quality, Hj is soil environmental factor j, Dxj indicates that ecosystem service function declines due to habitat destruction, and k is the semi-saturation constant.
Food supply is a basic ecosystem supply service that is directly associated with human wellbeing and social stability (Liu et al., 2019). In this study, we assigned a grain yield to each cultivated land patch according to the NDVI value of each county’s cultivated land grid cells, which was converted into grid format using the inverse distance weighting method.
We used the natural breaks method to reclassify the aforementioned service functions into five classes, respectively assigned values of 1–5, with higher values indicating a greater importance of the level of ecosystem service. According to the eco-environmental status of the GPUA, the four ecosystem services after classification were weighted 0.3, 0.3, 0.2 and 0.2 respectively. We used raster calculator to calculate and divide these into the following five grades: commonly important, more important, moderately important, highly important, and most important.
2.3.1.1.2 Eco-environmental sensitivity assessment
Eco-environmental sensitivity refers to the sensitivity of the ecosystem exposed to natural and human activities, which can indicate the potentiality and complexity of the area being interfered by external activities (OuYang et al., 2000). The GPUA is characterized by a series of geological hazards and environmental problems, including mountain landslides, collapse, debris flows, and earthquakes, which can have potentially devastating effects on regional economic production activities and residents’ quality of life. In this study, we mainly evaluated the sensitivity of soil loss, and geological hazard. Among these, given that vegetation coverage, elevation, slope, and land-use types are closely associated with a risk of adverse geological events, we used these factors to evaluate the sensitivity to geological hazards (Wang X Y et al., 2020). With reference to the relevant literature (Yang et al., 2017; Fan et al., 2022), we assigned weights to the evaluation indicators (Table 2) and classified sensitivity into five categories using the natural breaks method. Using these indicators, we evaluated the regional eco-environmental sensitivity.
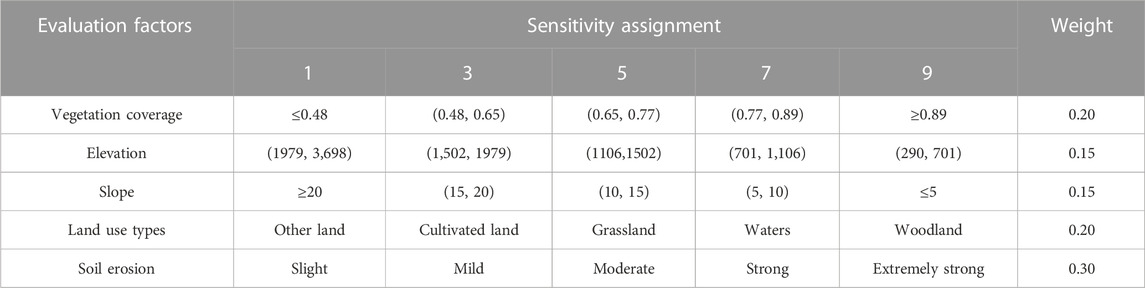
TABLE 2. Classification and weight of ecological sensitivity evaluation factors.
2.3.1.1.3 Ecological sources
The above two types of evaluation results were assigned the same weight and overlaid to determine the importance of ecological protection. Having obtained these evaluation results, we used the natural breaks method to divide these into five grades, which were respectively assigned values from 1 to 5. As important ecological sources, we selected the patches assigned grades 4 and 5. Given the scattered distribution and weak radiation function of patches with small areas, we found it convenient for subsequent data processing to remove fragmented patches and merge small patches with concentrated adjacent areas (Li et al., 2015).
2.3.1.2 Identification of micro-ecological sources
At the micro-level, we mainly considered the city’s entertainment culture services and ecological recreation services to select important ecological sources. With reference to the relevant literature (Peng et al., 2017; Wu et al., 2017) and on the basis of the distribution of tourism and cultural sites in the GPUA, our evaluation of cultural and entertainment services in this study was mainly conducted by assigning forest parks, historical and cultural reserves, scenic spots, national key cultural relics protection units, and geological parks values of 10, 8, 6, 4, and 2, respectively, according to their relative importance. Using the inverse distance weighted interpolation method, we obtained a distribution map indicating the importance of cultural and entertainment sites across the region, and then used the natural breaks method to divide it into five classes assigned values from 1 to 5. With respect to ecological recreation services, we mainly considered large expanses of water in the study area. For selected patches, we performed a 1-km buffer zone analysis to obtain the near water recreation range. On this basis, we extracted the large-area patches with a grade of five in the evaluation of cultural and entertainment services and the water buffer patches, which were selected as the micro-ecological sources. Finally, we overlapped the macro- and micro-ecological sources to obtain total ecological sources. In addition, we verified the identified ecological sources according to the distribution of natural reserves in the GPUA.
2.3.2 Construction of a resistance surface
The construction of a resistance surface is the prerequisite of ecological corridors extraction, which can reflect the impact of resistance on the transport and exchange of materials, energy, and information in ecological space. The higher the resistance coefficient, the more difficult it is for species to move between ecological source (Avon and Bergès, 2016; Nie et al., 2021). At present, the most widely used method to construct resistance surfaces involves distributing resistance valuesin line with the differences between land categories. However, the validity of this approach is questioned, given that it provides a poor reflection of differences within the same land category and the impact of human activities (Meier et al., 2005). Consequently, in the present study, we combined land-use types with other natural and socio-economic conditions, and comprehensively considered the influence of human activities on the ecological environment, which could better reflect the differences within the same land category and enable a more objective assessment. With reference to the related literature (Ding et al., 2022; Li L et al., 2022) and in combination with regional environmental characteristics, we selected land-use types, slope, distance to waters, and vegetation coverage to characterize the heterogeneity of natural conditions. (Table 3).
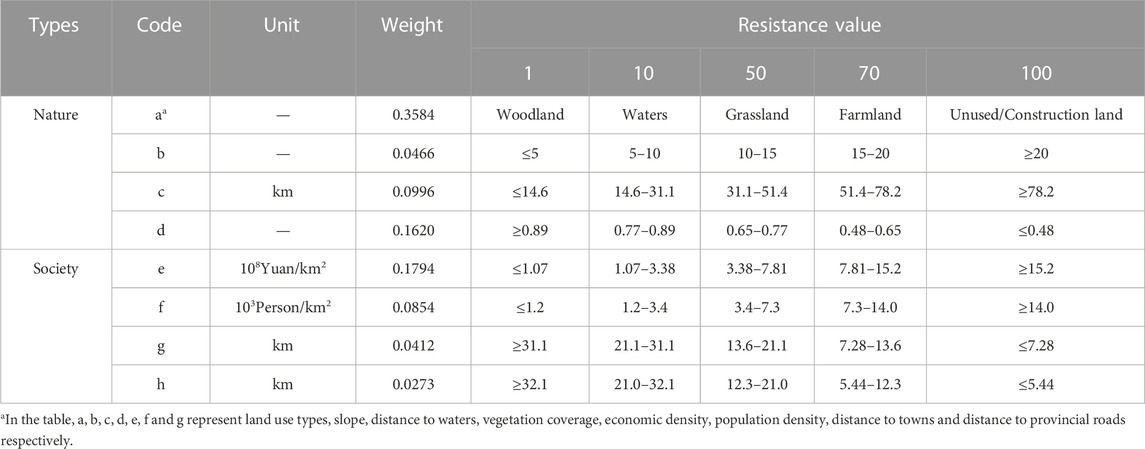
TABLE 3. Resistance factors.
According to the methods currently used to establish resistance coefficients, we divided the resistance factors into five levels, which were assigned values of 1, 10, 50, 70, and 100, respectively (Shi et al., 2020; Cui et al., 2022). Resistance value reflects the difficulty of material exchange and animal movement between landscape units. Using the analytic hierarchy process, we determined the weight of different resistance factors. As nighttime light data can clearly show the intensity of regional economic construction activities and population concentration, we used this information to revise resistance value. The comprehensive resistance value of the ecosystem can be obtained based on weighted superposition calculated using the following formula:
where Ri is the revised resistance, Rij is the basic resistance coefficient,
To a certain degree, the ecological resistance surface can reflect the spatial inhomogeneity of external interference, such as various socio-economic factors (Peng and Zhou, 2019). Therefore, we used the natural breaks method to divide it into three levels, namely, low, medium, and high security. In this case, in areas assigned a higher rank, the less the external activities hinder the ecosystem, and the more stable is the ecosystem function.
2.3.3 The extraction and classification of ecological corridors
Ecological corridors are not only important conduits of flow and renewal of ecological elements in the ecological network, but also important channels for species migration (Rushdi and Hassan, 2015). To extract ecological corridors, we used an MCR model, which was mainly realized using the least cost path tool in ArcGIS software, using the following equation:
where MCR is the minimum cumulative resistance value, Dij is space distance between different ecological sources, and Ri represents ecological resistance value.
Given differences in the importance, resistance, and cumulative connection cost of patches in different landscape units, the importance and connectivity of ecological corridors ought to be considered when constructing an ESP. In this regard, the gravity model can be used to construct a matrix for the interactions between the target source and starting source to select key corridors, calculated using the following formula:
where Fab is the force between a and b, Pmax is the value of longest potential corridors, Pab is the cumulative resistance between ecological corridors.
2.3.4 Construction of an ESP
The ESP constructed in this study included ecological sources, corridors, important strategic nodes, and so on. As an important strategic point to maintain ecological processes, ecological nodes can supply habitat for animal movement and improve connections between sources, which is essential for the maintenance of regional ecosystem service functions (Gao et al., 2022). As ecological nodes in the present study, we selected those points at which multiple ecological corridors intersected (Guo et al., 2019). Ecological breakpoints are areas with strong human activities that obstruct the transfer of material and energy in ecological processes. Consequently, taking into consideration the influence of social production and construction activities on animals migration, to identify ecological breakpoints, we overlaid the road traffic network and ecological corridors. Finally, we obtained an ESP for the GPUA by overlying these identified points, lines, and surfaces.
3 Results
3.1 Spatial patterns of ecosystem service importance and eco-environmental sensitivity
With respect to soil conservation, we found that the high value zones are mostly existed in the south and northeast region. The southern areas are dominated by the Qinling Mountains, which have high vegetation coverage and functionally good water and soil conservation (Figure 4). To the northeast, lie Yuncheng and Linfen, and an area of flat terrain with mainly light soil erosion. In terms of water conservation, the high water conservation are mostly found in the south of the urban agglomeration, wherein the rich forest resources in the Qinling Mountains intercept and store rainwater. High value areas of habitat quality are primarily existed in the northern Loess Plateau and the southern Qinling Mountains. These areas provide good habitats that are conducive to the protection of biodiversity. Unsurprisingly, low value areas of habitat quality are distributed in the central area of the region. Owing to the destructive effects of human activities on cultivated land and woodland with good surrounding habitats, the quality of habitats in such areas was low. High-value grain supply are mostly found in the cities of Weinan, Yuncheng, and Linfen. Among these, Weinan City covers the broadest area in the east of the GPUA, which is characterized by a flat terrain and large areas of arable area. It is a traditional production base for commodity grain, and consequently, the food supply in this area is relatively high. From the proportion of importance of ecosystem services, the extremely important ecological service area of GPUA was estimated to be 12,737.82 km2, which is mainly existed in the southern Qinling. Comparatively, the extent of area considered to have high importance was 22,575.39 km2, which accounts for 26.85% of the entire region.
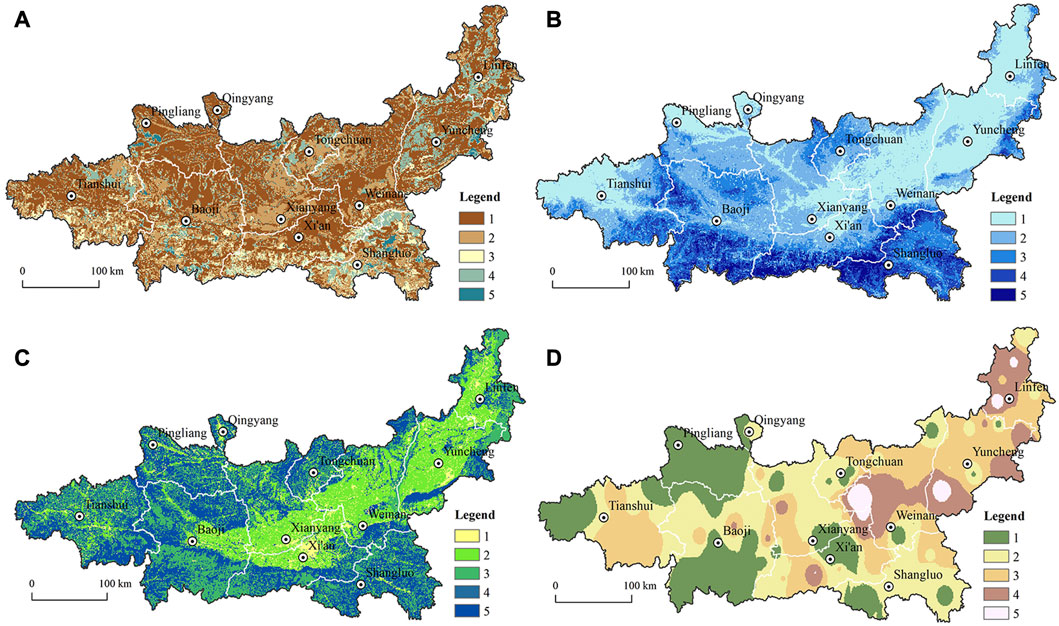
FIGURE 4. Spatial pattern of ecosystem elements in GPUA: (A) soil conservation; (B) water conservation; (C) habitat quality; (D) food supply (Grade 1 = lowest; Grade 5 = highest; 1 to five refer to generally important, more important, moderately important, highly important, and most important.).
From the above analysis, we can find that the southern Qinling Mountains and the mountains in the northeast of GPUA have higher ecosystem service value, while the ecological value of the urban core area is low. Previous research has identified a similar geographical pattern with respect to the significance of ecosystem services in the GPUA, with regions in the south and north being characterized by higher and lower importance, respectively (Li et al., 2021).
The results of our comprehensive assessment of eco-environmental sensitivity are represented in Figure 5. Regional eco-environmental sensitivity mainly includes soil loss and geological hazard sensitivity. With respect to the latter, the areas of highly sensitive (grades > 3) are mostly found in the Qinling Mountains, as these areas are prone to mudslides and landslides due to the unstable mountainous terrain, steep slopes, and relatively abundant precipitation. The areas of low sensitivity (grades < 3) are primarily concentrated in the middle and northern regions of the GPUA. The area of extremely sensitive region (grade 5) was 5,862.59 km2 that accounted for 5.64% of the entire region, whereas the area of highly sensitive region (grade 4), which are mostly existed around the extremely sensitive areas, was 15,344.07 km2, accounting for 14.76% of the entire region.
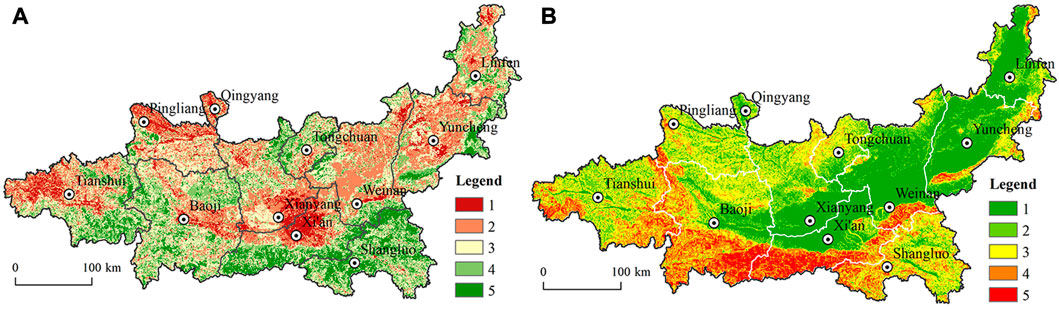
FIGURE 5. Spatial distribution of ecosystem services importance grades (A) and eco-environmental sensitivity grades (B) in GPUA (Grade 1 = minimal importance/sensitivity; Grade 5 = highest importance/sensitivity; 1 to five refer to slight, mild, moderate, strong, extremely strong.).
3.2 Important ecological sources
The importance of ecosystem services and the sensitivity of the eco-environment were found to show conspicuous spatial heterogeneity. In this study, we evaluated the importance of ecological protection on the basis of the addition of two equal weights. We divided the evaluated results into five categories (extremely low, low, moderate, high, and extremely high), which were respectively assigned values on a scale from 1 to 5 (Figure 6). Among these, the extent of areas containing extremely high- and high-level patches was 12,515.37 km2 and 14,174.83 km2, accounting for 12.08% and 13.68% of entire region, respectively. From a spatial perspective, the extremely high-level patches are mostly located in the southern and northwestern regions, which correspond to the areas of high ecosystem service value and high ecological sensitivity. Accordingly, we selected patches with a extremely high and high levels of ecological protection importance as the macro-ecological sources (Supplementary Figure S1).
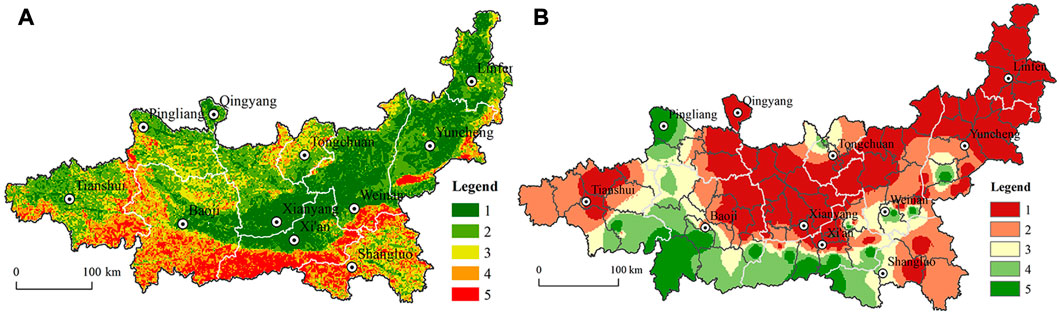
FIGURE 6. Spatial distribution of importance grades of ecological protection (A) and cultural and entertainment service (B) in GPUA (Grade 1 = lowest; Grade 5 = highest).
At the micro-level, areas considered to have a high level (grade 5) of cultural and entertainment services are mainly located in the Qinling Mountains, Pingliang City in the northwest, and Weinan City in the east (Figure 6), wherein there are numerous forest parks, historical reserves, and other tourist and cultural attractions. These areas cover 8,079.74 km2 and account for 7.54% of total region. Ecological recreation services areas were primarily located in the cities of Yuncheng, Xianyang, and Baoji, particularly Yongji City and Linyi County in Yuncheng City and Xingping City in Xianyang City, which are located near rivers and can benefit from ecological recreation services within the immediate vicinity. As ecological sources at the micro-level, we extracted areas of high-level (grade 5) cultural and entertainment services and superimposed these on water buffer zones. Having thus obtained both macro- and micro-level ecological sources, we combined these sources to obtain the total ecological sources of the GPUA (Figure 7). From the figure, we can find that the ecological source is concentrated in the south of the urban agglomeration and mainly consists of woodland, grassland, waters, etc. The existing research on the ecological security pattern of the GPUA also found that the ecological sources are mainly distributed in the Qinba Mountains, the Yellow River, the Weihe River and other regions (Chen et al., 2022). For the sake of check the correctness of ecological sources, we superimposed natural reserves in the GPUA on the ecological sources, and accordingly found that the distribution of natural reserves essentially coincided with that of the ecological sources, thereby indicating that our extraction of ecological source areas could be considered relatively reliable.
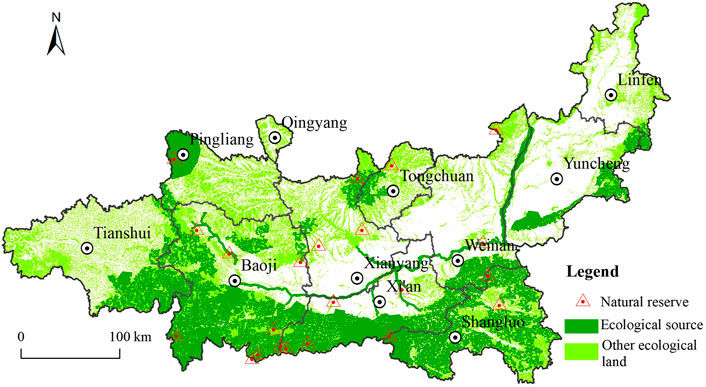
FIGURE 7. Spatial distribution of ecological sources.
In general, we found that ecological sources within the GPUA are concentrated in the south Qinling Mountains and to the northwest of Pingliang City, whereas other sources show a scattered distribution in the eastern and middle parts of GPUA. As important barrier against ecological risks, these areas represent the ecological bottom line of urban development and construction activities, and are consequently in need of strict protection. In this study, we identified 16 areas as important ecological source patches with an area of 28,780.02 km2, accounting for 26.85% of entire region. From the perspective of land types, woodland was established to be the main land type constituting ecological sources, accounting for 46.99% of entire region, then the grassland area in the ecological sources accounted for 34.11%. In addition, the proportion of cultivated land and construction land accounted for 14.83% and 1.26% respectively, indicating that construction land has occupied part of the environmental resources.
3.3 Identification of ecological corridors
3.3.1 The establishment of a basic resistance surface
Taking in consideration differences between natural conditions and the disturbance of ecological processes as a consequence of social and economic activities, we constructed a basic resistance surface for the extension of ecological sources, and corrected the resistance surface (Figure 8) using nighttime light data (Supplementary Figure S2). Generally, we detected a significant spatial variation the value of ecological resistance, and obtained values of 85.59, 0.99, and 31.14 for the maximum, minimum, and average resistances, respectively. The areas of high ecological resistance were mostly located in Xi’an, Xianyang, Yuncheng, and other cities. These areas have a flat terrain, with large expanses of urban and rural construction land and intense human activity, which tend to hinder ecological flow and species migration. In this context, it is worth noting that whereas the ecological resistance value of Pingliang City was relatively high, there are also important ecological sources distributed within this area, thereby indicated that human construction activities are likely to be having a considerable impact on the area’s ecological sources. Contrastingly, the Qinling Mountain area is characterized as an area of low ecological resistance due to its high terrain, numerous woodlands, and minimal anthropogenic disturbance. These findings are consistent with those previously reported (Yang et al., 2017; Chen et al., 2022).
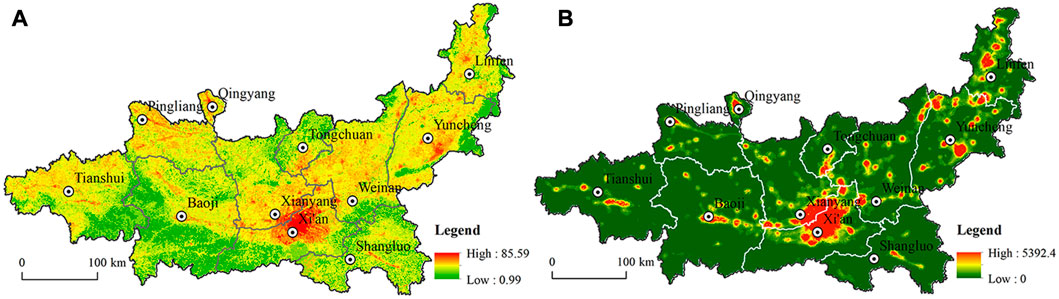
FIGURE 8. Spatial distribution of the basic resistance surface (A) and modified resistance surface (B).
In general, we found the GPUA has good ecological security, but its spatial distribution is uneven (Supplementary Figure S3). The coverage of areas considered to have low, medium, and high levels of security were 33,404.96, 47,987.49, and 22,938.92 km2, accounting for 32.02%, 46.00% and 21.98% of entire region, respectively. High level of ecological security were mostly found in the Qinling Mountains of GPUA and in the northwest and other areas with good ecological environments, whereas low level of ecological security were primarily found in the central plain area. The land-use type in the low-value area was mainly construction land that has undergone substantial modification as a consequence of human developmental activities. Areas of medium ecological security are mainly distributed near areas of low ecological security, and as such can be considered vulnerable to human interference and thus at potential ecological risk.
3.3.2 The extraction of ecological corridors
Based on the minimum cumulative resistance model, we calculated the path with the lowest cost between the target and the source in GPUA, and the paths thus identified were considered potential ecological corridors. In total, we obtained 121 potential ecological corridors in the region, which were 8,966.37 km long and unevenly distributed from the northeast to southwest (Figure 9). In addition, most of the corridors were long and were mainly concentrated in the south and northwest. These areas are characterized by high vegetation coverage, rich natural resources, large and concentrated patches of ecological sources, and high habitat quality, and are conducive to material exchange between landscape units. Ecological corridor is an important carrier of animal migration and material exchange. Therefore, in the future urban development process, it is necessary to reasonably plan to protect ecological land and improve the connectivity between ecological sources.
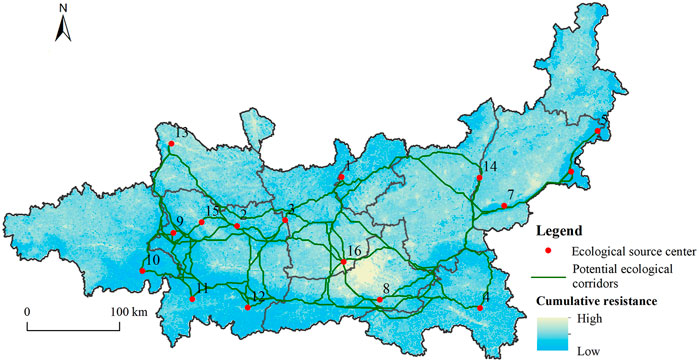
FIGURE 9. Spatial distribution of potential ecological corridors.
3.4 The construction of an ecological security pattern
The ESP constructed in the GPUA comprised ecological sources, key corridors, strategic nodes, and ecological breakpoints (Figure 10). Based on the constructed resistance surface and identified ecological corridors with reference to current land-use patterns and the influence of social production activities, we calculated the interaction between the starting source and the target source using a gravity model, for which the magnitude of force can indicate the connectivity between different corridors.
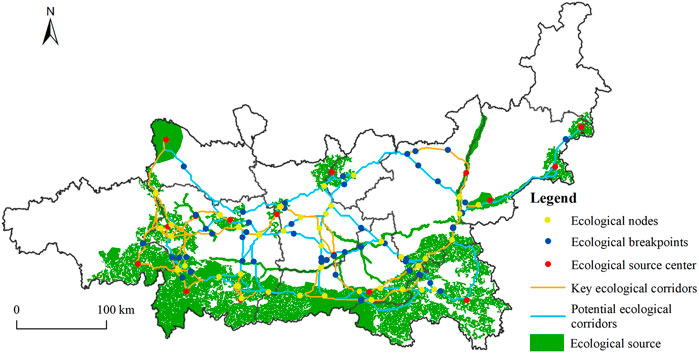
FIGURE 10. Ecological security pattern (ESP) in GPUA.
In this study, we extracted 44 key ecological corridors with large force, with a total length of 2,434.75 km. They were mostly concentrated in the west, particularly to the west of Baoji City. Owing to the differences in regional topography and ecological sources distribution, there were fewer important corridors in the east and middle of GPUA. As temporary habitats for species, ecological nodes can contribute to strengthening the connectivity between patches and promote between-patch species migration. In this study, by taking the intersection of multiple ecological corridors to be indicative of ecological nodes, we identified 47 such nodes. Ecological breakpoints represent a substantial hinderance to material and energy flow in ecological processes, and are inimical to species migration. With the continuous development of social production activities, the number of these breakpoints is destined to gradually increase. By superimposing the road traffic network and ecological corridors, we identified 49 ecological breakpoints, mainly distributed in the central plain area. These ecological breakpoints have contributed to disrupting ecosystem connectivity and integrity. Thus, in the future, it will be necessary to minimize the damage of road construction to good habitats and maintain the natural habitats on which species depend.
4 Discussion
4.1 Advantages of ecological sources identification
As an significant facet of the ESP, scientific identification of ecological sources is a prerequisite that provides a basis for the construction of ESPs (Chen et al., 2017; Li L et al., 2022). In this study, from the perspective of ecosystem services, we identified important ecological sources at different scales of ecosystem service needs, which enhance ecosystem connectivity. Specifically, the objective of assessing ecosystem services at the scale of an urban agglomeration was to identify a basis for the healthy and stable development of the macro-region. In terms of urban scale, it was necessary to focus on human requirements, and comprehensively consider the effects of improving cultural leisure activities on the quality of life of urban inhabitants, taking into account ecological services such as ecological leisure and micro-climate regulation, and resident wellbeing (Lu et al., 2020; Zhu et al., 2020; Yu et al., 2021). Consequently, identifying ecological sources from different levels of ecosystem service demand would not only ensure regional ecological security and maintain ecosystem stability but also meet the ecosystem service demands for improving urban human settlements, thereby substantially broadening the scope of ESP construction. In this context, most of the studies conducted to date have tended to focus exclusively on ecosystem services at a singular scale, and the ecological sources thus identified would only meet needs at specific levels, and would fall short of ensuring an effective connection between urban scale and ecological security at higher scales. As the main body of national new urbanization and the “center of gravity” of national prosperity, urban agglomerations are tasked with the historical responsibility of transferring the center of gravity of the world economy (Fang, 2014). The ecological security problem plaguing urban agglomerations is closely associated with the structures, processes, and functions of ecosystems at different scales. For this reason, we have explored the impact of ecological sources identified at different scales on the construction of ecological security patterns. From the results, we can find that it can not only improve the connectivity between ecological corridors, but also give full play to ecological value and maintain ecological security. Consequently, the construction of an ESP for the GPUA based on a consideration of multi-scale ecosystem service needs has both important theoretical and practical reference value with respect to maintaining ecosystem stability, optimizing the land spatial structure, and realizing the sustainable development of the social economic ecology of urban agglomerations.
4.2 The rationality of ecological security pattern construction
In this study, we performed a comprehensive assessment of the significance of ecosystem services and eco-environmental sensitivity of the GPUA. The results indicated that the southern Qinling Mountains and the mountainous northeastern of GPUA were more important with respect to ecosystem services, and that the ecological environments of the southern and northwestern areas were characterized by greater sensitivity. For example, Xi’an, Baoji, and Tianshui were identified as areas with a potentially heightened ecological security risk. Previous research has identified a similar geographical pattern with respect to the significance of ecosystem services in the GPUA, with regions in the south and north being characterized by higher and lower importance, respectively. They have also established that Xi’an and Xianyang to the north of the Qinling Mountains are at higher ecological risks and are vulnerable to disturbance associated with human activities (Li L et al., 2022). By overlaying the locations of natural reserve in the GPUA on the identified ecological sources, we found that these natural reserve areas essentially fall within the range covered by ecological source areas, which accordingly indicates that our identification of ecological sources in this study is relatively reliable.
With respect to resistance surface construction, previous studies have tended to give weight to the resistance through the difference of land use types, which is essentially subjective and ineffective in distinguishing differences within the same land category (Meier et al., 2005; Yang et al., 2017). Accordingly, in this research, we incorporated social and economic factors in our construction of a resistance surface and emphasize the disruptive effects of human activities on the natural environment. Using this approach, we found that areas with high resistance are mostly located in areas with a high degree of urbanization and sustained economic activity, whereas low resistance value are mostly found in mountainous areas that rich in natural resources and experience relatively little human disturbance. These findings are consistent with those previously reported (Yang et al., 2017; Chen et al., 2022), indicating that areas characterized by high population densities and economy activity that have undergone uncontrolled expansion have exerted a coercive effect on the ecological environment, hindered the flow of various elements within the ecological environment, and ultimately led to a decline of the ecosystem service function, thereby threatening regional ecological security (Newbold et al., 2015). Using a combination of natural and socio-economic factors to construct an ecological resistance surface can contribute to enhancing the rationality of ESP construction, and, moreover, enables the identification of ecological corridors that avoid areas of intense human activity that hinder biological migration and material and energy flow, thereby increasing the likelihood of maintaining regional ecological security.
4.3 Application and planning suggestions
The construction of an ESP not only contributes to an effective resolution of the conflicting demands of ecological protection and economic development but can be applied to regional spatial structure optimization, ecological protection, and construction (Ou et al., 2015). The areas of the GPUA identified in this study as the main ecological sources are not only high-value areas with respect to the significance of ecosystem services, but also areas of high ecological sensitivity and vulnerability, which need to be reasonably protected via appropriate planning. As the land type composition of ecological sources is closely associated with the utilization, development and protection of land resources, the regional scope of these ecological sources can be used as a key control and planning area of land resources that can contribute to preventing the rapid expansion of cities and encroachment on areas of important ecological resources. Therefore, by taking into consideration the spatial differences in ecological resistance values in the ESP, we can implement differentiated management and protection policies to safeguard ecosystems. For example, some areas of Pingliang City within the urban agglomeration were designated important ecological sources, although were also assigned high ecological resistance value, indicating that human production activities have disrupted ecosystem integrity and hindered the flow of ecological elements. For such areas, the scope of urban production and construction activities ought to be strictly controlled, and ecological land restoration and protection should be strengthened.
An ESP can also provide important support for species migration and biodiversity conservation, and serve as a valuable reference for spatial planning and management (Wang W et al., 2020). We established that the ecological sources and corridors of the GPUA were mostly concentrated in the southern Qinling Mountains, whereas in central region, ecological corridors have been dislocated to varying extents by high intensity urbanization, thereby compromising the communication between ecological sources. Connectivity at the landscape scale should accordingly be strengthened during urban space planning. In the middle plain of the GPUA, it is necessary to prioritize the construction and repair of ecological infrastructure and optimize the human living environment; for example, by undertaking the restoration of damaged green belt land through the planting of trees and prohibiting the discharge of sewage and illegal construction. Furthermore, for important water bodies in the region, such as the Yellow, Wei, and Fen rivers and their main tributaries, it is necessary to further strengthen ecological vegetation restoration and biodiversity conservation initiatives, and accelerate the establishment of national ecological parks, such that local residents can fully benefit from the associated cultural and ecological recreation services.
On the basis of the ESP constructed in this study, we recommend the following steps for achieving ecological security in the GPUA. Firstly, it is imperative to undertake the ecological restoration of forest and grassland in the vicinity of ecological nodes to enhance forest coverage. Secondly, development in those areas identified as ecological breakpoints should be appropriately planned, so as to improve the ecological environment of the urban agglomeration. Finally, we should focus on restoring vegetation along ecological corridors to enhance the flow and diffusion properties of the ecosystem.
4.4 Limitations and future research
Although this research is of considerable importance with respect to the maintenance of ecosystem services and ensuring ecological security and regional sustainable development, the study does have certain limitations. Firstly, although in our construction of a resistance surface, we undertook a comprehensive evaluation of natural and socio-economic conditions, agriculture also involves human activities, and thus it is necessary to optimize the indicator system, so as to gain a better distinction between natural and economic factors. Secondly, the width of ecological corridors has an influence on corridor structure and function. In this regard, some scholars have set appropriate corridor widths by taking into consideration target species, microclimate, humidity, and other conditions, which we overlooked in this study. Accordingly in future studies, it will be instructive to assess the influence of corridor width on species migration under different natural conditions. Finally, the construction of ESPs based on a static perspective ignores the influence of land use transformation on the determination of ecological sources. Consequently, in the future, we should fully take into account temporal changes in land usage when determining components of the ESP. Moreover, we will explore the impact of land type change on the ecological environment in the process of urbanization.
5 Conclusion
As “central areas” of national economic development, urban agglomerations have contributed to promoting overall economic efficiency. However, these economic benefits have been gained at the cost of the natural environment, with high population densities and rapid urban expansion generating high levels of pollution and posing high ecological risks. The ESPs construction represents an significant approach for maintaining regional ecological harmony and promoting the healthy development of social economy. Accordingly, in this study, we constructed an ESP for the GPUA on the basis of levels of ecosystem service demand at different scales, using multiple methods, including ecosystem service importance assessment, eco-environmental sensitivity assessment, and minimum cumulative resistance model.
Starting from the multi-scale ecosystem service demand level, the ecological sources identified can enhance the connectivity of the inner regions of the GPUA and the linkage of north and south ecological corridors. We identified 16 important ecological sources, which were mostly located in the south of the region. These ecological sources primarily comprise woodland and grassland. However, our data reveal that a proportion of the ecological sources coincide with construction land, indicating that these ecological resources are at a high risk of degradation. In addition, ecological resistance within the GPUA was established to be heterogeneous in nature, with high value areas being mainly distributed in highly urbanized areas such the cities of Xi’an, Xianyang, and Yuncheng. These areas are characterized by a flat terrain and high levels of human activity, which hinder ecological flow and species migration. Contrastingly, the low resistance value are mostly found in the southern Qinling Mountains. Areas with low, medium, and high security levels accounted for 32.02%, 46.00%, and 21.98% of entire region, respectively. Within the ecological security pattern, we identified 121 potential ecological corridors in the GPUA, which were 8,966.37 km long. These corridors were unevenly distributed from the northeast to southwest, although tended to be concentrated in the south of the region. Moreover, most of the corridors were long. Among them, 44 corridors are important, with a total length of 2,434.75 km, most of which are concentrated in the west, especially in the west of Baoji City. The scattered distribution of ecological breakpoints blocks the material exchange between landscape units. Consequently, it is necessary to plan the construction of roads carefully to protect the integrity of the natural environment.
Data availability statement
The original contributions presented in the study are included in the article/Supplementary Material, further inquiries can be directed to the corresponding author.
Author contributions
Conceptualization, HY and YS; software, YT and SX; formal analysis, HY, YS, and DX; investigation, YT and LZ; resources, YS and DX; writing—original draft preparation, HY and YS; writing—review and editing, HY, YS, and DX; supervision, YS, SX, and LZ. All authors have read and agreed to the published version of the manuscript.
Funding
This research was funded by the “National Natural Science Foundation of China,” grant number “42001251,” the “Fundamental Research Funds for the Central Universities,” grant number “GK202103139,” and by “China Postdoctoral Science Foundation,” grant number “2021M692003.”
Acknowledgments
We would like to thank the colleagues of the research group for their constructive suggestions. Additionally, we thank the reviewers and members of the editorial team for their constructive comments.
Conflict of interest
The authors declare that the research was conducted in the absence of any commercial or financial relationships that could be construed as a potential conflict of interest.
Publisher’s note
All claims expressed in this article are solely those of the authors and do not necessarily represent those of their affiliated organizations, or those of the publisher, the editors and the reviewers. Any product that may be evaluated in this article, or claim that may be made by its manufacturer, is not guaranteed or endorsed by the publisher.
Supplementary material
The Supplementary Material for this article can be found online at: https://www.frontiersin.org/articles/10.3389/fenvs.2023.1136630/full#supplementary-material
References
Ahern, J. (1995). Greenways as a planning strategy. Landsc. Urban Plann 33, 131–155. doi:10.1016/0169-2046(95)02039-V
Alexander, D. (2007). Green infrastructure, linking landscapes and communities. Nat. Areas J. 27, 282–283. doi:10.3375/0885-8608(2007)27[282:GILLAC]2.0.CO;2
Aminzadeh, B., and Khansefid, M. (2010). A case study of urban ecological networks and a sustainable city: Tehran’s metropolitan area. Urban Ecosyst. 13, 23–36. doi:10.1007/s11252-009-0101-3
Avon, C., and Bergès, L. (2016). Prioritization of habitat patches for landscape connectivity conservation differs between least-cost and resistance distances. Landsc. Ecol. 31, 1551–1565. doi:10.1007/s10980-015-0336-8
Cao, S., Suo, X., Xia, C., Yu, Z., and Feng, F. (2020). Net value of forest ecosystem services in China. Ecol. Eng. 142, 105645. doi:10.1016/j.ecoleng.2019.105645
Chen, J., Wang, S., and Zou, Y. (2022). Construction of an ecological security pattern based on ecosystem sensitivity and the importance of ecological services: A case study of the Guanzhong Plain urban agglomeration, China. China. Ecol. Indic. 136, 108688. doi:10.1016/j.ecolind.2022.108688
Chen, X., Peng, J., Liu, Y. X., Yang, Y., and Li, G. K. (2017). Constructing ecological security patterns in Yunfu city based on the framework of importance-sensitivity-connectivity. Geogr. Res. 36, 471–484. doi:10.11821/dlyj201703006
Cui, X., Deng, W., Yang, J., Huang, W., and de Vries, W. T. (2022). Construction and optimization of ecological security patterns based on social equity perspective: A case study in wuhan, China. Ecol. Indic. 136, 108714. doi:10.1016/j.ecolind.2022.108714
DiLeo, M. F., Rico, Y., Boehmer, H. J., and Wagner, H. H. (2017). An ecological connectivity network maintains genetic diversity of a flagship wildflower, Pulsatilla vulgaris. Biol. Conserv. 212, 12–21. doi:10.1016/j.biocon.2017.05.026
Ding, M., Liu, W., Xiao, L., Zhong, F., Lu, N., Zhang, J., et al. (2022). Construction and optimization strategy of ecological security pattern in a rapidly urbanizing region: A case study in central-south China. Ecol. Indic. 136, 108604. doi:10.1016/j.ecolind.2022.108604
Dong, J., Peng, J., Liu, Y., Qiu, S., and Han, Y. (2020). Integrating spatial continuous wavelet transform and kernel density estimation to identify ecological corridors in megacities. Landsc. Urban Plann 199, 103815. doi:10.1016/j.landurbplan.2020.103815
Fan, X., Rong, Y., Tian, C., Ou, S., Li, J., Shi, H., et al. (2022). Construction of an ecological security pattern in an urban–lake symbiosis area: A case study of hefei metropolitan area. Remote Sens. 14, 2498. doi:10.3390/rs14102498
Fang, C. L. (2014). Progress and the future direction of research into urban agglomeration in China. Acta Geogr. Sin. 69, 1130–1144. doi:10.11821/dlxb201408009
Fumagalli, N., and Toccolini, A. (2012). Relationship between greenways and ecological network: A case study in Italy. Int. J. Environ. Res. 6, 903–916.
Gaaff, A., and Reinhard, S. (2012). Incorporating the value of ecological networks into cost-benefit analysis to improve spatially explicit land-use planning. Ecol. Econ. 73, 66–74. doi:10.1016/j.ecolecon.2011.10.021
Gao, M., Hu, Y., and Bai, Y. (2022). Construction of ecological security pattern in national land space from the perspective of the community of life in mountain, water, forest, field, lake and grass: A case study in guangxi hechi, China. Ecol. Indic. 139, 108867. doi:10.1016/j.ecolind.2022.108867
Guo, R., Miao, C., Li, X., and Chen, D. (2007). Eco-spatial structure of urban agglomeration. Chin. Geogr. Sci. 17, 28–33. doi:10.1007/s11769-007-0028-7
Guo, R., Wu, T., Liu, M., Huang, M., Stendardo, L., and Zhang, Y. (2019). The construction and optimization of ecological security pattern in the Harbin-Changchun urban agglomeration, China. Int. J. Environ. Res. Public Health 16, 1190. doi:10.3390/ijerph16071190
Han, Y., Yu, C., Feng, Z., Du, H., Huang, C., and Wu, K. (2021). Construction and optimization of ecological security pattern based on spatial syntax classification—taking ningbo, China, as an example. Land 10, 380. doi:10.3390/land10040380
Hao, P., Wang, Q., Shen, W. M., Zhai, J., Liu, H. M., and Yang, M. (2015). Progress of integrated ecosystem assessment: Concept, framework and challenges. Geogr. Res. 34, 1809–1823. doi:10.11821/dlyj201510001
Jin, X., Wei, L., Wang, Y., and Lu, Y. (2021). Construction of ecological security pattern based on the importance of ecosystem service functions and ecological sensitivity assessment: A case study in fengxian county of jiangsu province, China. Environ. Dev. Sustain. 23, 563–590. doi:10.1007/s10668-020-00596-2
Kruk, M. E., Gage, A. D., Arsenault, C., et al. (2018). High-quality health systems in the sustainable development goals era: Time for a revolution [J]. The Lancet global health 6 (11), e1196–e1252.
Li, G. D., Fang, C. L., Li, Y. J., Wang, Z., Sun, S., He, S., et al. (2022). Global impacts of future urban expansion on terrestrial vertebrate diversity. Nat. Commun. 13, 1628–1712. doi:10.1038/s41467-022-29324-2
Li L, L., Huang, X., Wu, D., Wang, Z., and Yang, H. (2022). Optimization of ecological security patterns considering both natural and social disturbances in China's largest urban agglomeration. Ecol. Eng. 180, 106647. doi:10.1016/j.ecoleng.2022.106647
Li, X., Li, S., Zhang, Y., O’Connor, P. J., and Yan, J. (2021). Landscape ecological risk assessment under multiple indicators. Land 10, 739. doi:10.3390/land10070739
Li, X. R., Li, X. B., Wang, Y. Y., and Shao, J. A. (2015). Identification of ecological security patterns for county-level landscapes and function division of the three gorges reservoir area: A case in fengjie. Chin. J. Ecol. 34, 1959–1967. doi:10.13292/j.1000-4890.20150615.003
Lin, Q., Eladawy, A., Sha, J., Li, X., Wang, J., Kurbanov, E., et al. (2021). Remotely sensed ecological protection redline and security pattern construction: A comparative analysis of pingtan (China) and durban (south Africa). Remote Sens. 13, 2865. doi:10.3390/rs13152865
Liu, Y., Lü, Y., Fu, B., Harris, P., and Wu, L. (2019). Quantifying the spatio-temporal drivers of planned vegetation restoration on ecosystem services at a regional scale. Sci. Total Environ. 650, 1029–1040. doi:10.1016/j.scitotenv.2018.09.082
Lu, H. T., Yan, Y., Zhao, C. L., and Wu, G. (2020). Framework of constructing multi-scale ecological security pattern in Xiongan New Area. Acta Ecol. Sin. 40, 7105–7112. doi:10.5846/stxb201911222537
Ma, K. M., Fu, B. J., Li, X. Y., and Guan, W. B. (2004). The regional pattern for ecological security (RPES): The concept and theoretical basis. Acta Ecol. Sin. 04, 761–768.
Ma, L., Bo, J., Li, X., Fang, F., and Cheng, W. (2019). Identifying key landscape pattern indices influencing the ecological security of inland river basin: The middle and lower reaches of Shule River Basin as an example. Sci. Total Environ. 674, 424–438. doi:10.1016/j.scitotenv.2019.04.107
Mandle, L., Douglass, J., Lozano, J. S., Sharp, R. P., Vogl, A. L., Denu, D., et al. (2016). Opal: An open-source software tool for integrating biodiversity and ecosystem services into impact assessment and mitigation decisions. Environ. Modell. Softw. 84, 121–133. doi:10.1016/j.envsoft.2016.06.008
Meier, K., Kuusemets, V., Luig, J., and Mander, U. (2005). Riparian buffer zones as elements of ecological networks: Case study on Parnassius mnemosyne distribution in Estonia. Ecol. Eng. 24, 531–537. doi:10.1016/j.ecoleng.2005.01.017
National Development Reform Commission; Ministry of Housing Urban-Rural Development (2018). The development plan for city agglomerations in the Guanzhong Plain. Beijing, China: National Development and Reform Commission & Ministry of Housing and Urban-Rural Development.
Newbold, T., Hudson, L. N., Hill, S. L. L., Contu, S., Lysenko, I., Senior, R. A., et al. (2015). Global effects of land use on local terrestrial biodiversity. Nat 520, 45–50. doi:10.1038/nature14324
Nie, W., Shi, Y., Siaw, M. J., Yang, F., Wu, R., Wu, X., et al. (2021). Constructing and optimizing ecological network at county and town Scale: The case of Anji County, China. Ecol. Indic. 132, 108294. doi:10.1016/j.ecolind.2021.108294
Ou, D. H., Xia, J. G., Zhang, L., and Zhao, Z. (2015). Research progress on regional ecological security pattern planning and discussion of planning techniqueflow. Ecol. Envir. Sci. 24, 163–173. doi:10.16258/j.cnki.1674-5906.2015.01.024
OuYang, Z. Y., Wang, X. K., and Miao, H. (2000). China’s eco-environmental sensitivity and its spatial heterogeneity. Acta Ecol. Sin. 1, 10–13.
Peng, J., Li, H. L., Liu, Y. X., Hu, Y. N., and Yang, Y. (2018a). Identification and optimization of ecological security pattern in Xiong'an New Area. Acta Geogr. Sin. 73, 701–710. doi:10.11821/dlxb201804009
Peng, J., Pan, Y., Liu, Y., Zhao, H., and Wang, Y. (2018b). Linking ecological degradation risk to identify ecological security patterns in a rapidly urbanizing landscape. Habitat Int. 71, 110–124. doi:10.1016/j.habitatint.2017.11.010
Peng, J., Zhao, H. J., Liu, Y. X., and Wu, J. S. (2017). Research progress and prospect on regional ecological security pattern construction. Geogr. Res. 36, 407–419. doi:10.11821/dlyj201703001
Peng, W., and Zhou, J. (2019). Development of land resources in transitional zones based on ecological security pattern: A case study in China. Nat. Resour. Res. 28, 43–60. doi:10.1007/s11053-018-9401-8
Rushdi, A. M. A., and Hassan, A. K. (2015). Reliability of migration between habitat patches with heterogeneous ecological corridors. Ecol. Modell. 304, 1–10. doi:10.1016/j.ecolmodel.2015.02.014
Santos, J. S., Leite, C., Viana, J., dos Santos, A. R., Fernandes, M. M., de Souza Abreu, V., et al. (2018). Delimitation of ecological corridors in the Brazilian atlantic forest. Ecol. Indic. 88, 414–424. doi:10.1016/j.ecolind.2018.01.011
Saura, S., Bastin, L., Battistella, L., Mandrici, A., and Dubois, G. (2017). Protected areas in the world’s ecoregions: How well connected are they? Ecol. Indic. 76, 144–158. doi:10.1016/j.ecolind.2016.12.047
Shi, F., Liu, S., Sun, Y., An, Y., Zhao, S., Liu, Y., et al. (2020). Ecological network construction of the heterogeneous agro-pastoral areas in the upper Yellow River basin. Agric. Ecosyst. Environ. 302, 107069. doi:10.1016/j.agee.2020.107069
Song, Y., Xue, D., Dai, L., Wang, P., Huang, X., and Xia, S. (2020). Land cover change and eco-environmental quality response of different geomorphic units on the Chinese Loess Plateau. J. Arid. Land 12, 29–43. doi:10.1007/s40333-019-0031-8
Song, Y. Y., Xia, S. Y., Xue, D. Q., Luo, S., Zhang, L., and Wang, D. (2022). Land space change process and its eco-environmental effects in the Guanzhong Plain urban agglomeration of China. Land 11, 1547. doi:10.3390/land11091547
Vergnes, A., Kerbiriou, C., and Clergeau, P. (2013). Ecological corridors also operate in an urban matrix: A test case with garden shrews. Urban Ecosyst. 16, 511–525. doi:10.1007/s11252-013-0289-0
Wang, R. H., Li, X. Y., Zhang, S. W., et al. (2014). Research for landscape ecological security pattern and early warning in farming-pastoral zone of northeast China: A case study of tongyu county in jilin province. Geogr. Geo-inf. Sci. 30, 111–115. doi:10.7702/dlydlxxkx20140223
Wang W, W., Feng, C., Liu, F., and Li, J. (2020). Biodiversity conservation in China: A review of recent studies and practices. Envir. Sci. Ecotechnology 2, 100025. doi:10.1016/j.ese.2020.100025
Wang X Y, X. Y., Chen, T. Q., Feng, Z., et al. (2020). Construction of ecological security pattern based on boundary analysis: A case study on jiangsu province. Acta Ecol. Sin. 40, 3375–3384. doi:10.5846/stxb201903310623
Wu, J. S., Yue, X. X., and Qin, W. (2017). The establishment of ecological security patterns based on the redistribution of ecosystem service value: A case study in the liangjiang new area, chongqing. Geogr. Res. 36, 429–440. doi:10.11821/dlyj201703003
Xiao, O. Y., Tang, L. S., Wei, X., and Li, Y. H. (2021). Spatial interaction between urbanization and ecosystem services in Chinese urban agglomerations. Land Use Policy 109, 105587. doi:10.1016/j.landusepol.2021.105587
Xie, H., He, Y., Choi, Y., Chen, Q., and Cheng, H. (2020). Warning of negative effects of land-use changes on ecological security based on GIS. Sci. Total Environ. 704, 135427. doi:10.1016/j.scitotenv.2019.135427
Xiong, J. H., Yue, W. Z., Chen, Y., Liao, R., and Fang, K. (2021). Multi-scenario urban expansion simulation for SDGs: Taking the central asian region along the belt and road as an example. J. Nat. Resour. 36, 841–853. doi:10.31497/zrzyxb.20210403
Yang, T. R., Kuang, W. H., Liu, W. D., Liu, A. L., and Pan, T. (2017). Optimizing the layout of eco-spatial structure in Guanzhong urban agglomeration based on the ecological security pattern. Geogr. Res. 36, 441–452. doi:10.11821/dlyj201703004
Yang, Y., and Cai, Z. (2020). Ecological security assessment of the Guanzhong Plain urban agglomeration based on an adapted ecological footprint model. J. Clean. Prod. 260, 120973. doi:10.1016/j.jclepro.2020.120973
Ye, H., Song, Y. Y., and Xue, D. Q. (2022). Multi-Scenario simulation of land use and habitat quality in the Guanzhong Plain urban agglomeration, China. Int. J. Environ. Res. Public Health 19, 8703. doi:10.3390/ijerph19148703
Yu, H., Wang, Y., Eme, C., Fan, X., Rong, Y., Zhang, Q., et al. (2021). Construction of ecological network based on multi-scale conversion and nesting. Water 13, 1278. doi:10.3390/w13091278
Yu, K. (1996). Security patterns and surface model in landscape ecological planning. Landsc. Urban Plann 36, 1–17. doi:10.1016/S0169-2046(96)00331-3
Yu, K. J., Wang, S. S., Li, D. H., and Li, C. B. (2009). The function of ecological security patterns as an urban growth framework in Beijing. Acta Ecol. Sin. 29, 1189–1204.
Zhang, B., Li, W. H., Xie, G. D., and Xiao, Y. (2009). Water conservation function and its measurement methods of forest ecosystem. Chin. J. Ecol. 28, 529–534. doi:10.13292/j.1000-4890.2009.0089
Zhang, D., Qu, L. P., and Zhang, J. H. (2019). Ecological security pattern construction method based on the perspective of ecological supply and demand: A case study of yangtze river delta. Acta Ecol. Sin. 39, 7525–7537. doi:10.5846/stxb201808301854
Zhang, S., Shao, H., Li, X., Xian, W., Shao, Q., Yin, Z., et al. (2022). Spatiotemporal dynamics of ecological security pattern of urban agglomerations in yangtze river delta based on LUCC simulation. Remote Sens. 14, 296. doi:10.3390/rs14020296
Zhang, X. Y., Wei, W., Bin-bin, X., Ze-cheng, G., and Jun-ju, Z. (2019). Ecological carrying capacity monitoring and security pattern construction in arid areas of Northwest China. J. Nat. Resour. 34, 2389–2402. doi:10.31497/zrzyxb.20191111
Keywords: ecological security pattern, ecological source, ecological corridor, resistance surface, Guanzhong Plain urban agglomeration
Citation: Ye H, Song Y, Xue D, Xia S, Tang Y and Zhang L (2023) Construction of an ecological security pattern for the Guanzhong Plain urban agglomeration: Scale perspective and hierarchy demand. Front. Environ. Sci. 11:1136630. doi: 10.3389/fenvs.2023.1136630
Received: 03 January 2023; Accepted: 07 March 2023;
Published: 17 March 2023.
Edited by:
Purabi Saikia, Central University of Jharkhand, IndiaReviewed by:
Deepak Kumar, University at Albany, United StatesAmit Kumar, Central University of Jharkhand, India
Copyright © 2023 Ye, Song, Xue, Xia, Tang and Zhang. This is an open-access article distributed under the terms of the Creative Commons Attribution License (CC BY). The use, distribution or reproduction in other forums is permitted, provided the original author(s) and the copyright owner(s) are credited and that the original publication in this journal is cited, in accordance with accepted academic practice. No use, distribution or reproduction is permitted which does not comply with these terms.
*Correspondence: Yongyong Song, songyongyong2010@163.com