Spatial distribution and temporal variation of tropical mountaintop vegetation through images obtained by drones
 Thaís Pereira de Medeiros
 Leonor Patrícia Cerdeira Morellato
 Thiago Sanna Freire Silva3*
- 1Graduate Program of Remote Sensing, National Institute for Space Research (INPE), Earth Observation and Geoinformatics Division (DIOTG), São José dos Campos, Brazil
- 2Phenology Lab, Institute of Biosciences, Despartment of Biodiversity, São Paulo State University (UNESP), Rio Claro, Brazil
- 3Ecosystem Dynamics Observatory (EcoDyn), Biological and Environmental Sciences, Faculty of Natural Sciences, University of Stirling, Stirling, Scotland, United Kingdom
Modern UAS (Unmanned Aerial Vehicles) or just drones have emerged with the primary goal of producing maps and imagery with extremely high spatial resolution. The refined information provides a good opportunity to quantify the distribution of vegetation across heterogeneous landscapes, revealing an important strategy for biodiversity conservation. We investigate whether computer vision and machine learning techniques (Object-Based Image Analysis—OBIA method, associated with Random Forest classifier) are effective to classify heterogeneous vegetation arising from ultrahigh-resolution data generated by UAS images. We focus our fieldwork in a highly diverse, seasonally dry, complex mountaintop vegetation system, the campo rupestre or rupestrian grassland, located at Serra do Cipó, Espinhaço Range, Southeastern Brazil. According to our results, all classifications received general accuracy above 0.95, indicating that the methodological approach enabled the identification of subtle variations in species composition, the capture of detailed vegetation and landscape features, and the recognition of vegetation types’ phenophases. Therefore, our study demonstrated that the machine learning approach and combination between OBIA method and Random Forest classifier, generated extremely high accuracy classification, reducing the misclassified pixels, and providing valuable data for the classification of complex vegetation systems such as the campo rupestre mountaintop grassland.
1 Introduction
Monitoring of grassland resources is important to guarantee the regional grassland conservation, management, and sustainable development (Fernandes et al., 2020). Through the development of science and new technologies the grassland ecosystems monitoring has been increasingly enriched (Lyu et al., 2020; 2022) and can make a unique contribution to the ecology and restoration this forgotten ecosystems. Traditional satellite remote sensing technology is a relevant means of monitoring regional grassland ecosystems, but the images obtained by satellite remote sensing tend to have low spatial resolution and the revisit cycle is too long (Peciña et al., 2019; Balasubramanian et al., 2020).
Recent developments for mapping and assessing ecosystem functions and services require information at a very detailed spatial resolution (Villoslada et al., 2020). In this sense, Unmanned Aerial Systems (UAS), also known as Unmanned Aerial Vehicles (UAV), Remotely Piloted Aerial Systems (RPAS), or simply “drones”, have advanced rapidly to satisfy these needs, and have been increasingly used for ecology, environmental and grassland studies (Anderson and Gaston, 2013; Colomina and Molina, 2014; Villoslada et al., 2020).
Modern UAS enables the production of maps and imagery with extremely high spatial resolution and can be a low-cost tool for monitoring vegetation at the landscape scale (Whitehead and Hugenholtz, 2014; Xie, Zhang, and Welsh, 2015; Wang et al., 2019a; Sun et al., 2021). With pixel-size in the order of centimeters (or even millimeters), UAS imagery has been used to extract structural and functional properties of environments, ranging from individuals to ecosystems (Anderson and Gaston, 2013; Singh and Frazier, 2018; Valbuena et al., 2020; Sun et al., 2021). The refined information provides a good opportunity to obtain and quantify the distribution of vegetation across heterogeneous landscapes, capturing variations in plant community cover and revealing an important strategy for biodiversity conservation (Baena, Boyd, and Moat, 2018; Wang et al., 2019a; Díaz-Delgado, Cazacu, and Adamescu, 2019; Prentice et al., 2021).
UAS can also offer very good temporal resolution (Nex and Remondino, 2013; Kampen et al., 2019) and have become more affordable and capable of offering autonomous and flexible functionalities, such as minimization of user intervention, including the ability to plan and conduct surveys to collect aerial photography (Hassanalian and Abdelkefi, 2017; Hamylton et al., 2020). Also, UAS are easy to operate and remotely controlled, allowing the users to go into areas that are inaccessible to humans (Feng et al., 2021). Moreover, UAS remote sensing systems are composed of at least five components: [1] Platform system; [2] Sensor system; [3] Ground control and data transmission system; [4] Data processing system, and [5] Operators (Sun et al., 2017).
Due to advantages in flexibility and high temporal and spatial resolution, UAS remote sensing technology has been applied in many fields, e.g., geography, ecology, and environmental science (Adao et al., 2017; Reis et al., 2019). In the case of grassland studies with UAS imagery it is possible to capture spectral differences between different vegetation species and effectively improve the accuracy of species identification on smaller vegetation units, providing a technical support for the fine monitoring of grassland vegetation species composition (Schmidt et al., 2017). Another important application of UAS imagery is in grassland degradation monitoring, including studies concerning degradation of total vegetation (biomass and productivity), degradation of vegetation structure (reduction of plant height and increase of weeds), processes that pose several challenges to grassland management and sustainable development (Lyu et al., 2020). The hyperspectral and hyperspatial remote sensing technology can further obtain more-in-depth data information and help in monitoring of grassland vegetation structure (Lyu et al., 2022).
In addition, besides the affordable RGB cameras, a wide variety of vegetation mapping sensors can be operated from a UAS platform, including multispectral sensors focused on red and near-infrared wavebands, hyperspectral sensors that detect reflectance at many wavelengths, and, the range of LiDAR sensors (light detection and ranging), indicated to study the degree of vegetative ground cover and characterize canopy structure (Colomina and Molina, 2014; Hamylton et al., 2020). RGB cameras are most used due, mainly, to their low cost and ease of use (Pichon et al., 2019), while multispectral sensors can better evaluate plant health and stress status, due to their highest spectral resolution (Wang et al., 2019b). Finally, as another advantage of UAS, ultra-low altitude flying can reduce the effect of clouds on imagery and thereby improve the data quality (Watts, Ambrosia, and Hinkley, 2012; Sun et al., 2021).
One of the applications of Remote Sensing is the use of imagery to classify and delineate different objects and land cover types on the Earth’s surface, a process that involves collecting field data from a series of samples as an input for training a classification model (Zou and Greenberg, 2019; Prentice et al., 2021). Classification in Remote Sensing involves the categorization of response functions recorded in imagery as representations of real-world objects, according to their spectral similarity to the initial values overlapping the samples, which can provide detailed information about land-cover, specifically in a mixed forest-grassland (Corbane et al., 2015; Cullum et al., 2016; Hamylton et al., 2020; Zhang et al., 2021).
In the context of climate change and rapid transformation of grassland environment due to anthropogenic activities, mainly during the lasted four decades (Fernandes et al., 2020; Buisson et al., 2022), the grassland classification is crucial for its management. The identification of grassland classes provides the basis for the protection of grassland resources and for the reconstruction and restoration of a grassland ecological environment (Meng et al., 2022).
Conventional platforms are characterized by lack of spatial detail to solve and classify fine landscape features (individual trees and shrubs), requiring large amounts of cost and resources (Wang et al., 2019a; Meng et al., 2022). In this regard, hyperspatial tools, such as UAS imagery, have been successfully applied in many fine-scale classification studies, allowing the identification of subtle variations in species composition, and capturing detailed vegetation and landscape features, for instance, shadows, stems, and canopy gaps (Laliberte and Rango, 2013). According to a study performed by Christian and Christiane (2014), data collected from UAS can capture more information about environment composition and structure. Thus, using UAS high-resolution cameras is one of the most preferred methods to classify land cover in a mixed savannas-grassland ecosystem (Zhang et al., 2021).
However, there are still several challenges in using this strategy, including the development of appropriate procedures to manage and extract information from high-volume and hyperspatial resolution data. One of the challenges is how to deal with shadows cast by trees, high intra-class spectral variation, and high inter-class spectral heterogeneity (Lu and Weng, 2007; Lu and He, 2017; Berra, Gaulton, and Barr, 2019).
The classification process can be divided into unsupervised and supervised classification algorithms, revealing it as a crucial tool to achieve interpretable results. Unsupervised classification techniques group pixels or segments according to their similarity using a variety of different algorithms. On the other hand, supervised classification requires the use of training sample areas, in other words, spectral signatures of the objects under study (Schafer et al., 2016; Nogueira et al., 2019).
The application of conventional classification techniques on hyperspatial imagery can result in the misclassification of pixels with identical spectral responses to different classes, causing an effect known as “salt and pepper”. Furthermore, traditional supervised classifiers assume the normal distribution of remote sensing datasets (Jensen, 2015), but these datasets can deal with complex and non-linear relations, thus conventional classification algorithms do not fit to classify the ultrahigh remote sensing data (Thessen, 2016; Oddi et al., 2019).
Some strategies have been developed to solve these problems: A. Inclusion of texture features in a classifier; B. Object-Based Image Analysis (OBIA), in which an image is pre-segmented into polygons; C. Using computer vision and machine learning techniques, such as random forest, support vector machine and convolutional neural networks (Nguyen et al., 2019; Zou and Greenberg, 2019). In addition, the accuracy of vegetation identification will depend on four factors: spatial resolution, spectral resolution, habitat complexity, and classification algorithms.
Object-Based Image Analysis (OBIA), more specifically Geographic Object-Based Image Analysis (GEOBIA), has provided important methodological refinements for high-resolution image classification, having advantages over traditional pixel-based methods, and is considered a superior classification technique (Liu and Abd-Elrahman, 2018; Dujon and Schofield, 2019). GEOBIA methods are based on pre-clustering the image pixel into homogeneous objects (regions, clusters), according to specific spectral characteristics (features, color, texture), and shape characteristics (Blaschke, 2010).
Machine Learning (ML) approach, one of the most popular latest technologies in the fourth industrial revolution (Sarker, 2021), has been developed as a response to the rigidity of many other computer programs in comparison with the world’s infinite versatility. Emerged within the field of artificial intelligence, ML aims to deal with complex data and to learn without being explicitly programmed (Mahesh, 2020; Prentice et al., 2021). The data and desired result are provided to a learning algorithm (a “learner”), which then generates the algorithm that turns one into the other (Dujon and Schofield, 2019; Hamylton et al., 2020). ML algorithms are divided into four categories: Supervised learning, Unsupervised learning, Semi-supervised learning, and Reinforcement learning. In the case of Supervised learning (the category focused on the research), the most common supervised tasks are the “classification algorithms”, which separate the data, and the “regression models”, which fit the data, but do not offer predictive capability (Sarker, 2021). The supervised learning technique, specifically the classification process, has been successfully applied to sequential RGB images from ground digital cameras focused on species recognition, and in studies that involve ecology and Earth sciences applications (Almeida et al., 2014; 2016; Thessen, 2016; Maxwell, Warner, and Fang, 2018).
In ecology, the Random Forests algorithm is commonly used to perform the supervised classification process, followed by maximum likelihood classification, support vector machine, K-means clustering, convolution neural networks, and thresholding (Dujon and Schofield, 2019). Random Forest (RF) is an ensemble learning technique based on decision trees, which has higher accuracy when compared to traditional methods, enabling the simultaneous classification of features based on a set of training samples, making possible the determination of the best performing explanatory variables (Breiman, 2001).
Considering the advantages and challenges explained, the present work aimed to answer the following questions: Are the machine learning techniques effective to process the ultrahigh-resolution data generated by UAS images? Is the OBIA an effective method for classifying heterogeneous vegetation? Using a Random Forest classifier, what is the better combination of parameters for proposing a high quality of ultrahigh spatial resolution classification? We focus our fieldwork on a highly diverse, seasonally dry, complex mountaintop vegetation system, the campo rupestre or rupestrian grassland, considered a vegetation mosaic or a continental archipelago (Morellato and Silveira, 2018; Mattos et al., 2019; Vasconcelos et al., 2020). The mosaic formed by the vegetation types, from grasslands, and rocky outcrops to cerrado and forest patches, poses a challenge to accurately classify campo rupestre vegetation diversity at a landscape scale, a prime measure for the conservation of this threatened ecosystem (Fernandes et al., 2018; 2020). This high diversity of vegetation types cannot be distinguished in conventional imagery, like Sentinel-2 or even Planetscope imagery, but in UAV imagery this is possible.
2 Materials and methods
2.1 Study area
The Espinhaço Mountain Range, in central Brazil, is a known center of plant diversity with more than 5,000 recognized plant species (Rapini et al., 2008; Silveira et al., 2016). The Southern Espinhaço Range is recognized as a phytogeographic province, having its type locality at the Serra do Cipó National Park (Giulietti, Pirani, and Harley, 1997; Colli-Silva, Vasconcelos, and Pirani, 2019), while Serra do Cipó comprises only c.a. 200 km2 (less than 5% of entire range), still hosts more than one-third of Espinhaço’s total biodiversity. Among the represented vegetation types, the region is known for its highly heterogeneous campo rupestre (rupestrian grasslands) vegetation (Mattos et al., 2019). Campo rupestre is a component of the Cerrado floristic domain (Brazilian savanna), dominated by grasslands and restricted to areas of shallow soil and rugged topography above 900 m (Silveira et al., 2016; Morellato and Silveira, 2018).
Campo rupestre is characterized by extremely high plant species richness and endemism (Fernandes, 2016), which has been mostly explained by long-term climatic stability, the so-called Old Climatic Buffered Infertile Landscapes (OCBILS) (Silveira et al., 2016; Morellato and Silveira, 2018). During the 18th and 19th centuries, the Espinhaço Range and particularly Serra do Cipó were impacted by human activities linked to gold and diamond exploration, and with the decline of mineral deposits by the end of the 19th century the main economic activity of the region has switched towards tourism (Rapini et al., 2008; Fernandes et al., 2018; 2020).
The climate in Serra do Cipó region is strongly seasonal, with a dry and cold season from April to September, and a wet and warm season from October to March. The mean total annual precipitation is approximately 1,600 mm, and mean annual temperatures are around 21°C (Le Stradic et al., 2018). According to the Brazilian National Water Agency (Agência Nacional de Águas, in Portuguese), the dry season has a monthly rainfall of 10 mm or less, while in the wet season monthly rainfall is around 230 mm.
2.2 Drone imagery and field data collection
Drone image acquisition was done within the private conservation area belonging to CEDRO Têxtil S.A. (located between latitudes of 19°12′S and 19°34′S and, longitudes of 43°27′W and 43°38′W), contained within the Morro da Pedreira Environmental Protection Area (Figure 1), locally named as Cedro (Mattos et al., 2019).
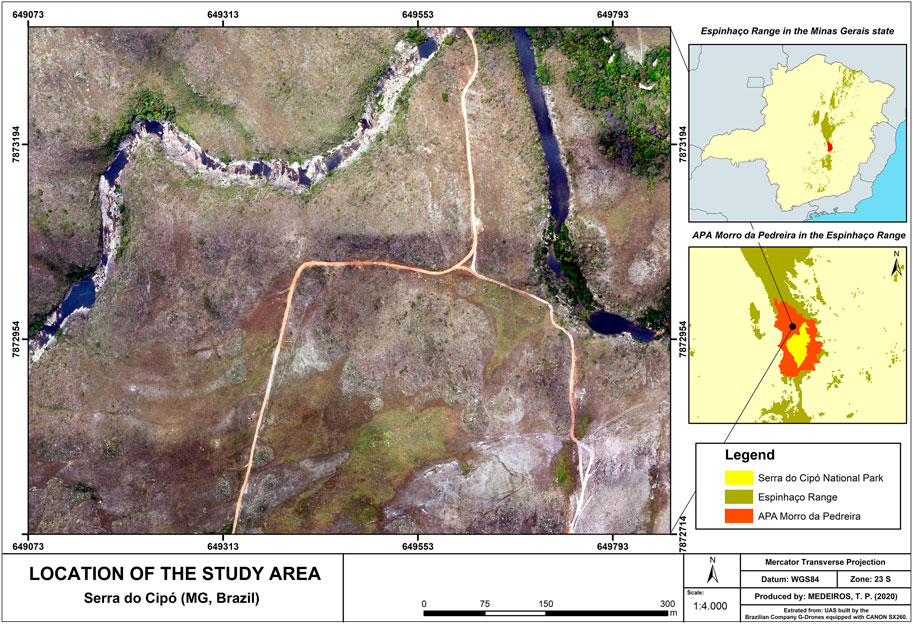
FIGURE 1. The location of the Cedro study site, a private conservation area belonging to CEDRO Têxtil S.A., in the Serra do Cipó and within the Morro da Pedreira Environmental Protection Area, where the imagery was performed.
Aerial photos were acquired using a fixed-wing UAS, which your characteristics can be viewed in Table 1. Flight lines, number of photos, and spatial resolution were automatically calculated based on informed sensor size, focal length, the flying height of 120 m above ground, and 80% overlap between consecutive flight lines. The aerial imaging mission covered a core 800 × 800 m square area (64 ha), yielding final orthomosaics with a nominal spatial resolution of 5 cm/pixel. The area was imaged at monthly intervals from February 2016 to February 2017, totaling 12 flights.
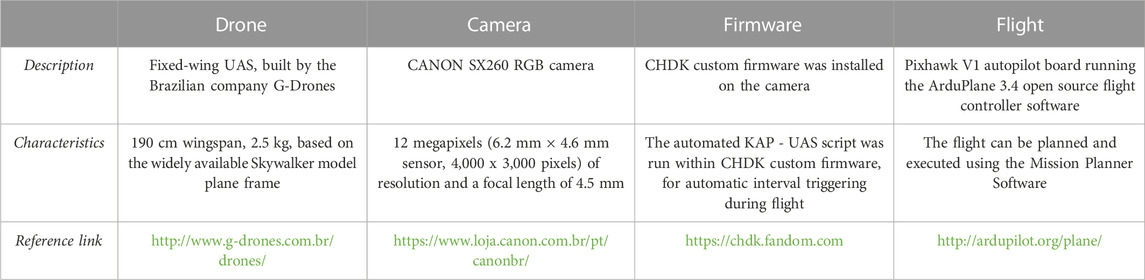
TABLE 1. Description and characterization of all equipment (Camera, Firmware, and Flight) installed on the fixed-wing UAS.
The resulting aerial photos were mosaicked and orthorectified using the Pix4D Mapper 3.1 Educational software (https://www.pix4d.com/), using a proprietary implementation of the Structure from Motion (SfM) algorithm. SfM is a computer vision technique capable of extracting an individual’s reference points for automatic alignment and positioning of aerial photos, then generating a tridimensional point cloud, which can then be further transformed into a Digital Surface Model (DSM), which is in turn used to produce the resulting orthomosaic (Westoby et al., 2012).
In July 2018, we performed a fieldwork in-person in Serra do Cipó to collect georeferenced ground points, according to the predefined mapping classes (see Classification section). At each sampling point, the main vegetation/cover class was identified, and the location was logged using a Garmin GPSMAP 64 s GPS receiver. These ground points were used to support the sample collection process for each spectral class.
2.3 Orthomosaic registration
Due to the low accuracy of embedded camera GPS information, further manual co-registration was necessary to align the times series of orthomosaics (Tsai and Lin, 2017). This step was performed on the ENVI 5.0 software. We chose as reference image the best image in the series in terms of brightness, and shading, as well as the closest alignment to Google Maps™ aerial imagery, which corresponded to the image acquired on 2016-09-25.
We then selected fifty Ground Control Points (GCPs), between the reference image and each image to be co-registered, and then, applied a second-order polynomial transformation with nearest neighbor pixel resampling, using a standardized 5 cm/pixel grid. Estimating post-registration accuracy, we selected further GCPs between the reference image and a subsample of the imaged dates and then calculated horizontal, vertical, and Euclidean distance displacement between each image pair. The chosen dates for positional validation were 2016-02-23, 2016-05-22, 2016-08-16, and 2016-11-30.
2.4 Image classification
From the available drone image time series, we selected two dates, 2016-09-25 (dry season) and 2017-01-05 (wet season), which represented different phenological stages of the vegetation (Le Stradic et al., 2018). We then classified the two images separately, as well as combined the stack of the two images.
The classification approach followed the usual framework of GEOBIA methods, composed of image object generation, feature extraction, and object classification (Blaschke, 2010). We generated image objects using the Shepherd image segmentation algorithm implemented on free and open-source Remote Sensing and GIS Software Library (RSGISLib), based on K-means clustering and accessible through the Python programming language (Bunting, Clewley, and Lucas, 2014). This algorithm takes the following main parameters: NumClusters, MinPxls, DistThres, Sampling, and KmMaxIter (Table 2).
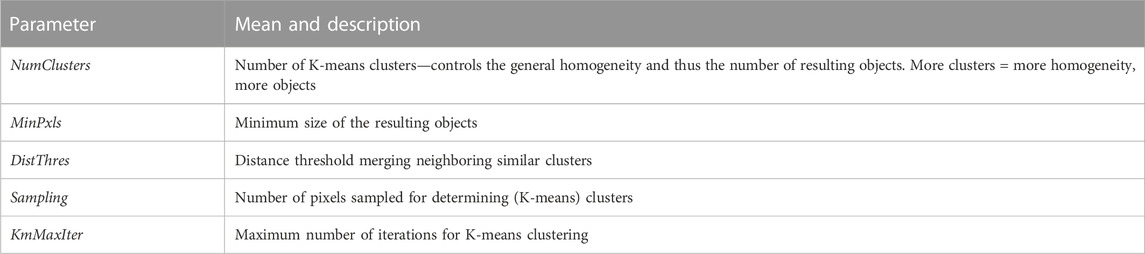
TABLE 2. Description of the parameters used in the RSGISLib software for segmenting drone images from Serra do Cipó (MG, Brazil) to support rupestrian grassland vegetation type classification.
We tested ten different combinations of these parameters (Table 3) to determine the one that produced the balance between the numbers of resulting objects vs. object homogeneity. This assessment was done visually by inspecting the resulting objects overlaid on the base segmentation image, as usual for GEOBIA applications.
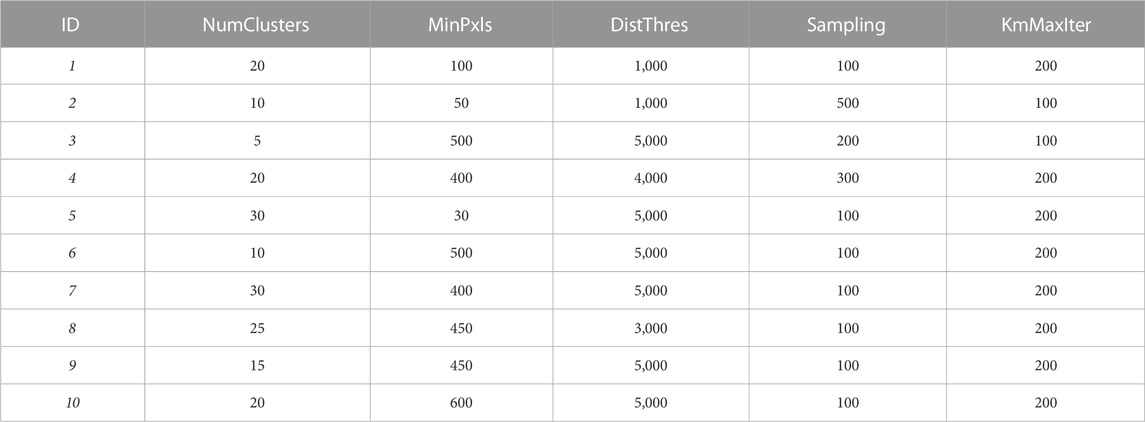
TABLE 3. Combinations of image segmentation parameters (NumClusters, MinPxls, DistThres, Sampling, and KmMaxIter, see Table 1) for generating image objects to classify rupestrian grassland vegetation types on UAV images from Serra do Cipó (MG, Brazil).
Our classification key was comprised of nine spectral classes: “Sandy Grassland”, “Stony Grassland”, “Wet Grassland”, “Rocky Outcrop”, “Cerrado Scrubland”, and “Riparian Forest” vegetation types (Morellato and Silveira, 2018; Mattos et al., 2019), as well as “Bare Soil”, “Bare Rocks” and “Water Body”, non-vegetation cover (Table 4). We defined class training samples by delineating polygons over the UAS images, guided by a subsample of 70% of the ground observation, while the remaining 30% were destined for accuracy assessment.
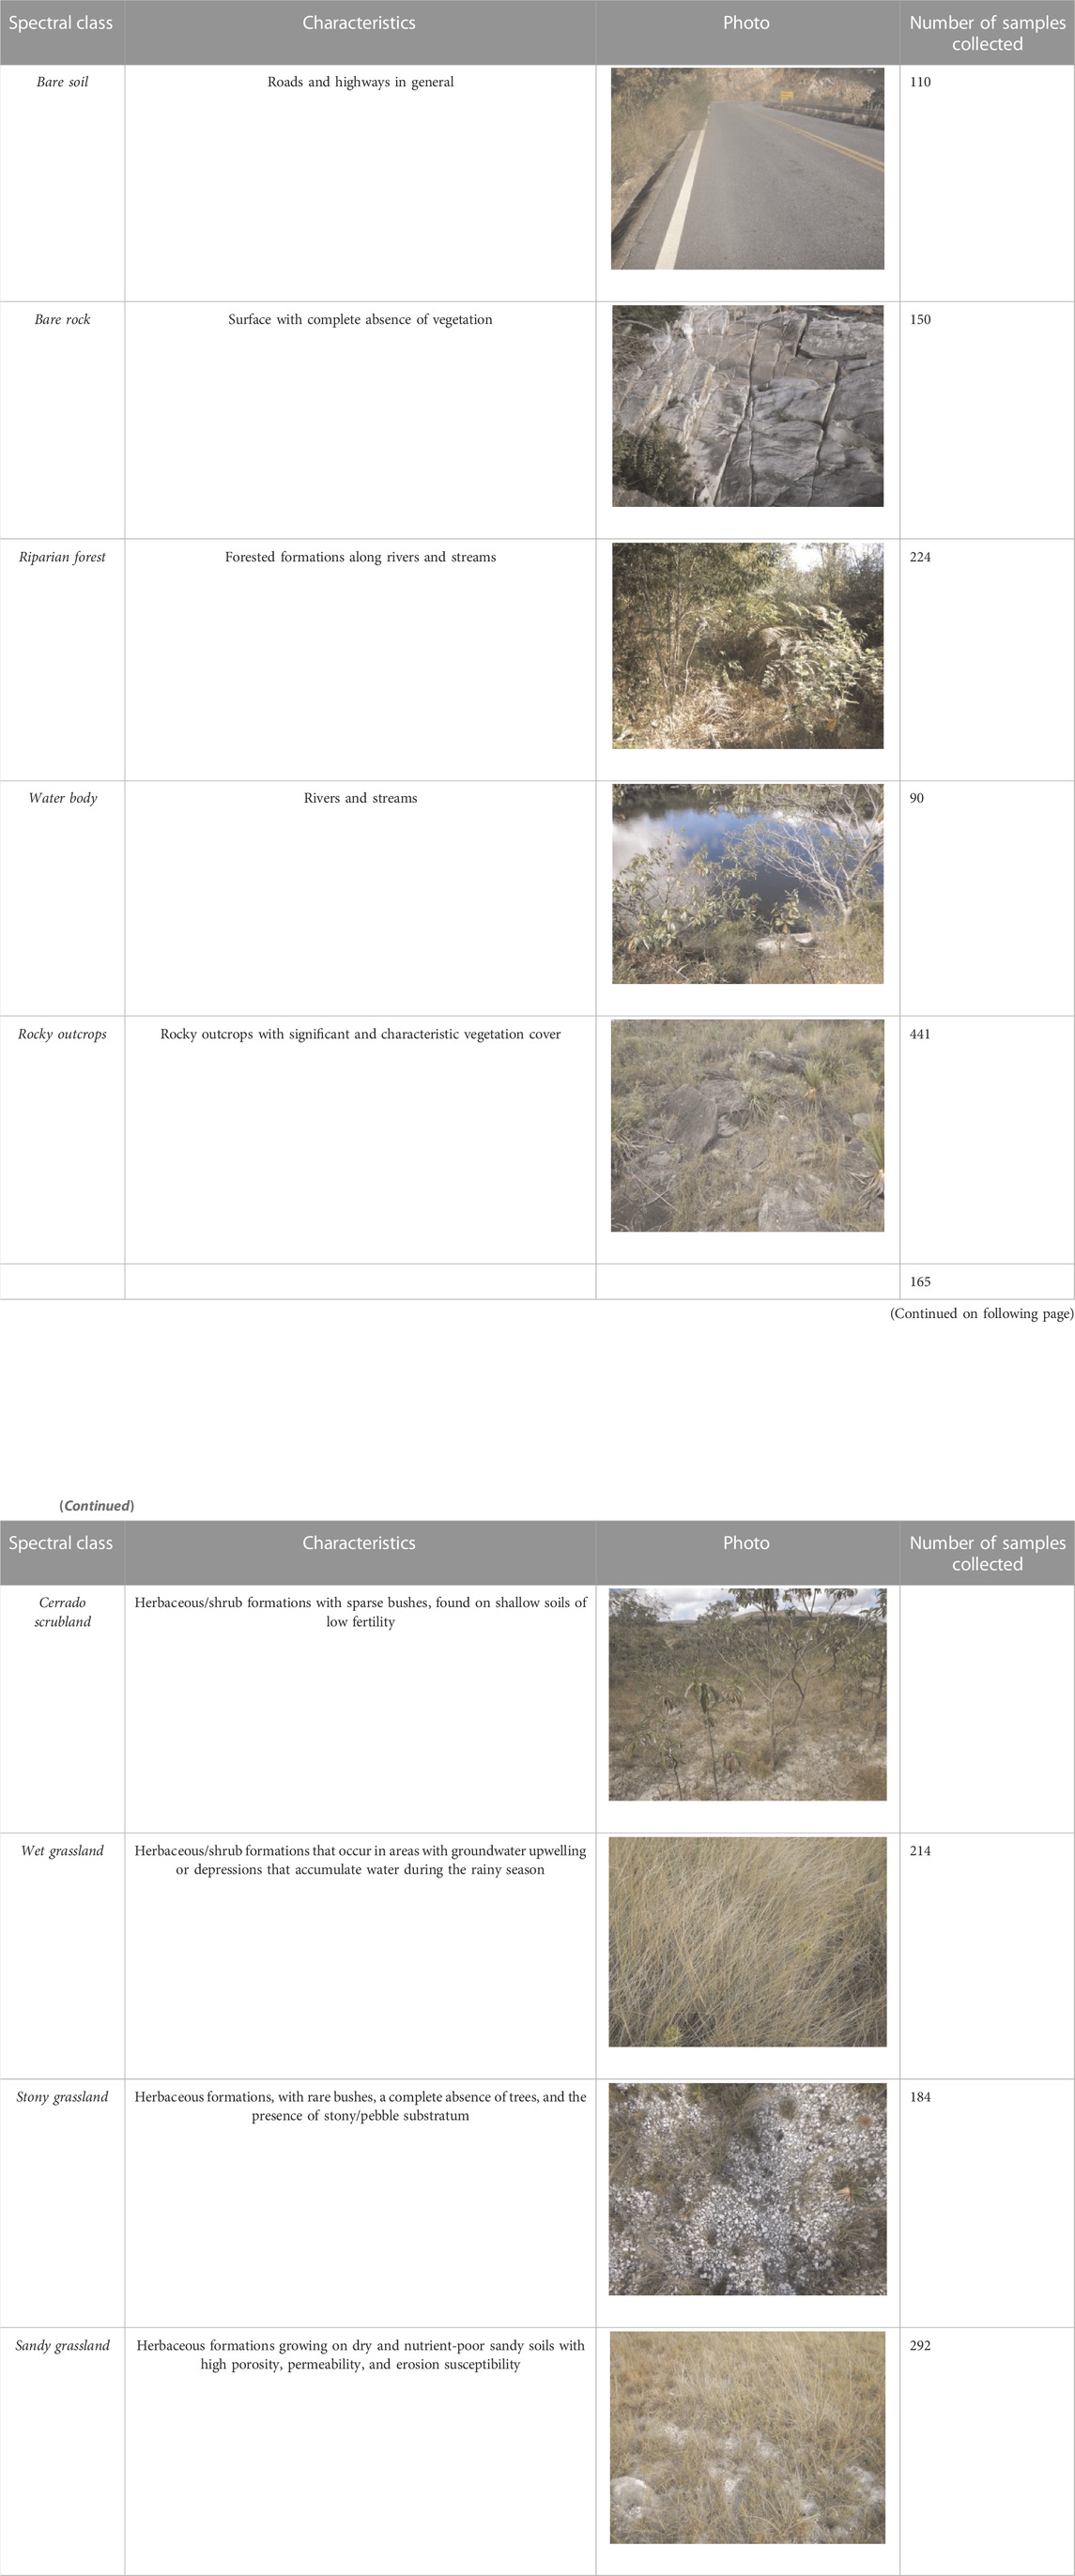
TABLE 4. Spectral classes used for drone image classification of rupestrian grasslands at Serra do Cipó (MG, Brazil).
Image classification was applied using the Random Forest approach, a machine learning algorithm from the Sci-Kit Learn Python library (Pedregosa et al., 2011), accessible in the RSGISLib library (https://www.rsgislib.org/). This approach can be applied to quickly identify best-performing features and build a robust classification model (Rodriguez-Galiano et al., 2012). The main parameters of the Random Forest algorithm are n-estimators and max-features, the first referring to the number of decision trees generated by the classifier, and the second representing the maximum number of randomly chosen attributes considered by the algorithm when creating nodes on each decision tree. We tested three combinations of parameters, varying in the number of decision trees: 5, 200, and 500 numbers of decision trees.
Assessing the resulting accuracy of each classification, we computed the confusion matrix, general accuracy, and Kappa index of agreement (Congalton, 1991) for each classification, based on the reference data, using the custom ‘rsacc’ package developed in R (https://github.com/EcoDyn/rsacc).
The overview of the methodological procedures can be visualized in Figure 2.
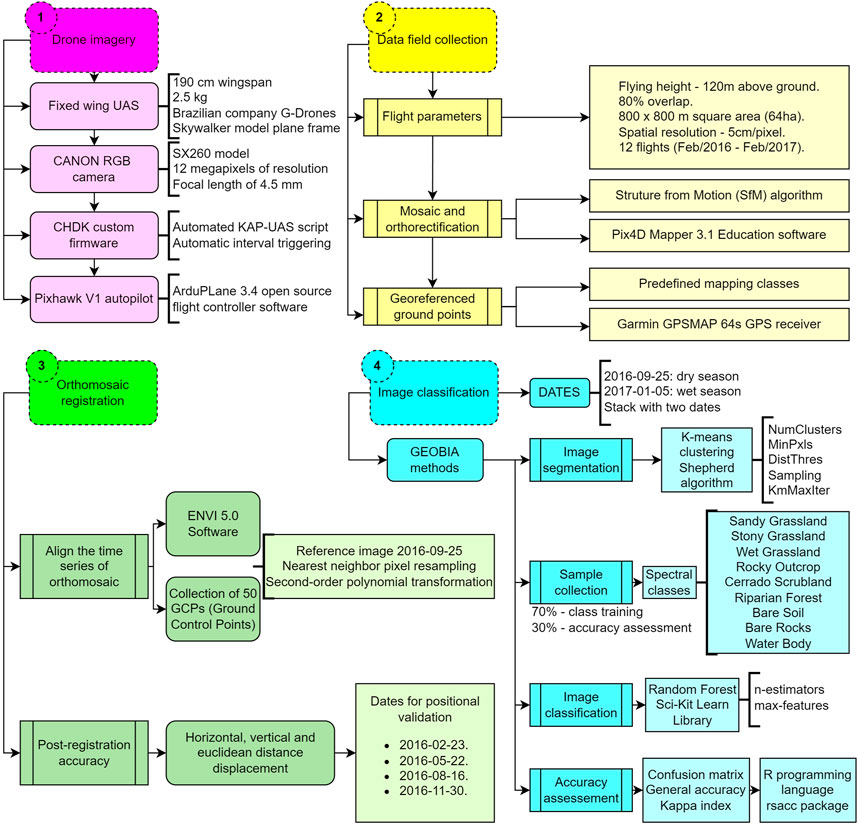
FIGURE 2. Flowchart with methodological procedures performed in the research, divided into four main steps: [1] Drone imagery (pink); [2] Data field collection (yellow); [3] Orthomosaic registration (green), and [4] Image classsification (blue).
3 Results
The results of orthomosaic registration revealed the importance of complete alignment of the time series to obtaining concrete, effective and accurate results in the classification process. Figure 3 shows the comparison between the Euclidean distance displacement before and after the registration process, revealing the improvement in the quality and accuracy of images generated by UAS.
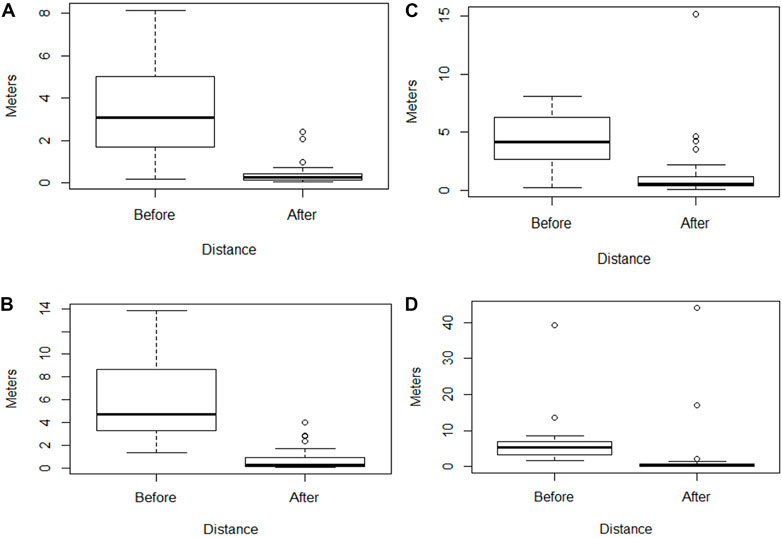
FIGURE 3. Results of orthomosaic registration for four dates of the temporal series images from rupestrian grasslands (Serra do Cipó, MG), comparing the Euclidean distance displacement before and after registration processes. Drone flight image dates from (A) 23 of February 2016; (B) 22 of May 2016; (C) 16 of August 2016; (D) 30 of November 2017.
Regarding the segmentation process, according to enumeration in Table 3, segmentation 10 showed the best parameter combination, producing results that properly covered the homogeneity areas of the image. We used photointerpretation and visual techniques to choose the best parameter combination.
In addition, concerning the classification processes, all values extracted during the validation process performed in R (KAPPA index, overall accuracy, and overall error) are shown in Table 5. The classification to the date 05 of September 2016 received 0.987 for KAPPA Index and 0.989 for general accuracy. Moreover, the classification to the date 05 of January 2017 received 0.985 for KAPPA Index and 0.988 for general accuracy. Finally, the classification using the stack with two dates received 0.969 for KAPPA Index and 0.974 for general accuracy.
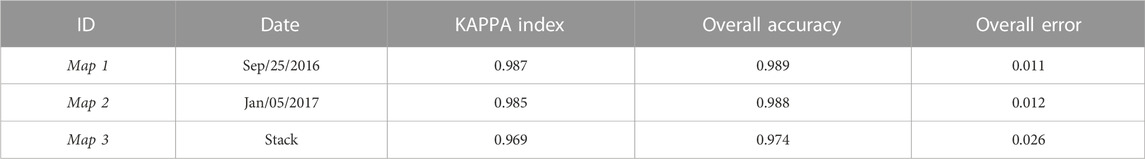
TABLE 5. Results of all classification performed using the Random Forests algorithm.
The processes using machine learning techniques require attention to their parameter choice. In the case of Random Forests, the main parameter tested is n-estimators, referring to the number of decision trees generated by the classifier. We tested three different numbers of decision trees, as exposed in Materials and Methods, and 500 trees were chosen as the better number for classifying the rupestrian grassland.
In general, the greater number of decision trees means a greater number of analyzes that the algorithm will perform to arrive at a result. This number of decision trees was chosen due to the peculiarities present in the type of image (hyperspatial resolution) and in the type of vegetation (rupestrian grassland with high vegetation heterogeneity). In this sense, for effective classification of the rupestrian grassland, more decision trees were needed. Thus, all data was processed using 500 decision trees and these results are presented in Figure 4.
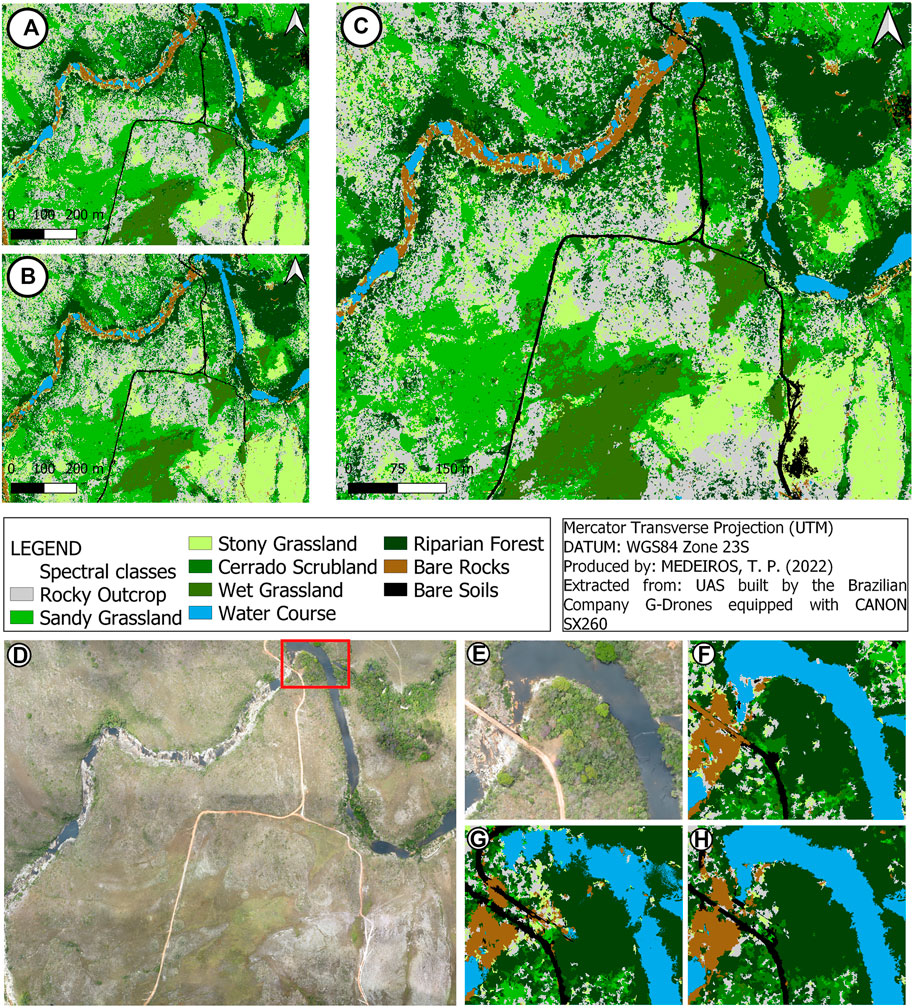
FIGURE 4. Classification of rupestrian grassland Serra do Cipó (MG, Brazil): (A) drone flight image from 25 September 2016; (B) drone flight image from 05 January 2017; (C) stack with two drone flight dates: 25 September 2016 (dry season) and 05 January 2017 (wet season); (D) original orthomosaic arising from SfM algorithm; (E) zoom of a specific portion of the original orthomosaic; (F) zoom of a specific portion of the drone flight classified image from 25 September 2016; (G) zoom of a specific portion of the drone flight classified image from 05 January 2017; (H) zoom of a specific portion of the stack classified image.
We classified each image individually and, also, the stack image (a merged between the image dated 25 September 2016 and 05 January 2017). According to Table 6, which shows the proportion of each spectral class according to the total area, in each classification performed, the Rocky Outcrop class received the highest percentage of area classified (25.398% in September 2016, 24.107% in January 2017 and 25.114% in stack), followed by Sandy Grassland (20.806% in September 2016, 21.108% in January 2017 and 18.689% in stack). The lowest percentage of area classified focus on Bare Soils (1.243% in September 2016, 0.994% in January 2017 and 1.408% in stack), followed by Bare Rocks (1.924% in September 2016, 2.431% in January 2017 and 2.325% in stack). The stacking process helped the algorithm to properly classify the spectral classes present in rupestrian grassland according to reality, furthering the capture of different phenological stages and patterns of each vegetation type.
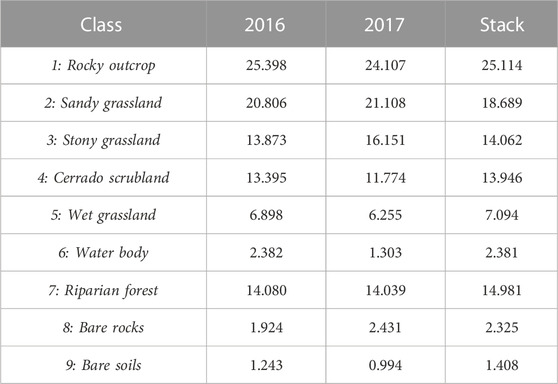
TABLE 6. Percentage of each spectral class identified in classification maps (25 September 2016, 05 January 2017 and the stack).
In Tables 7–9 we presented the results of analyzes performed with the error matrix of each classification process. An error matrix is a square array of numbers set out in rows and columns, in which the columns represent the reference data (validation data) while the rows represent the classification generated from the UAS data. The major diagonal of the matrix indicates the percent of pixels classified correctly, while the off-diagonal cell values represent the percent of pixels classified incorrectly in each spectral class.
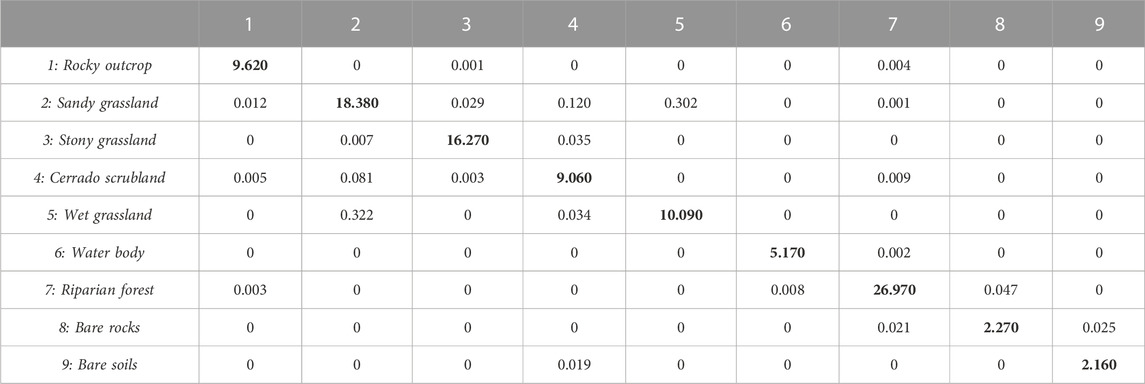
TABLE 7. Error matrix derived from the classification performed with Random Forest algorithm, using drone flight from date 25 September 2016.

TABLE 8. Error matrix derived from the classification performed with Random Forest algorithm, using drone flight from date 05 January 2017.
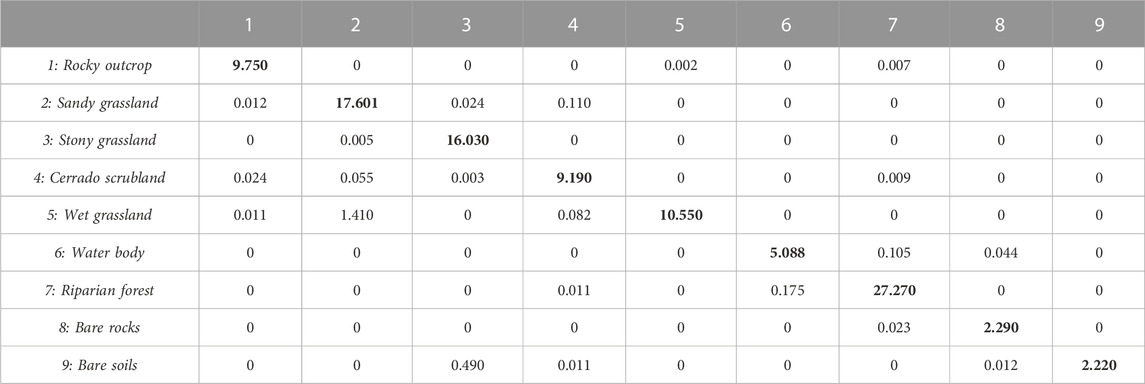
TABLE 9. Error matrix derived from the classification performed with Random Forest algorithm. Stack with two drone flight image dates: 25 September 2016 and 05 January 2017.
In all results, we detected an uncertainty between two spectral classes: sandy grassland and wet grassland. In Table 7, 18.380% of pixels of sandy grassland were classified correctly, but 0.322% of these pixels were misclassified as wet grassland. In Table 8, 19.320% of pixels were classified correctly and 0.283% misclassified. In Table 9, 17.601% were classified correctly and 1.410% misclassified.
The other two relevant analyzes performed in the error matrix are presented in Table 8, where 0.493% of pixels of bare soils were misclassified as stony grassland. Also, in Table 9, 0.490% of pixels of stony grassland were misclassified as bare soils. This analysis showed some uncertainty between bare soils and stony grassland.
4 Discussion
Multi-temporal UAS images associated with RGB cameras, and the machine learning methods applied in our study produced consistent results, as far as concerns the ecology analysis and are adequate for mapping vegetation, at least at the life-form level (i.e., tree, shrub, and herbaceous species). The combination between the OBIA method and the Random Forest classifier reduced the misclassified pixels and the effect known as ‘salt and pepper’, generating extremely high general accuracy and kappa index. In general, machine learning approaches have high potential to capture the non-linear relationship between remote sensing data and vegetation parameters and have the capability of integrating multisource information at different levels (Yao, Qin, and Chen, 2019). In addition, the results acquired confirmed the importance of using machine learning algorithms in remote sensing vegetation classification, due to their powerful adaptation, self-learning, and parallel processing capabilities (Navin and Agilandeeswari, 2020; Meng et al., 2021; 2022).
Therefore, some challenges need to be emphasized and both the hardware and software of UAS remote sensing technology require improvements: [1] The endurance of UAS is relatively limited, the flight stability is not strong enough in areas with large terrain fluctuation and the lack of flight altitude limits the image size; [2] Although more lightweight and smaller sensor systems have become available, such as hyperspectral and LiDAR sensors, but they are still expensive; [3] The integration between UAS platforms and sensors requires improvement, e.g., most of the multispectral, hyperspectral, and thermal sensors are built independent of the UAV platform, so, need an extra GPS module and, also, UAS are often equipped with a single sensor, multisensor integration is beneficial to improve monitoring accuracy and efficiency; [4] The mosaic workload is significantly higher than satellite imagery, which takes up more time for image processing, resulting in the need to develop more robust algorithms, like deep learning techniques, in addition, the technology of mass data processing needs to be improved due to the richness and variety of data obtained; [5] The most vegetation classifications via UAS require human participation and interpretation, indicating that the combination between UAS remote sensing with ground data and satellite data needs to be strengthened; if the dataset used for training is extent, computer learning techniques would generate a satisfactory classification outcome; [6] The use of UAS images to monitor tropical savannas leaf phenology is a challenge due to difficult methods to extract accurate quantitative phenology estimates under variable lighting and viewing conditions; [7] The application scenarios of UAS remote sensing in grassland ecosystem monitoring need to be expanded and deepened, mainly in animal investigation and soil physical and chemical monitoring; and also, the correlation between the scientific research of UAS remote sensing monitoring and practical decision making of grassland management is still insufficient (Neumann et al., 2019; Park et al., 2019; Lyu et al., 2020; 2022; Sun et al., 2021).
The hyperspatial imagery, like UAS technology, associated with machine learning classification techniques enabled the identification of even fine grassland vegetation types such as wet, stony, and sandy grasslands. Although, some adjustments were necessary for improving the accuracy of orthomosaic classification, such as [1] precise sensor position; [2] orientation data, and [3] several GCPs during the orthomosaic registration process (Tsai and Lin, 2017).
4.1 Grassland classification and their relationship with vegetation phenophases
Identifying the grassland classes are crucial for managing and utilizing grassland resources and for reconstructing and restoring the grassland ecological environment (Meng et al., 2022). To further understand the vegetation distribution across a tropical mountaintop landscape, and associate this with leafing dynamics, we quantified the Land Use and Land Cover patterns at the vegetation level using OBIA method and Random Forests classifier. Using hyperspatial imagery through UAS remote sensing technology was possible the identification of vegetation phenophases. Phenophases, from phenology, are defined as an observable stage or phase in the annual life cycle of a plant or animal and are considered as the period over which newly emerging leaves are visible or open flowers are present on a plant or community (Camargo et al., 2018). Abiotic factors, mainly water and light availability, are primary drivers of plant phenology, and are important to predict vegetation changes over time (Walker and Noy-Meir, 1982; Alberton et al., 2019), for instance, water availability regulates the length of the growing season and the phenological synchrony among savannas species (Camargo et al., 2018; Alberton et al., 2019).
Generally, tropical savannas present marked seasonality (Walker and Noy-Meir, 1982), with a conspicuous contrast between the dry and rainy seasons (Ferreira et al., 2003; Camargo et al., 2018; Alberton et al., 2019), and tropical species present high heterogeneity of phenological patterns (Camargo et al., 2018; Park et al., 2019). Leafing is the plant phenological event that defines the growth season and controls crucial ecosystem processes (Alberton et al., 2014; 2019), in our case, the image dated 25 September 2016 (end of dry season) revealed the beginning of springtime, showing the timing of the budburst of individual trees and coinciding with the beginning of tree canopy and grassland greenness (Streher et al., 2017), which is responsible for causing a change in leaf color (Alberton et al., 2017; 2019; Camargo et al., 2014; 2018), consequently, resulting in a differentiation visible in the orthophoto. Otherwise, the image dated 5 January 2017 represents the end of canopy development in the wet season, indicating the tree’s mature leaf stages, the leaf aging process, and flowering/fruiting across the grasslands (Alberton et al., 2017; Alberton et al., 2019; Streher et al., 2017; Le Stradic et al., 2018; Camargo et al., 2014; 2018). This process causes a new change in the color patterns identified in the orthophoto. Our results resemble the sharp seasonal changes or spring flushing and abscission in autumn described by Klosterman and Richardson (2017). In addition, the stack method helped to capture these minor differences in vegetation phenophases, mainly due to the differentiation in the color composition of the orthophoto.
Detailed phenophase delineations are limited in conventional satellite imagery, with spatial resolutions in order to meters/kilometers. Conversely, fine-scale phenological variations are mainly driven by individual species distributions and cannot be mapped by satellite imagery (Klosterman et al., 2018; Neumann et al., 2019). In general, ecologists use near-surface remote sensing, such as tower-mounted cameras, called “phenocams”, to quantify tropical leaf phenology, but the problem with this method is the limited area covered by phenocams, providing insufficient sample sizes for studying intra and interspecific variation of leaf phenology (Park et al., 2019). In this sense, UAS remote sensing techniques open up promising potentials for detailed ecosystem studies, and for the first time in ecology and remote sensing research history, the structure of ecosystems can be quantified from individual plants down to the leaf scale (Díaz-Delgado, Cazacu, and Adamescu, 2019).
Plant phenology has been recognized as an ecological key indicator of ecosystem dynamics and represents an important manifestation of the temporal change of growth and reproduction in the plant life-cycle (Morellato et al., 2016). The association of plant phenology-mapping may act as a key component for monitoring vegetation dynamics, management practices and ecological restoration in applied nature conservation, and is regarded as fingerprints of climate change and biodiversity loss (Neumann et al., 2019; Park et al., 2019).
In summary, data collection and processing of UAS remote sensing is new and complicated for most ecologists and remote sensing researchers but opens new possibilities in plant ecology by addressing classical ecological questions at different ecological scales, individual, population, or community levels. Besides, some studies demonstrated that object-based classification approaches can successfully classify ultrahigh spatial resolution imagery, but the choice between what methods are better does not follow rigid rules and depends on the aims of your study and on several characteristics of the available data and the study area, such as vegetation type and phenology, land cover heterogeneity and imagery features (Ma et al., 2017; Ruwaimana et al., 2018).
5 Conclusion
This study examined the use of Unmanned Aerial Systems remote sensing technology associated with machine learning techniques (OBIA method and Random Forest algorithm) to classify and understand the vegetation distribution across a grassland landscape. Through the results obtained with the validation process all classifications performed received general accuracy and KAPPA index above than 0.96, indicating a high efficiency of machine learning techniques to process the ultrahigh spatial resolution data generated by UAS images. Using the UAS to explore and analyze vegetation phenomena is becoming a new efficient remote sensing technique, providing vegetation recognition, the extraction of structural and functional properties of ecosystems and the quantification from individual plants down to the leaf scale. A big challenge of applying a robust algorithm is the choice of the better combination of parameters for proposing a high quality of vegetation classification. Our results demonstrated that the better combination of parameters, for segmentation process, were 20 for the number of K-means clusters, which controls the general homogeneity and the number of resulting clusters, and 600 pixels for the minimum size of the resulting cluster, which produced results that properly covered the homogeneity areas of the image. In addition, for the Random Forest classifier the number of decision trees chosen were 500 decision trees, where the greater number of decision trees means a greater number of analyzes that the algorithm will perform to arrive at a result.
In recent years, machine learning techniques associated with ultrahigh spatial resolution imagery has been widely used in grassland classification due to its high accuracy and powerful processing ability, however, still there are set of challenges and limitations, such as high time-consuming, because processing this big dataset require a great computational configuration, making it impossible processing the data with conventional techniques and traditional GIS tools; therefore, automatic identification of vegetation classes requires further exploration. In future studies, we suggest explore the method of combining machine learning algorithms, multitype indices (NDVI, DEM, temperature, precipitation, and so on) or multisensor integration to improve the accuracy of grassland classification. Considering future directions the UAS remote sensing technology has been rapidly improved and developed along with of precision and intelligence; the endurance, stability and flight height and other performance parameters of UAV platforms will be significantly improved; the cost of sensors can be reduced; machine learning techniques will become an important technical means to provide a technical solution for automatic processing and analysis of massive monitoring data, and finally, the decision-making support of UAS remote sensing for grassland management will be enhanced.
Data availability statement
The raw data supporting the conclusions of this article will be made available by the authors, without undue reservation.
Author contributions
Conceptualization, TM, TS, and LM; Methodology, TM, TS; Formal analysis, TM, TS; Field investigation, TS, LM; Data curation, LM, TS; Writing original draft, TM; Writing review and editing, TM, TS, and LM; Funding acquisition, project administration, LM.
Funding
This research was funded by the São Paulo Research Foundation FAPESP (grants FAPESP-Microsoft Research Institute #2013/50155-0, FAPESP grant #2009/54208-6), National Council for Scientific and Technological Development CNPq (#428055/2018-4), TM received a fellowship from FAPESP (#2019/03269-7) and fellowship from the CNPq (PIBIC), LM and TS received research productivity fellowships and grants from CNPq (#311820/2018-2).
Acknowledgments
We thank the BD Borges and LF Cancian for flying the drone in the field and pre-processing all drone imagery, and for technical support during fieldwork. We thank ICMBio for granting the permits needed to work at Serra do Cipó National Park (PNSC) and its buffer zone, the Cedro Company for allowing access to their private land, and PELD-CRSC for logistic support. We are very thankful to our colleagues from the Phenology Lab and EcoDyn for their helpful insights and discussions.
Conflict of interest
The authors declare that the research was conducted in the absence of any commercial or financial relationships that could be construed as a potential conflict of interest.
Publisher’s note
All claims expressed in this article are solely those of the authors and do not necessarily represent those of their affiliated organizations, or those of the publisher, the editors and the reviewers. Any product that may be evaluated in this article, or claim that may be made by its manufacturer, is not guaranteed or endorsed by the publisher.
References
Adao, T., Hruska, J., Padua, L., Bessa, J., Peres, E., Morais, R., et al. (2017). Hyperspectral imaging: A review on UAV-based sensors, data processing and applications for agriculture and forestry. Remote Sens. 9 (11), 1110. doi:10.3390/rs9111110
Alberton, B., Almeida, J., Helm, R., Torres, R. S., Menzel, A., and Morellato, L. P. C. (2014). Using phenological cameras to track the green up in a cerrado savanna and its on-the-ground validation. Ecol. Inf. 19, 62–70. doi:10.1016/j.ecoinf.2013.12.011
Alberton, B., Torres, R. S., Cancian, L. F., Borges, B. D., Almeida, J., Mariano, G. C., et al. (2017). Introducing digital cameras to monitor plant phenology in the tropics: Applications for conservation. Perspect. Ecol. Conserv. 12 (2), 82–90. doi:10.1016/j.pecon.2017.06.004
Alberton, B., Torres, R. S., Silva, T. S. F., Rocha, H. R., Moura, M. S. B., and Morellato, L. P. C. (2019). Leafing patterns and drivers across seasonally dry tropical communities. Remote Sens. 11 (19), 2267–67. doi:10.3390/rs11192267
Almeida, J., Pedronette, D., Alberton, B. C., Morellato, L. P. C., and Torres, R. S. (2016). Unsupervised distance learning for plant species identification. IEEE J. Sel. Top. Appl. Earth Observations Remote Sens. 9 (12), 5325–5338. doi:10.1109/JSTARS.2016.2608358
Almeida, J., Santos, J. A., Alberton, B. C., Torres, R. S., and Morellato, L. P. C. (2014). Applying machine learning based on multiscale classifiers to detect remote phenology patterns in Cerrado savanna trees. Ecol. Inf. 23, 49–61. doi:10.1016/j.ecoinf.2013.06.011
Anderson, K., and Gaston, K. J. (2013). Lightweight unmanned aerial vehicles will revolutionize spatial ecology. Front. Ecol. Environ. 11 (3), 138–146. doi:10.1890/120150
Baena, S., Boyd, D. S., and Moat, J. (2018). UAVs in pursuit of plant conservation—real world experiences. Ecol. Inf. 47, 2–9. doi:10.1016/j.ecoinf.2017.11.001
Balasubramanian, D., Zhou, W., Ji, H., Grace, J., Bai, X., Song, Q., et al. (2020). Environmental and management controls of soil carbon storage in grasslands of southwestern China. J. Environ. Manag. 254, 109810. doi:10.1016/j.jenvman.2019.109810
Berra, E. F., Gaulton, R., and Barr, S. (2019). Assessing spring phenology of a temperate woodland: A multiscale comparison of ground, unmanned aerial vehicle, and landsat satellite observations. Remote Sens. Environ. 223, 229–242. doi:10.1016/j.rse.2019.01.010
Blaschke, T. (2010). Object-based image analysis for remote sensing. ISPRS J. Photogrammetry Remote Sens. 65, 2–16. doi:10.1016/j.isprsjprs.2009.06.004
Buisson, E., Archibald, S., Fidelis, A., and Suding, K. N. (2022). Ancient grasslands guide ambitious goals in grassland restoration. Science 377 (6606), 594-598. doi:10.1126/science.abo4605
Bunting, P. J., Clewley, D., Lucas, R., and Gillingham, S. (2014). The remote sensing and GIS software library (RSGISLib). Comput. Geoscience 62, 216–226. doi:10.1016/j.cageo.2013.08.007
Camargo, M. G. G., Carvalho, G. A., Alberton, B., and C Morellato, L. P. (2018). Leafing patterns and leaf exchange strategies of a cerrado woody community. Biotropica 50 (3), 442–454. doi:10.1111/btp.12552
Camargo, M. G. G., Cazetta, E., Morellato, L. P. C., and Schaefer, H. M. (2014). Characterizing background heterogeneity in visual communication. Basic Appl. Ecol. 15, 326–335. doi:10.1016/j.baae.2014.06.002
Christian, T., and Christiane, S. (2014). Impact of tree species on magnitude of PALSAR interferometric coherence over Siberian forest at frozen and unfrozen conditions. Remote Sens. 6 (2), 1124–1136. https://doi.org/10.3390/rs6021124.
Colli-Silva, M., Vasconcelos, T. N. C., and Pirani, J. R. (2019). Outstanding plant endemism levels strongly support the recognition of campo rupestre provinces in mountaintops of eastern South America. J. Biogeogr. 46, 1723–1733. doi:10.1111/jbi.13585
Colomina, I., and Molina, P. (2014). Unmanned aerial systems for photogrammetry and remote sensing: A review. ISPRS J. Photogrammetry Remote Sens. 92, 79–97. doi:10.1016/j.isprsjprs.2014.02.013
Congalton, R. G. (1991). A review of assessing the accuracy of classifications of remotely sensed data. Remote Sens. Environ. 37 (1), 35–46. doi:10.1016/0034-4257(91)90048-B
Corbane, C., Lang, S., Pipkins, K., Alleaume, S., Deshayes, M., Millán, V. E. G., et al. (2015). Remote sensing for mapping natural habitats and their conservation status—new opportunities and challenges. Int. J. Appl. Earth Observation Geoinformation 37, 7–16. doi:10.1016/j.jag.2014.11.005
Cullum, C., Rogers, K. H., Brierley, G., and Witkowski, E. T. F. (2016). Ecological classification and mapping for landscape management and science: Foundations for the description of patterns and processes. Prog. Phys. Geogr. Earth Environ. 40, 38–65. doi:10.1177/0309133315611573
Díaz-Delgado, R., Cazacu, C., and Adamescu, M. (2019). Rapid assessment of ecological integrity for LTER wetland sites by using UAV multispectral mapping. Drones 3 (1), 3. doi:10.3390/drones3010003
Dujon, A. M., and Schofield, G. (2019). Importance of machine learning for enhancing ecological studies using information-rich imagery. Endanger. Species Res. 39, 91–104. doi:10.3354/esr00958
Feng, L., Chen, S., Zhang, C., Zhang, Y., and He, Y. (2021). A comprehensive review on recent applications of unmanned aerial vehicle remote sensing with various sensors for high-throughput plant phenotyping. Comput. Electron. Agric. 182, 106033. doi:10.1016/j.compag.2021.106033
Fernandes, G. W., Arantes-Garcia, L., Barbosa, M., U Barbosa, N. P., Batista, E. K. L., Beiroz, W., et al. (2020). Biodiversity and ecosystem services in the campo rupestre: A road map for the sustainability of the hottest Brazilian biodiversity hotspot. Perspect. Ecol. Conservation 4, 213–222. doi:10.1016/j.pecon.2020.10.004
Fernandes, G. W., Barbosa, N. P. U., Alberton, B. C., Barbieri, A., Dirzo, R., Goulart, F., et al. (2018). The deadly route to collapse and the uncertain fate of Brazilian rupestrian grasslands. Biodivers. Conservation 27, 2587–2603. doi:10.1007/s10531-018-1556-4
Fernandes, G. W. (2016). Ecology and conservation of mountaintop grasslands in Brazil. Cham: Springer International Publishing.
Ferreira, L. G., Yoshioka, H., Huete, A., and Sano, F. F. (2003). Seasonal landscape and spectral vegetation index dynamics in the Brazilian cerrado: An analysis within the large-scale biosphere–atmosphere experiment in amazônia (LBA). Remote Sens. Environ. 87 (4), 534–550. doi:10.1016/j.rse.2002.09.003
Giulietti, A. M., Pirani, J. R., and Harley, R. M. (1997). Espinhaço range region. Eastern Brazil. Centers plant Divers. A guide strategies conservation 3, 397–404.
Hamylton, S. M., Morris, R. H., Carvalho, R. C., Roder, N., Barlow, P., Mills, K., et al. (2020). Evaluating techniques for mapping island vegetation from unmanned aerial vehicle (UAV) images: Pixel classification, visual interpretation, and machine learning approaches. Int. J. Appl. Earth Observation Geoinformation 89, 102085. doi:10.1016/j.jag.2020.102085
Hassanalian, M., and Abdelkefi, A. (2017). Classifications, applications, and design challenges of drones: A review. Prog. Aerosp. Sci. 91, 99–131. doi:10.1016/j.paerosci.2017.04.003
Jensen, J. R. (2015). Introductory digital image processing: A remote sensing perspective. London, UK: Pearson.
Kampen, M., Lederbauer, S., Mund, J., and Immitzer, M. (2019). UAV-based multispectral data for tree species classification and tree vitality analysis. Paper presented at the Dreiländertagung der DGPF, der OVG und der SGPF in Wien, Österreich.
Klosterman, S., Melaas, E., Wang, J., Martinez, A., Frederick, S., O’Keefe, J., et al. (2018). Fine-scale perspectives on landscape phenology from unmanned aerial vehicle (UAV) photography. Agric. For. Meteorology 248, 397–407. doi:10.1016/j.agrformet.2017.10.015
Klosterman, S., and Richardson, A. D. (2017). Observing spring and fall phenology in a deciduous forest with aerial drone imagery. Sensors 17 (12), 2852–52. doi:10.3390/s17122852
Laliberte, A. S., and Rango, A. (2013). Image processing and classification procedures for analysis of sub-decimeter imagery acquired with an unmanned aircraft over arid rangelands. GIScience Remote Sens. 48 (1), 4–23. doi:10.2747/1548-1603.48.1.4
Le Stradic, S., Buisson, E., Fernandes, G. W., and Morellato, L. P. C. (2018). Reproductive phenology of two co-occurring Neotropical mountain grasslands. J. Veg. Sci. 29, 15–24. doi:10.1111/jvs.12596
Liu, T., and Abd-Elrahman, A. (2018). Multi-view object-based classification of wetland land covers using unmanned aircraft system images. Remote Sens. Environ. 216, 122–138. doi:10.1016/j.rse.2018.06.043
Lu, B., and He, Y. (2017). Species classification using Unmanned Aerial Vehicle (UAV)-acquired high spatial resolution imagery in a heterogeneous grassland. ISPRS J. Photogrammetry Remote Sens. 128, 73–85. doi:10.1016/j.isprsjprs.2017.03.011
Lu, D., and Weng, Q. (2007). A survey of image classification methods and techniques for improving classification performance. Int. J. Remote Sens. 28, 823–870. doi:10.1080/01431160600746456
Lyu, X., Li, X., Dang, D., Dou, H., Wang, K., and Lou, A. (2022). Unmanned aerial vehicle (UAV) remote sensing in grassland ecosystem monitoring: A systematic review. Remote Sens. 14, 1096. doi:10.3390/rs14051096
Lyu, X., Li, X., Dang, D., Dou, H., Xuan, X., Liu, S., et al. (2020). A new method for grassland degradation monitoring by vegetation species composition using hyperspectral remote sensing. Ecol. Indic. 114, 106310. doi:10.1016/j.ecolind.2020.106310
Ma, L., Li, M., Ma, X., Cheng, L., Du, P., and Liu, Y. (2017). A review of supervised object-based land-cover image classification. ISPRS J. Photogrammetry Remote Sens. 130, 277–293. doi:10.1016/j.isprsjprs.2017.06.001
Mahesh, B. (2020). Machine learning algorithms – a review. Int. J. Sci. Res. (IJSR) 9 (1). doi:10.21275/ART20203995
Mattos, J. S., Camargo, M. G. G., Morellato, L. P. C., and Batalha, M. A. (2019). Plant phylogenetic diversity of tropical mountaintop rocky grasslands: Local and regional constraints. Plant Ecol. 220 (12), 1119–1129. doi:10.1007/s11258-019-00982-5
Maxwell, A. E., Warner, T. A., and Fang, F. (2018). Implementation of machine-learning classification in remote sensing: An applied review. Int. J. Remote Sens. 39, 2784–2817. doi:10.1080/01431161.2018.1433343
Meng, B., Yang, Z., Yu, H., Qin, Y., Sun, Y., Zhang, J., et al. (2021). Mapping of Kobresia pygmaea community based on unmanned aerial vehicle technology and gaofen remote sensing data in alpine meadow grassland: A case study in eastern of qinghai–Tibetan plateau. Remote Sens. 13 (13), 2483. doi:10.3390/rs13132483
Meng, B., Zhang, Y., Yang, Z., Lv, Y., Chen, J., Li, M., et al. (2022). Mapping grassland classes using unmanned aerial vehicle and MODIS NDVI data for temperate grassland in inner Mongolia, China. Remote Sens. 14 (9), 2094. doi:10.3390/rs14092094
Morellato, L. P. C., Alberton, B., Alvarado, S. T., Borges, B., Buisson, E., Camargo, M. G. G., et al. (2016). Linking plant phenology to conservation biology. Biol. Conserv. 195, 60–72. doi:10.1016/j.biocon.2015.12.033
Morellato, L. P. C., and Silveira, F. A. O. (2018). Plant life in campo rupestre: New lessons from an ancient biodiversity hotspot. Flora 238, 1–10. doi:10.1016/j.flora.2017.12.001
Navin, M. S., and Agilandeeswari, L. (2020). Comprehensive review on land use/land cover change classification in remote sensing. J. Spectr. Imaging 9. doi:10.1255/jsi.2020.a8
Neumann, C., Behling, R., Schindhelm, A., Itzerott, S., Weiss, G., Wichmann, M., et al. (2019). The colors of heath flowering – quantifying spatial patterns of phenology in Calluna life-cycle phases using high-resolution drone imagery. Remote Sens. Ecol. Conservation 6 (1), 35–51. doi:10.1002/rse2.121
Nex, F., and Remondino, F. (2013). UAV for 3D mapping applications: A review. Appl. Geomatics 6 (1), 1–15. doi:10.1007/s12518-013-0120-x
Nguyen, U., Glenn, E. P., Dang, T. D., and Pham, L. T. H. (2019). Mapping vegetation types in semi-arid riparian regions using random forest and object-based image approach: A case study of the Colorado river ecosystem, grand canyon, Arizona. Ecol. Inf. 50, 43–50. doi:10.1016/j.ecoinf.2018.12.006
Nogueira, K., Santos, J. A., Menini, N., Silva, T. S. F., Morellato, L. P. C., and Torres, R. S. (2019). Spatio-Temporal vegetation pixel classification by using Convolutional Networks. IEEE Geoscience Remote Sens. Lett. 16 (10), 1665–1669.doi:10.1109/LGRS.2019.2903194
Oddi, F. J., Miguez, F. E., Ghermandi, L., Bianchi, L. O., and Garibaldi, L. A. (2019). A nonlinear mixed-effects modeling approach for ecological data: Using temporal dynamics of vegetation moisture as an example. Ecol. Evol. 9, 10225–10240. doi:10.1002/ece3.5543
Park, J. K., Muller-Landau, H. C., Lichstein, J. W., Rifai, S. W., Dandois, J. P., and Bohlman, S. A. (2019). Quantifying leaf phenology of individual trees and species in a tropical forest using Unmanned Aerial Vehicle (UAV) images. Remote Sens. 11 (13), 1534–34. doi:10.3390/rs11131534
Peciña, M. V., Ward, R. D., Bunce, R. G. H., Sepp, K., Kuusemets, V., and Luuk, O. (2019). Country-scale mapping of ecosystem services provided by semi-natural grasslands. Sci. Total Environ. 661, 212–225. doi:10.1016/j.scitotenv.2019.01.174
Pedregosa, F., Varoguaux, G., Gramfort, A., Michel, V., Thirion, B., Grisel, O., et al. (2011). Scikit-learn: Machine learning in Python. J. Mach. Learn. Res. 12, 2825–2830.
Pichon, L., Leroux, C., Macombe, C., Taylor, J., and Tisseyre, B. (2019). What relevant information can be identified by experts on unmanned aerial vehicles’ visible images for precision viticulture? Precis. Agric. 20, 278–294. doi:10.1007/s11119-019-09634-0
Prentice, R. M., Peciña, M. V., Ward, R. D., Bergamo, T. F., Joyce, C. B., and Sepp, K. (2021). Machine learning classification and accuracy assessment from high-resolution images of coastal wetlands. Remote Sens. 13 (18), 3669. doi:10.3390/rs13183669
Rapini, A., Ribeiro, P. L., Lambert, S., and Pirani, J. R. (2008). A flora dos campos rupestres da Cadeia do Espinhaço. Megadiversidade 4, 16–24.
Reis, B. P., Martins, S. V., Fernandes Filho, E. I., Sarcinelli, T. S., Gleriani, J. M., Leite, H. G., et al. (2019). Forest restoration monitoring through digital processing of high resolution images. Ecol. Eng. 127, 178–186. doi:10.1016/j.ecoleng.2018.11.022
Rodriguez-Galiano, V. F., Guimire, B., Rogan, J., Chica-Olmo, M., and Rigol-Sanchez, J. P. (2012). An assessment of the effectiveness of a random forest classifier for land-cover classification. ISPRS J. Photogrammetry Remote Sens. 67, 93–104. doi:10.1016/j.isprsjprs.2011.11.002
Ruwaimana, M., Satyanarayana, B., Otero, V., Muslim, A. M., Muhammad Syafiq, A., Ibrahim, S., et al. (2018). The advantages of using drones over space-borne imagery in the mapping of mangrove forests. PLoS ONE 13, e0200288. doi:10.1371/journal.pone.0200288
Sarker, I. H. (2021). Machine learning: Algorithms, real-world applications and research directions. SN Comput. Sci. 2, 160. doi:10.1007/s42979-021-00592-x
Schafer, E., Heiskanen, J., Heikinheimo, V., and Pellikka, P. (2016). Mapping tree species diversity of a tropical montane forest by unsupervised clustering of airborne imaging spectroscopy data. Ecol. Indic. 64, 49–58. doi:10.1016/j.ecolind.2015.12.026
Schmidt, J., Fassnacht, F. E., Neff, C., Lausch, A., Kleinschmit, B., Forster, M., et al. (2017). Adapting a Natura 2000 field guideline for a remote sensing-based assessment of heathland conservation status. Int. J. Appl. Earth Observation Geoinformation 60, 61–71. doi:10.1016/j.jag.2017.04.005
Silveira, F. A. O., Negreiros, D., Barbosa, N. P. U., Buisson, E., Carmo, F., Carstensen, D., et al. (2016). Ecology and evolution of plant diversity in the endangered campo rupestre: A neglected conservation priority. Plant Soil 403, 129–152. doi:10.1007/s11104-015-2637-8
Singh, K. K., and Frazier, A. E. (2018). A meta-analysis and review of unmanned aircraft system (UAS) imagery for terrestrial applications. Int. J. Remote Sens. 39, 5078–5098. doi:10.1080/01431161.2017.1420941
Streher, A. B., S Sobreiro, J. F., Morellato, L. P. C., and Silva, T. S. F. (2017). Land surface phenology in the tropics: The role of climate and topography in a snow-free mountain. Ecosystems 20, 1436–1453. doi:10.1007/s10021-017-0123-2
Sun, Z., Chen, Y., Yang, L., Tang, G. L., Yuan, S. X., and Lin, Z. W. (2017). Small unmanned aerial vehicles for low-altitude remote sensing and its application progress in ecology. J. Appl. Ecol. 28, 528–536. doi:10.13287/j.1001-9332.201702.030
Sun, Z., Wang, X., Wang, Z., Yang, L., Xie, Y., and Huang, Y. (2021). UAVs as remote sensing platforms in plant ecology: Review of applications and challenges. J. Plant Ecol. 16 (6), 1003–1023. doi:10.1093/jpe/rtab089
Thessen, A. E. (2016). Adoption of machine learning techniques in ecology and Earth science. One Ecosyst. 1, e8621. doi:10.3897/oneeco.1.e8621
Tsai, C. H., and Lin, Y. C. (2017). An accelerated image matching technique for UAV orthoimage registration. ISPRS J. Photogrammetry Remote Sens. 128, 130–145. doi:10.1016/j.isprsjprs.2017.03.017
Valbuena, R., O’Connor, B., Zellweger, F., Simonson, W., Vihervaara, P., Maltamo, M., et al. (2020). Standardizing ecosystem morphological traits from 3D information sources. Trends Ecol. Evol. 35, 656–667. doi:10.1016/j.tree.2020.03.006
Vasconcelos, T. N. C., Alcantara, S., Andrino, C. O., Forest, F., Reginato, M., Simon, M. F., et al. (2020). Fast diversification through a mosaic of evolutionary histories characterizes the endemic flora of ancient Neotropical mountains. Proc. R. Soc. Biol. Sci. 287, 20192933. doi:10.1098/rspb.2019.2933
Villoslada, M., Bergamo, T. F., Ward, R. D., Burnside, N. G., Joyce, C. B., Bunce, R. G. H., et al. (2020). Fine-scale plant community assessment in coastal meadows using UAV-based multispectral data. Ecol. Indic. 111, 105979. doi:10.1016/j.ecolind.2019.105979
Walker, B. H., and Noy-Meir, I. (1982). “Aspects of the stability and resilience of savanna ecosystems. Ecology of Tropical Savannas,” in Ecology of tropical savannas: Ecological studies (analysis and synthesis). Editors B. J. Huntley, and B. H. Walker (Berlin, Heidelberg: Springer).
Wang, H., Han, D., Mu, Y., Jiang, L., Yao, X., Bai, Y., et al. (2019a). Landscape-level vegetation classification and fractional woody and herbaceous vegetation cover estimation over the dryland ecosystems by unmanned aerial vehicle platform. Agric. For. Meteorology 278, 107665. doi:10.1016/j.agrformet.2019.107665
Wang, Z., Townsend, P. A., Schweiger, A. K., Couture, J. J., Singh, A., Hobbie, S. E., et al. (2019b). Mapping foliar functional traits and their uncertainties across three years in a grassland experiment. Remote Sens. Environ. 221, 405–416. doi:10.1016/j.rse.2018.11.016
Watts, A. C., Ambrosia, V. G., and Hinkley, E. A. (2012). Unmanned aircraft systems in remote sensing and scientific research: Classification and considerations of use. Remote Sens. 4, 1671–1692. doi:10.3390/rs4061671
Westoby, M. J., Brasington, J., Glasser, N. F., Hambrey, M. J., and Reynolds, J. M. (2012). Structure from motion photogrammetry: A low-cost, effective tool for geoscience applications. Geomorphology 179, 300–314. doi:10.1016/j.geomorph.2012.08.021
Whitehead, K., and Hugenholtz, C. H. (2014). Remote sensing of the environment with small unmanned aircraft systems (UASs), part 1: A review of progress and challenges. NRC Res. Press 2, 69–85. doi:10.1139/juvs-2014-0006
Xie, Y., Zhang, A., and Welsh, W. (2015). Mapping wetlands and <I>Phragmites</I> using publically available remotely sensed images. Photogrammetric Eng. Remote Sens. 81, 69–78. doi:10.14358/PERS.81.1.69
Yao, H., Qin, R., and Chen, X. X. (2019). Unmanned aerial vehicle for remote sensing applications—A review. Remote Sens. 11 (12), 1443. doi:10.3390/rs11121443
Zhang, C., Zhang, L., Zhang, B. Y. J., Sun, J., Dong, S., Wang, X., et al. (2021). Land cover classification in a mixed forest-grassland ecosystem using LResU-net and UAV imagery. J. For. Res. 33, 923–936. doi:10.1007/s11676-021-01375-z
Keywords: UAS, unmanned aerial system, machine learning, random forest., heterogeneous vegetation, rupestrian grassland, phenology
Citation: Medeiros TPd, Morellato LPC and Silva TSF (2023) Spatial distribution and temporal variation of tropical mountaintop vegetation through images obtained by drones. Front. Environ. Sci. 11:1083328. doi: 10.3389/fenvs.2023.1083328
Received: 28 October 2022; Accepted: 26 January 2023;
Published: 10 February 2023.
Edited by:
Russell Doughty, University of Oklahoma, United StatesReviewed by:
Nathan Moore, Michigan State University, United StatesWeiwei Zhang, Suzhou University of Science and Technology, China
Copyright © 2023 Medeiros, Morellato and Silva. This is an open-access article distributed under the terms of the Creative Commons Attribution License (CC BY). The use, distribution or reproduction in other forums is permitted, provided the original author(s) and the copyright owner(s) are credited and that the original publication in this journal is cited, in accordance with accepted academic practice. No use, distribution or reproduction is permitted which does not comply with these terms.
*Correspondence: Thaís Pereira de Medeiros, thais.pereira@inpe.br; Thiago Sanna Freire Silva, thiago.sf.silva@stir.ac.uk