Microbial Community Compositional Stability in Agricultural Soils During Freeze-Thaw and Fertilizer Stress
 Grant Jensen
 Konrad Krogstad
 Fereidoun Rezanezhad
 Laura A. Hug
- 1Department of Biology, University of Waterloo, Waterloo, ON, Canada
- 2Ecohydrology Research Group, Water Institute and Department of Earth and Environmental Sciences, University of Waterloo, Waterloo, ON, Canada
Microbial activity persists in cold region agricultural soils during the fall, winter, and spring (i.e., non-growing season) and frozen condition, with peak activity during thaw events. Climate change is expected to change the frequency of freeze-thaw cycles (FTC) and extreme temperature events (i.e, altered timing, extreme heat/cold events) in temperate cold regions, which may hasten microbial consumption of fall-amended fertilizers, decreasing potency come the growing season. We conducted a high-resolution temporal examination of the impacts of freeze-thaw and nutrient stress on microbial communities in agricultural soils across both soil depth and time. Four soil columns were incubated under a climate model of a non-growing season including precipitation, temperature, and thermal gradient with depth over 60 days. Two columns were amended with fertilizer, and two incubated as unamended soil. The impacts of repeated FTC and nutrient stress on bacterial, archaeal, and fungal soil community members were determined, providing a deeply sampled longitudinal view of soil microbial response to non-growing season conditions. Geochemical changes from flow-through leachate and amplicon sequencing of 16S and ITS rRNA genes were used to assess community response. Despite nitrification observed in fertilized columns, there were no significant microbial diversity, core community, or nitrogen cycling population trends in response to nutrient stress. FTC impacts were observable as an increase in alpha diversity during FTC. Community compositions shifted across a longer time frame than individual FTC, with bulk changes to the community in each phase of the experiment. Our results demonstrate microbial community composition remains relatively stable for archaea, bacteria, and fungi through a non-growing season, independent of nutrient availability. This observation contrasts canonical thinking that FTC have significant and prolonged effects on microbial communities. In contrast to permafrost and other soils experiencing rare FTC, in temperate agricultural soils regularly experiencing such perturbations, the response to freeze-thaw and fertilizer stress may be muted by a more resilient community or be controlled at the level of gene expression rather than population turn-over. These results clarify the impacts of winter FTC on fertilizer consumption, with implications for agricultural best practices and modeling of biogeochemical cycling in agroecosystems.
Introduction
Microbial activity persists in soil under snow and ice throughout the fall-winter and winter-spring transitions and during the non-growing season. This commonly-overlooked activity continues at low but measurable rates while soil is frozen, primarily in the form of denitrification and respiration with the release of greenhouse gases, but microbes are most active upon thawing of frozen soils during a freeze-thaw cycles (FTC) (Wagner-Riddle et al., 2007; Yanai et al., 2011; Du et al., 2013).
During a single soil FTC, microbial activity declines as temperature decreases, with eventual freezing and cell lysis (Graham et al., 2012). When soil freezes, a layer of ice may form, inhibiting diffusion with the air, which results in temporarily anaerobic conditions that support denitrification, alongside continued heterotrophic production of greenhouse gases (Yanai et al., 2004). Upon thawing, the ice melts, and soils release trapped gases that accumulated under the ice layer during frozen conditions. During the thaw, oxygen infiltrates into the soil and the labile nutrients from lysed organic matter and disrupted soil aggregates become available, allowing for increased heterotrophic activity and biomass recovery. The thaw and increased availability of labile carbon results in an accelerated spike of activity with increased greenhouse gas emission from soils (Clein and Schimel, 1995; Rivkina et al., 2000; Hayashi, 2014). Respiration returns to basal levels within hours, while denitrification may continue for a few days until it ceases altogether from aerobic inhibition. Subsequent FTC undergo a similar process, but with diminishing returns: the magnitude of nutrient release and therefore measured activity decreases with each cycle (Hayashi, 2014). The non-growing season’s microbial activity can thus be modelled as a series of FTC varying in frequency, length, and intensity.
Under unprecedented winter warming (Allan et al., 2021), the frequency of FTC in the Northern hemisphere is expected to change. In some areas the frequency will increase as warmer ambient air temperatures reduce the insulation provided by snowpack and expose the top layer of soil to colder temperatures (Fuss et al., 2016), while in others, like Ontario, the frequency will decrease with overall warming temperatures. This may exacerbate greenhouse gas emissions and contribute to a positive feedback loop of climate change. An altered frequency of FTC also has implications for agriculture, as the timing and quantity of fertilizer amendments are specifically tailored to reduce potency loss from run-off, immobilization, denitrification, or ammonia (NH3) volatility, especially for the more susceptible pre-winter applications (Chantigny et al., 2017; Romero et al., 2017). In Ontario, pre-winter fertilizers are added in October before the first frost while planting takes place after FTC are over, typically in May (OMAFRA, 2018). Bursts of microbial activity during altered thaw events can prematurely deplete fertilizer through increased losses from leaching and volatilization, reducing fertilizer efficacy in the growing season. This has economic impacts, as fertilizers may need to be reamended or increased in initial rate, prior to the growing season.
Microbial communities exposed to FTC have shown inconsistent responses to date where increases, decreases, and conservation of microbial biomass have all been observed (Pesaro et al., 2003; Schadt et al., 2003; Yanai et al., 2004). Broadly, the impact on fungi differs from bacteria, with some studies showing fungal biomass is drastically reduced following FTC but with community composition largely conserved, whereas bacteria experienced larger community shifts but higher biomass recovery as their more flexible metabolisms allowed for opportunistic growth (Sharma et al., 2006; Feng et al., 2007). Comparisons across studies remain difficult due to methodological differences, and most studies have not considered the Archaea within the soil populations examined. Many microcosm experiments simulating soil freezing differ in thaw times, utilize unrealistic freeze and thaw temperatures, or deploy minimal FTC (Sulkava and Huhta, 2003; Koponen and Martikainen, 2004; Bechmann et al., 2005; Henry, 2007). From this, it is difficult to parse the individual impacts of soil insulation, freezing rate, distinguishing freeze versus temperature stresses, and the impact of initial FTC, or to compare short-term responses to long-term adaption (Schadt et al., 2003; Walker et al., 2006). Specific trends for microbial community compositional changes under FTC are not universally consistent but include broad phylum-level shifts such as decreased Proteobacteria and increased Actinobacteria relative abundance in bacteria and lowered relative abundance of Ascomycota among fungi, which are otherwise typically largely unimpacted (Žifčáková et al., 2016; Han et al., 2018; Ren et al., 2018). However, most marker-gene studies are limited in temporal resolution with few to no intermediate time points, meaning finer resolution changes to microbial diversity over the non-growing season are not yet well described.
In this study, we examined the impact of FTC in combination with fertilizer treatments on microbial communities in agricultural soil using a temperature-controlled column experiment. We monitored geochemical changes and microbial community diversity over a 60-days experiment simulating a compressed non-growing season that is typically 180 days (winter plus portions of the shoulder seasons). The impacts of repeated freeze-thaw cycling and nutrient stress on bacterial, archaeal, and fungal community membership were determined, providing a deeply sampled longitudinal view of soil microbial response to winter conditions over the course of the non-growing season.
Materials and Methods
Soil Collection, Preparation, and Characterization
Soil was collected from the Southern agricultural field at the rare Charitable Research Reserve located in Cambridge, Canada (latitude 43°22′39.80″N; longitude 80°22′07.28″W). Soil samples were collected in mid-October 2018 before the first snowfall or any freezing of the soil. The surface vegetation (grass) was removed and the top-soil horizons (A-horizon: 0–18 cm depth) were collected. The Southern field location has been historically cultivated but had been fallow for the prior 2 years and had not been fertilized prior to soil collection. Once collected, the soil was sieved to retain only 1–2 mm soil aggregates and then homogenized. Soil was kept at 10°C for ∼1 week prior to column experiment. The soil particle size distributions were determined via the pipette method by the Agriculture and Food Laboratory at the University of Guelph (Gee and Bauder, 1986). It was characterized as a loamy soil with 52%, 32%, and 16% of silt, sand, and clay, respectively. Soil total porosity and bulk density were determined gravimetrically from the saturated mass, the oven-dried (at 105°C for 24 h) mass and the original volume of the sample, following the method of Boelter (1972). The pH was 7.2 with total porosity and bulk density as 1.22 g cm−1 and 0.54, respectively.
Soil Column Experimental Setup
The freeze-thaw soil column experiment was conducted using four columns (Figure 1). Each column was composed of hard acrylic, with an inner diameter of 7.5 cm and length of 60 cm (Soil Measurement Systems, LLC, United States). Approximately 2.5 kg of sieved and homogenized soil were packed evenly between the four columns, to a column height of 50 cm. Soil homogenization, while disrupting the native soil structure, mimics the practice of tillage in agricultural soils. Duplicate columns were prepared for two experimental treatments: unfertilized (columns Unfertilized 1 and 2) and fertilized (columns Fertilized 1 and 2). All four columns were placed in an environmental chamber incubator (Percival I-41NL XC9) and subjected to a simulated winter transition temperature regime. Columns were equipped with a band-heater 150-W band-heater (120V, 2 W/inch2, custom produced by Gordo Sales Inc.) surrounding the lower 40 cm of each column that maintained the temperature at 8°C in the lower portion of the soil to mimic the subsurface temperature gradient in southern Ontario’s soil (Funk et al., 1980; Conant, 2004; Zhang, 2005). Time-series temperature data was recorded every 15 min during the experiment by temperature sensors (PT-100, DaqLink Fourier Systems Ltd., #DBSA720) installed in one of the soil columns (Fertilized 1) at depths of +2.5, −3.5, −7, -−15.5, and −33 cm relative to the soil surface, with one sensor in the chamber to monitor air temperature. Soil columns were designed to allow sampling of the leachates, collected from the bottom of the columns and soil samples via a series of side ports. Prior to the start of the experimental conditions, the columns were saturated with artificial pore water (composition below) and then allowed to drain. For a more detailed explanation of the soil column setup, the reader is referred to Krogstad et al. (2022).
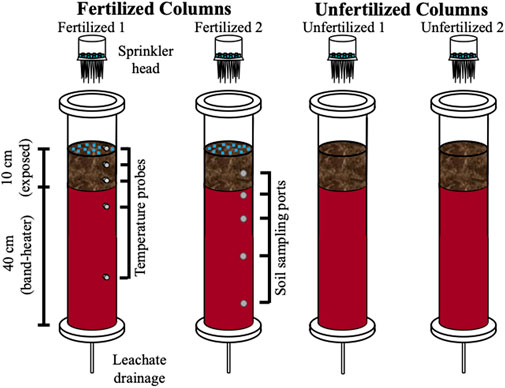
FIGURE 1. Schematic diagram of soil columns. Four columns were packed with agricultural soil, with two columns amended with fertilizer. A sprinkler head allowed for application of precipitation which is then collected as leachate after flow-through. Temperature probes, at depths of +2.5, −3.5, −7.0, −15.5, and −33.0 relative to the soil surface were used to track the simulated temperature gradient across depth created by the environmental chamber and insulating band heater (instrumented and indicated on Fertilized 1 column, not present in other three columns). Ports at depths of −5, −11, −18, and −38 cm were used to sample for soil (indicated on Fertilizer 2 column but ports were present on all four columns).
Fertilizer Treatments
The fertilizer selected was Miracle Gro Ultra Bloom water soluble Plant Food. It is a 15-30-15 N-P-K fertilizer with primary constituents by mass of 15% total nitrogen (5.8% ammonia chloride and 9.2% urea), 30% phosphate (P2O5), and 15% soluble potash (K2O). Fertilized columns were amended using 1 g of fertilizer sprinkled uniformly on to the surface of the soil. This was necessary for uniform distribution over the 45.6 cm2 surface area of the columns. In normal field conditions (at rare) the fertilizer is applied at a rate of 8.6 g m−2 (190 lbs ha−1) and thus this experiment utilized a 20-fold increase compared to the agricultural rate.
Simulated Non-Growing Season Climate Conditions
All four columns were exposed to a simulated climate model based on the average of 3 years of locally monitored air temperature and precipitation (rain and snow) over winter and shoulder seasons in Southern Ontario (CAPMoN, 2018). Diurnal highs and lows were simulated by fluctuating 8–10°C, oscillating every 12 h, with the chamber incubator taking approximately 2 h to adjust to temperature. An artificial mid-winter premature thaw was added to simulate expected temperature increase from winter climate warming. The climate model was then condensed into a 56-days experiment, where each simulated month was represented by 9 days (Figure 2). Precipitation was measured by mm of precipitation over a full non-growing season and adjusted to fit the shortened timeframe of the climate model and surface area of the soil columns.
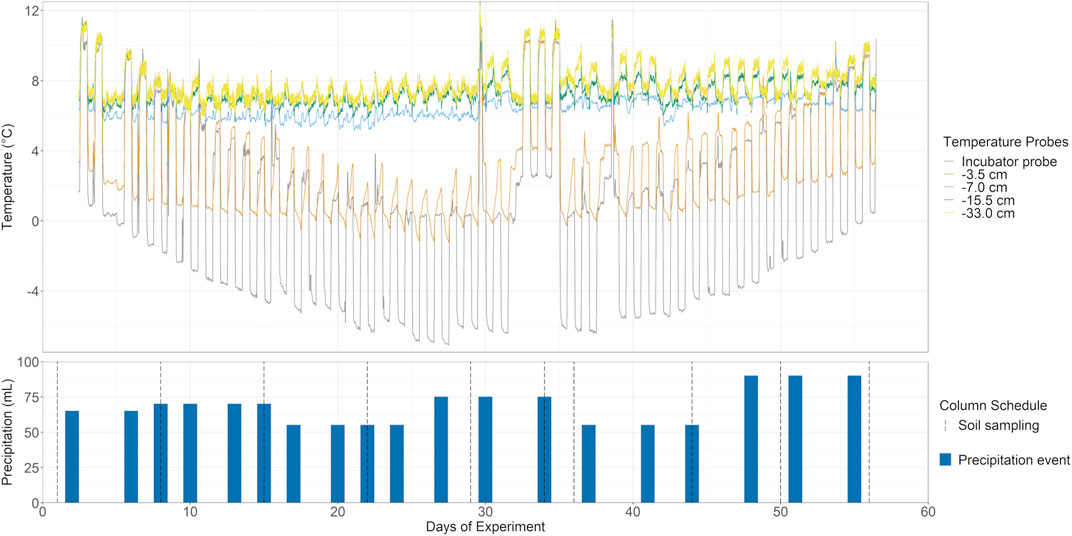
FIGURE 2. Temperature and simulated climate model. Top: Five temperature probes including ambient incubator air and various soil depths were used to monitor the simulated non-growing season, with additional premature mid-winter thaw, in the soil columns over 56 days. Insulation from the band-heater prevents FTC in all but the shallowest measured depth at −3.5 cm. Bottom: Precipitation based on simulated climate data was added over the course of the experiment via sprinkler head and collected as leachate periodically. Soil sampling occurred approximately once a week, except for a higher resolution over the premature winter thaw (ten sampling points, grey dotted lines).
Artificial Rainwater and Sampling
Precipitation for the soil columns was conducted using a synthetic pore water equivalent with milli-Q water as a base and the following additions: 22.6 µM SO42−, 42.7 µM NO3−, 5.52 µM Cl−, 44.92 µM NH4+, 4.34 µM Na+, 12.12 µM Ca2+, 3.41 μM Mg2+, 1.26 µM K+, adjusted to a pH of 5.15. Artificial rainwater was added via a sprinkler head, with 55–90 ml of artificial rainwater amended 2, 3 times per week (Figure 2). The flow-through leachate samples were collected from the four columns periodically over the experiment (the leachates were typically available 1 day after rainwater application; Figure 2). The soil ports were installed at multiple depths from the surface soil and sampled at -5, -11, -18, and -38 cm. All soil ports were sampled approximately weekly with 10 sampling points over the course of the 56 days of the experiment (Figure 2, dotted lines).
Geochemical Analysis of Leachate
The leachate samples were analyzed for pH and electrical conductivity using LAQUtwin meters (model Horiba B-213). Leachate was filtered through 0.2 µm Thermo Scientific Polysulfone membrane filters and then further processed for major anions including chloride (Cl−), nitrite (NO2−), and nitrate (NO3−) using ion chromatography on the IC Dionex ICS-5000 (with capillary IonPac® AS18 column; ± 3.0% error and ±1.6% precision. Calibration for each analyte was performed with a multiple point linear regression using Dionex Chromeleon 7.0 chromatography software generated with external standards tested in triplicate (ranging from 0.5 to 30 mg L−1) from diluted certified standards.
DNA Extraction and Sequencing
Soil samples were collected from all four columns at each of four depths (−5, −11, −18, and −38 cm) of about 0.5 g of soil per depth, at ten sampling timepoints (shown in Figure 2) for a total of 160 samples. Total environmental DNA was extracted from 0.25 g of each soil sample using the QIAGEN DNeasy Powersoil Kit as per the manufacturer’s protocol (discontinued; Ref# 12888-100). Amplicon sequencing of marker genes was performed to characterize the bacterial, archaeal, and fungal populations in the soil. For bacteria and archaea, the V4 region of the 16S rRNA gene was amplified by PCR using the 515F and 806R primers, and for fungi the inter-transgenic space 1 (ITS1) region was targeted using the BITS and B58S3 primers (Bokulich and Mills, 2013; Walters et al., 2015). All 160 soil samples were used in the 16S survey but only, 7 of 10 time-points were chosen for ITS rRNA sequencing, for a total of 112 samples in the ITS survey. PCR amplification and paired-end Illumina sequencing were performed by MetaGenomeBio (ON, Canada), with sequencing conducted on an Illumina MiSeq generating 2 × 150 bp reads (Illumina, United States).
Bioinformatic Analysis
Microbiome analyses were first processed using the QIIME2 2020.2 pipeline (Bolyen et al., 2019). Raw sequence data imported as paired-end demultiplexed reads in the Casava format were first truncated to remove primers from the read ends via the plugin cutadapt version 3.3 (Martin, 2011). Reads were then quality filtered using the q2-demux plugin, and subsequently denoised with DADA2 using q2-dada2 (Callahan et al., 2016) generating amplicon sequence variants (ASVs). Taxonomic classification was performed on ASVs via q2-feature-classifier (Bokulich et al., 2018) classify-sklearn naïve Bayes taxonomy classifier using the SILVA 138 99% operational taxonomic units (OTUs) reference sequences for bacteria and archaea (Quast et al., 2013), and the UNITE 8.2 99% dynamic OTUs reference sequences for fungal reads (Nilsson et al., 2019).
QIIME2 core metrics were used to generate values for 16S and ITS rRNA alpha diversity scores of observed ASVs, Shannon score, and Faith’s phylogenetic distance (PD). RStudio, version 1.4 with R version 4.1 (RStudio Team, 2020), was used to generate beta diversity scores for Jaccard, Bray-Curtis, and Unifrac (weighted and unweighted) distances of the raw ASV abundances for principal coordinates analysis (PCoA) using the qiime2R, phyloseq, vegan, and dplyr packages (McMurdie and Holmes, 2013; Bisanz, 2018; Oksanen et al., 2019; Wickham et al., 2021). Bray-Curtis distances of ASV relative abundance were used for non-metric multi-dimensional scaling (NMDS), and constrained correspondence analysis (CCA) to visualize the contribution of environmental and categorical variables to sample similarity using the “envfit” function from the vegan package. All visualizations were generated in R using the ggplot2, and ggpubr packages (Wickham, 2016; Kassambara, 2020). All community and diversity assessments were made using ASVs rather than clustered OTUs.
Core community selection was performed by ranking ASVs based on temporal occupancy (persistence) first and then by their contribution to Bray-Curtis beta diversity as described by Shade and Stopnisek (Shade and Stopnisek, 2019) using the R package ‘dplyr’. All samples were used to assess core members. Index ranks were determined by weighing the sum of both time-specific occupancy and time-point replication consistency such that persistent ASV are prioritized. Bray-Curtis similarity was then calculated for the whole dataset but then individually for each top-ranked taxa. Individual ASV contribution is determined on its percentage of the total beta diversity. Index ranks are included as core members until a threshold of diminishing contribution to beta diversity is achieved by the last ranked ASV having to exceed a 2% increase in from the last cumulative Bray-Curtis similarity of the previously ranked ASV. All ranks up to the last ASV with a 2% increase to BC similarity were then added as core members. The list of selected core ASVs was then used to filter the feature table of the entire dataset and plot the cumulative core list relative abundance across time and fertilizer treatment. This approach differed only from Shade and Stopnisek (2019) by virtue of using ASVs rather than 97% OTUs and explicit use of the percentage threshold rather than “elbow” method.
PICRUSt2 version 2.3.0-b (Douglas et al., 2020) was used to predict potential function for ASVs (from the QIIME2 output) based on similarity to known organisms with complete genomes. Putative nitrogen cycling ASVs were grouped together based on predicted potential nitrogen cycling enzymes via shared Enzyme Commission (EC) number. Nitrogen cycling enzymes included: urease (ureC; EC 3.5.1.5), ammonium monooxygenase (amoA; EC 1.4.99.39), hydroxylamine oxideoreductase (hao; EC 1.7.99.1), nitrite oxideoreductase (nxr; EC 1.7.1.15), nitrate reductase (nar; EC 1.7.99.4), nitrite reductase (nir; EC 1.7.2.1), nitric oxide reductase (nor; EC 1.7.2.5), and nitrous oxide reductase (nosZ; EC 1.7.2.4). Similar to the core community analysis, each specific EC-bearing community was assessed via changing relative abundance with time and across fertilizer treatment.
Statistical Analysis
Significant changes to the microbial community alpha diversity were evaluated first by ANOVA to determine significance by categorical variables of column, depth, fertilizer, and time (days of experiment) using the R package vegan. For significant variables, Tukey tests were used to identify specific significance within variables between groups using the “TukeyHSD” function in R. To assess the variable of “time” with a parametric test sampling dates were grouped to categories of “phase” including pre-FTC (days 1, 8, and 15), during FTC (days 22, 29, 34, 36, and 44), and post-FTC (days 50 and 56). Similarly, Tukey tests were used to identify significant differences for potential predicted nitrogen-cycling-enzyme-bearing and core communities between fertilized and unfertilized treatments, and between phases. The degree and significance of differences in community compositions across sample types were evaluated in the canonical ordinations using the analysis of similarities (ANOSIM) test with Bray-Curtis distances of relative ASV abundances (Clarke, 1993) using the ‘anosim’ function in the vegan package.
Results
Simulated Climate Model and Geochemical Properties of Leachate
Soil columns experienced the entirety of the desired simulated climate model for 56 days. Insulation provided by the band creators worked to establish a temperature gradient across depth (Figure 2) with only freezing (recorded temperatures below 0°C) occurring at the top layer (3.5 cm depth probe). Frost heave was observed in all columns penetrating below the shallowest soil sampling depth of 5 cm (Supplementary Figure S1), appearing after approximately 15 days into the experiment. Acidity measurements of column leachates observed a pH range of 6.5–8.5 among unfertilized, and 7.0 to 8.5 in fertilized columns. EC values ranged from 0.1 to 170 μS cm−1 for unfertilized, and 0.1 to 200 μS cm−1 for fertilized columns. Krogstad et al. (2022) calculated the residence time of the fertilizer through the columns as ∼13.9 days, confirmed with elevated Cl− tracer observed after 15 days from the fertilized columns’ leachates. This increased until a maximum at 30 days during the midwinter thaw and declined until reaching equivalent levels to the unfertilized columns indicating clearance of fertilizer through the entirety of the column length over the experiment timeframe (Supplementary Figure S2). NO2− levels were consistent and similar between unfertilized and fertilized columns pre- and post-FTC, but experienced a sharp decline to non-detectable levels in fertilized columns after 22 days, before recovering after 44 days. The NO2− decrease in fertilized columns coincided with a rising NO3− concentration, which continued to rise until the final day 59, reaching peaks of 150–160 mg L−1. Within the unfertilized columns, NO3− concentrations remained minimal throughout.
Sequencing Quality, Reads, and Major Taxa
For 16S rRNA amplicons, a total of 3,391,693 paired end reads were generated with an average read length of 253.25 nucleotides. The minimum library size was 4,348 merged reads, and a total of 7,390 ASVs were identified from all soil samples. For ITS rRNA amplicons, only 99 samples passed filtering to a minimum sequencing depth of 1,000 reads, leaving a 1,435,004 paired end reads with an average read length of 205.26 nucleotides. A total of 1,358 ASVs were identified from the ITS data from all soil samples. The 16S rRNA amplicon data indicates the Proteobacteria and Acidobacteria were the most abundant phyla in the soil, comprising an average of 40.5% and 21.3% of total reads (Figure 3A). The fungal ITS data was dominated by the Ascomycota, at an average abundance of 96.4% (Figure 3B). Little variation across column (fertilizer), depth, or time is observed (Supplementary Figures S3–6) except for the Acidobacteria, whose abundance drops from 24.3% to 21.1%, and then to 17.6% sequentially across phase with a significant difference (by Tukey HSD test; p = 0.0116) between pre- and post-FTC. Lineages previously identified as susceptible to freeze-thaw stress, including Proteobacteria and Actinobacteria, changed negligibly across phase from pre, during, and post-FTC (Žifčáková et al., 2016; Han et al., 2018; Ren et al., 2018). In non-significant changes, Proteobacteria decreased from 42.6% relative abundance to 39.9–40.0%, and Actinobacteria increased from 9.7% to 11.8–14.7% (Figure 3A). Ascomycota is the sole fungal phylum that decreased significantly (by Tukey HSD test; p = 0.0362 and p = 0.0069) from 96.1 to 97.2%–93.8% (Figure 3B). Actinobacteria enriched over the experiment as a general trend, but at the shallowest depth, which experienced FTC, this enrichment diminishes in magnitude, with a change from 8.6–11.2%–11.2% and does not represent a significant difference by Tukey HSD (Supplementary Figure S4A). Similarly, Ascomycota at the shallowest depth changes only from 96.6–97.8%–96.0% and does not represent a significant change by Tukey HSD. Changes in the Proteobacteria and Ascomycota were consistent across the depth profile of the columns. Lack of community response at the phylum level led to analysis of lower taxonomic ranks, which revealed similar muted changes with no clear connection to fertilizer, depth, or temperature conditions.
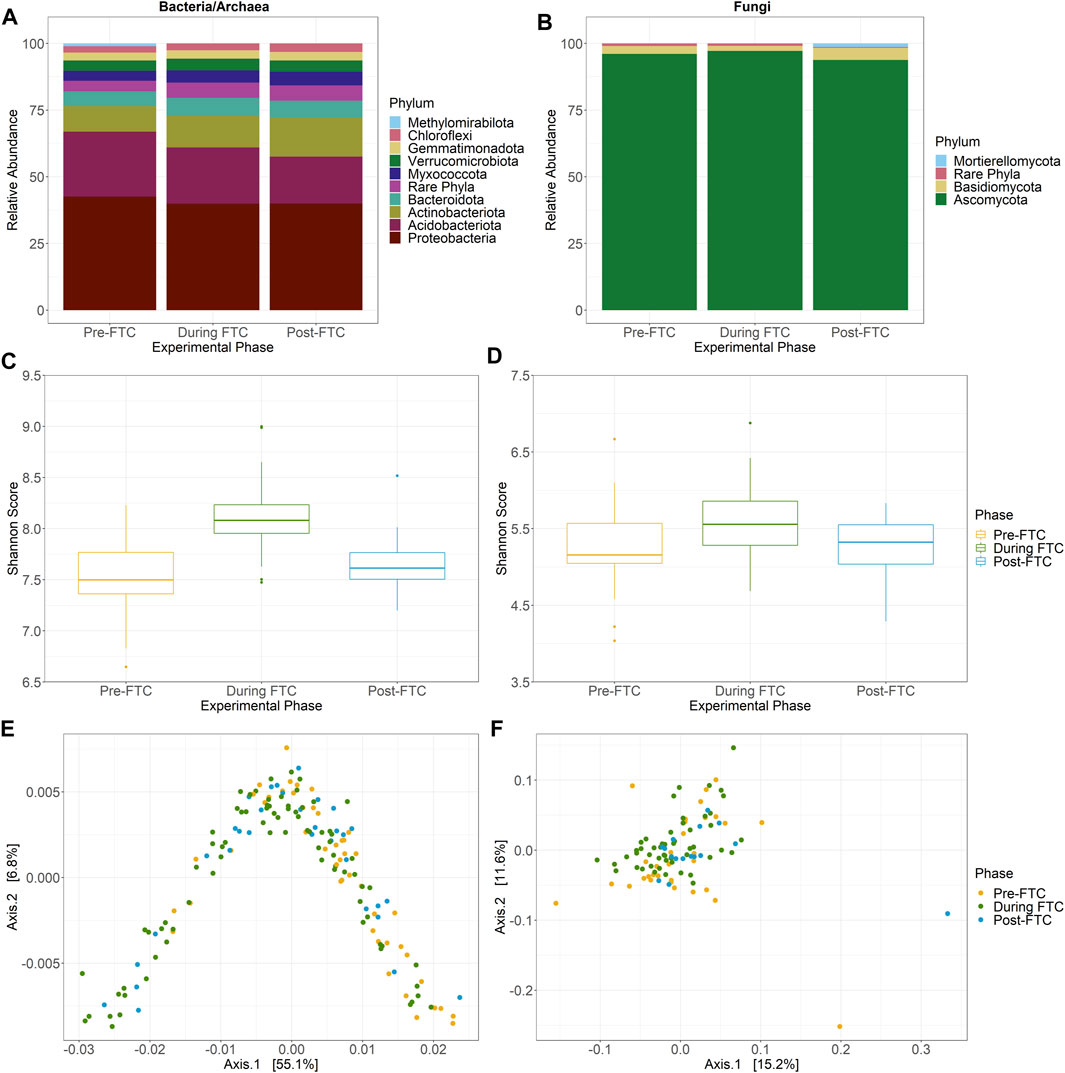
FIGURE 3. Community composition and diversity across phase. Bacterial and archaeal (A), and fungal (B) community composition at the phylum level across FTC phases. ASVs identified from QIIME2 were then classified using the Silva 138 99% OTUs (A) or UNITE 8.2 99% dynamic OTUs (B) reference sequences. “Rare phyla” encompass all phyla below 1% relative abundance. The bacterial/archaeal community are dominated by Proteobacteria and Acidobacteria with diminishing abundance of the Acidobacteria and increasing abundance of Actinobacteria over time. The fungal community is predominately Ascomycota with little observed variation over time. (C,D) Bacterial and archaeal (C), and fungal (D) alpha diversity Shannon score across FTC phases in boxplot distributions collapsing column, depth, and time into phases. Significant differences, detected by the Tukey HSD test, distinguish the During FTC phase from the others among the bacterial and archaeal community but no such difference exist for the fungal community. Bacterial and archaeal (E), and fungal (F) beta diversity by PCoA generated with weighted Unifrac distances across FTC phases. Principal axis for the bacterial/archaeal community account for a high degree of variation and possess a distinct horseshoe shape with slight separation by phase. Little variation is explained for any principal axis in the fungal community and sites do not appear to cluster by phase.
Genus level changes appear similarly muted across experimental phase. Bacterial and archaeal genera differed in relative abundance by a median of 17.3% within their proportion of the community composition (e.g., from 1.0% to 1.17%) between adjacent phases, with the exception of Pseudomonas which dropped from 2.8% to 0.5% of the community after the onset of FTC, a 82% drop in relative abundance (Supplementary Figure S7). The fungal genera were more variable than bacteria and archaea with a median 25% change in relative abundance within their proportion of the community composition (e.g., from 2% to 2.5%) across adjacent phases (Supplementary Figure S8). The higher variance in the fungal data may have been impacted by the lower sampling frequency. Dominant fungal genera are those of the Ascomycota phyla including the Podospora and Entoloma genera.
Alpha Diversity
Changes in alpha diversity were assessed for disruption due to fertilizer amendment and FTC. No discernible or intuitive trend for bacterial/archaeal alpha diversity is observed that is consistent across fertilizer or depth conditions (Supplementary Figure S9), however an overall increase in alpha diversity is observed for aggregated samples within the FTC phase (Figure 3C). The 5 cm depth, which was experiencing FTC, showed similar magnitudes and patterns for alpha diversity (Supplementary Figure S10). An ANOVA performed across categorical variables only identified phase as significant, with neither column (fertilizer) nor depth resulting in changes to richness or evenness. Within the phase variable, a Tukey HSD test for observed ASVs and Shannon Index identified only samples during freeze-thaw cycling as significantly different from pre- and post-FTC, as a noticeable increase in diversity is observed over phase but then returns to pre-FTC levels after temperature fluctuations cease. In contrast, Faith’s PD showed significant differences for each phase (Supplementary Figure S9). This difference between the pre- and during FTC was consistent for all sampling depths, but at the 5 cm depth was not significant between any other groupings as the drop in diversity post-FTC was lower in magnitude (Supplementary Figure S10). This was unexpected, as freeze-thaw stress was expected to act as a greater selection process for microbes less capable of cold shock adaption. Instead, we observed an increase in diversity during FTC and then a return to the pre-FTC magnitude. This may represent an enrichment of rare ASVs in response to newly available labile carbon from cell lysis.
Meanwhile the fungal community experienced a much more muted change. Similarly, there were no significant changes in all metrics of alpha diversity associated to fertilizer treatment, depth, or phase (Figure 3D; Supplementary Figure S11) with the same true at 5 cm depth (Supplementary Figure S12). However, it is interesting to note that while there is overall lower diversity among the fungal community in observed ASVs and Shannon score there is a similar Faith’s PD levels between the fungal and bacterial/archaeal community, indicating that while the fungal community is less diverse at an ASV level, the ASVs are less closely related.
Beta Diversity and Canonical Ordination
Beta diversity values did not demonstrate a clear relationship with column (fertilizer), depth, or across phase for either the bacterial/archaeal or the fungal communities (Supplementary Figures S13, 14). One exception was for the bacterial and archaeal community using weighted Unifrac distances (Figure 3E). When visualized as a two-dimensional PCoA the samples form a distinct horseshoe shape, with 55.1% of the total variation captured by the primary axis. Direct comparison using unweighted and weighted Unifrac distances showed the weighted contribution of relative abundance is necessary to reveal this pattern (Supplementary Figure S15). Taken together, the combination of relative abundance and phylogenetic diversity must be required to identify this pattern, as it is not evident with Bray-Curtis distances, which incorporate relative abundance, or with unweighted Unifrac, which also use phylogenetic diversity. Within the weighted Unifrac distribution, samples are loosely ordered by phase along the principal axis (Figure 3E). Examination of solely the −5 cm depth samples revealed no deeper insight except that the horseshoe shape among the bacterial/archaeal samples was retained (Supplementary Figure S16, 17).
Given the temporal variable was associated with beta diversity differences, we focused on identifying the role of phase in the bacterial and archaeal samples through a canonical ordination to determine the contribution of environmental and categorical variables in distinguishing the microbial community compositions across sample sites. Continuous variables were captured in nMDS plots (Figure 4A) and categorical variables in CCA plots (Figure 4B).
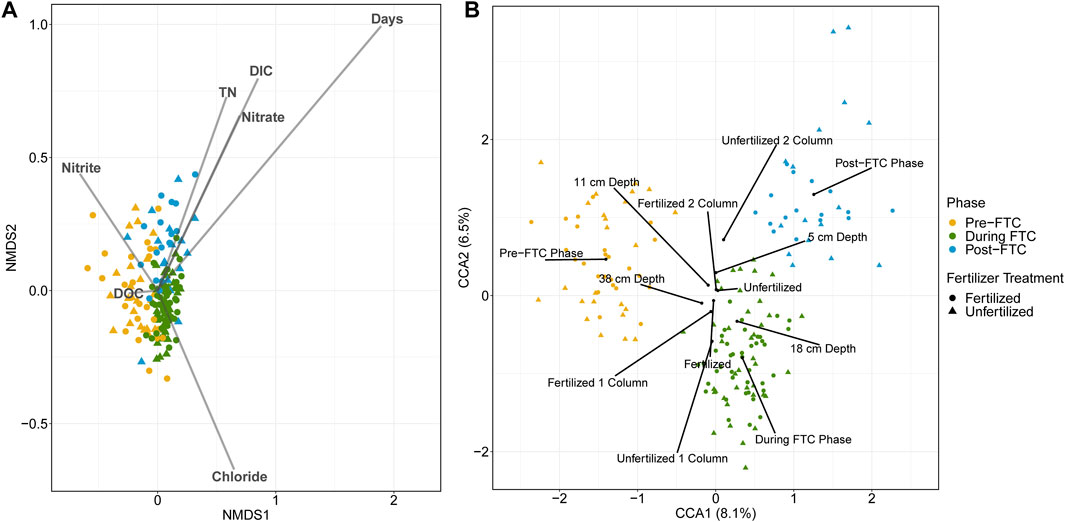
FIGURE 4. Bacterial and archaeal canonical ordination. Ordinations are generated from Bray-Curtis distances of all 7390 ASV relative abundances across all 160 soil samples. Samples are indicated by colour for the phase of freeze-thaw cycling (green for pre-FTC; blue for during FTC; red for post-FTC), and shape for fertilizer treatment (circle for fertilized; triangle for unfertilized). An nMDS plot (A) with vectors representing time as well as geochemical variables obtained from the soil leachate are overlayed. Time is the largest continuous variable contributor to sample dissimilarity with the largest vector and the samples clearly segregated by phase of freeze-thaw cycling. A CCA plot (B) with centroids representing the factor levels of categorical variables including phase, depth, column, and fertilizer are shown. The strongest categorical variable for influencing sample dissimilatory is phase, indicated by segregated samples by phase. Despite this the two principal coordinate axes explain only 6.5 and 8.1% of the variation in the samples.
For the bacterial and archaeal samples, the strongest indicator variable in the nMDS and CCA plots are both elements of time: ‘Days’ on the nMDS (p = 0.001, r2 = 0.4560; Figure 4A), and the phases’ centroids on the CCA (R = 0.4858, p = 0.0001; Figure 4B). This adds to the observed trend in alpha and beta diversity metrics of specific, limited differences in the microbial communities aligning with the phase of the temperature regime. There was little explanatory power assigned to any of the other variables. For example, significant variables on the nMDS showed weak environmental fitting: dissolved inorganic carbon (DC) (p = 0.001; r2 = 0.1356), total nitrogen (TN) (p = 0.002; r2 = 0.0860), Cl− (p = 0.002; r2 = 0.0871), NO2−(p = 0.010; r2 = 0.0625), and NO3− (p = 0.001; r2 = 0.0915). Significance and magnitude of dissimilarities between microbial communities across sample types was assessed using the ANOSIM test. This showed that, while the factors depth (R = 0.0209; p = 0.01), column (R = 0.0621; p = 0.0001), and fertilizer (R = 0.0285; p = 0.0023) were significant, most possess a low R-statistic revealing little contribution to the magnitude of community dissimilarity. When run on a model accounting for fertilizer, column, depth, and phase, the CCA captured only a small percentage of variation associated with its principal axes (8.1 and 6.5%; Figure 4B), and the only meaningful separation can be explained by phase of freeze-thaw cycling.
For the fungal samples, the ordination from the nMDS identified only NO3− (p = 0.014; r2 = 0.0956) and TN (p = 0.014; r2 = 0.0956) as significant variables, although these contribute negligibly to the explanatory power of sample separation (Supplementary Figure S18). Unlike the bacterial and archaeal samples, separation of samples along fertilizer or phase variables is not observed (Figure 3F). Significance and magnitude of dissimilarities between microbial communities across sample types assessed using the ANOSIM test showed that only factors of phase (R = 0.1607; p = 0.0003), column (R = 0.0221; p = 0.0386), and fertilizer (R = 0.0309; p = 0.0084) were significant, but all possess a low R-statistic revealing little contribution to the magnitude of community dissimilarity. When run on a model accounting for fertilizer, column, depth, and phase, the CCA captured only a small percentage of variation associated with its principal axes (11.3 and 13.0%; Supplementary Figure S19). For this reason, analyses past this point emphasized tracking changes to the designated core microbiomes and potential predicted nitrogen cycling communities identified by PICRUSt2.
Abundance-Occupancy “Core” Modeling
Bacterial, archaeal, and fungal ASVs were assigned to a “core” microbiome predicated on their unique temporal site specific abundance and occupancy across all extracted soil samples as described by Shade and Stopnisek (2019). ASVs were first ranked based on the abundance-occupancy distribution of all samples and then core members were sequentially included iteratively if their explanatory power towards Bray-Curtis dissimilatory of the community increases beyond the designated threshold (see Materials and Methods for more detail). The stability of the core community was then assessed via its changing relative abundance with time.
The bacterial core community was composed of 94 ASVs from an original 7,390 ASVs, accounting for 25% of the total beta diversity, which constitute a meager majority of the community with 45–50% summed relative abundance (Figure 5B). The community composition of the core generally resembled the total community and is predominantly made up of Proteobacteria and Acidobacteria (Supplementary Figure S20). A decline in the core community’s abundance occurs during FTC with a recovery afterwards (Figure 5A). Tukey HSD tests for multiple pairwise comparisons identified that within both fertilized and unfertilized treatments the phase change between pre- and during FTC, and between during and post-FTC showed significant changes to the core community’s shared abundance. The two fertilizer treatments significantly differed only in the post-FTC phase, in which the fertilizer treatments showed an elevated core abundance. These shifts in core community composition appear indirectly related to freeze-thaw stress, as these significant differences were not observed for the 5 cm depth (Supplementary Figure S21). For the 5 cm depth, only the shift between the during and post-FTC phases was significant.
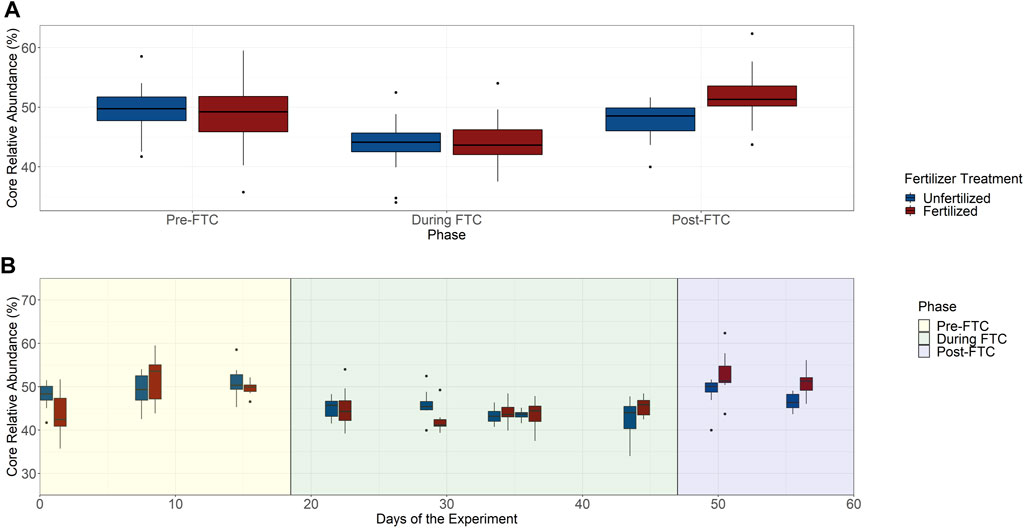
FIGURE 5. Bacterial and archaeal core community. The total community abundance of the 94 ASVs identified as the core community were plotted over phase with fertilized and unfertilized treatments plotted separately (A). Tukey HSD tests for multiple pairwise comparisons identified significant differences associated with pre- and during FTC, and during and post-FTC within both fertilizer treatments. Relative abundance recovers post-FTC, and the pre- and post- FTC phases were not significantly different. Fertilizer treatments do not seem to differ within a phase except post-FTC where the fertilizer sample is significantly elevated. The difference in mean relative abundance is ∼5% from pre-to during FTC and recovers post-FTC by ∼4% by the unfertilized and ∼5% for the fertilized. The total community relative abundance of the 94 ASVs identified for core community inclusion is plotted over time with treatments of unfertilized and fertilized columns plotted separately (B). Adjacent time-points and fertilizer treatments do not show significant variation. The core community appears unaltered in relative community abundance under freeze-thaw or nutrient induced stress.
The fungal core community also comprised 94 ASVs, from the 1,358 ASVs identified. The fungal core accounted for 70% of the total beta diversity, and made up a solid majority of the community, with approximately 80% of the relative abundance (Supplementary Figure S22). The fungal core community abundance did not change significantly with fertilizer treatments or across phase (Supplementary Figure S23). Its composition was dominated by the Ascomycota, as seen for the total community (Supplementary Figure S24). The limited core fungal community response was also observed when the 5 cm depth samples were considered independently (Supplementary Figure S25).
PICRUSt2 and Predicted Nitrogen Cycling Populations
PICRUSt2 was used to predict which ASVs in the bacterial and archaeal community are likely capable of nitrogen cycling based on their relationship to fully sequenced genomes annotated with EC numbers mediating conversion of nitrogen species (Douglas et al., 2020). Nitrogen cycling enzymes included ureC, amoA, hao, nxr, nar, nir, nor, and nosZ, covering the key functions of the nitrification and denitrification pathways. The ASVs associated to each potential gene function were then combined into a single fraction of the total community’s relative abundance and the resultant guilds tracked over time and between fertilizer treatments. Across the eight enzymes, there was little change in proportion across samples and between fertilizer treatments (Supplementary Figure S26). The urea-degrading and ammonia oxidizing communities made up only a small fraction of the total community based on predicted presence of ureC (∼25% of community; Figure 6A) and amoA (∼1% of community; Figure 6B), despite that the nitrogen component of fertilizer is primarily urea. Tukey HSD multiple pairwise comparisons were used to determine significance across each unfertilized and fertilized pair per time-point. Tukey HSD multiple pairwise comparisons did not show significant differences broadly over time and fertilizer treatments with one exception. For the first sampling time point, 6 of the 8 explored enzymes have a significant enrichment in community abundance among fertilized samples compared to unfertilized samples (Figure 6C).
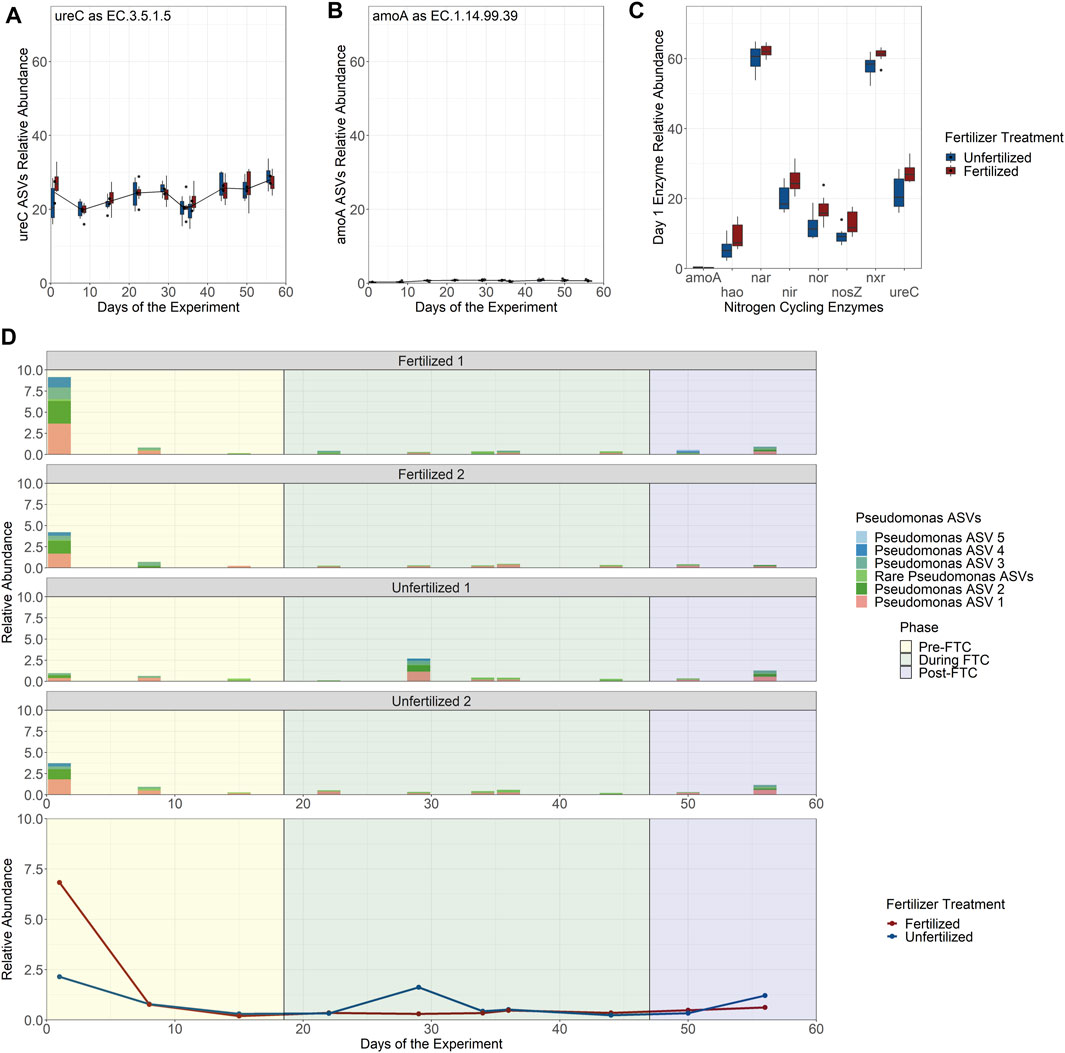
FIGURE 6. Predicted nitrogen cycling community relative abundance over time by enzyme classification number and Pseudomonas genus abundance contribution. (A–C) Read counts for populations identified by PICRUSt2 to possess potential nitrogen cycling enzymes by EC number were combined to show the relative abundance of all populations in the community for ureC (A) and amoA (B). Despite urea and ammonia being the primary constituents of the fertilizer there is little enrichment of the fertilized column treatments in predicted community members for their consumption with the exception of the first time-point (day 1) for 6 of the 8 investigated nitrogen cycling enzymes (C) that possess a statistically significant higher relative abundance among the fertilized treatments. This enrichment only exists on day 1 and is attributed to the ASVs belonging to the Pseudomonas genus. (D) The relative abundance of the Pseudomonas genus is shown over time separated by each experimental column with a breakdown of the Pseudomonas ASVs (the 5 most abundant numbered sequentially in their abundance; the remaining 10 ASVs are grouped together under “Rare Pseudomonas ASVs” with individual abundances of less than 0.15%) under the genus (top), and in aggregate across all columns (bottom).
Further exploration indicates that the enrichment in nitrogen cycling in fertilized columns on day 1 was associated with the Pseudomonas genus. Fifteen ASVs were assigned to Pseudomonas, with PICRUSt2 predicting that all fifteen should encode genes for ureC, hao, nxr, nir, nor, and nosZ. The relative abundance of Pseudomonas was then tracked over time between each column (Figure 6D: Top), where it reaches close to 10% relative abundance of the entire bacterial and archaeal community at the first sampling-point in the Fertilized 1 column. This early enrichment drops off after the initial nutrient spike at the beginning of the experiment, returning to levels seen in the other three columns over time (Figure 6D: Bottom). We predict that Pseudomonas is highly enriched under these conditions because the Pseudomonas are expected to be capable of multiple steps in nitrogen cycling and can extract energy from multiple nitrogen conversions (Arat et al., 2015), compared to the bulk of nitrogen cycling in soils which is uncoupled, with each step carried out by specific microbes. Overall, this indicates that while unique microbes may be able to benefit from nutrient stress, the majority of microbial populations experience a muted change to biomass relative to the community. In this experiment, nutrient stress was not a strong selection event for microbes.
Discussion
Northern temperate agricultural soils undergo broad environmental changes seasonally with freeze-thaw cycling through the non-growing season and increased nutrient load from pre-winter applied fertilizers. We hypothesized that environmental changes would act as selection events that would enrich for microbes with FTC resistance or opportunistic nitrogen cyclers. Instead, the results of this column experiment imply an alternative view, where seasonally experienced freeze-thaw cycles and fertilizer-induced nutrient load in agricultural soils are not significant stress events.
Freeze-Thaw Cycling as Regular Seasonal Changes
The experimental columns used in this experiment offered a more realistic agricultural soil microcosm than previous studies (Sulkava and Huhta, 2003; Koponen and Martikainen, 2004; Bechmann et al., 2005), utilizing a simulated climate model based on real data on a 1/3 timescale, artificial precipitation, and an insulated temperature gradient by depth. Frost heaving and freeze-thawing was achieved in soil columns despite using ambient temperatures no lower than −10°C and highs no higher than 10°C, following a diurnal frequency to mimic the rate of temperature change experienced by soil in nature (Henry, 2007). As a result, frost heaving of the topsoil was only observed at the shallowest depth. Under these conditions, bacterial, archaeal, and fungal communities did not exhibit strong compositional changes across the spatial or temporal variables examined. Across phase, an aggregate variable for extent of freeze-thaw cycling, changes in the relative abundances of taxa previously shown to respond to FTC were relatively muted. Significant decreases among the Acidobacteria and Ascomycota phyla in all samples across experimental phase were less distinct and non-significant in the soil depth experiencing FTC, suggesting exposure to temperature fluctuations was not the main factor driving these community shifts. This muted response in fungal communities to FTC, as evidenced by Ascomycota at consistently high proportional abundance, was expected, as their stable community composition has been observed previously (Sharma et al., 2006; Feng et al., 2007). The main exception to this community stability was the Pseudomonas genus across phase, which was later attributed to Pseudomonas’s predicted nitrogen cycling capacity (see 4.2). While we found change across the entire community to be minimal, the fungal community appeared particularly insulated at the phylum level with some distinct genera changes among the Alternaria, Entoloma, and Staphylotrichum (Supplementary Figure S8). This resilience has been attributed previously to the role of fungal hyphae and greater substrate access (Schadt et al., 2003; Tucker et al., 2014).
For bacteria and archaea, alpha diversity metrics showed a clear pattern of increased diversity from pre-FTC to during FTC in the bacterial and archaeal community data, but with a return to previous diversity levels in the post-FTC phase. This change was significant and was observed at the shallowest depth. This trend sharply contrasts the expectation of a selection event leading to a permanent change in the soil microbial community. The underlying cause of increased alpha diversity in the bacterial and archaeal community under FTC is not clear, with this elevated diversity present in all samples and not just the upper 5 cm depth directly experiencing FTC. We suggest two interpretations: 1) the eventual return of bacterial/archaeal alpha diversity to lower levels post-FTC implies a degree of community resilience to the stress of FTC, or 2) the change in alpha diversity is completely independent of FTC due to the stability of this trend at temperature insulated depths. In either case, FTC have limited impact on population abundances. FTC did not generate a site-specific community change in the shallowest depth, and, if responsible for the increased alpha diversities, resulted only in a temporary oscillation.
Investigation of beta diversity confirmed a community change in response to phase (but not to fertilizer or depth) (Figure 3). Canonical ordination mapping experimental variables to community variation showed clear separation of the samples based on phase (or analogs of it like days or time), with a significant magnitude of change. Despite the clear visual separation of the data by phase, only ∼20% of the variation in the data was accounted for (Figure 4). Some geochemical variables were significant, but all had low coefficients of determination and did not explain much of the variation in the data. Taken together, this implies FTC have knock-on effects on communities at deeper, temperature-buffered depths, or that other, untested factors may play stronger roles in the bacterial/archaeal community compositional response.
Core community analysis assessed the response of microbial community members that are both spatially persistent and most abundant. Changes in the relative abundance of the core community, representing the persistent and abundant ASVs, would highlight the role of the non-persistent or stress induced ASVs on community resilience and cohesion. When the abundance of this core community was tracked over phase and fertilizer treatments (Figure 5), only clustering samples by phase demonstrated variability, where, following an initial decrease during FTC, the bacterial and archaeal core community abundance recovers in the post-FTC phase. This corroborates the observed increase in alpha diversity during FTC for the total community, where the observed ∼4–5% decrease in the core communities’ relative abundance may represent novel populations displacing core populations in abundance. As this effect was more muted in the shallowest 5 cm depth, it is not clear these changes are the result of freeze-thaw cycling. Core community analyses indicated that the core community is relatively resilient, quickly recovering, and does not experience significant declines under what would conventionally be considered a stress event in the form of FTC. This has not commonly been observed in FTC literature, where the majority of studies have focused on arctic/permafrost soils, where active layer thawing gives rise to more dramatic changes to diversity and community compositions during freeze-thaw cycling (Deng et al., 2015; Müller et al., 2018; Yuan et al., 2018; Schostag et al., 2019). As northern temperate agricultural soils experience FTC seasonally for half the year, freeze-thaw cycling does not appear to act as a punctuated selection event. However, reliance on amplicon sequence data over truncated simulated timelines may obfuscate community changes due to sequencing of relic DNA, extracellular DNA in soil from dead cells, and may increase diversity estimates as much as 40% (Carini et al., 2016).
Fertilizer Nutrient Load as Temporary Enrichment
Two of the four experimental columns were amended with fertilizer to determine the impacts of nutrient load on the bacterial, archaeal, and fungal communities. Results from the flow-through leachate, as detailed in Krogstad et al. (2022), suggest significant fertilizer consumption, with NO3− increasing as the result of microbially-mediated nitrification processes. However, fertilizer was not found to be a significant variable explaining any of the observed variations of the community composition, diversity, or core abundance, despite active microbially-mediated nitrification occurring over the experimental window (Krogstad et al., 2022). This was unexpected, as the ample supply of nitrogen and phosphorus provided by the fertilizer was expected to significantly enrich the fertilized communities for populations capable of nitrogen cycling.
The bacterial and archaeal communities did not exhibit strong compositional changes at the phylum level across the spatial, temporal, or fertilizer variables that were sampled. Lower taxonomic levels were also explored with no observable difference with respect to phase or fertilizer. We found that the bacterial/archaeal and fungal communities did not experience significant patterns in beta diversity associated with the fertilizer variable. In canonical ordinations, though the samples showed similar degrees of separation, no evident clustering based on fertilizer or other experimental variables was observed (Supplementary Figures S16–19). Equally, the core community abundance did not show differences between the fertilized and unfertilized columns (Figure 5). Lack of stratification by depth in response to fertilizer amendment was expected, as Krogstad et al. (2022) demonstrated percolation of the dissolved fertilizer through the entire length of the column via the leachate. Therefore, the fertilizer was consumed throughout the entire column but did not contribute to differential growth. The implication is that fertilizer does not select for opportunistic growth but is merely consumed by existing, persistent members of the community. The impact on the microbial community is likely at the level of gene expression rather than population change.
A sole exception was the observation of significant enrichment of the Pseudomonas genus within one fertilized column in the first time point only, where the Pseudomonas were implicated in fertilizer-amended nitrogen cycling. However, this enrichment quickly collapses following the first temporal sampling point. The implications of this observation are limited as it only appeared in one of the duplicate columns. The Pseudomonas may be enriched because they can leverage a greater degree of nitrogen utilization pathways. PICRUSt2 predicts this genus possesses ureC, hao, nir, nxr, nar, nor, and nosZ. We note inferences of function must be tempered as PICRUSt2 is only predicting gene potential. Some Pseudomonas are metabolically flexible, possessing both heterotrophic nitrification and aerobic (or facultative anaerobic) denitrification (Wei et al., 2021) in contrast to most nitrogen cyclers which have uncoupled nitrogen metabolisms, each with a specific niche (Palomo et al., 2018). The enrichment in Pseudomonas populations does not persist through later timepoints in the experiment and thus this brief enrichment does not appear to shape the microbial community.
Across other timepoints and conditions, the populations implicated in nitrogen metabolism, who would be expected to respond to fertilizer amendments, do not show significant change. Given active nitrification is occurring, these guilds are transforming nitrogen species, but this activity is not contributing to microbial growth. The window of fertilizer availability may not be prolonged enough to see differences in population abundances for microbes acting opportunistically in response to metabolic inputs. This is further evident by the extremely low relative abundance of putative ammonium monooxygenase-bearing populations in the total community despite ammonia conversion being an important early step to fertilizer assimilation.
Conclusion
From this experiment, freeze-thaw cycling and fertilizer amendments did not act as selection events nor cause significant changes to population abundances in agricultural soils over a simulated non-growing season. Rather than modeling these as stressors that alter the microbial community composition, we posit these are environmental conditions that are regularly experienced by the autochthonous microbial community. As a result, these do not cause significant changes to population abundances but may instead more strongly impact the community at the level of gene expression.
This contrasts with trends observed in arctic/permafrost soils, where active layer thawing creates clearly demarcated changes to microbial populations during freeze-thaw cycling (Deng et al., 2015; Müller et al., 2018; Yuan et al., 2018; Schostag et al., 2019). The experimental columns used in this experiment generated a realistic agricultural soil microcosm, including real climate model data, simulated precipitation, and an insulated temperature gradient by depth. Other freeze-thaw studies have typically only sampled before and after seasons, whereas our longitudinal monitoring with interim sampling points allowed frequent sampling across depth, fertilizer treatment, and time for microbial community composition. Rather than assuming possible community changes may be reflective of binary states, this design explored the microbial communities dynamics in near real time. The experimental design contributed to observing less dramatic microbial responses to FTC. However, there is still room for improvement including use of unfrozen controls, intact soil cores, more column replicates, removal of relic DNA, and active gene expression monitoring. Further experiments are needed to assess the hypothesized expression level changes, ideally coupled to a holistic examination of community response.
Data Availability Statement
The datasets presented in this study can be found in the NCBI SRA database (https://www.ncbi.nlm.nih.gov/) under accessions SRX14619372 - SRX14619626.
Author Contributions
All authors conceived of the study. GJ and KK conducted fieldwork, set up columns, and ran the experiment. GJ extracted DNA, analyzed the data, and wrote the first draft of the manuscript. All authors edited the manuscript. LH and FR acquired funding for the project.
Funding
GJ was supported by an Ontario Graduate Scholarship and the rare Charitable Research Reserve Ages Foundation Fellowship. LH was supported by a Canada Research Chair. Funding was provided by the Canada Research Chair program in Environmental Microbiology and the winter Soil Processes in Transition project within the Global Water Futures (GWF) program funded by the Canada First Research Excellence Fund (CFREF).
Conflict of Interest
The authors declare that the research was conducted in the absence of any commercial or financial relationships that could be construed as a potential conflict of interest.
Publisher’s Note
All claims expressed in this article are solely those of the authors and do not necessarily represent those of their affiliated organizations, or those of the publisher, the editors and the reviewers. Any product that may be evaluated in this article, or claim that may be made by its manufacturer, is not guaranteed or endorsed by the publisher.
Acknowledgments
We thank the rare Charitable Research Reserve (Cambridge, ON, Canada) for access to the field site where soil samples were collected. We also thank Marianne Vandergreindt and Stephanie Slowinski for assistance with laboratory experiments and sample analyses.
Supplementary Material
The Supplementary Material for this article can be found online at: https://www.frontiersin.org/articles/10.3389/fenvs.2022.908568/full#supplementary-material
References
Allan, R., Hawkins, E., Bellouin, N., and Collins, B. (2021). Climate Change 2021 The Physical Science Basis Summary for Policymakers. IPCC. Available at: https://www.ipcc.ch/report/ar6/wg1/downloads/report/IPCC_AR6_WGI_SPM_final.pdf.
Arat, S., Bullerjahn, G. S., and Laubenbacher, R. (2015). A Network Biology Approach to Denitrification in Pseudomonas aeruginosa. PLoS One 10 (2), e0118235. doi:10.1371/journal.pone.0118235
Bechmann, M. E., Kleinman, P. J. A., Sharpley, A. N., and Saporito, L. S. (2005). Freeze-Thaw Effects on Phosphorus Loss in Runoff from Manured and Catch-Cropped Soils. J. Environ. Qual. 34 (6), 2301–2309. doi:10.2134/jeq2004.0415
Bisanz, J. (2018). qiime2R: Importing QIIME2 Artifacts and Associated Data into R Sessions. Available at:. https://github.com/jbisanz/qiime2R (Accessed March 17, 2022).
Boelter, D. H. (1972). Water Table Drawdown Around an Open Ditch in Organic Soils. J. Hydrology 15 (4), 329–340. doi:10.1016/0022-1694(72)90046-7
Bokulich, N. A., Kaehler, B. D., Rideout, J. R., Dillon, M., Bolyen, E., Knight, R., et al. (2018). Optimizing Taxonomic Classification of Marker-Gene Amplicon Sequences with QIIME 2's Q2-Feature-Classifier Plugin. Microbiome 6 (1). doi:10.1186/s40168-018-0470-z
Bokulich, N. A., and Mills, D. A. (2013). Improved Selection of Internal Transcribed Spacer-specific Primers Enables Quantitative, Ultra-high-throughput Profiling of Fungal Communities. Appl. Environ. Microbiol. 79 (8), 2519–2526. doi:10.1128/aem.03870-12
Bolyen, E., Rideout, J. R., Dillon, M. R., Bokulich, N. A., Abnet, C. C., Al-Ghalith, G. A., et al. (2019). Reproducible, Interactive, Scalable and Extensible Microbiome Data Science Using QIIME 2. Nat. Biotechnol. 37 (8), 852–857. doi:10.1038/s41587-019-0209-9
Callahan, B. J., McMurdie, P. J., Rosen, M. J., Han, A. W., Johnson, A. J. A., and Holmes, S. P. (2016). DADA2: High-Resolution Sample Inference from Illumina Amplicon Data. Nat. Methods 13 (7), 581–583. doi:10.1038/nmeth.3869
Carini, P., Marsden, P. J., Leff, J. W., Morgan, E. E., Strickland, M. S., and Fierer, N. (2016). Relic DNA Is Abundant in Soil and Obscures Estimates of Soil Microbial Diversity. Nat. Microbiol. 2. 16242. doi:10.1038/nmicrobiol.2016.242
Chantigny, M., Rochette, P., Angers, D., Goyer, C., Brin, L., and Bertrand, N. (2017). Non-growing Season N2O and CO2 Emissions - Temporal Dynamics and Influence of Soil Texture and Fall-Applied Manure. Can. J. Soil. Sci. 97 (November 2016), 452–464. doi:10.1139/CJSS-2016-0110
Clarke, K. R. (1993). Non-parametric Multivariate Analyses of Changes in Community Structure. Austral Ecol. 18 (1), 117–143. doi:10.1111/j.1442-9993.1993.tb00438.x
Clein, J. S., and Schimel, J. P. (1995). Microbial Activity of Tundra and Taiga Soils at Sub-zero Temperatures. Soil Biol. Biochem. 27 (9), 1231–1234. doi:10.1016/0038-0717(95)00044-f
Conant, B. (2004). Delineating and Quantifying Ground Water Discharge Zones Using Streambed Temperatures. Ground Water 42 (2), 243–257. doi:10.1111/j.1745-6584.2004.tb02671.x
CAPMoN, (2018). Major Ions. Retrieved from Environment and Climate Change Canada website: http://donnees.ec.gc.ca/data/air/monitor/monitoring-ofatmospheric-precipitation-chemistry/major-ions/
Deng, J., Gu, Y., Zhang, J., Xue, K., Qin, Y., Yuan, M., et al. (2015). Shifts of Tundra Bacterial and Archaeal Communities along a Permafrost Thaw Gradient in A Laska. Mol. Ecol. 24 (1), 222–234. doi:10.1111/mec.13015
Douglas, G. M., Maffei, V. J., Zaneveld, J., Yurgel, S. N., Brown, J. R., Taylor, C. M., et al. (2020). PICRUSt2 for prediction of metagenome functions. Nature biotechnology 38 (6), 685–688. doi:10.1038/s41587-020-0548-6
Du, E., Zhou, Z., Li, P., Jiang, L., Hu, X., and Fang, J. (2013). Winter Soil Respiration during Soil-Freezing Process in a Boreal Forest in Northeast China. J. Plant Ecol. 6 (5), 349–357. doi:10.1093/jpe/rtt012
Feng, X., Nielsen, L. L., and Simpson, M. J. (2007). Responses of Soil Organic Matter and Microorganisms to Freeze-Thaw Cycles. Soil Biol. Biochem. 39 (8), 2027–2037. doi:10.1016/j.soilbio.2007.03.003
Funk, G., McClenghan, W., and Holland, C. (1980). Water Wells and Ground Water Supplies in Ontario. Toronto, Ontario: Ontario Ministry of the Environment. Available at: https://atrium.lib.uoguelph.ca/xmlui/bitstream/handle/10214/15692/OME_water_wells_groundwater80.pdf?sequence=1&isAllowed=y.
Fuss, C. B., Driscoll, C. T., Groffman, P. M., Campbell, J. L., Christenson, L. M., Fahey, T. J., et al. (2016). Nitrate and Dissolved Organic Carbon Mobilization in Response to Soil Freezing Variability. Biogeochemistry 131 (1–2), 35–47. doi:10.1007/s10533-016-0262-0
Gee, G. W., and Bauder, J. W. (1986). “Particle-size Analysis,” in Methods of Soil Analysis: Part 1 Physical and Mineralogical Methods. Editors A. Klute Madison (Wisconsin, USA: American Society of Agronomy), 383–411. doi:10.2136/sssabookser5.1.2ed.c15
Graham, D. E., Wallenstein, M. D., Vishnivetskaya, T. A., Waldrop, M. P., Phelps, T. J., Pfiffner, S. M., et al. (2012). Microbes in Thawing Permafrost: The Unknown Variable in the Climate Change Equation. ISME J. 6, 709–712. doi:10.1038/ismej.2011.163
Han, C.-L., Gu, Y.-J., Kong, M., Hu, L.-W., Jia, Y., Li, F.-M., et al. (2018). Responses of Soil Microorganisms, Carbon and Nitrogen to Freeze-Thaw Cycles in Diverse Land-Use Types. Appl. Soil Ecol. 124 (April 2017), 211–217. doi:10.1016/j.apsoil.2017.11.012
Hayashi, M. (2014). The Cold Vadose Zone: Hydrological and Ecological Significance of Frozen-Soil Processes. Vadose Zone J. 13 (1). doi:10.2136/vzj2013.03.0064er
Henry, H. A. L. (2007). Soil Freeze-Thaw Cycle Experiments: Trends, Methodological Weaknesses and Suggested Improvements. Soil Biol. Biochem. 39 (5), 977–986. doi:10.1016/j.soilbio.2006.11.017
Kassambara, A. (2020). Ggpubr: “Ggplot2” Based Publication Ready Plots. Available at:. https://rpkgs.datanovia.com/ggpubr/(Accessed March 17, 2022).
Koponen, H. T., and Martikainen, P. J. (2004). Soil Water Content and Freezing Temperature Affect Freeze-Thaw Related N2O Production in Organic Soil. Nutrient Cycl. Agroecosyst. 69 (3), 213–219. doi:10.1023/B:FRES.0000035172.37839.24
Krogstad, K., Gharasoo, M., Jensen, G., Hug, L. A., Rudolph, D., Van Cappellen, P., et al. (2022). Nitrogen Leaching From Agricultural Soils Under Imposed Freeze-Thaw Cycles: A Column Study with and Without Fertilizer Amendment. Front. Environ. Sci. doi:10.3389/fenvs.2022.908568
Martin, M. (2011). Cutadapt Removes Adapter Sequences from High-Throughput Sequencing Reads. EMBnet J. 17 (1), 10–12. doi:10.14806/ej.17.1.200
McMurdie, P. J., and Holmes, S. (2013). Phyloseq: An R Package for Reproducible Interactive Analysis and Graphics of Microbiome Census Data. PLoS One 8 (4), e61217. doi:10.1371/journal.pone.0061217
Müller, O., Bang‐Andreasen, T., White, R. A., Elberling, B., Taş, N., Kneafsey, T., et al. (2018). Disentangling the Complexity of Permafrost Soil by Using High Resolution Profiling of Microbial Community Composition, Key Functions and Respiration Rates. Environ. Microbiol. 20, 4328–4342. doi:10.1111/1462-2920.14348
Nilsson, R. H., Larsson, K.-H., Taylor, A. F. S., Bengtsson-Palme, J., Jeppesen, T. S., Schigel, D., et al. (2019). The UNITE Database for Molecular Identification of Fungi: Handling Dark Taxa and Parallel Taxonomic Classifications. Nucleic Acids Res. 47 (D1), D259–D264. doi:10.1093/nar/gky1022
OMAFRA (2018) Soil Fertility Handbook - Publication 611. Editor J. Munroe. 3rd edn (Guelph, Ontario, Canada: OMAFRA).
Oksanen, J., Blanchet, G., Friendly, M., Kindt, R., Legendre, P., McGlinn, D., et al. (2019). Vegan: Community Ecology Package. Available at:. https://github.com/vegandevs/vegan (Accessed March 17, 2022).
Palomo, A., Pedersen, A. G., Fowler, S. J., Dechesne, A., Sicheritz-Pontén, T., and Smets, B. F. (2018). Comparative Genomics Sheds Light on Niche Differentiation and the Evolutionary History of Comammox Nitrospira. ISME J. 12 (7), 1779–1793. doi:10.1038/s41396-018-0083-3
Pesaro, M., Widmer, F., Nicollier, G., and Zeyer, J. (2003). Effects of Freeze-Thaw Stress during Soil Storage on Microbial Communities and Methidathion Degradation. Soil Biol. biochem. 35, 1049–1061. doi:10.1016/S0038-0717(03)00147-0
Quast, C., Pruesse, E., Yilmaz, P., Gerken, J., Schweer, T., Yarza, P., et al. (2013). The SILVA Ribosomal RNA Gene Database Project: Improved Data Processing and Web-Based Tools. Nucleic Acids Res. 41 (D1), D590–D596. doi:10.1093/nar/gks1219
Ren, J., Song, C., Hou, A., Song, Y., Zhu, X., and Cagle, G. A. (2018). Shifts in Soil Bacterial and Archaeal Communities during Freeze-Thaw Cycles in a Seasonal Frozen Marsh, Northeast China. Sci. Total Environ. 625, 782–791. doi:10.1016/j.scitotenv.2017.12.309
Rivkina, E. M., Friedmann, E. I., McKay, C. P., and Gilichinsky, D. A. (2000). Metabolic Activity of Permafrost Bacteria below the Freezing Point. Appl. Environ. Microbiol. 66 (8), 3230–3233. doi:10.1128/AEM.66.8.3230-3233.2000
Romero, C. M., Engel, R. E., Chen, C., Wallander, R., and Jones, C. A. (2017). Late-Fall, Winter, and Spring Broadcast Applications of Urea to No-Till Winter Wheat II. Fertilizer N Recovery, Yield, and Protein as Affected by NBPT. Soil Sci. Soc. Am. J. 81 (2), 331–340. doi:10.2136/sssaj2016.10.0333
RStudio Team (2020). RStudio: Integrated Development for R. Available at:. http://www.rstudio.com/(Accessed March 17, 2022).
Schadt, C. W., Martin, A. P., Lipson, D. A., and Schmidt, S. K. (2003). Seasonal Dynamics of Previously Unknown Fungal Lineages in Tundra Soils. Science 301 (5638), 1359–1361. doi:10.1016/S1359-6454(03)00232-510.1126/science.1086940
Schostag, M., Priemé, A., Jacquiod, S., Russel, J., Ekelund, F., and Jacobsen, C. S. (2019). Bacterial and Protozoan Dynamics upon Thawing and Freezing of an Active Layer Permafrost Soil. ISME J. 13 (5), 1345–1359. doi:10.1038/s41396-019-0351-x
Shade, A., and Stopnisek, N. (2019). Abundance-occupancy Distributions to Prioritize Plant Core Microbiome Membership. Curr. Opin. Microbiol. 49, 50–58. doi:10.1016/j.mib.2019.09.008
Sharma, S., Szele, Z., Schilling, R., Munch, J. C., Schloter, M., Sharma, S., et al. (2006). Influence of Freeze-Thaw Stress on the Structure and Function of Microbial Communities and Denitrifying Populations in Soil †. Appl. Environ. Microbiol. 72 (3), 2148–2154. doi:10.1128/AEM.72.3.214810.1128/aem.72.3.2148-2154.2006
Sulkava, P., and Huhta, V. (2003). Effects of Hard Frost and Freeze-Thaw Cycles on Decomposer Communities and N Mineralisation in Boreal Forest Soil. Appl. Soil Ecol. 22, 225–239. doi:10.1016/s0929-1393(02)00155-5
Tucker, C. L., Young, J. M., Williams, D. G., and Ogle, K. (2014). Process-based Isotope Partitioning of Winter Soil Respiration in a Subalpine Ecosystem Reveals Importance of Rhizospheric Respiration. Biogeochemistry 121 (2), 389–408. doi:10.1007/s10533-014-0008-9
Wagner-riddle, C., Furon, A., Mclaughlin, N. L., Lee, I., Barbeau, J., Jayasundara, S., et al. (2007). Intensive Measurement of Nitrous Oxide Emissions from a Corn?soybean?wheat Rotation under Two Contrasting Management Systems over 5 Years. Glob. Change Biol. 13 (8), 1722–1736. doi:10.1111/j.1365-2486.2007.01388.x
Walker, V. K., Palmer, G. R., and Voordouw, G. (2006). Freeze-thaw Tolerance and Clues to the Winter Survival of a Soil Community. Appl. Environ. Microbiol. 72, 1784–1792. doi:10.1128/AEM.72.3.1784-1792.2006
Walters, W., Hyde, E. R., Berg-Lyons, D., Ackermann, G., Humphrey, G., Parada, A., et al. (2016). Improved Bacterial 16S rRNA Gene (V4 and V4-5) and Fungal Internal Transcribed Spacer Marker Gene Primers for Microbial Community Surveys. mSystems 1 (1). doi:10.1128/msystems.00009-15
Wei, R., Hui, C., Zhang, Y., Jiang, H., Zhao, Y., and Du, L. (2021). Nitrogen Removal Characteristics and Predicted Conversion Pathways of a Heterotrophic Nitrification-Aerobic Denitrification Bacterium, Pseudomonas aeruginosa P-1. Environ. Sci. Pollut. Res. 28 (6), 7503–7514. doi:10.1007/s11356-020-11066-7
Wickham, H., François, R., Henry, L., and Müller, K. (2021). Dplyr: A Grammar of Data Manipulation. Available at: https://github.com/tidyverse/dplyr (Accessed March 17, 2022).
Wickham, H. (2016). ggplot2: Elegant Graphics for Data Analysis. New York: Springer-Verlag. Available at: https://ggplot2.tidyverse.org (Accessed March 17, 2022).
Yanai, Y., Hirota, T., Iwata, Y., Nemoto, M., Nagata, O., and Koga, N. (2011). Accumulation of Nitrous Oxide and Depletion of Oxygen in Seasonally Frozen Soils in Northern Japan - Snow Cover Manipulation Experiments. Soil Biol. Biochem. 43 (9), 1779–1786. doi:10.1016/j.soilbio.2010.06.009
Yanai, Y., Toyota, K., and Okazaki, M. (2004). Effects of Successive Soil Freeze-Thaw Cycles on Soil Microbial Biomass and Organic Matter Decomposition Potential of Soils. Soil Sci. Plant Nutr. 50 (6), 821–829. doi:10.1080/00380768.2004.10408542
Yuan, M. M., Zhang, J., Xue, K., Wu, L., Deng, Y., Deng, J., et al. (2018). Microbial Functional Diversity Covaries with Permafrost Thaw‐induced Environmental Heterogeneity in Tundra Soil. Glob. Change Biol. 24 (1), 297–307. doi:10.1111/gcb.13820
Zhang, T. (2005). Influence of the Seasonal Snow Cover on the Ground Thermal Regime: An Overview. Rev. Geophys. 43 (4). doi:10.1029/2004RG000157
Keywords: soil microbiome, fertlizers, freeze-thaw (F/T) cycle, soil microbial ecology, nutrient stress
Citation: Jensen G, Krogstad K, Rezanezhad F and Hug LA (2022) Microbial Community Compositional Stability in Agricultural Soils During Freeze-Thaw and Fertilizer Stress. Front. Environ. Sci. 10:908568. doi: 10.3389/fenvs.2022.908568
Received: 30 March 2022; Accepted: 22 June 2022;
Published: 12 July 2022.
Edited by:
Sina M. Adl, University of Saskatchewan, CanadaReviewed by:
Sarah L. Strauss, University of Florida, United StatesYang Li, Anhui University of Science and Technology, China
Copyright © 2022 Jensen, Krogstad, Rezanezhad and Hug. This is an open-access article distributed under the terms of the Creative Commons Attribution License (CC BY). The use, distribution or reproduction in other forums is permitted, provided the original author(s) and the copyright owner(s) are credited and that the original publication in this journal is cited, in accordance with accepted academic practice. No use, distribution or reproduction is permitted which does not comply with these terms.
*Correspondence: Laura A. Hug, laura.hug@uwaterloo.ca