The dynamics of mature and emerging freshwater conservation programs
 Thomas M. Neeson
 Sean M. Wineland
 Erin Phillips
 Jonathan McFadden
- 1Dept. of Geography and Environmental Sustainability, University of Oklahoma, Norman, OK, United States
- 2Dept. of Economics, University of Oklahoma, Norman, OK, United States
Conservation programs range from small, place-based initiatives to large, bureaucracy-heavy systems. The dynamics of these programs vary greatly. New initiatives may experience exponential growth, but participation and spending in mature programs may rise and fall in response to a number of factors. Here, we analyze historical patterns of participation and spending across five freshwater conservation programs in the United States. Our analysis highlights fundamental differences between emerging programs, which may experience exponential or logistic growth, and mature programs with slower growth, in which changes in participation may be driven by a number of internal and exogenous factors. We propose that changes in the number and spatial distribution of conservation projects are associated with four key factors: changes in legislation that open new funding streams; shifting priorities of actors; changes in the policies or management of a program that align it with new funding opportunities; and increases in individuals’ willingness to participate in a program as it grows. These programmatic shifts represent windows of opportunity for strategically reorienting conservation programs to leverage newly-available resources. Given that large, mature conservation programs support biodiversity and ecosystem services worldwide, comparison of their dynamics with those of emerging programs may reveal key opportunities for maximizing the benefits of investments in these programs.
1 Introduction
Conservation programs and policies protect biodiversity and ecosystem services worldwide (Wilson et al., 2006). These initiatives are exceptionally diverse: They range from small, place-based non-governmental organizations and programs (e.g., local watershed groups; Koontz and Johnson, 2004; Koehler and Koontz 2008) to large, federally-mandated bureaucratic programs (Morefield et al., 2016) to multinational programs administered by global nonprofit organizations (Halpern et al., 2006). Despite the number, extent, and global distribution of these conservation initiatives, there is widespread recognition that current conservation efforts are inadequate to bend the curve on biodiversity loss (Butchart et al., 2015; Mace et al., 2018; Tickner et al., 2020). Indeed, meeting global conservation goals will require both greater allocation of resources to conservation initiatives and better return-on-investment from these resources (Waldron et al., 2013; Rabotyagov et al., 2014; Nicholson et al., 2019; Pienkowski et al., 2021).
Given the need for global conservation efforts to grow and become more cost-effective, there is increasing interest in understanding the dynamics of conservation programs. Broadly defined, this area of research seeks to understand how the budgets and spending of programs vary over time (Stubbs, 2014), how individuals’ participation in conservation initiatives varies over time (Schaible et al., 2015; McCann and Claassen 2016; Dehgan and Hoffman 2017; Romero-de-Diego et al., 2021), and how conservation practitioners do or might make decisions about how to allocate program resources (Pullin et al., 2004; Ribaudo et al., 2008; Hansen et al., 2015). Contributions to this area have come from many disciplines, including ecology (Addison et al., 2013), economics (Ferraro and Pattanayak 2006; Miao et al., 2016), social network science (Rogers 2003), and systems engineering (Guo et al., 2019; Farzaneh et al., 2021). Often these contributions offer complementary perspectives (Mascia and Mills 2018).
Continuing to improve our understanding of the dynamics of conservation programs would bring three benefits. First, strategic decisions about the design, structure and implementation of conservation programs could be improved by better understanding why some conservation initiatives go to scale. While some conservation programs rapidly grow in size and participants, most fail to spread beyond a small number of early projects and adopters (Mills et al., 2019). Better identification of the factors that contribute to program growth would enable conservation practitioners to more efficiently target program design. Second, a better understanding of how program participation, budget, and spending might vary over time could allow conservation actors to improve the cost-effectiveness and return-on-investment of programs, which can vary dramatically (Feather et al., 1999; Kirwan et al., 2005; Boyd et al., 2015). For example, resources spent as a single lump sum are often more cost-effective than smaller annual appropriations, largely because it becomes possible to invest in high-cost, high-reward projects (Neeson et al., 2015). Thus, the ability to anticipate changes in funding availability would enable program managers to strategically plan for investments in costly high-reward projects. Third, individuals’ decisions to participate in conservation programs can depend in complex ways on the behaviors of others in their community (Ward and Pulido-Velazquez 2008; Muradian 2013; Segerson 2013). Improved understanding of how program success depends on the social context of its implementation would enable program managers to identify locations where participation is likely to be high and grow over time.
We focus on two research gaps in the study of conservation programs. First, there is a disconnect in the literature between studies of the dynamics of emerging programs (e.g., Mills et al., 2019) and the dynamics of mature, bureaucratic programs (Lambert et al., 2007; Schaible et al., 2015). Studies on new and emerging programs have largely focused on how these initiatives become established and go to scale. Mature programs, in contrast, are already large and may be sustained by government policies or programs in which appropriations fluctuate over time (Hardy and Koontz 2008). In some cases, programs may not even seek to maximize conservation benefits directly, instead focusing on proxies (e.g., land area enrolled; Ribaudo 1989). Thus, the commonalities and differences between mature and emerging conservation programs are not well understood. Second, freshwater conservation programs have received less attention than marine and terrestrial programs, despite freshwater biodiversity declining more rapidly than marine and terrestrial biodiversity (Dudgeon et al., 2006; Strayer and Dudgeon 2010). Given that the spatial structure of river networks may tightly constrain spatial relationships among projects, participants and programs (Milt et al., 2017; Zamani Sabzi et al., 2019), the spatial and temporal dynamics of conservation programs in and around river networks may exhibit key differences from those in marine and terrestrial environments.
Here, we quantify historical patterns of participation and spending in five nationwide freshwater conservation programs in the United States: projects funded by the US Department of Agriculture’s Resources Conservation Act (RCA), the US Environmental Protection Agency’s (USEPA) Section 319 (S319) program, the US Department of the Interior’s Surface Mining Control and Reclamation Act (SMCRA), The Nature Conservancy’s Sustainable Rivers Program (SRP), and the American Rivers (AR) data on dam removals across the United States. Collectively, these five programs represent key dimensions of variability among conservation programs: they include large, federally-administered programs (RCA, SMCRA, S319) and programs that are administered by nonprofit organizations (AR, SRP); and both programs that are growing (AR, SMCRA) and mature programs in which program size fluctuates over time (SRP, S319, and RCA). Given that these programs are also diverse in their goals and the types of projects they fund, our analysis reflects the wide variability that exists among conservation programs and policies (Kareiva and Marvier 2012).
2 Materials and methods
For each of the five conservation programs, we quantified nation-wide temporal trends and the spatial distribution of participation and/or spending among states. Following our quantification of participation and spending in these programs, we hypothesize key factors that are associated with changes in program participation and spending. Here, we describe the data aggregation, processing, and analysis undertaken for each of the five conservation programs. Table 1 summarizes available data sources.
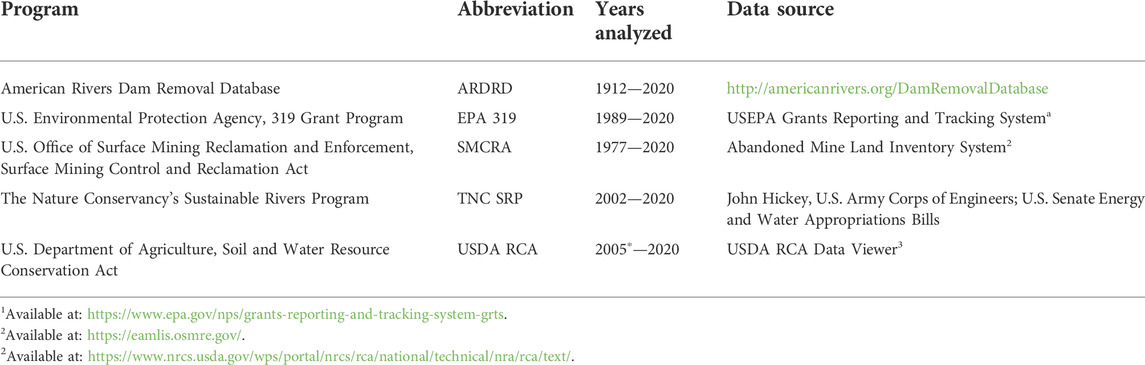
TABLE 1. Summary of data availability and data sources for the five conservation programs analyzed. The USDA RCA program began in 1977, but program data were available only for the period 2005 to 2020.
2.1 U.S. Dept. of Agriculture, Soil and Water Resources Conservation Act
The U.S. Dept. of Agriculture’s (USDA) Soil and Water Resources Conservation Act of 1977 (RCA) ensures that the USDA programs provide for the “conservation, protection, and enhancement of the Nation’s soil, water, and related resources for sustained use” (USDA-NRCS 2021). Among other actions, the RCA “develops a national soil and water conservation program to give direction to USDA soil and water conservation activities.” The RCA supports a range of different programs, including the USDA Conservation Reserve Program (CRP), the largest voluntary conservation program in the world (Stubbs, 2014) and a main federal tool for controlling nonpoint sources of water pollution (Tietenberg and Lewis 2020).
At a national level, data on conservation practices were available for the fiscal years 2005–2020 (USDA-NRCS 2021). To determine which projects may have benefited freshwater ecosystems, we focused on USDA’s practice-associated “performance measure”, i.e., the USDA’s classification of the primary benefit of the conservation practice. We focused on conservation practices that benefited one of four measures: Fish and Wildlife Habitat, Water Quality, Irrigation Efficiency, and Wetlands. Due to the broad definitions of the USDA performance measures, our list of conservation projects likely includes some projects that had minimal impact on freshwater ecosystems (e.g., investments in irrigation efficiency that did not result in a net increase in water availability for freshwater ecosystems; Grafton et al., 2018) or were primarily terrestrial (e.g., wildlife habitat). More detailed selection of projects (e.g., by filtering based on one of hundreds of USDA practice codes) was beyond the scope of this study.
The resulting data set includes information on conservation actions by year and by state in units of acres (1 acre = 0.405 ha) and practice counts. Practice counts are reported as the total number of practices applied in each state in each fiscal year (USDA-NRCS 2021). Acres represent land unit acres in which program practices were applied in each fiscal year. As per USDA rules, land unit acres are counted once for each RCA conservation program in which one or more practices were applied. Thus, if a land unit acre has been enrolled in multiple conservation programs in a given fiscal year, it will be counted multiple times. For each fiscal year, we quantified the number of conservation projects (i.e., practice counts) in USDA RCA programs nationally and in each state.
2.2 U.S. Dept. of Interior, Surface Mining Control and Reclamation Act
The US Department of the Interior’s Surface Mining Control and Reclamation Act (SMCRA) of 1977 created the Abandoned Mine Land (AML) fund to pay for the cleanup of lands impacted by surface coal mining. Initially, the AML fund was only appropriated to deal with coal mines already abandoned prior to SMCRA’s passage in 1977. However, the program was later amended in 1990 to allow funds to be spent on the reclamation of mines abandoned after 1977 (Yonk et al., 2019). The fund, which expired on 30 September 2021, was recently extended to collect fees through 30 September 2034 and revised in accordance with the Infrastructure and Jobs Act of 2021, which also added $11.293 billion USD in new funding for reclamation projects (OSMRE, 2022a). The fund is currently financed by a tax of 22.4 cents per ton (i.e., per 0.907 metric ton) for surface mined coal, 9.6 cents per ton for coal mined underground, and 6.4 cents per ton for lignite. Reclamation project funds can only be distributed to “primacy states”, or states that establish a state regulatory program that meet federal standards set by SMCRA’s Office of Surface Mining Reclamation and Enforcement (OSMRE) and that is approved by the Secretary of the Interior. This cooperative federalism approach means that states that do not achieve primacy instead have programs managed directly by the OSMRE. Moreover, the OSMRE directly regulates all surface coal mining and reclamation operations on tribal lands, with tribal input and assistance. Currently, 24 states have primacy with an established state regulatory program, while Tennessee is the only state without primacy and active coal mining; therefore the OSMRE manages the state’s surface mining and reclamation activities (OSMRE 2022b).
We downloaded AML project data from the e-AMLIS (Abandoned Mine Land Inventory System) online database (Table 1). This database is a national inventory of self-reported AML projects by states and tribal nations managing their own programs under SMCRA, or by the OSMRE office responsible for non-primacy entities. The database is listed as “not a comprehensive database of all AML features or all AML grant activities”, because it is dynamic - entities frequently update project statuses. Projects listed in the e-AMLIS database have 3 cost categories: 1) unfunded costs, which represent pre-construction estimates, 2) funded costs, which represent currently approved construction costs and are subject to change, and 3) completed costs, which represent the actual cost of construction upon project completion (e-AMLIS manual, 2012). We summarized completed costs to best represent actual money spent on AML reclamation projects that impact freshwater ecosystems, but recognize that not all projects in this database are completed. We consider eight relevant issues (“problem types”) identified by OSMRE which represent categories of problems that can be caused by abandoned mine lands defined in the e-AMLIS manual: clogged stream lands and streams; hazardous water bodies; polluted water for agricultural, industrial, or human use; slurry, and water problems and supplies. At the national level, we summarized the number of projects and the cumulative project costs over time. We also quantified the number of projects and cumulative projects costs in four specific states (Pennsylvania, West Virginia, Illinois, and Wyoming). We chose to focus on Illinois and Wyoming because they are the only two states that have gained and then lost primacy; and we chose to focus on West Virginia and Pennsylvania as two examples of states that have shifted their problem type priorities over time.
2.3 U.S. Environmental Protection Agency, Clean Water Act Section 319
Section 319 of the 1987 amendment to the United States’ Clean Water Act establishes a national management program for nonpoint source water quality impacts (USEPA 2022). Under Section 319, funds are provided to state and tribal agencies to implement management programs for nonpoint source pollution. Participation is entirely voluntary, and states and tribes that wish to access Section 319 funds must submit their proposed program plans to the USEPA. If approved, USEPA awards the funds to the state or tribal agency, with the distribution of funds among states determined by a national formula that the USEPA has developed in consultation with the states. States and tribes may use Section 319 funds for a variety of conservation programs, including “technical assistance, financial assistance, education, training, technology transfer, demonstration projects, and regulatory programs.” (USEPA 2022). Between 2006 and 2015, the program has funded projects that have restored nearly 10,000 km of streams and more than 66,000 ha of lakes (USEPA 2016). Overall, changes in the total amount of funding distributed in a year are determined by federal appropriations to the USEPA program. Changes in the total amount of funding allocated to a state and the number of projects implemented in a state may be driven by a combination of USEPA’s formula for allocating funds across states and each states’ internal priorities for the type and number of projects they prioritize for funding.
We downloaded all section 319 data available from the USEPA Grants Reporting and Tracking System (Table 1). Data were available for the years 1989–2020. Although Section 319 funds are allocated to both states and tribes, we restricted our analysis to data allocated to states due to incomplete data on tribal appropriations. We calculated the total number of projects over time nationwide, and changes in spending and project number among states over time.
2.4 The Nature Conservancy’s Sustainable Rivers Program
The Sustainable Rivers Program (SRP) is a partnership between the U.S. Army Corps of Engineers (USACE) and The Nature Conservancy (TNC) that aims to modify dam management strategies to provide environmental flows (e-flows), defined as “the quantity, timing, and quality of freshwater flows and levels necessary to sustain aquatic ecosystems which, in turn, support human cultures, economies, sustainable livelihoods, and well-being” (Warner et al., 2014; Arthington et al., 2018). Each dam operated by the USACE has specific purposes authorized by Congress and operates under a water control manual that guides water management decisions. The SRP seeks to implement environmental flows while also maintaining or enhancing other dam purposes, all while minimizing changes to the water control manual (USACE, 2021). The SRP is the largest effort in the contiguous U.S to implement e-flows through dam re-operation. While the USACE operates only 6% of the roughly 92,000 dams in the contiguous U.S. (NID 2022), this program has successfully implemented e-flows at large dams on mainstem rivers, impacting aquatic flows across more than 3,500 river km.
SRP project sites typically go through four phases: 1) proposal, 2) advancement, 3) implementation, and 4) incorporation. A proposed-phase site indicates an expression of interest from staff or stakeholders to participate in the program, usually followed by a budget proposal. An advanced-phase site indicates that an environmental strategy is being developed, which is typically comprised of a review of the state of the science, review of flow-ecology relationships, virtual testing and modeling, and a stakeholder workshop. An implement-phase site indicates that following testing and modeling in the advanced phase, e-flows are implemented as part of the dam operations at the site. An incorporate-phase site indicates that the e-flows framework is officially incorporated into the water control manual within its operational flexibility (Hickey, 2021).
We examined SRP site participation and budget allocation over time nationally. We obtained site participation data from USACE and focused on sites in the “implement” or “incorporate” phase, as these represent sites where e-flows have been operationalized. We obtained budget allocation data by examining U.S. Senate Energy and Water Appropriations Bill reports for fiscal years 2017–2021. The SRP was initiated in 2002 but was not part of the USACE budget until 2017 when it was authorized under section 216 of the Rivers and Harbors and Flood Control Acts of 1970 within the Operation and Maintenance budget appropriation. We also cross-checked the budget recommendations of the Senate reports with the actual allocation reported in the USACE Civil Works Fiscal Year 2021 Budget Justification Report (USACE, 2021).
2.5 Dam removals
Over the past century, a range of government and non-governmental organizations have collectively removed nearly 2,000 dams across the United States (American Rivers, 2022). We analyzed a database of dam removals compiled by American Rivers, a non-profit organization that advocates for river restoration and catalogs restoration efforts by other conservation actors. The American Rivers database aims to include all dam removals that meet two criteria: 1) the dam was not subsequently rebuilt in the same location after removal, and 2) removal was the result of human actions. Completed dam removal projects may be inadvertently omitted from the American Rivers database in cases where a small project was not well publicized. Nevertheless, the American Rivers database is widely considered to be the most authoritative data set on dam removals in the United States (Bellmore et al., 2017). As with the other conservation programs, we analyzed the total number of dam removals nationally over time, and how the number of dam removals varied among states and among years.
3 Results and discussion
3.1 U.S. Dept. of Agriculture, Soil and Water Resources Conservation Act
At a national level, practice counts in RCA programs have fluctuated over time: they climbed from 2005 to 2007, steadily decreased from 2008 to 2015, and climbed again from 2016 to 2020 (Figure 1, Figure 2A). These fluctuations in the total number of practice counts are mirrored across the two largest measures (Water Quality, and Fish and Wildlife Habitat; Figure 2). These changes in practice counts have occurred despite little change in funding to RCA-based programs: federal appropriations grew in 2007 and 2008 but have mostly held constant since then (McFadden and Hoppe 2017). Indeed, we did not find a significant correlation between practice counts and funding at the national level (p > 0.05).
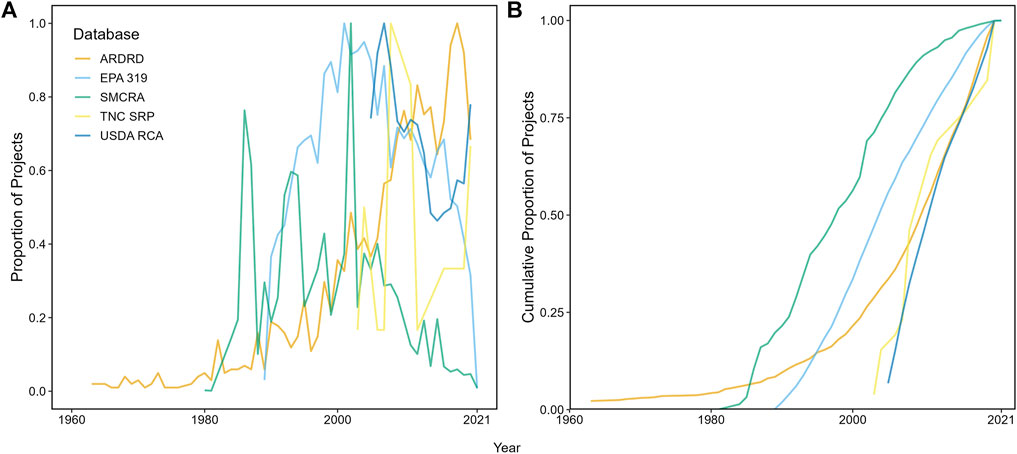
FIGURE 1. Changes in the number of conservation projects over time in five major freshwater conservation programs. (A) gives the number of projects per year in each program, normalized by the maximum number of projects observed in any year in that program. (B) gives the cumulative proportion of projects in each program over time. Program abbreviations match those in Table 1.
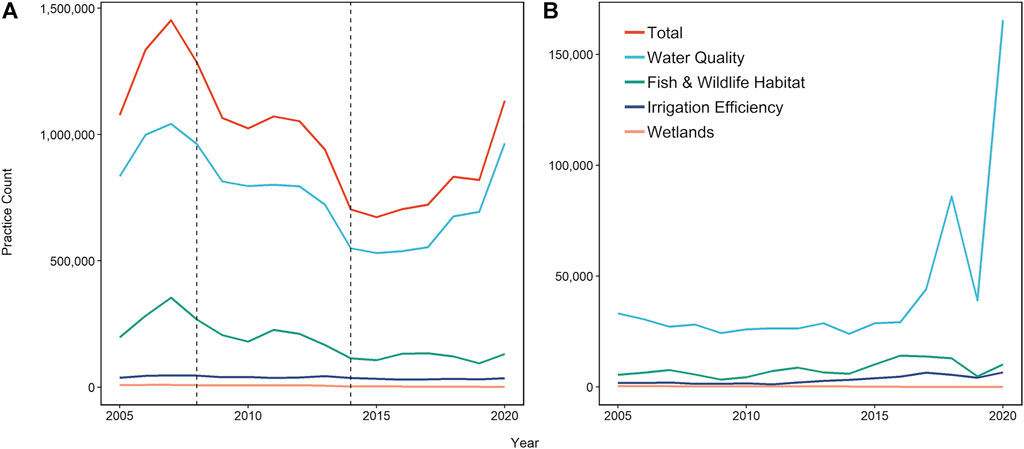
FIGURE 2. Changes in the number of projects (i.e., practice counts) in USDA RCA programs over time. Panel (A) gives the practice count by year for all practices combined (red line) and for each performance measure individually. Dashed vertical lines denote the 2008 and 2014 USDA Farm Bills, legislative events that restructured RCA payment schemes. Panel (B) gives the same data for the state of Mississippi.
Two major legislative changes to the program occurred during the time period under analysis. The 2008 Farm Bill introduced alternatives to certain countercyclical payment programs to farmers, initiated the Grassland Reserve Program, and began the Conservation Stewardship Program. The 2014 Farm Bill ended “direct” (fixed) payments to farmers of grains and other field crops; rendered permanent four disaster relief programs that were formerly instituted on an ad hoc basis; lowered the bid cap for the Conservation Reserve Program (CRP); and introduced additional payment programs, with changes to funding formulas in other areas (Hellerstein 2017; USDA-ERS 2019a). However, direct changes in program spending from these pieces of legislation are difficult to trace, because substantial amounts of conservation-related funding are allocated across multiple years via contracts with landowners, and there is little pressure on USDA decisionmakers to get money out the door by the end of the fiscal year (Orden and Zulauf 2015; Claassen 2021). Thus, changes stemming from the 2008 and 2014 farm bills may have materialized over several years (McFadden and Hoppe 2017).
Fluctuations in the number of projects within each state over time did not mirror national trends (Figure 3) and are instead associated with changes in each state’s funding priorities and appropriations from the federal government (McFadden and Hoppe 2017; Claassen 2021). Across various national programs, the Natural Resources Conservation Service (NRCS) allocates money to states via a wide array of processes, with individual eligibility criteria, acreage constraints, and other policy parameters that can vary among years (USDA-ERS 2019b). Moreover, enrollment mechanisms for certain programs rely on economically complex processes that may not be fully transparent to all stakeholders (e.g., Hellerstein 2017). For example, the large growth in Mississippi’s practice counts from 2015 to 2020 (Figure 3) largely reflects more investments in water quality projects (Figure 2B), rather than an uptick in across-the-board spending. Indeed, emphasis on various conservation practices within RCA programs has dropped considerably, though spending on cover crops has been one recent, prominent exception (Claassen 2021; Wallander et al., 2021).
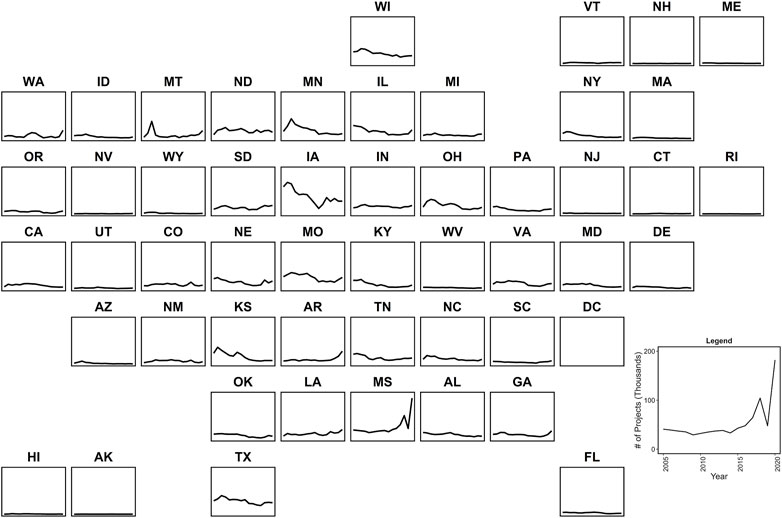
FIGURE 3. Changes in the spatial distribution of projects (i.e., practice counts) in USDA RCA programs among states over time. The inset legend (bottom right) describes the axes used for all state plots, and uses data from the state of Mississippi (MS) as an example. State abbreviations follow ANSI two-letter codes and are arranged in each state’s approximate geographic location.
3.2 U.S. Dept. of Interior, Surface Mining Control and Reclamation Act
At the national level, AML reclamation projects grew rapidly in the mid 1980s, with an initial push for fixing clogged stream lands and streams, water problems, and hazardous waterbodies that continued to comprise most projects in the program to the present day (Figure 4A). Clogged streams represent any filling of a streambed, while clogged stream lands represent any AML related surface features that could be eroded and cause a clogged stream. Water problems represent any water leaving the AML causing environmental impacts because of pH, sediment load, or other pollutants, and hazardous waterbodies represent impounded water near populated areas or roads that is considered a nuisance. Despite these problem types comprising most projects, the cumulative costs of projects aimed to fix polluted water for human consumption far out cost clogged stream lands starting in the mid 2000’s (Figure 4B).
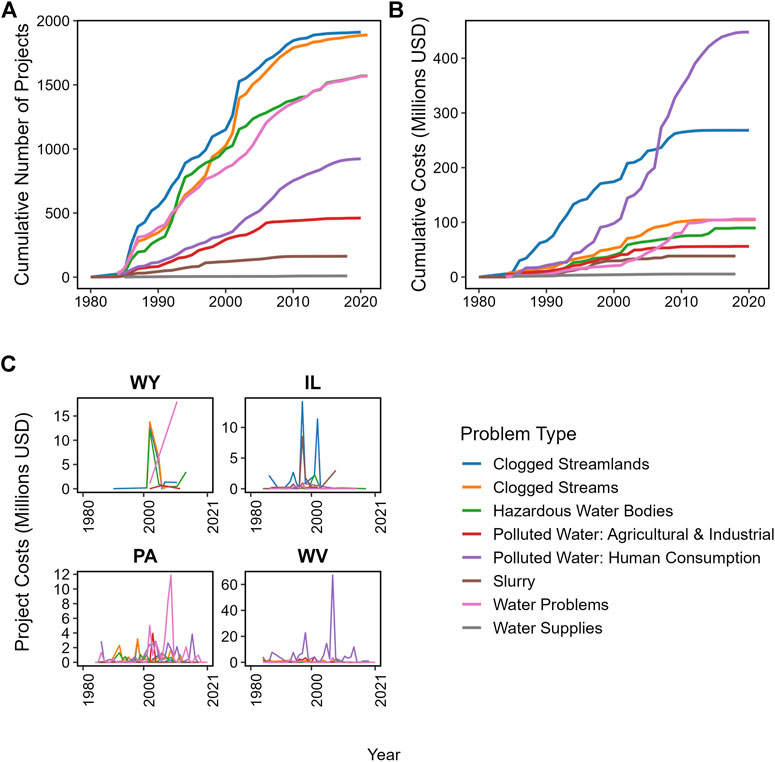
FIGURE 4. Changes in the number of projects and project costs over time under the Surface Mining Control and Reclamation Act (SMCRA). (A) gives the cumulative number of projects over time by problem type, (B) gives cumulative costs over time by problem type, and (C) gives project costs over time by problem type for the states of Wyoming (WY), Illinois (IL), Pennsylvania (PA), and West Virginia (WV).
At the state level, project costs over time highlight short term factors that may drive changes in program participation. For example, when Wyoming and Illinois revised their state programs in the late 1990s and early 2000s, this opened up funding for them to tackle the unique problem types presented by AML in their states (Illinois, 1997; OSMRE, 2000; OSMRE, 2002; Figure 4C). Similarly, when West Virginia updated their state program in 2006 and 2014 to conform to federal standards, this opened up funding for projects focused on fixing polluted water for human consumption (OSMRE 2006; OSMRE 2014; Figure 4C). Pennsylvania’s (PA) project costs by problem type over time indicate shifting problem type priorities over time that are largely driven by the sheer number of AML in the state and the various problems they caused. However, when Congress renewed the AML fund in 2006 (Yonk et al., 2019), PA allocated these funds to address a large water problem project on the Susquehanna River (Figure 4C). Overall, Figure 4C illustrates significant spatial variation in how AML funds are spent on different problem types in different states. These variations are largely driven by long-term factors like how much surface mining occurred in the state, the method used to mine, and the unique local physiographic and social setting of the AML.
3.3 U.S. Environmental Protection Agency, Clean Water Act Section 319
At a national level, spending in the program fluctuates over time in a way that is largely driven by Congressional appropriations (Figure 1), and the total number of projects in a year is highly correlated with funding (Pearson’s r = 0.85, p < 1
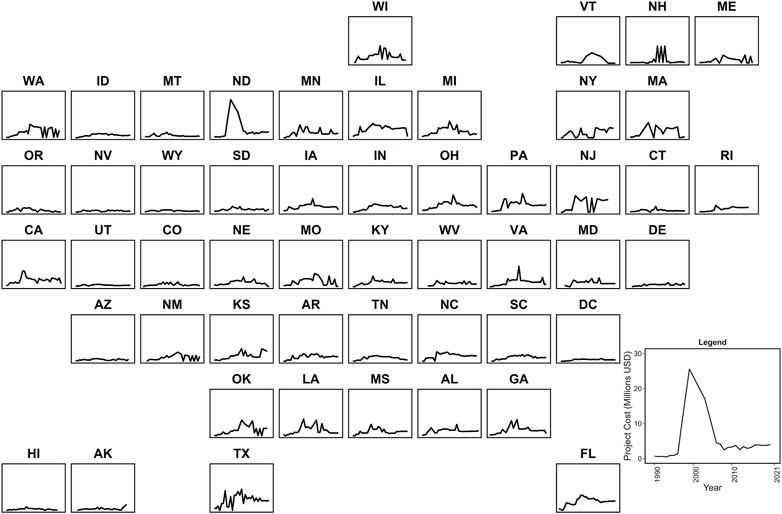
FIGURE 5. Changes in the spatial distribution of spending in the USEPA 319 program among states over time. The inset legend (bottom right) describes the axes used for all state plots, and uses data from the state of North Dakota (ND) as an example. State abbreviations follow ANSI two-letter codes and are arranged in each state’s approximate geographic location.
3.4 The Nature Conservancy’s Sustainable Rivers Program
Our analysis of SRP participation and budget allocation over time revealed a steady participation and implementation rate since the program’s inception in 2002, and an obvious interest in increasing the program’s reach through a hefty budget increase in FY2020 (Figures 6A,B). The SRP currently has 26 out of 312 (8%) dams operated by the USACE in either the “implement” or “incorporate” phase (Figure 6A), with an additional 103 (33%) and 78 (25%) dams currently in the “propose” or “advance” phase (Hickey, 2021). The 26 sites (i.e., dams) where e-flows are currently operationalized are spread out across more than 3,500 river km among 15 different rivers or “projects”, where multiple dams were incorporated at once (Figure 6C). These rivers span a wide area geographically across the contiguous U.S., in the states of Kentucky, South Carolina, Georgia, Arizona, Texas, Oregon, West Virginia, Virginia, Iowa, Illinois, Missouri, Pennsylvania, and North Carolina. Participation has grown linearly over time (Figure 6A). SRP budget allocation indicates steady financing of around $400,000 USD for FY2017, FY2018, and FY2019, with a sharp budget increase to $4,950,000 USD in FY2020 and then $5,000,000 USD in FY2021 (Figure 6B).
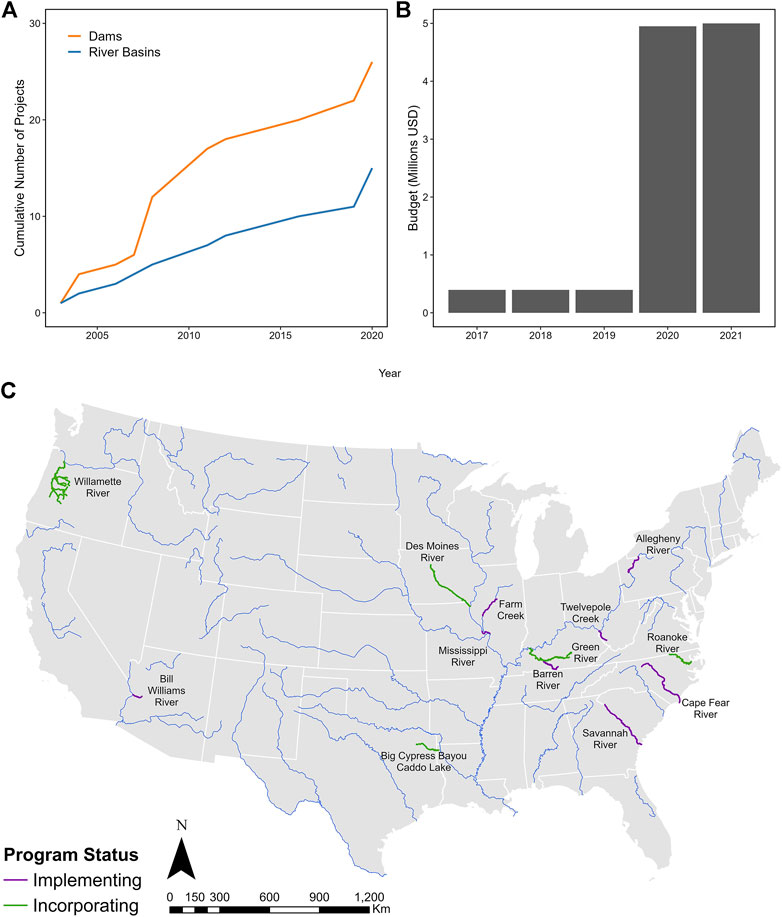
FIGURE 6. Changes in the number of projects and spending in the Sustainable Rivers Program (SRP) over time. Panel (A) shows the cumulative number of projects over time split by the number of individual dams enrolled in the program and the number of river basins the project has been implemented in. Panel (B) shows the budget of the program over time. Panel (C) shows a map of river reaches that have been impacted by participation in the Sustainable Rivers Program (SRP).
With many sites currently in both the “propose” and “advance” phase, the program is expected to continue to garner interest and grow. For example, budget requests filled out in FY2021 amounted to over $5.6 million USD from 23 sites that would amount to almost 10,000 additional river miles with e-flows operationalized (Hickey, 2021). Additionally, the program has the potential to expand beyond traditional hydropower and flood control dams to locks and dams and dry dams. This would allow river systems that have been essentially transformed from lotic, flowing systems to a series of lentic pools to re-operationalize management strategies to incorporate e-flows. Overall, the SRP has grown significantly since the program’s inception and highlights a unique federal-NGO partnership that has successfully implemented e-flows in river basins across the contiguous U.S.
3.5 Dam removals
Dam removals in the United States have grown exponentially over time (Figure 1). The year 1912 marked the first recorded removal (the Marquette Dam in Michigan), and the frequency of removals remained low until the 1980s. During the period 1912–1980, the most dams removed in 1 year was six—in 1950. After the 1980s, there was a rapid uptick, with more removals in each succeeding year than in the previous year. In 2018, just over 100 dams were removed.
While dam removals nationwide have grown exponentially, there is considerable variation among states in the number and timing of removals (Figure 7). Though Michigan was the first state with a recorded dam removal, its yearly and total removals have remained low in comparison to other states. This is especially apparent when looking at states such as Pennsylvania, which can be considered an outlier. Not only did Pennsylvania have an early start, with the first recorded dam removal occurring in 1916, but the state has also experienced the most removals (345). This is nearly twice the number of removals (177) for the second-highest state, California, which has also experienced the greatest number of removals per year (36 dams, 2018). By contrast, states such as North Dakota and Montana have only recorded 2 dam removals, while Kansas, Louisiana, Mississippi, and Oklahoma have recorded zero.
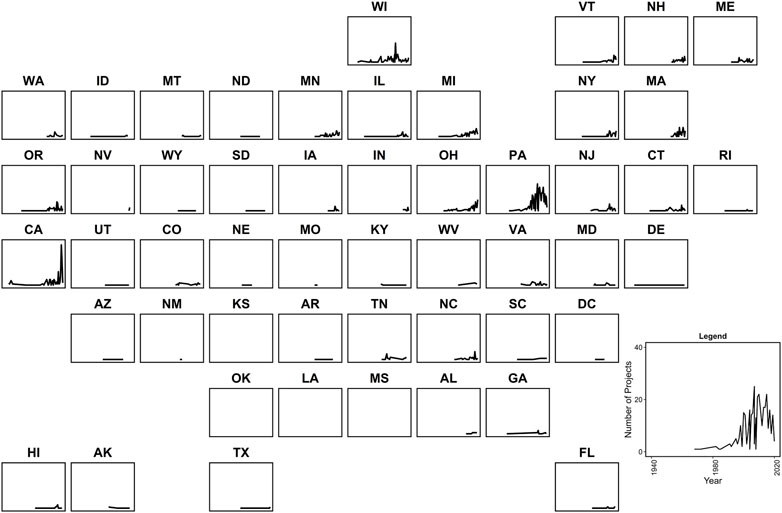
FIGURE 7. Changes in the number of dam removals among states over time, as recorded in the American Rivers dam removal database. The inset legend (bottom right) describes the axes used for all state plots, and uses data from the state of Pennsylvania (PA) as an example. State abbreviations follow ANSI two-letter codes and are arranged in each state’s approximate geographic location.
The exponential growth in dam removals is associated with growing acknowledgement that the benefits of dam removal often outweigh the benefits of keeping dams in place (American Rivers 2022). The removal of the Edwards dam in the Kennebec River, Maine, in 1999 was a turning point: it was the first time that the United States Federal Energy Regulatory Commission ordered a dam removal primarily based on the environmental benefits it would bring (Crane 2009). Following that project, there has been growing recognition of the high costs of keeping some dams in place (e.g., due to the costs of managing aging infrastructure; Doyle and Havlick 2009; Neeson et al., 2018) and the environmental benefits of removing dams (Stanley and Doyle 2003).
3.6 Synthesis and opportunities
Across the five conservation programs evaluated here, we propose that shifts in the number and spatial distribution of conservation projects may be driven by four key factors: 1) large-scale changes in the availability of conservation resources and funding (e.g., changing federal appropriations); 2) shifting priorities of on-the-ground or state-level actors; 3) sudden policy changes that align a program with new funding streams; and 4) changes in the willingness of landowners or conservation actors to participate in a program. Here, we discuss support for our hypotheses about the importance of each of these four factors, and how consideration of these four factors may allow program managers and stakeholders to strategically orient conservation programs to take full advantage of windows of opportunity.
First, we hypothesize that large shifts in overall appropriations to programs (e.g., from the United States Congress) drove patterns of overall growth in the three large federal programs examined here (USDA RCA, EPA section 319, and SMRCA). These changes in appropriations occurred both at the outset of the programs (e.g., SMRCA) and at key junctures in which the federal government redoubled their commitment to the program (e.g., the near doubling of funding to the EPA 319 program in 1999, and the recent renewal of the SMCRA that added ∼12 billion USD in funding). Given that sudden increases in funding may make high cost, high reward projects newly affordable (Neeson et al., 2015), anticipatory planning efforts to fully leverage these increases in resources are paramount. These high cost, high reward projects may include investments in infrastructure (Neeson et al., 2018), water quality and quantity (Fovargue et al., 2021), and large-scale projects in environmental remediation that would be unaffordable under piecemeal spending (e.g., the USEPA Great Lakes Restoration Initiative; Jurjonas et al., 2022). In the United States, conservation actors may anticipate that increased federal funding may be available for conservation actions related to climate change adaptation or mitigation (Wineland et al., 2021a) or infrastructure renewal projects (Sleight and Neeson 2018). Thus, conservation actors may benefit from strategic planning to identify future projects that are a high priority to be funded as soon as increases in funding materialize.
Second, we further hypothesize that changes in top-down appropriations (as discussed above) may interact with shifting priorities of state-level or on-the-ground actors to create unexpected patterns in project spending in space and time. In some cases, large jumps in state spending coincided with large changes in federal appropriations. For example, the large jump in spending on EPA section 319 funds in North Dakota in the late 1990s and early 2000s coincided with the near doubling of federal funding for the 319 program. In this example, state spending was driven by the state’s strategic decision to pursue a large-scale planning effort. In other cases, shifting state priorities may drive changes in the type of projects (e.g., water quality projects in Mississippi) that are uncorrelated with changes in federal appropriations. Given that the priorities of conservation actors may depend on their perspectives on which environmental problems are most pressing (Neeson et al., 2016; Wineland et al., 2021b), project spending may shift in unexpected ways with changes in program appropriations as managers choose among candidate projects. Landowners and other program participants may benefit from cooperation and communication with program managers regarding how best to align project proposals with program priorities.
Third, changes in state-level practices and regulations may also make federal funding newly available. The SMRCA provides numerous examples of cases in which changes to state programs allowed them to access federal funds, including the states of Wyoming (in the year 2002), Illinois (2003), and West Virginia (2014). In the case of West Virginia, for example, the state updated rules in 2014 that allowed it to conform to federal standards and allowed incentives for bond forfeiture, which then allowed large spending on polluted water projects for human consumption. The SMRCA provides the starkest examples, because updates to state regulations provided states with first-ever access to this funding stream, but many programs include a requirement for states to align projects with federal standards. Within the EPA section 319 program, for example, all state watershed plans must meet federal EPA standards to receive federal funds (EPA 2021). Within the USDA RCA program, conservation practices are highly regulated and described by several hundred specific practice codes (USDA-NRCS 2021). Across these and other programs, aligning state-level practices with federal requirements may dramatically boost available resources.
Fourth, in addition to these factors operating at the federal and state levels, willingness to participate may change over time among individual landowners or local conservation actors. Willingness to participate is a key factor in the growth of conservation initiatives worldwide (Mills et al., 2019), and may be an important driver of shifts in participation in conservation initiatives that are experiencing exponential growth (e.g., dam removals and the TNC SRP program). Although we did not have data on willingness to participate for any of the programs we explored, this factor is known to be important in large, federally run conservation programs that are voluntary (e.g., USDA RCA and EPA 319). For example, shifts in landowner willingness-to-participate in USDA RCA programs depend on internal mechanisms such as USDA’s payment levels for certain conservation practices (“bid caps”, Wallander et al., 2013), commodity prices (Stubbs 2014), and interactions with federal crop insurance programs (Miao et al., 2016). Such relationships are fully consistent with—and derive from—the fundamental law of demand in economics, i.e., demand for conservation programs adjusts in response to price changes (e.g., Lambert et al., 2007). To boost program participation, conservation actors should look for opportunities to leverage growing participation willingness and awareness of a number of restoration actions or policies, including those that support environmental flows (Wineland et al., 2021c; Sandoval-Solis et al., 2022), water conservation (Farzaneh et al., 2021), habitat restoration (Popejoy et al., 2018), invasive species management (Milt et al., 2018), fish passage and the restoration of ecosystem connectivity (Fleming and Neeson 2020; McKay et al., 2020). In particular, outreach and education efforts may offer low-cost means for increasing support for conservation programs (Wade et al., 2021). There are also likely to be important network effects as support for conservation programs grows within a community (Wineland and Neeson 2022). Furthermore, conservation organizations have long played a key role in promoting federally-funded conservation programs. In the case of the SRP, for example, The Nature Conservancy has played a central role in promoting and supporting the program both within the U.S. Army Corps of Engineers and with other community stakeholders (Konrad et al., 2012; Warner et al., 2014).
Finally, our analysis highlights fundamental differences between emerging programs (e.g., TNC SRP and dam removals), which typically experience linear, logistic or exponential growth (Mills et al., 2019), and mature programs, in which changes in participation are driven by a number of internal and exogenous factors (Stubbs 2014; Claassen 2021). Despite these differences, the willingness of landowners or other small actors to participate may be a key factor driving the growth of voluntary conservation programs of all sizes. Further comparative analysis of a wide range of established, emerging, and proposed conservation programs and policies would provide further insights into strategies for making best use of scarce conservation resources (Moody et al., 2017) and may identify key causal factors beyond the four proposed here. Given that mature, bureaucratically-administered conservation programs support biodiversity and ecosystem services worldwide, comparison of their dynamics and causal factors with those of emerging programs may reveal important windows of opportunity for maximizing the conservation benefits of investments in these programs.
Data availability statement
The datasets used for this study are available at the repositories listed in Table 1.
Author contributions
TN and SW conceived the research; all authors contributed to the collection, analysis and interpretation of the data; TN led the writing and all authors made substantial contributions to writing and editing.
Funding
SW was supported by a Nancy L. Mergler Dissertation Completion Fellowship at OU. Financial support was provided by the University of Oklahoma Libraries’ Open Access Fund.
Acknowledgments
We thank R. Claassen (USDA-NRCS), J. Fleming (Grand River Dam Authority), D. Hellerstein (UDSA-ERS), R. Iovanna (USDA-FSA), and J. Hickey (USACE) for helpful discussions on conservation programs and data.
Conflict of interest
The authors declare that the research was conducted in the absence of any commercial or financial relationships that could be construed as a potential conflict of interest.
Publisher’s note
All claims expressed in this article are solely those of the authors and do not necessarily represent those of their affiliated organizations, or those of the publisher, the editors and the reviewers. Any product that may be evaluated in this article, or claim that may be made by its manufacturer, is not guaranteed or endorsed by the publisher.
References
Addison, P. F., Rumpff, L., Bau, S. S., Carey, J. M., Chee, Y. E., Jarrad, F. C., et al. (2013). Practical solutions for making models indispensable in conservation decision‐making. Divers. Distrib. 19 (5-6), 490–502. doi:10.1111/ddi.12054
American Rivers (2022) Free rivers: The state of dam removal in the United States. Available at: https://www.americanrivers.org/wp-content/uploads/2022/02/DamList2021_Report_02172022_FINAL3.pdf
Arthington, A. H., Bhaduri, A., Bunn, S. E., Jackson, S. E., Tharme, R. E., Tickner, D., et al. (2018). The Brisbane declaration and global action agenda on environmental flows (2018). Front. Environ. Sci. 6, 45. doi:10.3389/fenvs.2018.00045
Bellmore, J., Duda, J. J., Craig, L. S., Greene, S. L., Torgersen, C. E., Collins, M. J., et al. (2017). Status and trends of dam removal research in the United States. WIREs. Water 4 (2), e1164. doi:10.1002/wat2.1164
Blue Thumb OK. Blue Thumb OK (2022). Available at: https://www.bluethumbok.com/.
Boyd, J., Epanchin-Niell, R., and Siikamäki, J. (2015). Conservation planning: A review of return on investment analysis. Rev. Environ. Econ. Policy 9, 23–42. doi:10.1093/reep/reu014
Butchart, S. H., Clarke, M., Smith, R. J., Sykes, R. E., Scharlemann, J. P., Harfoot, M., et al. (2015). Shortfalls and solutions for meeting national and global conservation area targets. Conserv. Lett. 8 (5), 329–337. doi:10.1111/conl.12158
Crane, J. (2009). “Setting the river free”: The removal of the Edwards dam and the restoration of the Kennebec River. Water Hist. 1 (2), 131–148. doi:10.1007/s12685-009-0007-2
Dehgan, A., and Hoffman, C. (2017). Addressing the problem of scale in conservation. Innov. Technol. Gov. Glob. 11 (3-4), 22–32. doi:10.1162/inov_a_00254
Doyle, M. W., and Havlick, D. G. (2009). Infrastructure and the environment. Annu. Rev. Environ. Resour. 34, 349–373. doi:10.1146/annurev.environ.022108.180216
Dudgeon, D., Arthington, A. H., Gessner, M. O., Kawabata, Z. I., Knowler, D. J., Lévêque, C., et al. (2006). Freshwater biodiversity: Importance, threats, status and conservation challenges. Biol. Rev. 81 (2), 163–182. doi:10.1017/s1464793105006950
EPA 2011. Epa 2011 Available at: https://www.epa.gov/sites/default/files/2015-09/documents/319evaluation.pdf.
Farzaneh, M. A., Rezapour, S., Fovargue, R., and Neeson, T. M. (2021). Stochastic mathematical models to balance human and environmental water needs and select the best conservation policy for drought-prone river basins. J. Clean. Prod. 291, 125230. doi:10.1016/j.jclepro.2020.125230
Feather, P. M., Hellerstein, D. R., and Hansen, L. (1999). Economic valuation of environmental benefits and the targeting of conservation programs: The case of the CRP (No. 778). ERS: US Department of Agriculture.
Ferraro, P. J., and Pattanayak, S. K. (2006). Money for nothing? A call for empirical evaluation of biodiversity conservation investments. PLoS Biol. 4 (4), e105. doi:10.1371/journal.pbio.0040105
Fleming, P., and Neeson, T. M. (2020). Effects of transportation infrastructure on fishes in the ozark and ouachita mountains. Transp. Res. Part D Transp. Environ. 86, 102451. doi:10.1016/j.trd.2020.102451
Fovargue, R. E., Rezapour, S., Rosendahl, D., Wootten, A. M., Sabzi, H. Z., Moreno, H. A., et al. (2021). Spatial planning for water sustainability projects under climate uncertainty: Balancing human and environmental water needs. Environ. Res. Lett. 16 (3), 034050. doi:10.1088/1748-9326/abdd58
Grafton, R. Q., Williams, J., Perry, C. J., Molle, F., Ringler, C., Steduto, P., et al. (2018). The paradox of irrigation efficiency. Science 361 (6404), 748–750. doi:10.1126/science.aat9314
Guo, L., Zamanisabzi, H., Neeson, T. M., Allen, J. K., and Mistree, F. (2019). Managing conflicting water resource goals and uncertainties in a dam network by exploring the solution space. J. Mech. Des. 141 (3), 031702. doi:10.1115/1.4042211
Halpern, B. S., Pyke, C. R., Fox, H. E., Chris Haney, J., Schlaepfer, M. A., and Zaradic, P. (2006). Gaps and mismatches between global conservation priorities and spending. Conserv. Biol. 20 (1), 56–64. doi:10.1111/j.1523-1739.2005.00258.x
Hansen, L., Hellerstein, D., Ribaudo, M., Williamson, J., Nulph, D., Loesch, C., et al. (2015). Targeting investments to cost effectively restore and protect wetland ecosystems: Some economic insights. Washington, DC: Economic Research Service ERR-183.
Hardy, S. D., and Koontz, T. M. (2008). Reducing nonpoint source pollution through collaboration: Policies and programs across the US states. Environ. Manag. 41 (3), 301–310. doi:10.1007/s00267-007-9038-6
Hellerstein, D. (2017). The US Conservation Reserve Program: The evolution of an enrollment mechanism. Land Use Policy 63, 601–610. doi:10.1016/j.landusepol.2015.07.017
Illinois (1997). Illinois surface coal mining land conservation and reclamation Act at 225 ILCS 720. Public Act 90-0490. Springfield, Illinois: Illinois general assembly.
Jurjonas, M., May, C. A., Cardinale, B. J., Kyriakakis, S., Pearsall, D. R., and Doran, P. J. (2022). A synthesis of the Great lakes restoration initiative according to the open standards for the practice of conservation. J. Gt. Lakes. Res. doi:10.1016/j.jglr.2022.01.008
Kareiva, P., and Marvier, M. (2012). What is conservation science? BioScience 62 (11), 962–969. doi:10.1525/bio.2012.62.11.5
Kirwan, B., Lubowski, R. N., and Roberts, M. J. (2005). How cost-effective are land retirement auctions? Estimating the difference between payments and willingness to accept in the conservation reserve program. Am. J. Agric. Econ. 87 (5), 1239–1247. doi:10.1111/j.1467-8276.2005.00813.x
Koehler, B., and Koontz, T. M. (2008). Citizen participation in collaborative watershed partnerships. Environ. Manag. 41 (2), 143–154. doi:10.1007/s00267-007-9040-z
Konrad, C. P., Warner, A., and Higgins, J. V. (2012). Evaluating dam re‐operation for freshwater conservation in the sustainable rivers project. River Res. Appl. 28 (6), 777–792. doi:10.1002/rra.1524
Koontz, T. M., and Johnson, E. M. (2004). One size does not fit all: Matching breadth of stakeholder participation to watershed group accomplishments. Policy Sci. 37 (2), 185–204. doi:10.1023/b:olic.0000048532.94150.07
Lambert, D. M., Sullivan, P., and Claassen, R. (2007). Working farm participation and acreage enrollment in the Conservation Reserve Program. J. Agric. Appl. Econ. 39 (1), 151–169. doi:10.1017/s1074070800022811
Mace, G. M., Barrett, M., Burgess, N. D., Cornell, S. E., Freeman, R., Grooten, M., et al. (2018). Aiming higher to bend the curve of biodiversity loss. Nat. Sustain. 1 (9), 448–451. doi:10.1038/s41893-018-0130-0
Mascia, M. B., and Mills, M. (2018). When conservation goes viral: The diffusion of innovative biodiversity conservation policies and practices. Conserv. Lett. 11 (3), e12442. doi:10.1111/conl.12442
McCann, L., and Claassen, R. (2016). Farmer transaction costs of participating in federal conservation programs: Magnitudes and determinants. Land Econ. 92 (2), 256–272. doi:10.3368/le.92.2.256
McFadden, J. R., and Hoppe, J. R. (2017). The evolving distribution of payments from commodity, conservation, and federal crop insurance programs. United States: U.S. Department of Agriculture, Economic Research Service.
McKay, S. K., Martin, E. H., McIntyre, P. B., Milt, A. W., Moody, A. T., and Neeson, T. M. (2020). A comparison of approaches for prioritizing removal and repair of barriers to stream connectivity. River Res. Appl. 36 (8), 1754–1761. doi:10.1002/rra.3684
Miao, R., Feng, H., Hennessy, D. A., and Du, X. (2016). Assessing cost-effectiveness of the conservation reserve program (CRP) and interactions between the CRP and crop insurance. Land Econ. 92 (4), 593–617. doi:10.3368/le.92.4.593
Mills, M., Bode, M., Mascia, M. B., Weeks, R., Gelcich, S., Dudley, N., et al. (2019). How conservation initiatives go to scale. Nat. Sustain. 2 (10), 935–940. doi:10.1038/s41893-019-0384-1
Milt, A., Diebel, M., Doran, P. J., Ferris, M. C., Herbert, M., Khoury, M., et al. (2018). Minimizing opportunity costs to aquatic connectivity restoration while controlling an invasive species. Conserv. Biol. 32, 894–904. doi:10.1111/cobi.13105
Milt, A. W., Doran, P. J., Ferris, M. C., Moody, A. T., Neeson, T. M., and McIntyre, P. B. (2017). Local‐scale benefits of river connectivity restoration planning beyond jurisdictional boundaries. River Res. Appl. 33 (5), 788–795. doi:10.1002/rra.3135
Moody, A. T., Neeson, T. M., Wangen, S., Dischler, J., Diebel, M. W., Herbert, M., et al. (2017). Pet project or best project? Online decision support tools for prioritizing barrier removals in the Great lakes and beyond. Fisheries 42, 57–65. doi:10.1080/03632415.2016.1263195
Morefield, P. E., LeDuc, S. D., Clark, C. M., and Iovanna, R. (2016). Grasslands, wetlands, and agriculture: The fate of land expiring from the conservation reserve program in the midwestern United States. Environ. Res. Lett. 11 (9), 094005. doi:10.1088/1748-9326/11/9/094005
Muradian, R. (2013). Payments for ecosystem services as incentives for collective action. Soc. Nat. Resour. 26 (10), 1155–1169. doi:10.1080/08941920.2013.820816
National Inventory of Dams. 2022. United States army Corps of Engineers. Available Online at: https://nid.usace.army.mil/#/
Neeson, T. M., Ferris, M. C., Diebel, M. W., Doran, P. J., O’Hanley, J. R., and McIntyre, P. B. (2015). Enhancing ecosystem restoration efficiency through spatial and temporal coordination. Proc. Natl. Acad. Sci. U. S. A. 112 (19), 6236–6241. doi:10.1073/pnas.1423812112
Neeson, T. M., Moody, A. T., O'Hanley, J. R., Diebel, M., Doran, P. J., Ferris, M. C., et al. (2018). Aging infrastructure creates opportunities for cost‐efficient restoration of aquatic ecosystem connectivity. Ecol. Appl. 28 (6), 1494–1502. doi:10.1002/eap.1750
Neeson, T. M., Smith, S. D. P., Allan, J. D., and McIntyre, P. B. (2016). Prioritizing ecological restoration among sites in multi-stressor landscapes. Ecol. Appl. 26, 1785–1796. doi:10.1890/15-0948.1
Nicholson, E., Fulton, E. A., Brooks, T. M., Blanchard, R., Leadley, P., Metzger, J. P., et al. (2019). Scenarios and models to support global conservation targets. Trends Ecol. Evol. 34 (1), 57–68. doi:10.1016/j.tree.2018.10.006
North Dakota Department of Health (NDDOH), (2021). North Dakota department of health (NDDOH). Available at: https://deq.nd.gov/publications/WQ/3_WM/NPS/Program/Final_NPSProgramMgmtPlan_2015-2020.pdf
Office of Surface Mining Reclamation and Enforcement. 2022a. Abandoned mine land reclamation fee. Available Online at: https://www.federalregister.gov/documents/2022/01/14/2022-00513/abandoned-mine-land-reclamation-fee
Office of Surface Mining Reclamation and Enforcement (2000). Illinois regulatory program. 30 CFR Part 913. Washington, DC: Fed. Reg.
Office of Surface Mining Reclamation and Enforcement. 2022b. Regulating active coal mines. Available Online at: https://www.osmre.gov/programs/regulating-active-coal-mines
Office of Surface Mining Reclamation and Enforcement (2006). West Virginia regulatory program, 30. Washington, DC: CFR 948.
Office of Surface Mining Reclamation and Enforcement (2014). West Virginia regulatory program, 30. Washington, DC: CFR 948.
Office of Surface Mining Reclamation and Enforcement (2002). Wyoming regulatory program. 30 CFR Part 950. Washington, DC: Fed. Reg.
Orden, D., and Zulauf, C. (2015). Political economy of the 2014 farm bill. Am. J. Agric. Econ. 97 (5), 1298–1311. doi:10.1093/ajae/aav028
Pienkowski, T., Cook, C., Verma, M., and Carrasco, L. R. (2021). Conservation cost‐effectiveness: A review of the evidence base. Conserv. Sci. Pract. 3 (5), e357. doi:10.1111/csp2.357
Popejoy, T., Randklev, C. R., Neeson, T. M., and Vaughn, C. C. (2018). Prioritizing sites for conservation based on similarity to historical baselines and feasibility of protection. Conserv. Biol. 32, 1118–1127. doi:10.1111/cobi.13128
Pullin, A. S., Knight, T. M., Stone, D. A., and Charman, K. (2004). Do conservation managers use scientific evidence to support their decision-making? Biol. Conserv. 119 (2), 245–252. doi:10.1016/j.biocon.2003.11.007
Rabotyagov, S. S., Campbell, T. D., White, M., Arnold, J. G., Atwood, J., Norfleet, M. L., et al. (2014). Cost-effective targeting of conservation investments to reduce the northern Gulf of Mexico hypoxic zone. Proc. Natl. Acad. Sci. U. S. A. 111 (52), 18530–18535. doi:10.1073/pnas.1405837111
Ribaudo, M., Hansen, L., Hellerstein, D., and Greene, C. (2008). The use of markets to increase private investment in environmental stewardship. Washington, DC: Economic Research Report.64
Ribaudo, M. O. (1989). Targeting the conservation reserve program to maximize water quality benefits. Land Econ. 65 (4), 320–332. doi:10.2307/3146800
Romero‐de‐Diego, C., Dean, A., Jagadish, A., Witt, B., Mascia, M. B., and Mills, M. (2021). Drivers of adoption and spread of wildlife management initiatives in Mexico. Conserv. Sci. Pract. 3 (7), e438. doi:10.1111/csp2.438
Sandoval-Solis, S., Paladino, S., Garza-Diaz, L. E., Nava, L. F., Friedman, J. R., Ortiz-Partida, J., et al. (2022). Environmental flows in the rio grande - rio bravo basin. Ecol. Soc. 27 (1), 20. doi:10.5751/es-12944-270120
Schaible, G. D., Mishra, A. K., Lambert, D. M., and Panterov, G. (2015). Factors influencing environmental stewardship in US agriculture: Conservation program participants vs. non-participants. Land Use Policy 46, 125–141. doi:10.1016/j.landusepol.2015.01.018
Segerson, K. (2013). Voluntary approaches to environmental protection and resource management. Annu. Rev. Resour. Econ. 5 (1), 161–180. doi:10.1146/annurev-resource-091912-151945
Sleight, N., and Neeson, T. M. (2018). Opportunities for collaboration between infrastructure agencies and conservation groups: Road-stream crossings in Oklahoma. Transp. Res. Part D Transp. Environ. 63, 622–631. doi:10.1016/j.trd.2018.07.002
Stanley, E. H., and Doyle, M. W. (2003). Trading off: The ecological effects of dam removal. Front. Ecol. Environ. 1 (1), 15–22. doi:10.1890/1540-9295(2003)001[0015:toteeo]2.0.co;2
Strayer, D. L., and Dudgeon, D. (2010). Freshwater biodiversity conservation: Recent progress and future challenges. J. North Am. Benthol. Soc. 29 (1), 344–358. doi:10.1899/08-171.1
Stubbs, M. (2014). Conservation Reserve program (CRP): Status and issues. Washington, DC, USA: Library of Congress, Congressional Research Service.
Tickner, D., Opperman, J. J., Abell, R., Acreman, M., Arthington, A. H., Bunn, S. E., et al. (2020). Bending the curve of global freshwater biodiversity loss: An emergency recovery plan. BioScience 70 (4), 330–342. doi:10.1093/biosci/biaa002
U.S. (2021) Army Corps of Engineers (USACE, 2021). Sustainable rivers project: Understanding the past, vision for the future. Available at: https://www.iwr.usace.army.mil/Missions/Environment/Sustainable-Rivers-Project/
U.S. Department of Agriculture (2021). “Natural resources conservation service,” in National planning and agreements database (United States: USDA-NRCS).
U.S. Department of Agriculture, Economic Research Service (USDA-ERS), 2019a). Agricultural act of 2014: Highlights and implications. Available at: https://www.ers.usda.gov/agricultural-act-of-2014-highlights-and-implications/.
U.S. Department of Agriculture, Economic Research Service (USDA-ERS), 2019b). Conservation programs. Available at: https://www.ers.usda.gov/topics/natural-resources-environment/conservation-programs/.
U.S. Environmental Protection Agency (USEPA), 2022). 319 grant program for states and territories. Available at: https://www.epa.gov/nps/319-grant-program-states-and-territories.
U.S. Environmental Protection Agency (USEPA), 2016). National nonpoint source program – A catalyst for water quality improvements. Available at: https://www.epa.gov/sites/default/files/2016-10/documents/nps_program_highlights_report-508.pdf.
Wade, M., Peppler, R., and Person, A. (2021). Community education and perceptions of water reuse: A case study in norman, Oklahoma. J. Environ. Stud. Sci. 11 (2), 266–273. doi:10.1007/s13412-021-00667-4
Waldron, A., Mooers, A. O., Miller, D. C., Nibbelink, N., Redding, D., Kuhn, T. S., et al. (2013). Targeting global conservation funding to limit immediate biodiversity declines. Proc. Natl. Acad. Sci. U. S. A. 110 (29), 12144–12148. doi:10.1073/pnas.1221370110
Wallander, S., Aillery, M., Hellerstein, D., and Hand, M. (2013). The Role of conservation Programs in drought risk adaptation, economic research report No. 148. United States: U.S. Department of Agriculture, Economic Research Service.
Wallander, S., Smith, D., Bowman, M., and Claassen, R. (2021). Cover crop trends, programs, and Practices in the United States, economic information bulletin No. 222. United States: U.S. Department of Agriculture, Economic Research Service.
Ward, F. A., and Pulido-Velazquez, M. (2008). Water conservation in irrigation can increase water use. Proc. Natl. Acad. Sci. 105 (47), 18215–18220.
Warner, A. T., Bach, L. B., and Hickey, J. T. (2014). Restoring environmental flows through adaptive reservoir management: Planning, science, and implementation through the sustainable rivers project. Hydrological Sci. J. 59 (3-4), 770–785. doi:10.1080/02626667.2013.843777
Wilson, K. A., McBride, M. F., Bode, M., and Possingham, H. P. (2006). Prioritizing global conservation efforts. Nature 440 (7082), 337–340. doi:10.1038/nature04366
Wineland, S., Fovargue, R., Rezapour, S., Gill, K., and Neeson, T. M. (2021b). Conservation planning in an uncertain climate: Identifying projects that remain valuable and feasible across future scenarios. People Nat. 3, 221–235. doi:10.1002/pan3.10169
Wineland, S. M., Basagaoglu, H., Fleming, J., Friedman, J., Garza-Diaz, L., Kellogg, W., et al. (2021c). The environmental flows implementation challenge: Insights and recommendations across semi-arid, water-limited systems. Wiley Interdisciplinary Reviews. Water e1565.
Wineland, S. M., Fovargue, R., York, B., Lynch, A., Paukert, C., and Neeson, T. M. (2021a). Is there enough water? How bearish and bullish outlooks are linked to decision makers’ perspectives on environmental flows. J. Environ. Manag. 280, 111694. doi:10.1016/j.jenvman.2020.111694
Wineland, S. M., and Neeson, T. M. (2022). Maximizing the spread of conservation initiatives in social networks. Conserv. Sci. Pract. 4, e12740. doi:10.1111/csp2.12740
Yonk, R. M., Smith, J. T., and Wardle, A. R. (2019). Exploring the policy implications of the surface mining control and reclamation act. Resources 8 (1), 25. doi:10.3390/resources8010025
Keywords: conservation initiatives, conservation policy, participation, return on investment, conservation spending
Citation: Neeson TM, Wineland SM, Phillips E and McFadden J (2022) The dynamics of mature and emerging freshwater conservation programs. Front. Environ. Sci. 10:888521. doi: 10.3389/fenvs.2022.888521
Received: 03 March 2022; Accepted: 02 August 2022;
Published: 29 August 2022.
Edited by:
Angela Helen Arthington, Griffith University, AustraliaReviewed by:
Matthew Jurjonas, United States Geological Survey (USGS), United StatesNatasha Pauli, University of Western Australia, Australia
Brian Douglass Richter, Sustainable Waters, United States
Copyright © 2022 Neeson, Wineland, Phillips and McFadden. This is an open-access article distributed under the terms of the Creative Commons Attribution License (CC BY). The use, distribution or reproduction in other forums is permitted, provided the original author(s) and the copyright owner(s) are credited and that the original publication in this journal is cited, in accordance with accepted academic practice. No use, distribution or reproduction is permitted which does not comply with these terms.
*Correspondence: Thomas M. Neeson, neeson@ou.edu