Urban Climate Informatics: An Emerging Research Field
 Ariane Middel
 Negin Nazarian
 Matthias Demuzere
 Benjamin Bechtel
- 1School of Arts, Media and Engineering (AME), Arizona State University, Tempe, AZ, United States
- 2School of Computing and Augmented Intelligence (SCAI), Arizona State University, Tempe, AZ, United States
- 3Urban Climate Research Center (UCRC), Arizona State University, Tempe, AZ, United States
- 4School of Built Environment, University of New South Wales, Sydney, NSW, Australia
- 5City Futures Research Centre, University of New South Wales, Sydney, NSW, Australia
- 6ARC Centre of Excellence for Climate Extreme, Sydney, NSW, Australia
- 7Department of Geography, Urban Climatology Group, Ruhr-University Bochum, Bochum, Germany
The scientific field of urban climatology has long investigated the two-way interactions between cities and their overlying atmosphere through in-situ observations and climate simulations at various scales. Novel research directions now emerge through recent advancements in sensing and communication technologies, algorithms, and data sources. Coupled with rapid growth in computing power, those advancements augment traditional urban climate methods and provide unprecedented insights into urban atmospheric states and dynamics. The emerging field introduced and discussed here as Urban Climate Informatics (UCI) takes on a multidisciplinary approach to urban climate analyses by synthesizing two established domains: urban climate and climate informatics. UCI is a rapidly evolving field that takes advantage of four technological trends to answer contemporary climate challenges in cities: advances in sensors, improved digital infrastructure (e.g., cloud computing), novel data sources (e.g., crowdsourced or big data), and leading-edge analytical algorithms and platforms (e.g., machine learning, deep learning). This paper outlines the history and development of UCI, reviews recent technological and methodological advances, and highlights various applications that benefit from novel UCI methods and datasets.
1 Introduction
From Thermometers to Big Data: The Rise of Urban Climate Informatics
Rapid urbanization is one of the defining features of the 21st century with substantial global environmental impact compounded by climate change (Georgescu et al., 2013; Krayenhoff et al., 2018; Masson et al., 2020b; Zhao et al., 2021). In cities, the combined effects of population growth and climatic changes threaten urban livability through urban overheating (Nazarian et al., under review), hazardous air quality (Chapman S. et al., 2017; Broadbent et al., 2020), increased energy consumption, and extreme weather (Willems et al., 2012) (Li et al., 2020b) with widespread health, socioeconomic, and ecological impacts. In response to these challenges, numerous subfields of urban climatology have evolved over the last century to carefully document, examine, and model urban climate at various scales.
Sensors and observational methods have traditionally been developed to assess built environment impacts on local air temperature (Stewart, 2019) and quantify intra- and inter-urban variability in the urban canopy layer (Núñez-Peiró et al., 2021; Potgieter et al., 2021). Early weather and climate observations were motivated by pragmatic needs, e.g., to support agriculture or shipping, while the invention of the thermometer and the barometer in the early 17th century enabled systematic recording of weather conditions. In the late 18th century, the Societas Meteorologica Palatina established an observational network of calibrated instruments and an observation protocol (“Mannheimer Stunden”), which enabled scientific climatic studies. The approach aimed to encourage collaborative data collection by providing calibrated sensors at no cost (Neves et al., 2017). Although participation was limited to academic institutions and companies, the philosophy resonates with modern crowdsourcing and citizen science projects. Synoptic weather analysis required real-time data exchange, which became possible 50 years later with the invention of the telegraph. The first weather map with data from 22 stations was displayed at the World Exhibition in London in 1851.
Temperature maps became widely available with advances in thermal remote sensing, which provides high-resolution surface temperature distributions (Voogt and Oke, 2003; Zhan et al., 2013; Stewart et al., 2021). In the 20th century, advancements in aviation permitted unprecedented atmospheric 3D observations, and in 1960, the launch of the first weather satellite TIROS (Television and InfraRed Observation Satellite) opened a new age of meteorology.
Technological progress has also impacted the field of urban climatology. While research in the early 20th century concentrated on Europe and was mostly descriptive, rapidly increasing computational power in the late 20th and early 21st century significantly advanced quantitative and systematic scientific approaches in the Anglo-American realm (Mills, 2014). Numerical and climate modeling at building to regional scales produced urban climate parameters at high spatial and temporal resolution/coverage and facilitated what-if analyses (Hamdi et al., 2020). At the same time, model outputs and their availability to the research community increased with computing and storage capacity.
Most certainly, big and fine-resolution urban datasets have rapidly evolved with transmission rates exceeding 0.1 Petabyte per day (Reichstein et al., 2019). This trend was driven by increased availability, accuracy, and resolution of sensors and datasets as well as changes in data policy. In remote sensing, for instance, NASA and ESA granted free access to data archives, which enabled new techniques such as time series analysis and multi-sensor data fusion (Wulder et al., 2012).
Despite tremendous technological progress in research, the application of traditional micrometeorological theory to urban areas is still limited by the complexity and heterogeneity of the built environment (Mills, 2014). Conventional observation methods often fall short in providing fine-resolution spatial and temporal urban data, which highlights the need for denser observation networks and novel data sources. Additionally, urban climate studies have traditionally ignored “human factors” that lead to personal exposures to environmental stressors (Kuras et al., 2017; Okokon et al., 2017; Nazarian and Lee, 2021). Lastly, the risks for people and infrastructure are arguably more important than the geographic extent and magnitude of the hazard for planning and emergency response purposes, thus requiring direct access to highly localized information on human mobility (Moore and Obradovich, 2020).
The Cornerstones of Urban Climate Informatics
Urban Climate Informatics (UCI) is an evolving research field that originates from two established domains: Urban Climate (concerned with interactions between a city and the atmosphere) and Climate Informatics (research combining climate science with approaches from statistics, machine learning, and data mining) (Monteleoni et al., 2016). While Climate Informatics focuses on computational approaches in climate science, UCI takes a broader, multidisciplinary approach. UCI aims to explore and understand complex urban climate systems and human-environment interactions through new technological, methodological, and systems thinking approaches. It embraces more integrated and human-centric methods to address urban climate challenges that are enabled by novel sensing, non-traditional datasets, crowdsourcing, big data, digital infrastructure, advanced analytics, and artificial intelligence.
Four emerging technologies and methods can be noted as the cornerstones of UCI (Figure 1). First, recent advancements in environmental sensing have resulted in lower sensor size and power consumption at reduced sensor costs. More importantly, improvements in wireless data transmission (using various methods such as Wifi, 5G, and LoRaWAN) and location awareness of devices have enabled Internet-of-Things (IoT) sensing, contributing to real-time and ubiquitous data collection. Second, in addition to environmental datasets that are actively collected by sensors, new urban datasets from various sources emerge. These novel datasets include detailed information on three-dimensional and heterogeneous urban configurations as well as incidental and public domain data that can be extracted from social media or the web. The availability of organic datasets, such as mobility patterns in cities, further contributed to understanding the population exposure and impact of urban climate challenges (Li and Wang, 2021). At the same time, a stronger emphasis on citizen engagement and technology-use in daily activities has evolved over the last decade. Driven by commercial trends (e.g., home automation sensors, smartwatches, wearables) and solutions that are non-expert friendly, citizen science data collection has become mainstream and is implemented in education, entertainment, and social activities (Caluwaerts et al., 2021). This contributes to ubiquitous and crowdsourced data collection beyond the academic community (Irwin, 2018), further enabling more realistic and human-centric solutions to urban climate challenges. Third, state-of-the-art analytical algorithms and computer systems have entered urban climate analytics, providing an opportunity for more sophisticated data analyses, computational methods, and modeling approaches. Artificial Intelligence (AI, including Machine and Deep Learning) has been instrumental in characterizing urban areas into local climate zones or climatic maps (Bechtel and Daneke, 2012; Xu et al., 2019; Demuzere et al., 2021; Demuzere et al., 2022), which are paramount for observational and modeling efforts in urban climatology. Lastly, the accessibility of digital infrastructures for storage, analytics, and communication of results have transformed various approaches, enabling global-scale analyses of urban climate parameters such as surface and air temperatures (Peng et al., 2012; Chakraborty and Lee, 2019; Venter et al., 2021).
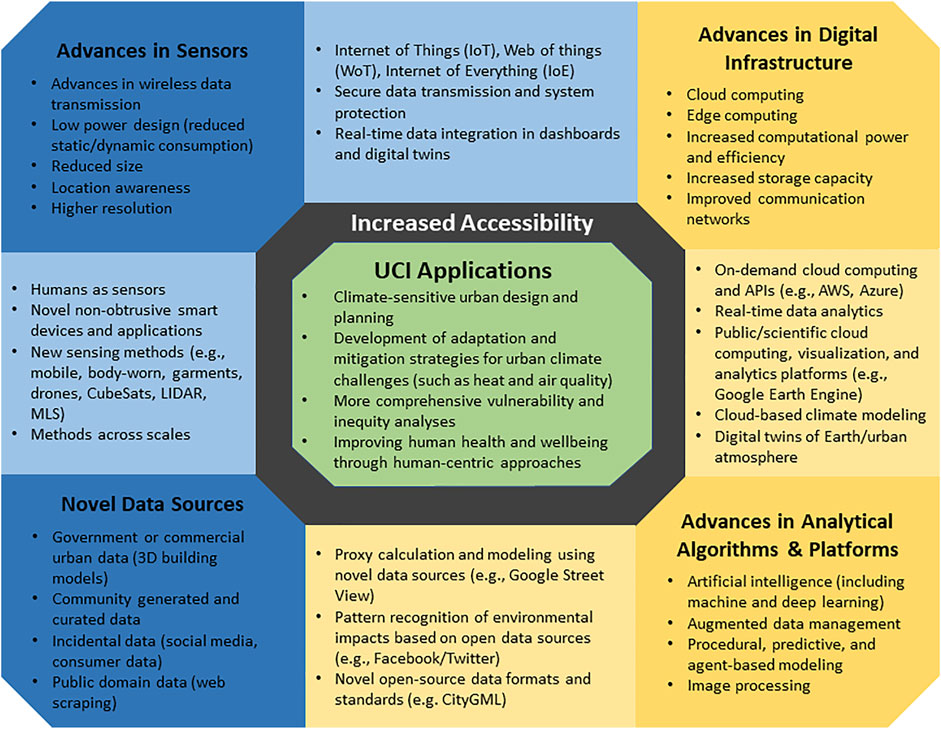
FIGURE 1. The four cornerstones of Urban Climate Informatics (UCI): Advances in Sensors (Section 2), Novel Data Sources (Section 2), Advances in Digital Infrastructure (Section 3), and Advances in Analytical Algorithms and Platforms (Section 3). Increased accessibility to four pillars enables a wide range of UCI applications (center).
Collectively, novel data sources, sensors, and computing methods have led to a paradigm shift in urban climate analyses, significantly changing “how” we do science and expanding research questions directed at the urban atmosphere and its residents. This shift includes moving beyond the traditional focus on city-atmosphere interactions and tackling challenges of the Anthropocene, including climate change, urban overheating, poor air quality, and climate injustice. Most notably, four trends can be observed: 1) urban climate research has moved towards comprehensive analyses of the dynamics of urban climate and human-environment interactions at fine temporal and spatial scales; 2) the research focus has shifted from an assessment of local atmospheric conditions in a city vs its rural surroundings (traditional UHI definition) towards intra-urban hazard distribution and human thermal exposure assessments; 3) highly accurate, expensive, high-maintenance weather stations and air quality sensors operated by experts are complemented by educational or operational, lower-cost tools and data that were acquired for non-urban climate purposes; 4) urban climate research teams have become interdisciplinary spanning a wide range of expertise, from architects and engineers to urban planners, computer scientists, and local government representatives, which allows more complex, solutions-oriented analyses from health sciences to social justice and equity; and 5) research results are better communicated to non-experts through new platforms and visualizations (e.g., websites, social media, dashboards) to maximize broader societal impact.
UCI has the potential to overcome current gaps and challenges in urban climatology, which include but are not limited to 1) a lack of human processes (e.g., anthropogenic heat, people’s movement) in urban modeling; 2) observations that are not representative of atmospheric processes and human exposures across space and time (e.g., for long-term climate studies or model validation); and 3) limited data availability (e.g., urban canopy parameters, urban morphology) and computing power for urban climate modeling (Masson et al., 2020a; González et al., 2021). This paper outlines the key trends in the development of UCI, discussing novel technological and methodological advances that enable future directions in urban climate research. The following sections provide a general overview of the UCI field as well as examples and discussions of novel sensing and data sources (Section 2) as well as advancement in data processing (Section 3).
2 Novel Sensors and Data Sources
One of the key catalysts for the UCI field is the emergence of novel and more expansive datasets resulting from several interconnected developments, most importantly advances in sensor solutions, communication technologies, and data acquisition methods. Here, we detail how advancements in sensors (Section 2.1), ensuing novel acquisition methods (Section 2.2), and datasets (Section 2.3) have been used to understand and address urban climate challenges.
2.1 Advancement in Sensors and Communication Technologies
Advances in environmental sensing have greatly increased the availability, resolution, and quality of observational data for urban climate research. In the last decade, a major shift was seen from research-grade sensors operated by experts to low-cost devices, e.g., for citizen-scientists. New technologies not only allowed sensing units to record a more comprehensive set of parameters (such as standard meteorology, air quality, UV, and noise), but also removed limiting factors in continuously monitoring the built environment, such as power supply (source and consumption) and sensor size. The sensor technology revolution resulted in smaller sensors that could easily be mounted to existing structures, required less energy (or were sustained through solar panels), and eventually, were cheaper. This process is similarly seen in satellite/remote sensing, where the emergence of CubeSats has led to miniaturized satellites for space research that have high potential to enhance observations for urban climate applications (González et al., 2021).
Such advances are further complemented with novel wireless and ubiquitous communication technologies, such as WiFi, 3G/4G/5G, and LoRaWan. While previous data-loggers required a technician to connect to the sensor and (often manually) transfer the data for further processing, wireless communication enables automatic and seamless transitions of data from multiple devices to servers. Removing the communication and scaling barrier has led to the emergence of Internet-of-Things (IoT), where physical sensors are connected to digital infrastructure and real-time analytics (Sections 2.1 and 2.2); Web-of-Things (WoT), where sensors and everyday objects are fully integrated into the web; and Internet of Everything (IoE), with all-round connectivity, intelligence, and cognition beyond computers, tablets and smartphones.
Advances in sensors and communication methods greatly contribute to observational studies in UCI. Low-cost sensors with seamless data communication allow scientists, practitioners, and citizens to utilize numerous sensors in a variety of urban spaces with different user behaviors. Instead of using sparsely-placed outdoor sensors to determine heat, weather, or air quality, fine-grained and multi-parameter IoT sensor networks have been successful in depicting the spatial and temporal heterogeneity of environmental quality in educational, commercial, and residential buildings and their outdoor surroundings (Palacios Temprano et al., 2020; Luo et al., 2021; Ulpiani et al., 2021). In addition to covering a larger spatial area and determining hotspots of environmental stressors (Schneider et al., 2017), IoT sensor networks contribute to predictive models for weather (Chavan and Momin, 2017), energy consumptions (Cheng et al., 2021) and air pollution exposures (Xiaojun et al., 2015; Zhang and Woo, 2020); assist in determining the impact of surface cover and urban design on microclimate (Pfautsch and Tjoelker, 2020); and further raise citizen awareness on urban environmental challenges. Lastly, advancement in sensor solutions and communication methods lead to novel data acquisition methods in cities.
2.2 Data Acquisition Methods
As existing sensing technologies improve over time, urban climate science further benefits from emerging data acquisition techniques. Novel observation methods take advantage of new sensors and digital literacy of urban residents. Observations range from mobile sensors mounted on various devices and humans to crowdsourcing and volunteered geographic information (VGI), where citizens and distributed private sensors provide a source of geographic and environmental data (See et al., 2016). These methods have long been neglected in atmospheric sciences, mostly due to knowledge gaps and justified concerns in data quality and standardization (Muller et al., 2015). However, these novel data sources are predestined for urban analyses because they are typically collected in the most populated places: cities.
Mobile Sensing and “Humans as Sensors”
Traditional urban climate research uses observational datasets that determine inter- and intra-urban variabilities of climatic parameters. As sensors have become smaller, wireless, and more power-efficient, it is more feasible to gather such data through mobile sensing, where the primary goal is increased coverage at reduced costs. This has led to four measurement categories: 1) portable weather stations, 2) vehicle-based sensors, 3) smartphones, and 4) wearable and nearable devices.
Portable weather stations are moved through urban environments using garden carts (Middel and Krayenhoff, 2019; Middel et al., 2021), golf carts (Häb et al., 2015), or cargo bikes (Heusinkveld et al., 2014; Rajkovich and Larsen, 2016). Measurement campaigns often utilize research-grade weather stations and monitor a comprehensive set of parameters, providing valuable spatial data particularly in the face of extreme heat events. However, mobile sensors lack the medium- or long- term temporal resolution of fixed sensors and, more importantly, need post-processing methods to address prolonged sensor response time in common weather stations (Häb et al., 2015). Additionally, data outputs of mobile measurements are often in time-series format, while the sensors are non-stationary. The changing atmospheric conditions impact observations that should be corrected through time-detrending (Parlow and Foken, 2021). Lastly, mobile sensors are subject to anthropogenic influences such as heat from traffic and space heating/cooling equipment. Accordingly, mobile data should be enriched with detailed metadata to comprehensively interpret the observations.
Similar to portable weather stations, sensors mounted on vehicles such as buses (Kang et al., 2016; Seidel et al., 2016), trash trucks (deSouza et al., 2020), and cars (Ferwati et al., 2018) have been used to traverse cities. Vehicle-based data are prone to the same challenges as portable weather stations. Low-cost (and therefore less accurate) sensors are frequently deployed due to size and communication limits, yet they allow to assess behavioral patterns and human-centric exposure to environmental stressors such as air quality and heat (Fugiglando et al., 2018).
Mobile phones have become an attractive data source for human-scale urban climate information, as there are currently 6.64 billion smartphone users in the world today. Various studies have used phone battery temperature as a proxy for air temperature to map thermal conditions in cities (Overeem et al., 2013; Droste et al., 2017b). Data uncertainty increases with solar radiation exposure (Cabrera et al., 2021), more extreme weather, and precipitation, because the smartphone is most likely enclosed. Although smartphone data for environmental modeling are yet to be validated and scaled beyond academic assessments, the importance of gathering continuous, real-time feedback from urban dwellers should not be underestimated. Assessing urban climate impact requires more in-depth focus on humans exposed to environmental stressors in cities. Accordingly, smartphone applications collecting data on the human experience (e.g., thermal comfort vote and noise/pollution discomfort) can obtain critical data points to augment environmental parameters (Lassen et al., 2021).
Recent urban climate studies have used wearables and nearable sensors for data collection. Here, we define wearables as smart devices (e.g., smart watches, sensor patches, smart clothing) that are worn by participants to obtain environmental parameters (e.g., air temperature and humidity) and physiological responses or behavioral patterns and activities. Nearables refer to (low-cost) sensors carried by individuals or placed in the immediate environment of people. The National Science Experiment in Singapore (low-cost wireless SENSg devices (Wilhelm et al., 2016) is probably the largest deployments of wearables, with 50,000 sensors carried by students for assessment of thermal comfort among other objectives (Monnot et al., 2016; Happle et al., 2017). Wearable sensors have been used to combine all three (environmental, physiological, and behavioral) factors and have shown promising results in predicting heat stress (Nazarian et al., 2021) and obtaining non-obtrusive, real-time feedback (Jayathissa et al., 2019). As sensors are frequently moved between indoor and outdoor settings, pocket and palms, and are also influenced by the device CPU load, interpretation of the data requires more in-depth investigations.
Crowdsourcing and Citizen Science
Crowdsourcing, i.e., collection of atmospheric data from non-traditional distributed sources, has evolved as a cost-efficient alternative for monitoring urban climates. While the use of crowdsourced data in atmospheric sciences was in its infancy half a decade ago (Muller et al., 2015), it has reached adolescence quickly. Since 2015, a growing body of crowdsourcing literature has focused on citizen weather station (CWS) data from privately-owned, non-professional, low-cost stations connected to the Internet. Early studies focused on network air temperature (Bell et al., 2015; Chapman L. et al., 2017; Fenner et al., 2017; Meier et al., 2017), but more recent analyses added other atmospheric parameters including precipitation (De Vos et al., 2017; Bardossy et al., 2021), air pressure (de Vos et al., 2020), and wind speed (Droste et al., 2020). While the data quality of individual stations remains low, many insights have been gained on error sources, quality control, and filtering algorithms (Meier et al., 2017; Hammerberg et al., 2018; Napoly et al., 2018; de Vos et al., 2019; Mandement and Caumont, 2020; Fenner et al., 2021). This development is dynamic, and the uncertainty in crowdsourced CWS data much depends on the parameter of interest and the network density, but confidence increases that robust parameter estimates can be derived for spatial averages or climatology. Other crowdsourcing sensors of high interest are cars (Bröring et al., 2015; Bonczak and Kontokosta, 2019) and smartphones, which have been used to observe air pressure (Mass and Madaus, 2014; de Vos et al., 2020) and air temperature (Overeem et al., 2013; Droste et al., 2017a), amongst others (see previous section).
A major driver of advancements in crowdsourcing is the growing number of applications. CWS have been used to analyze urban heat islands (Meier et al., 2017; Varentsov et al., 2021; Venter et al., 2021), hailstorms (Clark et al., 2018), and deep convection (Mandement and Caumont, 2020); for high-resolution mapping of air temperature (Venter et al., 2020; Vulova et al., 2020; Zumwald et al., 2021); to derive boundary conditions for urban-climate models (Jin et al., 2021); and for operational weather forecasts (Nipen et al., 2020). Furthermore, CWS data have been combined with novel datasets emerging in UCI (Section 2.3) such as high-resolution 3D urban models, such that we better understand the role of urban design and land cover on urban microclimate (Potgieter et al., 2021). Since crowdsourced data allow new types of analyses and improve the accuracy of short-term forecasts, they have slowly gained acceptance in the climatology community, but concerns about data quality remain. For centuries, climatologists have developed and advanced standards and protocols to make observations comparable between places and decades; in the future, much of this rigor must be applied to the quality control and filtering algorithms of crowdsourced data.
Unmanned Aerial Vehicles
Observations from unmanned aerial vehicles (UAVs) are at the smallest scale of remote sensing for monitoring land surface dynamics. Unmanned aerial systems (UASs) produce high spatial resolution data, sufficiently detailed to make field-level decisions, and fill the gap between satellite and in-situ, near-ground observations (Emilien et al., 2021). The genesis of UAS dates back to 1849 and was, for a long time, driven by military needs (Rakha and Gorodetsky, 2018). In the early 1970s, Konrad et al. (1970) pioneered the use of UAVs in meteorology to study the dynamics of the convective process, which requires fine-scale data on the temporal and spatial structure of the atmosphere. To overcome limitations of available platforms at that time (e.g., balloons, towers, and full-sized aircraft), the authors developed and tested a small, radio-controlled aircraft with meteorological sensing instrumentation as a versatile measurement platform. Over the next decades, technical developments facilitated more frequent uses of UAVs in atmospheric research. For example, Leuenberger et al. (2020) evaluated the assimilation of boundary layer observations gathered by “Meteodrones” into the numerical weather prediction system at Meteoswiss and found that the drone observations improved fog prediction. Chilson et al. (2019) proposed an automated 3D mesonet based on autonomous UAS stations to observe atmospheric profiles similar to standard “mesonets”, which consist of surface-based, in-situ stations. Although this work is in its infancy, a 3D network could significantly enhance our monitoring capacity of environmental variables in the lower atmosphere, improve our understanding of atmospheric boundary layer processes, and improve high-impact numerical weather prediction. Despite the low cost and resolution advantages, drones still have limited use in climatology, because they require additional sensors beyond RGB imagery, and flight durations are short (Yavaşlı, 2020).
Yet, UAVs have proven to be useful in an urban climate context, as shown by Rakha and Gorodetsky (2018). Their comprehensive review of thermal drones for energy audits highlights that the increased accessibility, efficiency, and safety of drones expedites the improvement and retrofitting of aging and energy-inefficient building stock and infrastructure. This finding is corroborated by Bayomi et al. (2021), who collected thermal drone data to calibrate a building energy model for improved performance and to assess building material degradation, thermal bridging, and insulation failures. In recent years, UAVs have been increasingly deployed to measure 3D urban form (Gevaert et al., 2017) and to monitor in-situ air quality (Kuuluvainen et al., 2018), but limitations such as flight duration, payload capacity, and sensor dimensions, accuracy, and sensitivity remain (Villa et al., 2016).
2.3 Datasets
New emerging datasets are key for representing realistic, heterogeneous urban environments while driving insight into the exposure of urban residents to climate challenges. These datasets are obtained through planned processes gathering information on defined research questions (purposeful data) such as LiDAR point clouds, or secondary outcomes of technological processes and platforms used in urban areas (organic data) such as social media data. The source, intention, and method of data collection further dominate whether the dataset is structured, or more importantly, can be activated for use in climate analyses (i.e., used to develop insights or devise action). While the unprecedented volume of data is offering exciting opportunities for better understanding and quantifying urban climate challenges, the velocity (rate at which the data are generated), veracity (truthfulness, accuracy, and quality of data), and ownership (access to, possession of, and responsibility for data) creates significant challenges for data use in climate research and application. For instance, while data policies of authorities have become considerably more open over the past decade, data generated by citizens are often legally “owned” by private companies, thus their long-term availability depends on business interests and success. The challenges of data ownership are manifested in access to 3D urban models, where the development of Data as a Service (DaaS) prohibits their dissemination for modeling or observational studies. Lastly, new datasets raise novel challenges with respect to privacy, most seen in human-scale data collection. Here, we detail three novel data types that have been successfully collected and used for urban climate analyses and discuss limitations in research and application.
Big Data
Detailed, accurate 3D information on a city’s composition, configuration, and morphology is key for urban climate analyses and applications. The wide variety of building types, architectural features, construction materials, and the distribution of vegetation govern the interactions between the city and its surrounding atmosphere (Middel et al., 2014; Oke et al., 2017; Ching et al., 2018). Traditionally, 3D city models and urban form parameters have been established using photogrammetry (processing optical stereo imagery) or high-resolution satellite images (Masson et al., 2020a). More recent approaches use large point clouds (next section) or procedural modeling (Nishida et al., 2018) to automatically generate cityscapes (Ching et al., 2019a). In the advent of big data, researchers started to repurpose large datasets that were originally collected for non-urban-climate purposes, such as street level photography. Street View image repositories from Google, Baidu, Mapillary, Tencent have increasingly become available and been used to characterize the built environment using machine learning (feature detection and image segmentation) (Keralis et al., 2020). A street canyon perspective is more human-centric than bird’s eye view imagery, which is particularly important for human thermal comfort, health, and behavioral studies (Middel et al., 2019). Past research has used Street View images to quantify street greenery (Li et al., 2017; Lu, 2019), building age (Li et al., 2018), building floor count (Iannelli and Dell’Acqua, 2017), sidewalks and crosswalks (Hara et al., 2013; Berriel et al., 2017), urban land use (Zhang et al., 2017), and sky view factors (Middel et al., 2018; Zeng et al., 2018; Nice et al., 2020). Street level images have also been used to conduct virtual neighborhood audits to assess walkability (Yin and Wang, 2016), bikeability (Arellana et al., 2020), traffic safety (Mooney et al., 2016), physical activity (Griew et al., 2013), and human health (Keralis et al., 2020). Lastly, Street View images have been linked to urban climate parameters such as surface temperature (Zhang et al., 2019) and air quality (Apte et al., 2017). While street level imagery offers remote access to urban form, design, and function, many providers have recently restricted free image downloads. Other known constraints include limited spatial and temporal availability (i.e., the user does not have control over image acquisition season, date, time, and location), images are usually taken in the center of the road, not on the sidewalk, and they do not provide insight into backyards. Yet, with more and more users volunteering geographic information, uploading crowdsourced photography, and more companies entering the mapping market, Street View products will remain a valuable big data source for urban climates studies.
LiDAR Point Clouds
Urban areas affect the atmosphere via their built materials, distinct surface cover and urban structure. The latter refers to the 3D urban morphology, or urban form, that determines albedo and aerodynamic roughness, and controls radiative exchange and airflow (Oke et al., 2017). With advances in remote sensing, LiDAR (Light Detection And Ranging) systems have become a well-established alternative to stereo photogrammetry for generating digital urban models. Point clouds from airborne, mobile, or terrestrial LiDAR yield 3D urban form at unprecedented spatial resolution (Yan et al., 2015; Bonczak and Kontokosta, 2019). Wang et al. (2018) reviewed urban reconstruction algorithms for point cloud data, evaluated their performance in modeling architectural elements (e.g., buildings, roads, bridges, power lines, trees), and highlighted the generation of 3D city models with multiple levels of detail (LoDs). In this context, CityGML by the Open Geospatial Consortium has emerged as a widely accepted standard for describing the representation, storage, and exchange of digital 3D city and landscape models (Gröger and Plümer, 2012). Higher levels of detail require more data storage, and as such, pathways are currently explored on how to represent multiple levels of detail (LoDs) while optimizing storage. This relates to the urban-scale space exploration (Lafarge, 2015) and the concept of “fit-for-purpose” urban data as advertised by the World Urban Database and Access Portal Tools project (WUDAPT, Ching et al., 2018, 2019; Bechtel et al., 2019) that aims to find an optimal solution across scales as a tradeoff between data complexity and model accuracy.
Point clouds have myriad urban climate applications. Urech et al. (2020) used LiDAR to reconstruct digital 3D landscapes and devised a framework to generate future landscape scenarios by manipulating the point cloud. This information was subsequently used to inform the Discrete Anisotropic Radiative Transfer (DART) model that estimates the 3D radiative budget of urban and natural landscapes, and to assess changes in thermal comfort in a neighborhood in Singapore. Dissegna et al. (2019) calculated the leaf area density (LAD) of urban trees from terrestrial LiDAR scans to quantify the contribution of vegetation to the radiative budget of a city, which can mitigate the urban heat island (UHI) effect and ultimately contribute to the development of climate resilient urban spaces. Other studies used airborne LiDAR data to map urban vegetation and LAD in Vienna, Austria (Höfle et al., 2012) and Gothenburg, Sweden (Klingberg et al., 2017), thereby indicating the important ecological characteristics of urban vegetation that influence urban climate through shading and transpiration cooling and air quality through air pollutant deposition. The Urban Multi-scale Environmental Predictor (UMEP), an urban climate service tool (Lindberg et al., 2018), combines models and approaches for fine-scale climate simulations. The tool includes modules to derive digital surface models (DSM) and canopy digital surface models (CDSM) from airborne LiDAR and has recently been used in various heat exposure and mitigation studies across the globe (Aminipouri et al., 2019; Kong et al., 2022).
Reviewing the latest advances of LiDAR-based mobile mapping systems, Wang et al. (2020) identified challenges related to reliable positioning, the need for more sophisticated deep-learning architectures to classify point clouds, and AI challenges to comprehensively understand semantics of complex urban streetscapes. Nevertheless, the authors envision that point clouds will give rise to a new category of geo-big data and will play an important role in future monitoring, detection, and modeling tasks.
Social Media
DataIn the era of information and communications technology, urban geolocated social media data (SMD) offer new opportunities to indirectly measure the impact of hazards on society, to advance understanding of complex urban dynamics, and to support decision-making for sustainability transformations (Ilieva and McPhearson, 2018; Creutzig et al., 2019). SMD from Flickr, Twitter, Foursquare, Facebook, Instagram, etc. have the potential to fill important data gaps that prevent researchers and practitioners from understanding human-environment interactions. During the first IPCC Cities and Climate Science Conference in Edmonton, Canada (Bai et al., 2018; Frantzeskaki et al., 2019), SMD indicators of social, ecological, and infrastructural change were highlighted in a series of synthesis statements on the role, potential, and research gaps of nature-based solutions for climate adaptation and mitigation. Grasso et al. (2017) argue that micro-blogging platforms such as Twitter may be used as a distributed network of mobile sensors that react to external events by exchanging messages. They found significant associations between the daily increase in tweets and extreme temperatures during a 2015 summer heat wave in Italy, indicating that the daily volume of Twitter messages can indicate local heatwave impacts, improve preparedness measures at the regional and local level, and thus reduce heat vulnerability. Young et al. (2021) came to a similar conclusion when studying Twitter data to detect different scales of response and varying attitudes towards heat waves in the United Kingdom (United Kingdom), the United States of America (US), and Australia. They performed a sentiment analysis, i.e., the field of natural language processing that aims to extract the attitude conveyed in a body of text. The United Kingdom and US had similar levels of positivity during the heatwave, while Australians were more negative, with a significant sentiment increase as temperature decreased. By quantitatively reviewing 169 studies that use data from social media and social networking sites to better understand human-environment interactions (Ghermandi and Sinclair, 2019), suggest that SMD offers unprecedented opportunities in terms of data volume, scale of analysis, and real-time monitoring. At the same time, challenges remain, including the integration of different types of information in data matching, the development of quality assurance procedures and ethical codes, an improved integration with existing methods, and the assurance of long-term, free, and easy-to-access provision of public social media data (Ghermandi and Sinclair, 2019).
3 Advancements in Data Processing
The emergence of new digital infrastructure and analytics algorithms and platforms is a major driver of UCI. Cloud storage and computing allow bigger data volumes to be stored outside of the sphere of physical storage and processed directly in the cloud. Furthermore, novel analysis methods (e.g., AI or edge computing) complement previous advancements and remove some privacy and security concerns of previous approaches that analyzed the impact of urban climate on residents.
3.1 Algorithms
Climate is increasingly becoming a data problem (Jones, 2017). For example, the compressed climate model output for the sixth Coupled Model Intercomparison Project (CMIP6) is estimated at 18 Peta Bytes, which is five times the size of the CMIP5 archive (Balaji et al., 2018). The research field “Climate Informatics” encourages collaborations between climate scientists and machine learning researchers to help bridge the gap between data and understanding and to accelerate discovery in climate science (Monteleoni et al., 2016; Huntingford et al., 2019). Machine Learning (ML) techniques have been used to find complex patterns and networks in large data, insights that might otherwise depend on expert judgment or physical-based rules (Jones, 2017). ML also speeds up the development of parameterizations in weather and climate models (or their sub-components, e.g., land surface models), either by completely replacing physically-based parameterizations by data-driven neural networks or by harnessing ML to calibrate or “tune” the many free parameters involved in their formulation (Couvreux et al., 2021; Hourdin et al., 2021; Pal and Sharma, 2021). In urban climate studies, the use of ML or other artificial intelligence (AI) techniques such as deep learning has been primarily used to derive urban form and land cover from image datasets. Ma et al. (2019) reviewed 200 remote sensing studies and found that deep learning was predominantly used in urban applications. Xu et al. (2019) employed convolutional neural networks (CNNs) and ground-level images to classify urban areas into climate zones, while Zhou et al. (2021) and Yoo et al. (2019) used deep learning, CNN, and random forest to map LCZs from remotely sensed images. Deep learning has also been used to predict air pollution in urban areas using satellite data (Lee et al., 2021) and Street View images (Suel et al., under review). Venter et al. (2020) applied a random forest model to Sentinel, Landsat, LiDAR, and crowd-sourced air temperature measurements to model hyper-local urban air temperature distribution concluding that the resulting maps can complement and validate traditional urban canopy models.
3.2 Digital Infrastructure and Platforms
Platforms for Big Earth Observation Data
As discussed in the introduction, many urban climate studies rely on remotely sensed Earth Observation (EO) data, which has become increasingly more available, accurate, and fine-scaled. EO products are frequently used to assess the surface urban heat island (SUHI), perform land cover classifications, and provide input for models of urban surface-atmosphere exchange (Voogt and Oke, 2003). Many EO datasets are delivered on a daily basis, providing a massive amount of remotely sensed data that places us in an age of big EO data (Chi et al., 2016). Over the last decade, cutting-edge platforms have been developed to support a new generation of spatial data infrastructure based on cloud computing, distributed systems, MapReduce systems, and web services. These systems address challenges related to big EO data management heterogeneity, storage, processing, analytics, visualization, sharing, and applications (Li et al., 2020c) Importantly, the development of data infrastructure enables the application of data standards to data layers developed by diverse stakeholders and addresses challenges regarding data interoperability and integration. In their review, Gomes et al. (2020) define “platforms for big EO data management and analysis” as computational solutions that provide functionalities for data management, storage, and access; that allow processing on the server side without having to download large datasets; and that provide a certain level of data and processing abstractions for EO community users and researchers. Seven platforms currently match this definition: Google Earth Engine (GEE) (Gorelick et al., 2017), Sentinel Hub (Sinergise, 2018), Open Data Cube (Open Data Cube, 2021), System for Earth Observation Data Access, Processing and Analysis for Land Monitoring (SEPAL, FAO, 2021), OpenEO (Pebesma et al., 2017), the JRC Earth Observation Data and Processing Platform (JEODPP, Soille et al., 2018), and pipsCloud (Wang L. et al., 2018; Gomes et al., 2020). GEE is probably the most widely used platform in urban climate studies.
Amani et al. (2020) reviewed 450 GEE-related journal articles and found 40 papers on urban topics, including urban planning, development and extent; urban morphology; and urban temperature and heat island studies. For example, Cheng et al. (2018) and Zhang et al. (2020) used GEE to develop global maps of manmade impervious areas. Li M. et al. (2020) mapped urban 3D building structure, i.e., building footprint, height, and volume, for Europe, the United States, and China using random forest models in GEE. Huang et al. (2018) and Duan et al. (2019) used GEE to map urban green spaces and urban forests in China using Landsat and Sentinel-2 imagery, respectively. In a series of papers, Demuzere et al. (2019a, 2019b, 2020, 2021) converted the off-line single-city Local Climate Zone (LCZ) mapping strategy (Stewart and Oke, 2012; Bechtel et al., 2015) into a GEE-based procedure that allows for the creation of continental-scale LCZ maps, including a web-application (LCZ generator, https://lcz-generator.rub.de/) that makes LCZ mapping fast and easy. Bechtel et al. (2019b) assessed the SUHI from MODIS and Landsat against LCZ maps for 50 global cities, and Chakraborty and Lee (2019) computed the SUHI from MODIS for over 9500 urban clusters and examined how vegetation controls spatiotemporal SUHI variability. Benz et al. (2017) analyzed global shallow groundwater temperatures by processing and integrating land surface temperatures, evapotranspiration data, and snow cover in GEE. The availability of LCZ mapping has also enabled a consistent comparison with three-dimensional urban data (Section 2.3) for different cities, providing detailed city-descriptive input parameters for climate models (Lipson et al., under review).
Big Earth data and related platforms introduced disruptive changes in EO data management and analysis (Sudmanns et al., 2019). Yet, despite their advancements, challenges remain. For example, Gomes et al. (2020) report that none of the investigated platforms offer all ten required EO capabilities presented by Camara et al. (2016) and Ariza-Porras et al. (2017). Besides technical challenges, organizational and political challenges exist that are partly unsolved or not discussed, such as security issues (e.g., storing datasets or algorithms on non-proprietary platforms) or increasing costs for developing and maintaining such platforms. These issues lead to the question whether Big EO data platforms will continue to provide reliable data and services in the future (Sudmanns et al., 2019).
Cloud Computing
In recent years, cloud computing services have become increasingly affordable. Third-party providers such as Amazon Web Services (AWS), Microsoft Azure, and Google Cloud host and maintain scalable computing infrastructure, i.e., customers are only charged for the infrastructure they use. Several recent urban climate studies have used cloud computing for modeling sky view factors (Dirksen et al., 2019), to run WRF (Goga et al., 2018), simulate microclimate with ENVI-met (Crank et al., under review), and predict neighborhood air pollution (Triscone et al., 2016). Cloud services also gain popularity in crowdsourcing and IoT applications. For example, Fauzandi et al. (2021) designed and implemented a low-cost sensor system for UHI observations using AWS, and Kulkarni et al. (under review) used an AWS database to store biometeorological observations and people counts from an IoT device in a public park. Similar to Big EO data platforms, cloud computing has limitations related to server availability (e.g., downtime during service outages), security, and privacy. Cloud computing also offers limited control and flexibility because the infrastructure is managed by the service provider, not the urban climate researcher, and is often tied to a specific vendor (the service provider). Despite these limitations, it is expected that cloud computing will play a major role in UCI as simulations become more complex and datasets increase in size.
4 Conclusion and Outlook
The field of urban climate has greatly advanced our understanding of city-atmosphere interactions since the first weather map was created in the mid-19th century. Driven by sensing and modeling physical phenomena, urban climate research in the past decade has integrated multidisciplinary methods and practices complementing the core principles in atmospheric science. UCI parallels this development, embracing various scientific disciplines such as data science, geospatial analyses, urban design, health, and policy. A clear paradigm shift can be seen from focusing on city-atmosphere interactions to tackling grand challenges of the Anthropocene, including climate change, urban overheating, poor air quality, and climate injustice. New advancements enabled by UCI offer unprecedented opportunities to understand these grave problems and support a variety of applications.
UCI facilitates the development of adaptation and mitigation strategies for urban climate challenges by pushing the boundaries of observational networks, model resolution, and domain size to yield unprecedented details on hazard distribution. High resolution 3D city data paired with detailed thermal properties of the urban fabric enable urban climatologists to answer questions about optimal tree placement, the amount of available shade, and heat retention in urban canyons. Digital twins–virtual city models integrating various datasets, real-time sensing, and predictive models of underlying atmospheric processes–are on the rise and will eventually allow analyses of complex city-atmosphere interactions at fine temporal and spatial scales. Although still in their infancy, Digital Twins have already been used to support collaborative and participatory urban planning and aid in hyper-local air pollution mitigation (Dembski et al., 2020). The City of Zurich uses Digital Twins to simulate urban climate, noise, air pollution, and create future scenarios for decision-making (Schrotter and Hürzeler, 2020).
Computational steering (interactively changing parameters during simulation) has the potential to transform how we parameterize and run urban climate models. The future of urban climate may even be in the cloud! In parallel, as sensing capabilities grow, cities will become smarter through sensors embedded in the urban fabric. These future directions in UCI research and application are instrumental in achieving the vision of climate-sensitive urban design and planning.
In recent years, the focus of urban climate has shifted from UHI studies towards intra-urban hazard distribution and human thermal exposure assessments. Emerging research aims to combine climate analyses with various urban data layers to achieve more comprehensive vulnerability and inequity analyses. For example, Harlan et al. (2006) investigated heat-related health inequalities related to microclimate considering socioeconomic status, ethnicity data, and urban form and configuration descriptors. Results showed that residents in hotter neighborhoods were more vulnerable because of fewer resources to cope with heat. Servadio et al. (2019) analyzed health outcomes and air pollution exposure in Atlanta using various data layers and found that areas with majority African-American populations exhibited significantly higher exposure to poor air quality. Considering the social dimensions of atmospheric impacts in neighborhoods allows to further identify “hotspots” with vulnerable populations that are unproportionally affected by hazards. This is further enabled by novel digital communication platforms (such as public data dashboards) that use simplified data visualizations as well as easily comprehensible metrics and indicators to communicate the relevance of urban climate data for urban dwellers. The contributions of UCI to public engagement not only bridge the communication gap and inform residents about the extent of urban climate challenges, but also enable people to make individual decisions that can minimize exposure to environmental stressors in cities. Lastly, the emergence of “humans as sensors” and citizen science in UCI is key to not only inform urban dwellers, but also devise the most effective solutions for improving human health and wellbeing in the face of increased climate challenges.
Novel approaches always entail barriers that need to be overcome, and UCI is no exception. With respect to novel sensors and data sources, guidelines and best practices must be established to guarantee standardized methods for crowdsourcing, IoT sensing, data curation, processing, storage, and metadata documentation. In addition, long-term availability of data must be secured. While public entities have recently adopted more open data policies, citizen-science generated data are often legally owned by private companies and dependent on short-term business interests. Another emerging concern is data privacy, which needs careful consideration at the design phase of any implementation.
While big, unprecedented data sets offer exciting opportunities to better understand the Earth System, our data collection ability currently outweighs our usage and analysis capacity. Too often, available data are not activated, leaving behind unused potential. Moving forward, the focus should not only be on new data collection but also drawing meaningful insight from data sets already available. Also, with inflating raw data, processing chains require higher attention, highlighting the important role of open-source quality control packages.
Finally, as human-centric data collection through mobile devices becomes more mainstream, the digital divide must be addressed. While smart technology enables wide-scale, human-centric data collection, more affluent areas will have more access to those technologies, further contributing to urban climate inequity.
Cities are living, breathing ecosystems that include physical, socio-economical, and behavioral processes. UCI seeks to understand and respond to such complex, dynamic human-environment interactions through novel technological, methodological, and systems thinking approaches, achieving more integrated and human-centric assessments of urban climate challenges in future research and application. Moving forward, UCI will undoubtedly shape the urban climate research agenda for upcoming decades and positively impact fundamental, applied, and policy-relevant research.
Data Availability Statement
The original contributions presented in the study are included in the article/Supplementary Material, further inquiries can be directed to the corresponding author.
Author Contributions
AM conceived the idea and presented it as a keynote at EGU. All authors refined the definition of UCI, reviewed and organized literature, developed the UCI figure, and wrote and edited the final manuscript.
Funding
This research was funded by the National Science Foundation, grant number CMMI-1942805 (CAREER: Human Thermal Exposure in Cities - Novel Sensing and Modeling to Build Heat-Resilience). MD and BB are supported by the ENLIGHT project, funded by the German Research Foundation (DFG) under grant No. 437467569. Any opinions, findings, and conclusions or recommendations expressed in this material are those of the authors and do not necessarily reflect the views of the sponsoring organizations.
Conflict of Interest
The authors declare that the research was conducted in the absence of any commercial or financial relationships that could be construed as a potential conflict of interest.
Publisher’s Note
All claims expressed in this article are solely those of the authors and do not necessarily represent those of their affiliated organizations, or those of the publisher, the editors and the reviewers. Any product that may be evaluated in this article, or claim that may be made by its manufacturer, is not guaranteed or endorsed by the publisher.
References
Alvarez-Vanhard, E., Corpetti, T., and Houet, T. (2021). UAV & Satellite Synergies for Optical Remote Sensing Applications: A Literature Review. Sci. Remote Sens. 3, 100019. doi:10.1016/j.srs.2021.100019
Amani, M., Ghorbanian, A., Ahmadi, S. A., Kakooei, M., Moghimi, A., Mirmazloumi, S. M., et al. (2020). Google Earth Engine Cloud Computing Platform for Remote Sensing Big Data Applications: A Comprehensive Review. IEEE J. Sel. Top. Appl. Earth Obs. Remote Sens. 13, 5326–5350. doi:10.1109/JSTARS.2020.3021052
Aminipouri, M., Knudby, A. J., Krayenhoff, E. S., Zickfeld, K., and Middel, A. (2019). Modelling the Impact of Increased Street Tree Cover on Mean Radiant Temperature across Vancouver's Local Climate Zones. Urban For. Urban Green. 39, 9–17. doi:10.1016/j.ufug.2019.01.016
Apte, J. S., Messier, K. P., Gani, S., Brauer, M., Kirchstetter, T. W., Lunden, M. M., et al. (2017). High-Resolution Air Pollution Mapping with Google Street View Cars: Exploiting Big Data. Environ. Sci. Technol. 51, 6999–7008. doi:10.1021/acs.est.7b00891
Arellana, J., Saltarín, M., Larrañaga, A. M., González, V. I., and Henao, C. A. (2020). Developing an Urban Bikeability Index for Different Types of Cyclists as a Tool to Prioritise Bicycle Infrastructure Investments. Transp. Res. Part A Policy Pract. 139, 310–334. doi:10.1016/j.tra.2020.07.010
Ariza-Porras, C., Bravo, G., Villamizar, M., Moreno, A., Castro, H., Galindo, G., et al. (2017). CDCol: A Geoscience Data Cube that Meets Colombian Needs. Commun. Comput. Inf. Sci. 735, 87–99. doi:10.1007/978-3-319-66562-7_7/FIGURES/3
Bai, X., Dawson, R. J., Ürge-Vorsatz, D., Delgado, G. C., Salisu Barau, A., Dhakal, S., et al. (2018). Six Research Priorities for Cities and Climate Change. Nature 555, 23–25. doi:10.1038/d41586-018-02409-z
Balaji, V., Taylor, K. E., Juckes, M., Lawrence, B. N., Durack, P. J., Lautenschlager, M., et al. (2018). Requirements for a Global Data Infrastructure in Support of Cmip6. Geosci. Model Dev. 11, 3659–3680. doi:10.5194/gmd-11-3659-2018
Bárdossy, A., Seidel, J., and El Hachem, A. (2021). The Use of Personal Weather Station Observations to Improve Precipitation Estimation and Interpolation. Hydrol. Earth Syst. Sci. 25, 583–601. doi:10.5194/HESS-25-583-2021
Bayomi, N., Nagpal, S., Rakha, T., and Fernandez, J. E. (2021). Building Envelope Modeling Calibration Using Aerial Thermography. Energy Build. 233, 110648. doi:10.1016/j.enbuild.2020.110648
Bechtel, B., Alexander, P., Böhner, J., Ching, J., Conrad, O., Feddema, J., et al. (2015). Mapping Local Climate Zones for a Worldwide Database of the Form and Function of Cities. Ijgi 4, 199–219. doi:10.3390/ijgi4010199
Bechtel, B., Alexander, P. J., Beck, C., Böhner, J., Brousse, O., Ching, J., et al. (2019a). Generating WUDAPT Level 0 Data - Current Status of Production and Evaluation. Urban Clim. 27, 24–45. doi:10.1016/j.uclim.2018.10.001
Bechtel, B., and Daneke, C. (2012). Classification of Local Climate Zones Based on Multiple Earth Observation Data. IEEE J. Sel. Top. Appl. Earth Obs. Remote Sens. 5, 1191–1202. doi:10.1109/JSTARS.2012.2189873
Bechtel, B., Demuzere, M., Mills, G., Zhan, W., Sismanidis, P., Small, C., et al. (2019b). SUHI Analysis Using Local Climate Zones-A Comparison of 50 Cities. Urban Clim. 28, 100451. doi:10.1016/j.uclim.2019.01.005
Bell, S., Cornford, D., and Bastin, L. (2015). How Good Are Citizen Weather Stations? Addressing a Biased Opinion. Weather 70, 75–84. doi:10.1002/wea.2316
Benz, S. A., Bayer, P., and Blum, P. (2017). Global Patterns of Shallow Groundwater Temperatures. Environ. Res. Lett. 12, 034005. doi:10.1088/1748-9326/aa5fb0
Berriel, R. F., Rossi, F. S., de Souza, A. F., and Oliveira-Santos, T. (2017). Automatic Large-Scale Data Acquisition via Crowdsourcing for Crosswalk Classification: A Deep Learning Approach. Comput. Graph. 68, 32–42. doi:10.1016/j.cag.2017.08.004
Bonczak, B., and Kontokosta, C. E. (2019). Large-scale Parameterization of 3D Building Morphology in Complex Urban Landscapes Using Aerial LiDAR and City Administrative Data. Comput. Environ. Urban Syst. 73, 126–142. doi:10.1016/j.compenvurbsys.2018.09.004
Broadbent, A. M., Krayenhoff, E. S., and Georgescu, M. (2020). The Motley Drivers of Heat and Cold Exposure in 21st Century US Cities. Proc. Natl. Acad. Sci. U.S.A. 117, 21108–21117. doi:10.1073/pnas.2005492117
Bröring, A., Remke, A., Stasch, C., Autermann, C., Rieke, M., and Möllers, J. (2015). enviroCar: A Citizen Science Platform for Analyzing and Mapping Crowd-Sourced Car Sensor Data. Trans. GIS 19, 362–376. doi:10.1111/tgis.12155
Cabrera, A. N., Droste, A., Heusinkveld, B. G., and Steeneveld, G.-J. (2021). The Potential of a Smartphone as an Urban Weather Station-An Exploratory Analysis. Front. Environ. Sci. 9, 344. doi:10.3389/fenvs.2021.673937
Caluwaerts, S., Top, S., Vergauwen, T., Wauters, G., De Ridder, K., Hamdi, R., et al. (2021). Engaging Schools to Explore Meteorological Observational Gaps. Bull. Am. Meteorol. Soc. 102, E1126–E1132. doi:10.1175/BAMS-D-20-0051.1
Camara, G., Assis, L. F., Ribeiro, G., Ferreira, K. R., Llapa, E., Vinhas, L., et al. (20162016). Big Earth Observation Data Analytics. Proc. 5th ACM SIGSPATIAL Int. Work. Anal. Big Geospatial Data, BigSpatial, 1–6. doi:10.1145/3006386.3006393
Chakraborty, T., and Lee, X. (2019). A Simplified Urban-Extent Algorithm to Characterize Surface Urban Heat Islands on a Global Scale and Examine Vegetation Control on Their Spatiotemporal Variability. Int. J. Appl. Earth Observation Geoinformation 74, 269–280. doi:10.1016/j.jag.2018.09.015
Chapman, L., Bell, C., and Bell, S. (2017a). Can the Crowdsourcing Data Paradigm Take Atmospheric Science to a New Level? A Case Study of the Urban Heat Island of London Quantified Using Netatmo Weather Stations. Int. J. Climatol. 37, 3597–3605. doi:10.1002/joc.4940
Chapman, S., Watson, J. E. M., Salazar, A., Thatcher, M., and McAlpine, C. A. (2017b). The Impact of Urbanization and Climate Change on Urban Temperatures: a Systematic Review. Landsc. Ecol. 32, 1921–1935. doi:10.1007/s10980-017-0561-4
Chavan, G., and Momin, B. (20172017). An Integrated Approach for Weather Forecasting over Internet of Things: A Brief Review. Proc. Int. Conf. IoT Soc. Mob. Anal. Cloud, I-SMAC, 83–88. doi:10.1109/I-SMAC.2017.8058291
Cheng, G., Yang, C., Yao, X., Guo, L., and Han, J. (2018). When Deep Learning Meets Metric Learning: Remote Sensing Image Scene Classification via Learning Discriminative CNNs. IEEE Trans. Geosci. Remote Sens. 56, 2811–2821. doi:10.1109/TGRS.2017.2783902
Cheng, Y. L., Lim, M. H., and Hui, K. H. (2022). Impact of Internet of Things Paradigm towards Energy Consumption Prediction: A Systematic Literature Review. Sustain. Cities Soc. 78, 103624. doi:10.1016/j.scs.2021.103624
Chi, M., Plaza, A., Benediktsson, J. A., Sun, Z., Shen, J., and Zhu, Y. (2016). Big Data for Remote Sensing: Challenges and Opportunities. Proc. IEEE 104, 2207–2219. doi:10.1109/JPROC.2016.2598228
Chilson, P. B., Bell, T. M., Brewster, K. A., Britto Hupsel de Azevedo, G., Carr, F. H., Carson, K., et al. (2019). Moving towards a Network of Autonomous UAS Atmospheric Profiling Stations for Observations in the Earth's Lower Atmosphere: The 3D Mesonet Concept. Sensors 19, 2720. doi:10.3390/s19122720
Ching, J., Aliaga, D., Mills, G., Masson, V., See, L., Neophytou, M., et al. (2019a). Pathway Using WUDAPT's Digital Synthetic City Tool towards Generating Urban Canopy Parameters for Multi-Scale Urban Atmospheric Modeling. Urban Clim. 30, 100459. doi:10.1016/j.uclim.2019.100527
Ching, J., Aliaga, D., Mills, G., Masson, V., See, L., Neophytou, M., et al. (2019b). Pathway Using WUDAPT's Digital Synthetic City Tool towards Generating Urban Canopy Parameters for Multi-Scale Urban Atmospheric Modeling. Urban Clim. 28, 100459. doi:10.1016/j.uclim.2019.100459
Ching, J., Mills, G., Bechtel, B., See, L., Feddema, J., Wang, X., et al. (2018). WUDAPT: An Urban Weather, Climate, and Environmental Modeling Infrastructure for the Anthropocene. Bull. Am. Meteorol. Soc. 99, 1907–1924. doi:10.1175/BAMS-D-16-0236.1
Clark, M. R., Webb, J. D. C., and Kirk, P. J. (2018). Fine-scale Analysis of a Severe Hailstorm Using Crowd-Sourced and Conventional Observations. Mater. Apps 25, 472–492. doi:10.1002/met.1715
Couvreux, F., Hourdin, F., Williamson, D., Roehrig, R., Volodina, V., Villefranque, N., et al. (2021). Process‐Based Climate Model Development Harnessing Machine Learning: I. A Calibration Tool for Parameterization Improvement. J. Adv. Model. Earth Syst. 13, e2020MS002217. doi:10.1029/2020MS002217
Creutzig, F., Lohrey, S., Bai, X., Baklanov, A., Dawson, R., Dhakal, S., et al. (2019). Upscaling Urban Data Science for Global Climate Solutions. Glob. Sustain. 2. doi:10.1017/sus.2018.16
De Vos, L., Leijnse, H., Overeem, A., and Uijlenhoet, R. (2017). The Potential of Urban Rainfall Monitoring with Crowdsourced Automatic Weather Stations in Amsterdam. Hydrol. Earth Syst. Sci. 21, 765–777. doi:10.5194/hess-21-765-2017
de Vos, L. W., Droste, A. M., Zander, M. J., Overeem, A., Leijnse, H., Heusinkveld, B. G., et al. (2020). Hydrometeorological Monitoring Using Opportunistic Sensing Networks in the Amsterdam Metropolitan Area. Bull. Am. Meteorol. Soc. 101, E167–E185. doi:10.1175/BAMS-D-19-0091.1
Dembski, F., Wössner, U., Letzgus, M., Ruddat, M., and Yamu, C. (2020). Urban Digital Twins for Smart Cities and Citizens: The Case Study of Herrenberg, Germany. Sustainability 202012, 2307. doi:10.3390/SU12062307
Demuzere, M., Bechtel, B., Middel, A., and Mills, G. (2019a). Mapping Europe into Local Climate Zones. PLoS One 14, e0214474. doi:10.1371/journal.pone.0214474
Demuzere, M., Bechtel, B., and Mills, G. (2019b). Global Transferability of Local Climate Zone Models. Urban Clim. 27, 46–63. doi:10.1016/j.uclim.2018.11.001
Demuzere, M., Hankey, S., Mills, G., Zhang, W., Lu, T., and Bechtel, B. (2020). Combining Expert and Crowd-Sourced Training Data to Map Urban Form and Functions for the Continental US. Sci. Data 7, 1–13. doi:10.1038/s41597-020-00605-z
Demuzere, M., Kittner, J., and Bechtel, B. (2021). LCZ Generator: A Web Application to Create Local Climate Zone Maps. Front. Environ. Sci. 9, 637455. doi:10.3389/fenvs.2021.637455
Demuzere, M., Kittner, J., Martilli, A., Mills, G., Moede, C., Stewart, I. D., et al. (2022). A Global Map of Local Climate Zones to Support Earth System Modelling and Urban Scale Environmental Science. Earth Syst. Sci. Data Discuss. [Preprint]. doi:10.5194/essd-2022-92
deSouza, P., Anjomshoaa, A., Duarte, F., Kahn, R., Kumar, P., and Ratti, C. (2020). Air Quality Monitoring Using Mobile Low-Cost Sensors Mounted on Trash-Trucks: Methods Development and Lessons Learned. Sustain. Cities Soc. 60, 102239. doi:10.1016/j.scs.2020.102239
Dirksen, M., Ronda, R. J., Theeuwes, N. E., and Pagani, G. A. (2019). Sky View Factor Calculations and its Application in Urban Heat Island Studies. Urban Clim. 30, 100498. doi:10.1016/j.uclim.2019.100498
Dissegna, M. A., Yin, T., Wei, S., Richards, D., and Grêt-Regamey, A. (2019). 3-D Reconstruction of an Urban Landscape to Assess the Influence of Vegetation in the Radiative Budget. Forests 10, 700. doi:10.3390/f10080700
Droste, A. M., Heusinkveld, B. G., Fenner, D., and Steeneveld, G. J. (2020). Assessing the Potential and Application of Crowdsourced Urban Wind Data. QJR Meteorol. Soc. 146, 2671–2688. doi:10.1002/qj.3811
Droste, A. M., Pape, J. J., Overeem, A., Leijnse, H., Steeneveld, G. J., Van Delden, A. J., et al. (2017a). Crowdsourcing Urban Air Temperatures through Smartphone Battery Temperatures in São Paulo, Brazil. J. Atmos. Ocean. Technol. 34, 1853–1866. doi:10.1175/JTECH-D-16-0150.1
Droste, A. M., Pape, J. J., Overeem, A., Leijnse, H., Steeneveld, G. J., Van Delden, A. J., et al. (2017b). Crowdsourcing Urban Air Temperatures through Smartphone Battery Temperatures in São Paulo, Brazil. J. Atmos. Ocean. Technol. 34, 1853–1866. doi:10.1175/JTECH-D-16-0150.1
Duan, Q., Tan, M., Guo, Y., Wang, X., and Xin, L. (2019). Understanding the Spatial Distribution of Urban Forests in China Using Sentinel-2 Images with Google Earth Engine. Forests 10, 729. doi:10.3390/f10090729
Fauzandi, F. I., Retnowati, Y., Tamba, J. D., Husni, E. M., Yusuf, R., and Yahya, B. N. (2021). “Design and Implementation of Low Cost IoT Sensor System for Urban Heat Island Observation,” in Design and Implementation of Low Cost IoT Sensor System for Urban Heat Island Observation, 1–6. doi:10.1109/iceei52609.2021.9611099
Fenner, D., Bechtel, B., Demuzere, M., Kittner, J., and Meier, F. (2021). CrowdQC+-A Quality-Control for Crowdsourced Air-Temperature Observations Enabling World-wide Urban Climate Applications. Front. Environ. Sci. 9, 553. doi:10.3389/fenvs.2021.720747
Fenner, D., Meier, F., Bechtel, B., Otto, M., and Scherer, D. (2017). Intra and Inter 'local Climate Zone' Variability of Air Temperature as Observed by Crowdsourced Citizen Weather Stations in Berlin, Germany. metz 26, 525–547. doi:10.1127/metz/2017/0861
Ferwati, S., Skelhorn, C., Shandas, V., Voelkel, J., Shawish, A., and Ghanim, M. (2018). Analysis of Urban Heat in a Corridor Environment - the Case of Doha, Qatar. Urban Clim. 24, 692–702. doi:10.1016/j.uclim.2017.08.008
Frantzeskaki, N., McPhearson, T., Collier, M. J., Kendal, D., Bulkeley, H., Dumitru, A., et al. (2019). Nature-based Solutions for Urban Climate Change Adaptation: Linking Science, Policy, and Practice Communities for Evidence-Based Decision-Making. Bioscience 69, 455–466. doi:10.1093/biosci/biz042
Fugiglando, U., Santucci, D., Bojic, I., Santi, P., Cheung, T. C. T., Schiavon, S., et al. (2018). “Developing Personal Thermal Comfort Models for the Control of HVAC in Cars Using Field Data,” in Proceedings of 10th Windsor Conference: Rethinking Comfort, 442–450. Available at: https://escholarship.org/uc/item/7vj0s2ht (Accessed January 30, 2022).
Georgescu, M., Moustaoui, M., Mahalov, A., and Dudhia, J. (2013). Summer-time Climate Impacts of Projected Megapolitan Expansion in Arizona. Nat. Clim. Change 3, 37–41. doi:10.1038/nclimate1656
Gevaert, C. M., Persello, C., Sliuzas, R., and Vosselman, G. (2017). Informal Settlement Classification Using Point-Cloud and Image-Based Features from UAV Data. ISPRS J. Photogrammetry Remote Sens. 125, 225–236. doi:10.1016/j.isprsjprs.2017.01.017
Ghermandi, A., and Sinclair, M. (2019). Passive Crowdsourcing of Social Media in Environmental Research: A Systematic Map. Glob. Environ. Change 55, 36–47. doi:10.1016/J.GLOENVCHA.2019.02.003
Goga, K., Parodi, A., Ruiu, P., and Terzo, O. (2018). Performance Analysis of WRF Simulations in a Public Cloud and HPC Environment. Adv. Intell. Syst. Comput. 611, 384–396. doi:10.1007/978-3-319-61566-0_35
Gomes, V., Queiroz, G., and Ferreira, K. (2020). An Overview of Platforms for Big Earth Observation Data Management and Analysis. Remote Sens. 12, 1253. doi:10.3390/RS12081253
González, J. E., Ramamurthy, P., Bornstein, R. D., Chen, F., Bou-Zeid, E. R., Ghandehari, M., et al. (2021). Urban Climate and Resiliency: A Synthesis Report of State of the Art and Future Research Directions. Urban Clim. 38, 100858. doi:10.1016/J.UCLIM.2021.100858
Gorelick, N., Hancher, M., Dixon, M., Ilyushchenko, S., Thau, D., and Moore, R. (2017). Google Earth Engine: Planetary-Scale Geospatial Analysis for Everyone. Remote Sens. Environ. 202, 18–27. doi:10.1016/j.rse.2017.06.031
Grasso, V., Crisci, A., Morabito, M., Nesi, P., and Pantaleo, G. (2017). Public Crowdsensing of Heat Waves by Social Media Data. Adv. Sci. Res. 14, 217–226. doi:10.5194/asr-14-217-2017
Griew, P., Hillsdon, M., Foster, C., Coombes, E., Jones, A., and Wilkinson, P. (2013). Developing and Testing a Street Audit Tool Using Google Street View to Measure Environmental Supportiveness for Physical Activity. Int. J. Behav. Nutr. Phys. Act. 10, 1–7. doi:10.1186/1479-5868-10-103
Gröger, G., and Plümer, L. (2012). CityGML - Interoperable Semantic 3D City Models. ISPRS J. Photogrammetry Remote Sens. 71, 12–33. doi:10.1016/j.isprsjprs.2012.04.004
Hab, K., Middel, A., Ruddell, B. L., and Hagen, H. (2015). TraVis - A Visualization Framework for Mobile Transect Data Sets in an Urban Microclimate Context. IEEE Pac. Vis. Symp. 2015, 167–174. doi:10.1109/PACIFICVIS.2015.7156374
Häb, K., Ruddell, B. L., and Middel, A. (2015). Sensor Lag Correction for Mobile Urban Microclimate Measurements. Urban Clim. 14, 622–635. doi:10.1016/j.uclim.2015.10.003
Hamdi, R., Kusaka, H., Doan, Q.-V., Cai, P., He, H., Luo, G., et al. (2020). The State-Of-The-Art of Urban Climate Change Modeling and Observations. Earth Syst. Environ. 4, 631–646. doi:10.1007/s41748-020-00193-3
Hammerberg, K., Brousse, O., Martilli, A., and Mahdavi, A. (2018). Implications of Employing Detailed Urban Canopy Parameters for Mesoscale Climate Modelling: a Comparison between WUDAPT and GIS Databases over Vienna, Austria. Int. J. Climatol. 38, e1241–e1257. doi:10.1002/joc.5447
Happle, G., Wilhelm, E., Fonseca, J. A., and Schlueter, A. (2017). Determining Air-Conditioning Usage Patterns in Singapore from Distributed, Portable Sensors. Energy Procedia 122, 313–318. doi:10.1016/j.egypro.2017.07.328
Hara, K., Le, V., and Froehlich, J. (2013). Combining Crowdsourcing and Google Street View to Identify Street-Level Accessibility Problems. Conf. Hum. Factors Comput. Syst. - Proc., 631–640. doi:10.1145/2470654.2470744
Harlan, S. L., Brazel, A. J., Prashad, L., Stefanov, W. L., and Larsen, L. (2006). Neighborhood Microclimates and Vulnerability to Heat Stress. Soc. Sci. Med. 63, 2847–2863. doi:10.1016/j.socscimed.2006.07.030
Heusinkveld, B. G., Steeneveld, G. J., Van Hove, L. W. A., Jacobs, C. M. J., and Holtslag, A. A. M. (2014). Spatial Variability of the Rotterdam Urban Heat Island as Influenced by Urban Land Use. J. Geophys. Res. Atmos. 119, 677–692. doi:10.1002/2012JD019399
Höfle, B., Hollaus, M., and Hagenauer, J. (2012). Urban Vegetation Detection Using Radiometrically Calibrated Small-Footprint Full-Waveform Airborne LiDAR Data. ISPRS J. Photogrammetry Remote Sens. 67, 134–147. doi:10.1016/j.isprsjprs.2011.12.003
Hourdin, F., Williamson, D., Rio, C., Couvreux, F., Roehrig, R., Villefranque, N., et al. (2021). Process‐Based Climate Model Development Harnessing Machine Learning: II. Model Calibration from Single Column to Global. J. Adv. Model. Earth Syst. 13, e2020MS002225. doi:10.1029/2020MS002225
Huang, C., Yang, J., and Jiang, P. (2018). Assessing Impacts of Urban Form on Landscape Structure of Urban Green Spaces in China Using Landsat Images Based on Google Earth Engine. Remote Sens. 10, 1569. doi:10.3390/rs10101569
Huntingford, C., Jeffers, E. S., Bonsall, M. B., Christensen, H. M., Lees, T., and Yang, H. (2019). Machine Learning and Artificial Intelligence to Aid Climate Change Research and Preparedness. Environ. Res. Lett. 14, 124007. doi:10.1088/1748-9326/ab4e55
Iannelli, G., and Dell’Acqua, F. (2017). Extensive Exposure Mapping in Urban Areas through Deep Analysis of Street-Level Pictures for Floor Count Determination. Urban Sci. 1, 16. doi:10.3390/urbansci1020016
Ilieva, R. T., and McPhearson, T. (2018). Social-media Data for Urban Sustainability. Nat. Sustain. 1, 553–565. doi:10.1038/s41893-018-0153-6
Irwin, A. (2018). No PhDs Needed: How Citizen Science Is Transforming Research. Nature 562, 480–482. doi:10.1038/d41586-018-07106-5
Jayathissa, P., Quintana, M., Sood, T., Nazarian, N., and Miller, C. (2019). Is Your Clock-Face Cozie? A Smartwatch Methodology for the In-Situ Collection of Occupant Comfort Data. J. Phys. Conf. Ser. 1343, 012145. doi:10.1088/1742-6596/1343/1/012145
Jin, L., Schubert, S., Fenner, D., Meier, F., and Schneider, C. (2021). Integration of a Building Energy Model in an Urban Climate Model and its Application. Boundary-Layer Meteorol. 178, 249–281. doi:10.1007/s10546-020-00569-y
Jones, N. (2017). How Machine Learning Could Help to Improve Climate Forecasts. Nature 548, 379. doi:10.1038/548379a
Kang, L., Poslad, S., Wang, W., Li, X., Zhang, Y., and Wang, C. (20162016). A Public Transport Bus as a Flexible Mobile Smart Environment Sensing Platform for IoT. Proc. - 12th Int. Conf. Intell. Environ. IE, 1–8. doi:10.1109/IE.2016.10
Keralis, J. M., Javanmardi, M., Khanna, S., Dwivedi, P., Huang, D., Tasdizen, T., et al. (2020). Health and the Built Environment in United States Cities: Measuring Associations Using Google Street View-Derived Indicators of the Built Environment. BMC Public Health 20, 1–10. doi:10.1186/s12889-020-8300-1
Klingberg, J., Konarska, J., Lindberg, F., Johansson, L., and Thorsson, S. (2017). Mapping Leaf Area of Urban Greenery Using Aerial LiDAR and Ground-Based Measurements in Gothenburg, Sweden. Urban For. Urban Green. 26, 31–40. doi:10.1016/j.ufug.2017.05.011
Konrad, T. G., Hill, M. L., Rowland, J. R., and Meyer, J. H. (1970). A Small, Radio-Controlled Aircraft as A Platform for Meteorlogical Sensors. Apl. Tech. Dig., 11–19.
Krayenhoff, E. S., Moustaoui, M., Broadbent, A. M., Gupta, V., and Georgescu, M. (2018). Diurnal Interaction between Urban Expansion, Climate Change and Adaptation in US Cities. Nat. Clim. Change 8, 1097–1103. doi:10.1038/s41558-018-0320-9
Kuras, E. R., Richardson, M. B., Calkins, M. M., Ebi, K. L., Hess, J. J., Kintziger, K. W., et al. (2017). Opportunities and Challenges for Personal Heat Exposure Research. Environ. Health Perspect. 125, 085001. doi:10.1289/EHP556
Kuuluvainen, H., Poikkimäki, M., Järvinen, A., Kuula, J., Irjala, M., Dal Maso, M., et al. (2018). Vertical Profiles of Lung Deposited Surface Area Concentration of Particulate Matter Measured with a Drone in a Street Canyon. Environ. Pollut. 241, 96–105. doi:10.1016/j.envpol.2018.04.100
Lafarge, F. (2015). “Some New Research Directions to Explore in Urban Reconstruction,” 2015 Joint Urban Remote Sensing Event (JURSE), 1–4. doi:10.1109/JURSE.2015.7120488
Lassen, N., Josefsen, T., and Goia, F. (2021). Design and In-Field Testing of a Multi-Level System for Continuous Subjective Occupant Feedback on Indoor Climate. Build. Environ. 189, 107535. doi:10.1016/j.buildenv.2020.107535
Lee, A., Jeong, S., Joo, J., Park, C.-R., Kim, J., and Kim, S. (2021). Potential Role of Urban Forest in Removing PM2.5: A Case Study in Seoul by Deep Learning with Satellite Data. Urban Clim. 36, 100795. doi:10.1016/j.uclim.2021.100795
Leuenberger, D., Haefele, A., Omanovic, N., Fengler, M., Martucci, G., Calpini, B., et al. (2020). Improving High-Impact Numerical Weather Prediction with Lidar and Drone Observations. Bull. Am. Meteorol. Soc. 101, E1036–E1051. doi:10.1175/BAMS-D-19-0119.1
Li, M., Koks, E., Taubenböck, H., and van Vliet, J. (2020a). Continental-scale Mapping and Analysis of 3D Building Structure. Remote Sens. Environ. 245, 111859. doi:10.1016/j.rse.2020.111859
Li, X., Ratti, C., and Seiferling, I. (2017). Mapping Urban Landscapes along Streets Using Google Street View. Lect. Notes Geoinf. Cartogr., 341–356. doi:10.1007/978-3-319-57336-6_24
Li, X., and Wang, G. (2021). Examining Runner's Outdoor Heat Exposure Using Urban Microclimate Modeling and GPS Trajectory Mining. Comput. Environ. Urban Syst. 89, 101678. doi:10.1016/j.compenvurbsys.2021.101678
Li, Y., Chen, Y., Rajabifard, A., Khoshelham, K., and Aleksandrov, M. (2018). Estimating Building Age from Google Street View Images Using Deep Learning. Leibniz Int. Proc. Inf. LIPIcs 114. doi:10.4230/LIPIcs.GIScience.2018.40
Li, Y., Fowler, H. J., Argüeso, D., Blenkinsop, S., Evans, J. P., Lenderink, G., et al. (2020b). Strong Intensification of Hourly Rainfall Extremes by Urbanization. Geophys. Res. Lett. 47, e2020GL088758. doi:10.1029/2020GL088758
Li, Y., Yu, M., Xu, M., Yang, J., Sha, D., Liu, Q., et al. (2020c). Big Data and Cloud Computing. Man. Digit. Earth, 325–355. doi:10.1007/978-981-32-9915-3_9
Lindberg, F., Grimmond, C. S. B., Gabey, A., Huang, B., Kent, C. W., Sun, T., et al. (2018). Urban Multi-Scale Environmental Predictor (UMEP): An Integrated Tool for City-Based Climate Services. Environ. Model. Softw. 99, 70–87. doi:10.1016/j.envsoft.2017.09.020
Lu, Y. (2019). Using Google Street View to Investigate the Association between Street Greenery and Physical Activity. Landsc. Urban Plan. 191, 103435. doi:10.1016/j.landurbplan.2018.08.029
Luo, M., Hong, Y., and Pantelic, J. (2021). Determining Building Natural Ventilation Potential via IoT-Based Air Quality Sensors. Front. Environ. Sci. 9, 144. doi:10.3389/fenvs.2021.634570
Ma, K., Tang, X., Ren, Y., and Wang, Y. (2019). Research on the Spatial Pattern Characteristics of the Taihu Lake “Dock Village” Based on Microclimate: A Case Study of Tangli Village. Sustainability 11, 368. doi:10.3390/su11020368
Mandement, M., and Caumont, O. (2020). Contribution of Personal Weather Stations to the Observation of Deep-Convection Features Near the Ground. Nat. Hazards Earth Syst. Sci. 20, 299–322. doi:10.5194/nhess-20-299-2020
Mass, C. F., and Madaus, L. E. (2014). Surface Pressure Observations from Smartphones: A Potential Revolution for High-Resolution Weather Prediction? Bull. Am. Meteorol. Soc. 95, 1343–1349. doi:10.1175/BAMS-D-13-00188.1
Masson, V., Heldens, W., Bocher, E., Bonhomme, M., Bucher, B., Burmeister, C., et al. (2020a). City-descriptive Input Data for Urban Climate Models: Model Requirements, Data Sources and Challenges. Urban Clim. 31, 100536. doi:10.1016/j.uclim.2019.100536
Masson, V., Lemonsu, A., Hidalgo, J., and Voogt, J. (2020b). Urban Climates and Climate Change. Annu. Rev. Environ. Resour. 45, 411–444. doi:10.1146/annurev-environ-012320-083623
Meier, F., Fenner, D., Grassmann, T., Otto, M., and Scherer, D. (2017). Crowdsourcing Air Temperature from Citizen Weather Stations for Urban Climate Research. Urban Clim. 19, 170–191. doi:10.1016/j.uclim.2017.01.006
Middel, A., AlKhaled, S., Schneider, F. A., Hagen, B., and Coseo, P. (2021). 50 Grades of Shade. Bull. Am. Meteorol. Soc., 1–35. doi:10.1175/bams-d-20-0193.1
Middel, A., Häb, K., Brazel, A. J., Martin, C. A., and Guhathakurta, S. (2014). Impact of Urban Form and Design on Mid-afternoon Microclimate in Phoenix Local Climate Zones. Landsc. Urban Plan. 122, 16–28. doi:10.1016/j.landurbplan.2013.11.004
Middel, A., and Krayenhoff, E. S. (2019). Micrometeorological Determinants of Pedestrian Thermal Exposure during Record-Breaking Heat in Tempe, Arizona: Introducing the MaRTy Observational Platform. Sci. Total Environ. 687, 137–151. doi:10.1016/j.scitotenv.2019.06.085
Middel, A., Lukasczyk, J., Maciejewski, R., Demuzere, M., and Roth, M. (2018). Sky View Factor Footprints for Urban Climate Modeling. Urban Clim. 25, 120–134. doi:10.1016/j.uclim.2018.05.004
Middel, A., Lukasczyk, J., Zakrzewski, S., Arnold, M., and Maciejewski, R. (2019). Urban Form and Composition of Street Canyons: A Human-Centric Big Data and Deep Learning Approach. Landsc. Urban Plan. 183, 122–132. doi:10.1016/j.landurbplan.2018.12.001
Mills, G. (2014). Urban Climatology: History, Status and Prospects. Urban Clim. 10, 479–489. doi:10.1016/j.uclim.2014.06.004
Monnot, B., Wilhelm, E., Piliouras, G., Zhou, Y., Dahlmeier, D., Lu, H. Y., et al. (2016). Inferring Activities and Optimal Trips: Lessons from Singapore's National Science Experiment. Adv. Intell. Syst. Comput. 426, 247–264. doi:10.1007/978-3-319-29643-2_19
Monteleoni, C., Schmidt, G. A., Alexander, F., Niculescu-Mizil, A., Steinhaeuser, K., Tippett, M., et al. (2016). Climate Informatics. Comput. Intell. Data Anal. Sustain. Dev., 81–126. doi:10.1201/b14799-8
Mooney, S. J., DiMaggio, C. J., Lovasi, G. S., Neckerman, K. M., Bader, M. D. M., Teitler, J. O., et al. (2016). Use of Google Street View to Assess Environmental Contributions to Pedestrian Injury. Am. J. Public Health 106, 462–469. doi:10.2105/AJPH.2015.302978
Moore, F. C., and Obradovich, N. (2020). Using Remarkability to Define Coastal Flooding Thresholds. Nat. Commun. 11, 1–8. doi:10.1038/s41467-019-13935-3
Muller, C. L., Chapman, L., Johnston, S., Kidd, C., Illingworth, S., Foody, G., et al. (2015). Crowdsourcing for Climate and Atmospheric Sciences: Current Status and Future Potential. Int. J. Climatol. 35, 3185–3203. doi:10.1002/joc.4210
Napoly, A., Grassmann, T., Meier, F., and Fenner, D. (2018). Development and Application of a Statistically-Based Quality Control for Crowdsourced Air Temperature Data. Front. Earth Sci. 6, 118. doi:10.3389/feart.2018.00118
Nazarian, N., and Lee, J. K. (2021). Personal Assessment of Urban Heat Exposure: A Systematic Review. Environ. Res. Lett. 16, 033005. doi:10.1088/1748-9326/abd350
Nazarian, N., Liu, S., Kohler, M., Lee, J. K. W., Miller, C., Chow, W. T. L., et al. (2021). Project Coolbit: Can Your Watch Predict Heat Stress and Thermal Comfort Sensation? Environ. Res. Lett. 16, 034031. doi:10.1088/1748-9326/abd130
Nice, K. A., Wijnands, J. S., Middel, A., Wang, J., Qiu, Y., Zhao, N., et al. (2020). Sky Pixel Detection in Outdoor Imagery Using an Adaptive Algorithm and Machine Learning. Urban Clim. 31, 100572. doi:10.1016/j.uclim.2019.100572
Nipen, T. N., Seierstad, I. A., Lussana, C., Kristiansen, J., and Hov, Ø. (2020). Adopting Citizen Observations in Operational Weather Prediction. Bull. Am. Meteorol. Soc. 101, E43–E57. doi:10.1175/BAMS-D-18-0237.1
Nishida, G., Bousseau, A., and Aliaga, D. G. (2018). Procedural Modeling of a Building from a Single Image. Comput. Graph. Forum 37, 415–429. doi:10.1111/cgf.13372
Núñez-Peiró, M., Sánchez-Guevara Sánchez, C., and Neila González, F. J. (2021). Hourly Evolution of Intra-urban Temperature Variability across the Local Climate Zones. The Case of Madrid. Urban Clim. 39, 100921. doi:10.1016/j.uclim.2021.100921
Oke, T. R., Mills, G., Christen, A., and Voogt, J. A. (2017). Urban Climates. Online Publication: Cambridge University Press, 1–525. doi:10.1017/9781139016476
Okokon, E. O., Yli-Tuomi, T., Turunen, A. W., Taimisto, P., Pennanen, A., Vouitsis, I., et al. (2017). Particulates and Noise Exposure during Bicycle, Bus and Car Commuting: A Study in Three European Cities. Environ. Res. 154, 181–189. doi:10.1016/j.envres.2016.12.012
Open Data Cube (2022). Open Source. Available at: https://www.opendatacube.org/ (Accessed January 30, 2022).
Overeem, A., R. Robinson, J. C., Steeneveld, G. J., P. Horn, B. K., Uijlenhoet, R., and Uijlenhoet, R. (2013). Crowdsourcing Urban Air Temperatures from Smartphone Battery Temperatures. Geophys. Res. Lett. 40, 4081–4085. doi:10.1002/grl.50786
Pal, S., and Sharma, P. (2021). A Review of Machine Learning Applications in Land Surface Modeling. Earth 2, 174–190. doi:10.3390/earth2010011
Palacios Temprano, J., Eichholtz, P., Willeboordse, M., and Kok, N. (2020). Indoor Environmental Quality and Learning Outcomes: Protocol on Large-Scale Sensor Deployment in Schools. BMJ Open 10, e031233. doi:10.1136/bmjopen-2019-031233
Parlow, E., and Foken, T. (2021). Ground-based Mobile Measurement Systems. Springer Handbooks, 1351–1367. doi:10.1007/978-3-030-52171-4_50Ground-based Mobile Measurement Systems
Pebesma, E., Wagner, W., Schramm, M., Von Beringe, A., Paulik, C., Neteler, M., et al. (2017). OpenEO - a Common, Open Source Interface between Earth Observation Data Infrastructures and Front-End Applications. 57. [Accessed January 31, 2022]. doi:10.5281/zenodo.1065474
Peng, S., Piao, S., Ciais, P., Friedlingstein, P., Ottle, C., Bréon, F.-M., et al. (2012). Surface Urban Heat Island across 419 Global Big Cities. Environ. Sci. Technol. 46, 696–703. doi:10.1021/es2030438
Pfautsch, S., and Tjoelker, A. R. (2020). The Impact of Surface Cover and Tree Canopy on Air Temperature in Western Sydney 140. doi:10.26183/BK6D-1466
Potgieter, J., Nazarian, N., Lipson, M. J., Hart, M. A., Ulpiani, G., Morrison, W., et al. (2021). Combining High-Resolution Land Use Data with Crowdsourced Air Temperature to Investigate Intra-urban Microclimate. Front. Environ. Sci. 9, 385. doi:10.3389/fenvs.2021.720323
Rajkovich, N., and Larsen, L. (2016). A Bicycle-Based Field Measurement System for the Study of Thermal Exposure in Cuyahoga County, Ohio, USA. Ijerph 13, 159. doi:10.3390/ijerph13020159
Rakha, T., and Gorodetsky, A. (2018). Review of Unmanned Aerial System (UAS) Applications in the Built Environment: Towards Automated Building Inspection Procedures Using Drones. Automation Constr. 93, 252–264. doi:10.1016/j.autcon.2018.05.002
Reichstein, M., Camps-Valls, G., Stevens, B., Jung, M., Denzler, J., Carvalhais, N., et al. (2019). Deep Learning and Process Understanding for Data-Driven Earth System Science. Nature 566, 195–204. doi:10.1038/s41586-019-0912-1
Schneider, P., Castell, N., Vogt, M., Dauge, F. R., Lahoz, W. A., and Bartonova, A. (2017). Mapping Urban Air Quality in Near Real-Time Using Observations from Low-Cost Sensors and Model Information. Environ. Int. 106, 234–247. doi:10.1016/j.envint.2017.05.005
Schrotter, G., and Hürzeler, C. (2020). The Digital Twin of the City of Zurich for Urban Planning. Pfg 88, 99–112. doi:10.1007/S41064-020-00092-2/FIGURES/14
See, L., Mooney, P., Foody, G., Bastin, L., Comber, A., Estima, J., et al. (2016). Crowdsourcing, Citizen Science or Volunteered Geographic Information? the Current State of Crowdsourced Geographic Information. ISPRS Int. J. Geo-Information 5, 55. doi:10.3390/ijgi5050055
Seidel, J., Ketzler, G., Bechtel, B., Thies, B., Philipp, A., Böhner, J., et al. (2016). Mobile Measurement Techniques for Local and Micro-scale Studies in Urban and Topo-Climatology. Erde 147, 15–39. doi:10.12854/erde-147-2
SEPAL (2022). FAO. Available at: https://github.com/openforis/sepal (Accessed January 30, 2022).
Servadio, J. L., Lawal, A. S., Davis, T., Bates, J., Russell, A. G., Ramaswami, A., et al. (2019). Demographic Inequities in Health Outcomes and Air Pollution Exposure in the Atlanta Area and its Relationship to Urban Infrastructure. J. Urban Health 96, 219–234. doi:10.1007/S11524-018-0318-7/TABLES/4
Sinergise (2018). Sentinel Hub. Eo Brows. Available at: https://apps.sentinel-hub.com/eo-browser/?lat=41.9000&lng=12.5000&zoom=10 (Accessed January 30, 2022).
Soille, P., Burger, A., De Marchi, D., Kempeneers, P., Rodriguez, D., Syrris, V., et al. (2018). A Versatile Data-Intensive Computing Platform for Information Retrieval from Big Geospatial Data. Future Gener. Comput. Syst. 81, 30–40. doi:10.1016/j.future.2017.11.007
Stewart, I. D., Krayenhoff, E. S., Voogt, J. A., Lachapelle, J. A., Allen, M. A., and Broadbent, A. M. (2021). Time Evolution of the Surface Urban Heat Island. Earth's Future 9, e2021EF002178. doi:10.1029/2021EF002178
Stewart, I. D., and Oke, T. R. (2012). Local Climate Zones for Urban Temperature Studies. Bull. Am. Meteorol. Soc. 93, 1879–1900. doi:10.1175/BAMS-D-11-00019.1
Stewart, I. D. (2019). Why Should Urban Heat Island Researchers Study History? Urban Clim. 30, 100484. doi:10.1016/j.uclim.2019.100484
Sudmanns, M., Tiede, D., Lang, S., Bergstedt, H., Trost, G., Augustin, H., et al. (2019). Big Earth Data: Disruptive Changes in Earth Observation Data Management and Analysis? 13, 832–850. doi:10.1080/17538947.2019.1585976
Triscone, G., Abdennadher, N., Balistreri, C., Donzé, O., Greco, D., Haas, P., et al. (2016). Computational Fluid Dynamics as a Tool to Predict the Air Pollution Dispersion in a Neighborhood - a Research Project to Improve the Quality of Life in Cities. Int. J. SDP 11, 546–557. doi:10.2495/SDP-V11-N4-546-557
Ulpiani, G., Nazarian, N., Zhang, F., and Pettit, C. J. (2021). Towards a Living Lab for Enhanced Thermal Comfort and Air Quality: Analyses of Standard Occupancy, Weather Extremes, and COVID-19 Pandemic. Front. Environ. Sci. 9, 556. doi:10.3389/fenvs.2021.725974
Urech, P. R. W., Dissegna, M. A., Girot, C., and Grêt-Regamey, A. (2020). Point Cloud Modeling as a Bridge between Landscape Design and Planning. Landsc. Urban Plan. 203, 103903. doi:10.1016/j.landurbplan.2020.103903
Varentsov, M., Fenner, D., Meier, F., Samsonov, T., and Demuzere, M. (2021). Quantifying Local and Mesoscale Drivers of the Urban Heat Island of Moscow with Reference and Crowdsourced Observations. Front. Environ. Sci. 9, 543. doi:10.3389/fenvs.2021.716968
Venter, Z. S., Brousse, O., Esau, I., and Meier, F. (2020). Hyperlocal Mapping of Urban Air Temperature Using Remote Sensing and Crowdsourced Weather Data. Remote Sens. Environ. 242, 111791. doi:10.1016/j.rse.2020.111791
Venter, Z. S., Chakraborty, T., and Lee, X. (2021). Crowdsourced Air Temperatures Contrast Satellite Measures of the Urban Heat Island and its Mechanisms. Sci. Adv. 7. doi:10.1126/sciadv.abb9569
Villa, T., Gonzalez, F., Miljievic, B., Ristovski, Z., and Morawska, L. (2016). An Overview of Small Unmanned Aerial Vehicles for Air Quality Measurements: Present Applications and Future Prospectives. Sensors 16, 1072. doi:10.3390/s16071072
Voogt, J. A., and Oke, T. R. (2003). Thermal Remote Sensing of Urban Climates. Remote Sens. Environ. 86, 370–384. doi:10.1016/S0034-4257(03)00079-8
Vos, L. W., Leijnse, H., Overeem, A., and Uijlenhoet, R. (2019). Quality Control for Crowdsourced Personal Weather Stations to Enable Operational Rainfall Monitoring. Geophys. Res. Lett. 46, 8820–8829. doi:10.1029/2019GL083731
Vulova, S., Meier, F., Fenner, D., Nouri, H., and Kleinschmit, B. (2020). Summer Nights in Berlin, Germany: Modeling Air Temperature Spatially with Remote Sensing, Crowdsourced Weather Data, and Machine Learning. IEEE J. Sel. Top. Appl. Earth Obs. Remote Sens. 13, 5074–5087. doi:10.1109/JSTARS.2020.3019696
Wang, C., Wen, C., Dai, Y., Yu, S., and Liu, M. (2020). Urban 3D Modeling with Mobile Laser Scanning: a Review. Virtual Real. Intelligent Hardw. 2, 175–212. doi:10.1016/j.vrih.2020.05.003
Wang, L., Ma, Y., Yan, J., Chang, V., and Zomaya, A. Y. (2018a). pipsCloud: High Performance Cloud Computing for Remote Sensing Big Data Management and Processing. Future Gener. Comput. Syst. 78, 353–368. doi:10.1016/j.future.2016.06.009
Wang, R., Peethambaran, J., and Chen, D. (2018b). LiDAR Point Clouds to 3-D Urban Models$:$ A Review. IEEE J. Sel. Top. Appl. Earth Obs. Remote Sens. 11, 606–627. doi:10.1109/JSTARS.2017.2781132
Wilhelm, E., Siby, S., Zhou, Y., Ashok, X. J. S., Jayasuriya, M., Foong, S., et al. (2016). Wearable Environmental Sensors and Infrastructure for Mobile Large-Scale Urban Deployment. IEEE Sensors J. 16, 8111–8123. doi:10.1109/JSEN.2016.2603158
Willems, P., Arnbjerg-Nielsen, K., Olsson, J., and Nguyen, V. T. V. (2012). Climate Change Impact Assessment on Urban Rainfall Extremes and Urban Drainage: Methods and Shortcomings. Atmos. Res. 103, 106–118. doi:10.1016/j.atmosres.2011.04.003
Wulder, M. A., Masek, J. G., Cohen, W. B., Loveland, T. R., and Woodcock, C. E. (2012). Opening the Archive: How Free Data Has Enabled the Science and Monitoring Promise of Landsat. Remote Sens. Environ. 122, 2–10. doi:10.1016/j.rse.2012.01.010
Xiaojun, C., Xianpeng, L., and Peng, X. (2015). IOT-based Air Pollution Monitoring and Forecasting System. Int. Conf. Comput. Comput. Sci. ICCCS, 257–260. doi:10.1109/ICCACS.2015.7361361
Xu, G., Zhu, X., Tapper, N., and Bechtel, B. (2019). Urban Climate Zone Classification Using Convolutional Neural Network and Ground-Level Images. Prog. Phys. Geogr. Earth Environ. 43, 410–424. doi:10.1177/0309133319837711
Yan, W. Y., Shaker, A., and El-Ashmawy, N. (2015). Urban Land Cover Classification Using Airborne LiDAR Data: A Review. Remote Sens. Environ. 158, 295–310. doi:10.1016/j.rse.2014.11.001
Yavaşlı, D. D. (2020). Drone Applications in Geography: Game of Drones. Curr. Stud. Soc. Sci. II 8, 117. Available at: https://www.researchgate.net/publication/344839834_Drone_Applications_in_Geography_Game_of_Drones (Accessed January 30, 2022).
Yin, L., and Wang, Z. (2016). Measuring Visual Enclosure for Street Walkability: Using Machine Learning Algorithms and Google Street View Imagery. Appl. Geogr. 76, 147–153. doi:10.1016/j.apgeog.2016.09.024
Yoo, C., Han, D., Im, J., and Bechtel, B. (2019). Comparison between Convolutional Neural Networks and Random Forest for Local Climate Zone Classification in Mega Urban Areas Using Landsat Images. ISPRS J. Photogrammetry Remote Sens. 157, 155–170. doi:10.1016/j.isprsjprs.2019.09.009
Young, J. C., Arthur, R., Spruce, M., and Williams, H. T. P. (2021). Social Sensing of Heatwaves. Sensors 21, 3717. doi:10.3390/s21113717
Zeng, L., Lu, J., Li, W., and Li, Y. (2018). A Fast Approach for Large-Scale Sky View Factor Estimation Using Street View Images. Build. Environ. 135, 74–84. doi:10.1016/j.buildenv.2018.03.009
Zhan, W., Chen, Y., Zhou, J., Wang, J., Liu, W., Voogt, J., et al. (2013). Disaggregation of Remotely Sensed Land Surface Temperature: Literature Survey, Taxonomy, Issues, and Caveats. Remote Sens. Environ. 131, 119–139. doi:10.1016/j.rse.2012.12.014
Zhang, D., and Woo, S. S. (2020). Real Time Localized Air Quality Monitoring and Prediction through Mobile and Fixed IoT Sensing Network. IEEE Access 8, 89584–89594. doi:10.1109/ACCESS.2020.2993547
Zhang, W., Li, W., Zhang, C., Hanink, D. M., Li, X., and Wang, W. (2017). Parcel-based Urban Land Use Classification in Megacity Using Airborne LiDAR, High Resolution Orthoimagery, and Google Street View. Comput. Environ. Urban Syst. 64, 215–228. doi:10.1016/j.compenvurbsys.2017.03.001
Zhang, X., Liu, L., Wu, C., Chen, X., Gao, Y., Xie, S., et al. (2020). Development of a Global 30 M Impervious Surface Map Using Multisource and Multitemporal Remote Sensing Datasets with the Google Earth Engine Platform. Earth Syst. Sci. Data 12, 1625–1648. doi:10.5194/essd-12-1625-2020
Zhang, Y., Middel, A., and Turner, B. L. (2019). Evaluating the Effect of 3D Urban Form on Neighborhood Land Surface Temperature Using Google Street View and Geographically Weighted Regression. Landsc. Ecol. 34, 681–697. doi:10.1007/s10980-019-00794-y
Zhao, L., Oleson, K., Bou-Zeid, E., Krayenhoff, E. S., Bray, A., Zhu, Q., et al. (2021). Global Multi-Model Projections of Local Urban Climates. Nat. Clim. Chang. 11, 152–157. doi:10.1038/s41558-020-00958-8
Zhou, Y., Wei, T., Zhu, X., and Collin, M. (2021). A Parcel-Based Deep-Learning Classification to Map Local Climate Zones from Sentinel-2 Images. IEEE J. Sel. Top. Appl. Earth Obs. Remote Sens. 14, 4194–4204. doi:10.1109/JSTARS.2021.3071577
Keywords: urban climate informatics (UCI), research agenda, novel data sources and sensors, big data, artificial intelligence
Citation: Middel A, Nazarian N, Demuzere M and Bechtel B (2022) Urban Climate Informatics: An Emerging Research Field. Front. Environ. Sci. 10:867434. doi: 10.3389/fenvs.2022.867434
Received: 01 February 2022; Accepted: 13 April 2022;
Published: 02 May 2022.
Edited by:
Marco Casazza, University of Salerno, ItalyReviewed by:
Iryna Dronova, University of California, Berkeley, United StatesLyndon Mark Olaguera, Ateneo de Manila University, Philippines
Jennifer Ann Salmond, The University of Auckland, New Zealand
Copyright © 2022 Middel, Nazarian, Demuzere and Bechtel. This is an open-access article distributed under the terms of the Creative Commons Attribution License (CC BY). The use, distribution or reproduction in other forums is permitted, provided the original author(s) and the copyright owner(s) are credited and that the original publication in this journal is cited, in accordance with accepted academic practice. No use, distribution or reproduction is permitted which does not comply with these terms.
*Correspondence: Ariane Middel, Ariane.middel@asu.edu