Effect on Soil Properties and Crop Yields to Long-Term Application of Superabsorbent Polymer and Manure
 Yonghui Yang1,2,3,4*
  Jicheng Wu1,3,4
  Yan-Lei Du5
  Cuimin Gao1,3,4
  Darrell W. S. Tang2
  Martine van der Ploeg6
- 1Institute of Plant Nutrition & Resource Environment, Henan Academy of Agricultural Sciences, Zhengzhou, China
- 2Soil Physics and Land Management Group, Wageningen University & Research, Wageningen, Netherlands
- 3Yuanyang Experimental Station of Crop Water Use, Ministry of Agriculture, Yuanyang, China
- 4Field Scientific Observation and Research Station of Water Saving Agriculture in the Yellow River Basin of Henan Province, Yuanyang, China
- 5State Key Laboratory of Grassland Agroecosystems, Institute of Arid Agroecology, School of Life Sciences, Lanzhou University, Lanzhou, China
- 6Hydrology and Quantitative Water Management Group, Wageningen University & Research, Wageningen, Netherlands
Intensive farming leads to soil degradation, and poses a serious threat to agricultural yield sustainability and soil ecology. Superabsorbent polymer (SAP) and organic manure (OM) are amendments that can remediate the soil, and improve soil structure and soil pore characteristics, thereby enhancing soil quality and promoting crop growth. These benefits may be enhanced through long-term continuous application of the amendments. X-ray computed tomography (CT) was used to determine the number, connectivity, and locations of pores (160–1,000 μm, >1,000 µm) in the soil at depths of 0–100 cm. Soil organic carbon content, proportion of water-stable macroaggregates (>0.25 mm) (WSM), soil bulk density, field water capacity, available water content, wilting point content, and saturated hydraulic conductivity were also determined. Compared to the control, long-term SAP and OM treatments significantly increased the number of 160–1,000 µm and >1,000 µm soil pores (5–20 cm depths), >1,000 µm and >160 µm soil porosity (at 0–20 cm depths), total organic carbon (10–20 cm and 40–50 cm), field water capacity (0–20 cm), available water content (0–20 cm), wilting point (10–30 cm), saturated water content (10–70 cm), saturated hydraulic conductivity (0–90 cm), and WSM (0–30 cm and 40–50 cm) while decreasing the soil bulk density (0–70 cm). Compared to OM, SAP had greater beneficial effects on the total organic carbon, soil field water capacity, available water content, saturated water content, saturated hydraulic conductivity, and WSM in soil at 0–20 cm depth. The improvements to soil quality resulted in an increase in the yields of wheat and maize. Therefore, although SAP and OM were both effective at improving soil properties and increasing the economic yield of wheat and maize, the effectiveness of SAP was greater than that of OM.
Introduction
As soils undergo cycles of farming and tillage, the soil organic carbon content decreases, while soil structures gradually worsen, which, when unmitigated, leads to a decline in soil and harvest quality (Xu et al., 2019; Giannitsopoulos et al., 2019). Soil structural and physical properties affect water availability, the nutrient uptake of crops (Giannitsopoulos et al., 2019), and soil ecology. Improved soil structure can increase soil porosity and enhance nutrient and water recycling, water availability, and biodiversity while reducing water and wind erosion (Alaoui et al., 2011). These improvements in soil quality lead to better soil conditions for crop growth and yields.
Organic manure (OM) not only increases the soil organic matter content (Pagliai et al., 2004; Celik et al., 2004), but also improves soil structure and increases the aggregate stability (Karami et al., 2012; Zhou et al., 2013; Wang et al., 2017a) while improving pore network characteristics (Jiang et al., 2018). Therefore, OM can enhance the soil’s water storage capacity (Celik et al., 2004; Lee et al., 2009; Li et al., 2010), promote soil water conservation and gas diffusion (Wang et al., 2019), and increase crop yields and water use efficiency (Bolan et al., 2003). However, Guo et al. (2019) found that OM improved soil aggregation in humid regions (acidic soil) but not in semi-humid or arid regions (basic soil). In addition, some studies even suggest that OM has a negative (Zhou et al., 2017; Guo et al., 2018) or neutral (Xie et al., 2015) effect on soil structure, and causes a decrease in soil stability. Therefore, the effect of organic fertilizer or manure on soil properties remains unclear, especially regarding long-term application.
Superabsorbent polymer (SAP) is a soil amendment technique that can improve the soil, and has been studied for several decades because of its unique properties (Busscher et al., 2009; Bai et al., 2010). SAP can readily absorb water, improve water retention (Yang et al., 2007), and preserve soil water by inhibiting evaporation (Yan et al., 2007; Cao et al., 2017). When the soil is dry, water previously absorbed by the SAP can be utilized by crops (Du et al., 2000). SAP also reduces soil erosion and runoff (Cao et al., 2017), and improves water-use efficiency (Zhang et al., 2009). Furthermore, the application of appropriate amounts of SAP can also improve soil structure and enhance aggregate properties (Yang et al., 2011a), pore properties (Keck and Boyer, 1974), soil infiltration (Yang et al., 2009) and water and fertilizer conservation, while improving the drought resistance of crops (Li et al., 2014). However, compared with SAP, Yang et al. (2013) found that OM was better at improving soil porosity, soil structure, and water retention characteristics after 3 years of application. Yang et al. (2018) also found that SAP combined with OM improved soil porosity, soil structure and other soil properties in topsoil under short-term application. However, the effects of long-term (8 years) application of SAP and OM on the deeper soil profile are unclear, thus it is necessary to study the effects of these two measures on soil structures.
The CT scanning technique has been used to analyse soil porosity (Sander et al., 2008; Scott et al., 2010) and the spatial distribution of soil pores, by which soil pore characteristics can be easily studied (Udawatta and Anderson, 2008). Compared with other established methods, CT scanning has the advantage of fast and accurate non-destructive imaging and analysis of soil at the mm to μm scale (Gantzer and Anderson, 2002). It can also be used for three-dimensional analysis of the internal soil structure by splicing together two-dimensional cross-sectional images (Mooney, 2010; Wang et al., 2018). Although the influence of OM and SAP on soil structure, soil porosity, other soil physical and chemical properties and crop yield has been studied extensively, few studies have investigated the effects of the long-term application of SAP and OM on the spatial distribution of soil pores, various soil organic carbon contents, and soil physical properties in deep soil and relationship between pore structure and physicochemical properties.
Research on the effects of long-term SAP and OM application on soil pores and structures in the 0–100 cm soil profile, and the mechanism by which they affect soil properties and crop yields, is relevant for the implementation of long-term soil improvement measures. We hypothesize that 1) long-term continuous SAP and OM application improves soil properties in both shallow and deep soil, and 2) crop yields will be increased due to improvement of soil properties. Therefore, the aims of our research are 1) to determine whether continuous applications of SAP and OM have significant effects on soil pore properties, soil physical properties and soil organic carbon in the subsoil, 2) to determine how the effects of the amendments change with depth and 3) to identify any correlations between crop yields and soil physical properties. This will contribute to increased understanding of the effect of SAP and OM on soil structure, and provide a scientific basis for the long-term application of SAP or OM.
Materials and Methods
Site Description
The study area is located in Yuzhou County, Henan, China (113°0′-113°39′ E, 33°59′-34°24′ N; 116.1 m above sea level). The multiyear mean rainfall in this area is 674.9 mm, with more than 60% of the rainfall occurring in summer. The soil profile can be divided into three soil layers based on the soil texture (sandy loam (0–22 cm), clay loam (23–36 cm), sandy loam (37–100 cm), shown in Table 1) according to the international texture classification system. Before the experiments were initiated, the contents of soil organic matter, total nitrogen, water-soluble nitrogen, available phosphorus and available potassium in the different layers (0–22, 23–35, 37–100 cm) were shown in Table 1. Wheat-maize rotation has been carried out in this area for more than 50 years.
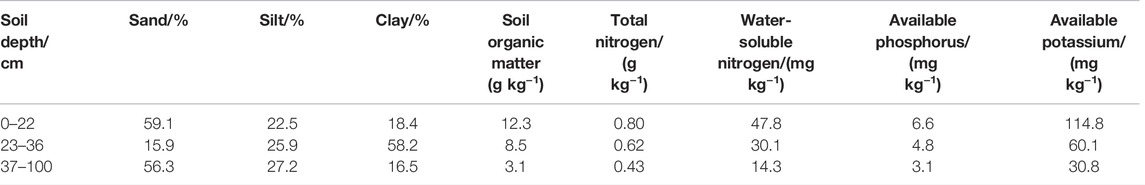
TABLE 1. The soil texture, soil organic matter, total nitrogen, water-soluble nitrogen, available phosphorus and available potassium in different soil layers.
Experimental Design
The long-term field experiment was performed in wheat-maize rotation croplands from October 2006. Treatments included the control (CK) without super absorbent polymer and organic manure, SAP (60 kg ha−1 polyacrylamide, no nutrient, applied every 2 years before sowing winter wheat) in which the application rate and concentration follows the recommendations of our previous study (Yang et al., 2011b), and OM (dry chicken manure: 750 kg ha−1, 34.15% organic carbon, 1.56% N, 1.35% P, 0.82% K applied every year before sowing winter wheat) (Yang et al., 2018). The fertilizer, OM and SAP were evenly spread in the experimental field, followed by tillage (15-cm-deep ploughing with a rotavator). Prior to wheat sowing, the inorganic fertilizers urea, potassium sulfate and diammonium hydrogen phosphate fertilizers were applied at rates of 188 kg N ha−1, 113 kg K ha−1, and 113 kg P ha−1, respectively. In the fields treated with organic fertilizer, the nutrient content was kept uniform with the fields subject to other treatments (inorganic fertilizer was applied at the standard rate minus the nutrient content of the applied organic fertilizer). Tillage was performed at the time of annual wheat seeding, while maize was seeded without tillage. After the harvest of winter wheat, summer maize was sown in the same spots, and before sowing, compound fertilizer was applied at rates of 210 kg N ha−1, 120 kg P ha−1, and 90 kg K ha−1 by a no-tillage planter in every spot. Every treatment had three replicates in the experimental zones, and the plot size of each replicate was 30 m2 (5 × 6 m).
Soil Sampling
In October 2014, after the maize harvest, undisturbed soil columns were collected with a soil column collector (Yang et al., 2021). The container of the original soil column is a plexiglass pipe with an internal diameter of 80 mm, a thickness of 2 mm, and a length of 100 cm. The plexiglass tube is placed in the collector and struck vertically from above with a hammer. When the collector enters the soil to a depth of 110 cm, the collector is removed, and the plexiglass tube in the collector is removed from the bottom of the collector, which prevents compaction of the soil inside the container in the 0–100 cm layer (for measuring the soil pore distribution by CT scanning).
Next to the soil column, we dug a 1-m-deep soil profile to collect cut ring samples (the height of the ring is 5 cm, and the volume is 100 cm3) (used to measure soil bulk density, saturated soil water, field water capacity, available soil water content, wilting soil water content and saturated hydraulic conductivity) sequentially at increments of 5 cm: 2.5–7.5, 12.5–17.5, ..., 92.5–97.5 cm soil layers. Undisturbed soil samples (used to measure the water-stable aggregate content) and disturbed soil samples (used to measure soil organic carbon) were collected sequentially from the 0–10, 10–20, ..., 90–100 cm soil layers.
CT Scanning
A medical CT scanner (256-layer speed CT scanner produced by GE Healthcare, United States) was used to scan the soil columns. Prior to scanning the soil column, the medical CT scanning parameters were reset with a scanning peak voltage of 120 kV, current of 110 mA, scanning time of 1 s, and scanning thickness of 1 mm. Thereafter, each undisturbed soil column was placed between the X-ray tube and the detector of the CT scanner to obtain images of the different soil layers within the entire soil column. A cross-section was scanned every 1 mm from the top, yielding a total of 1,000 cross-section images for each soil column. This experiment was performed on nine soil columns (three repetitions for every treatment), which yielded a total of 9,000 images.
Image Analyses
Grey images in JPG format collected from CT scanner analyses were obtained using ImageJ 1.44 (Abramoff et al., 2004). The two-dimensional images (50 × 50 mm; a square was selected from the round cross-section to prevent possible compaction of the soil due to the plexiglass wall) were converted to 8-bit images and then segmented. According to the methods of Yang et al. (2021), we determined the pore characteristics, including the number, area, perimeter, and circularity of pores. The obtained CT minimum equivalent pore diameter was 160 µm after removing noise, and the smallest identifiable pore was 2 pixels (80 µm per pixel) in size. As a result, we divided pores into two categories: pores with equivalent diameters > 1,000 µm (macropores, as defined by the suction pressure (Luxmoore, 1981; Wamer et al., 1989) and those with diameters of 160–1,000 µm (mesopores) (Luxmoore, 1981). The pore number was counted as the total number of >1,000 µm pores and 160–1,000 µm pores in a CT image. Porosity was calculated as the area of the image covered by > 1,000 µm pores (for >1,000 µm porosity) or 160–1,000 µm pores (for 160–1,000 µm porosity) and expressed as a percentage. The total pore number and porosity (> 160 µm) were obtained by summing these values from both groups of pores.
A three-dimensional visualization of soil pore networks from 1,000 continuous images (30 × 30 × 100 cm, Figure 1) per soil column was reconstructed via saturated volume rendering using Amira software (Luo and Lin, 2009), which can evaluate pore distributions and connectivity under different treatments. The white parts are the substrate, and the purple parts are the pore spaces in Figure 1.
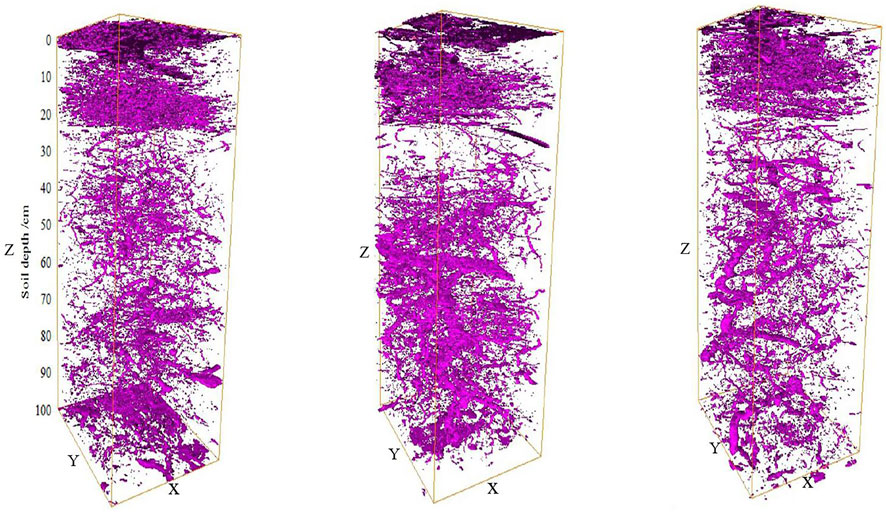
FIGURE 1. The 3D images of the control (left), SAP (middle) and OM (right) for the 0–100 cm soil profile (the purple color indicates soil pore). X, Y, Z: 30 cm, 30 cm, 100 cm.
Determination of the Field Water Capacity, Saturated Hydraulic Conductivity, Soil Bulk Density, Water Stable Aggregate Content and Soil Organic Carbon
The soil water characteristics, such as field water capacity (Institute of Soil Science, Chinese Academy of Sciences, 1978), saturated water content, wilting point, available water content (field water capacity minus the wilting point) (Hua and Wang, 1993), soil bulk density (Githinji, 2014) and saturated hydraulic conductivity (Ou, 2003), were measured with the ring cutting method. The water-stable aggregate content (>0.25 mm) was determined using the wet sieving method (Nimmo and Perkins, 2002). The undisturbed soil was placed into a sieve of 0.25 mm and shaking up and down in water, and the aggregate remaining in the sieve was a water-stable aggregate. TOC was determined using the heavy-metal cadmium acid potassium heating method (Lin et al., 1985), and the active organic carbon (AOC) was measured using potassium permanganate oxidation (Blair et al., 1995). The inert organic carbon (IOC) content was calculated as the total organic carbon value subtracted from the AOC value. The sampling depth of the soil was 0–100 cm.
Determination of Crop Yield
The crop yields were determined by manual harvesting and air-drying the grains, from 4 to 8 m2 areas chosen at random in each plot, for winter wheat and summer maize respectively.
Statistical Analysis
All reported values are means of three replicates implemented for each treatment. The soil pore parameters, soil organic carbon and soil physical parameters in the 0–100 cm soil layer are presented as the mean value ±standard deviation (SD) in Figures 4–7 based on SPSS Statistics 19.0. The Pearson correlation coefficient was calculated to assess the correlations among the soil organic carbon, soil pore parameters, other soil physical characteristics and wheat and maize yields (Tables 2–5).
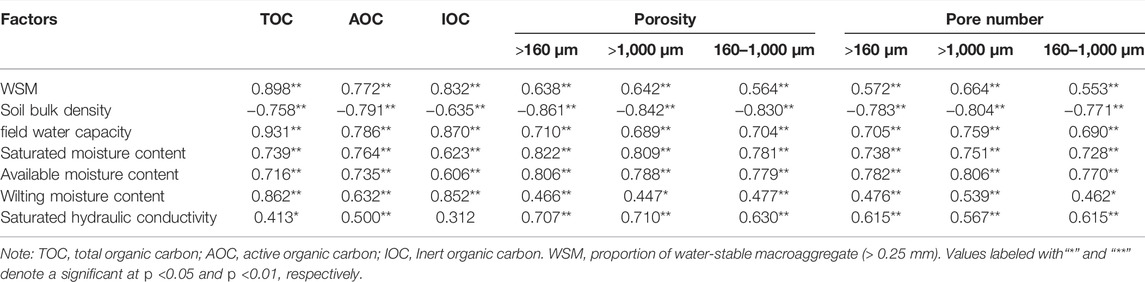
TABLE 2. Correlation coefficients between soil pore parameters, soil organic carbon and soil physical parameters.
Results
3D Images of the 0–100 cm Soil Layers
3D images can clearly reveal the connectivity and distribution of soil pores in a soil profile. Figure 1 shows that most of the soil pores were concentrated in the 0–25 cm soil layer, and there were few soil pores in the 25–35 cm soil layer, especially under the control and SAP treatments. The soil pore density in the 0–10 cm soil layer under SAP was lower than that under the control and OM treatments. Compared to the control, the pore density under the SAP treatment was higher in the 40–100 cm soil layer and macropores and even earthworm burrows were clearly observed in these soil layers (Figure 1). OM treatment resulted in an increased number of pores and a more uniform spatial distribution across the soil. The soil pore distribution in the 30–60 cm soil layer under the control treatment had fragmented or unconnected pores compared with that under the SAP and OM treatments.
Distribution of Soil Pore Numbers
Figure 2 shows that with increasing soil layer, the number of pores of different sizes initially increased and then declined, followed by a tendency to stabilize at depths from 40 to 100 cm.
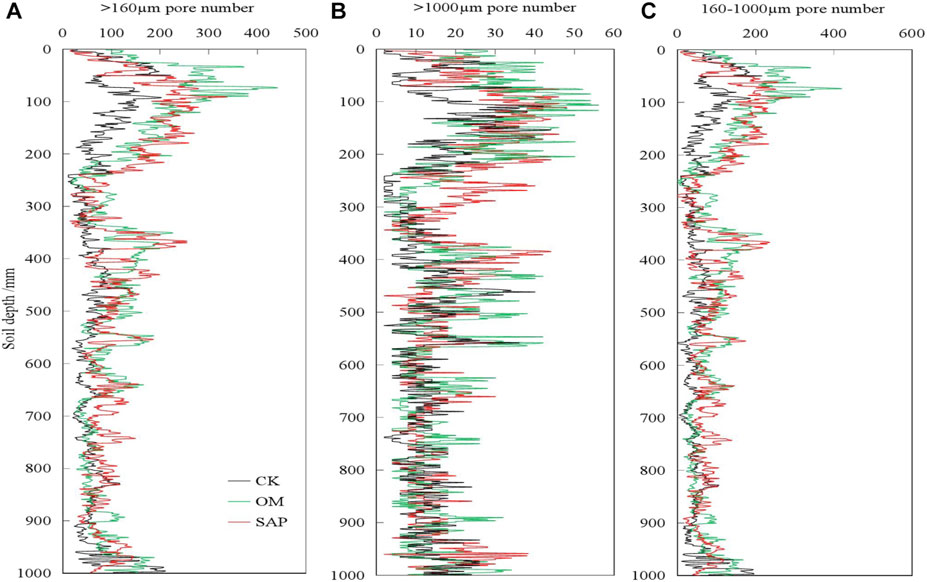
FIGURE 2. The number of total pores (>160 μm) (A), >1,000 μm pores (B) and 160–1,000 μm pores (C) in the soil profile (0–1,000 mm) under the control, SAP and OM treatments.
As shown in Figure 2A and Figure 2C, in the 0–10 cm soil layer, the number of >160 µm (total pores) and 160–1,000 µm pores (mesopores) under OM treatment was the highest among all treatments. In the 5–20 cm soil layer, the number of pores under SAP treatment was higher than that of the control (see also Figure 1). With increasing depth, the total pores and mesopores number changed slowly, remaining at approximately 100. In the 35–40 cm and 65–75 cm layers, the pore numbers under SAP treatment were higher than those of the control. In the 35–50 cm soil layer, there was a higher pore number under OM treatment than under the control treatment.
As seen in Figure 2B, the >,1000 µm (macropore) pore numbers changed significantly across the entire soil layer, especially at 0–20 cm. In the 0–10 cm soil layer, the macropore number under OM treatment was the highest compared with other treatments, but then decreased rapidly with depth. In the 5–10 cm and 20–30 cm soil layers, the macropore numbers under SAP treatment were greater than those of the control. There was no significant difference in the number of macropore between different treatments beneath the 40 cm soil layer.
Distribution of Soil Porosity
Figure 3 shows that the soil porosity changed greatly in the 0–20 cm soil layer. In the 0–20 cm soil layer, the total porosity (> 160 µm) and > 1,000 µm (macro) porosity of the SAP and OM treatments were greater than those of the control treatment. In the 25–35 cm, soil layer, the total porosity and macroporosity of the OM was higher than that of the control and SAP treatments. However, in the 60–65 cm and 75–90 cm soil layers, the total porosity and macroporosity of the SAP treatment were the highest. For smaller pores (160–1,000 µm, mesopores), OM treatment was more beneficial in the 5–10 cm and 30–40 cm soil layers. In the 15–25 cm and 75–85 cm soil layers, the porosities of the SAP treatments were higher than those of the control and OM treatments.
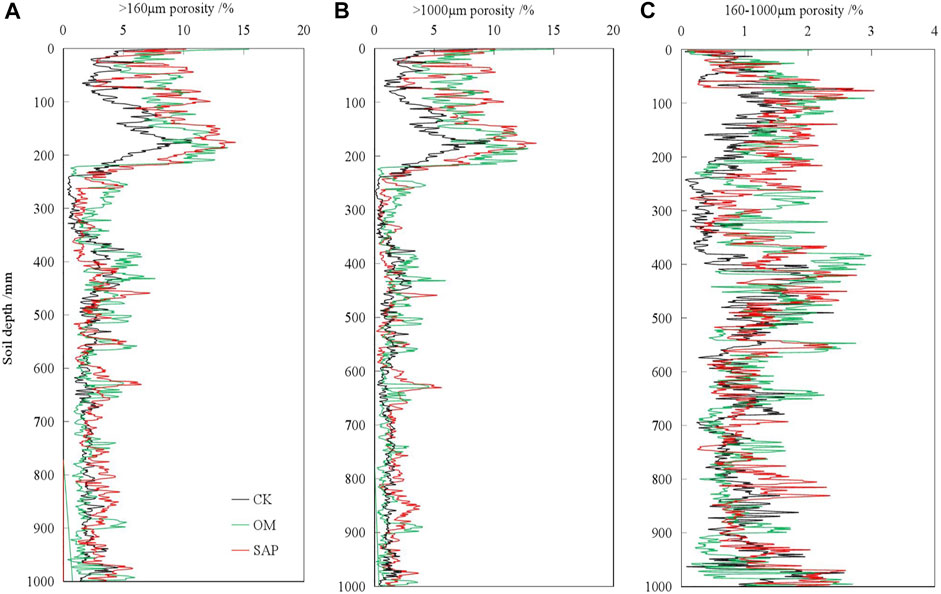
FIGURE 3. The porosity of total pores (>160 μm) (A), >1,000 μm pores (B) and 160–1,000 μm pores (C) in the soil profile (0–1,000 mm) under the control, SAP and OM treatments.
Distribution of Soil Physical Properties
With increasing depth (Figure 4A), the soil bulk density tended to decrease, and the lowest value was measured in the 10–20 cm soil layer. The soil bulk densities under the various treatments were as follows: control > OM > SAP. The soil bulk density under the SAP and OM treatments was lower than that of the control at 0–70 cm. In the 0–20 and 50–60 cm soil layers, the soil bulk density under SAP treatment was lower than that under OM treatment. In the 30–50 cm soil layer, the soil bulk density under OM treatment was lower than that under SAP treatment.
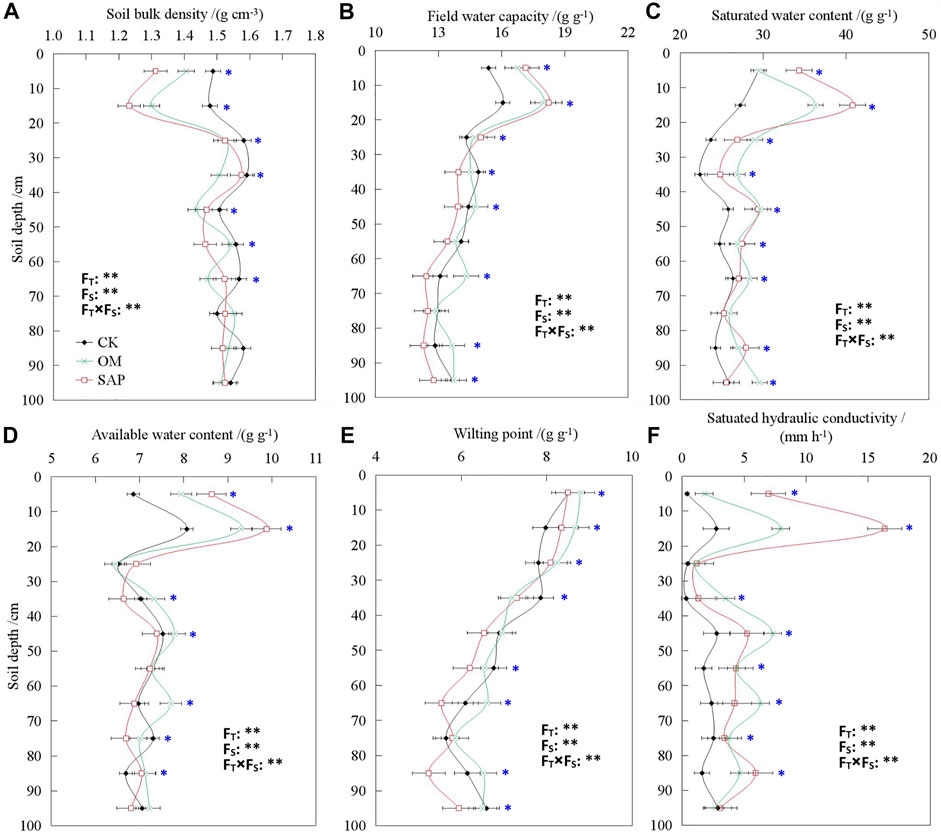
FIGURE 4. Soil bulk density (A), field moisture capacity content (B), soil saturated moisture content (C), available moisture content (D), wilting moisture content (E) and saturated hydraulic conductivity (F) in the different soil layers (0–100 cm) under the control, SAP and OM treatments. Error bars represent one standard deviation. Asterisk indicated differences between CK, OM and SAP (p < 0.05). Fr, Fs and FTxFs mean F-values of three treatments, soil depth and their interactions in variance analysis respectively. ** indicate difference at the 0.01 probability levels.
The field water capacity decreased gradually with depth (Figure 4B). In the 0–30 cm soil layer, the field water capacity of the SAP treatment was higher than that of the OM treatment, followed by that of the control. Below the 30 cm soil layer, the field water capacity of the SAP treatment was lower than that of the other treatments. There was no significant difference in field water capacity between the OM treatment and the control treatment in these soil layers.
As shown in Figure 4C, across the whole soil profile, the SAP and OM treatments resulted in higher soil saturated water than the control treatment. The SAP treatment was more beneficial than the OM treatment for improving the soil saturated water in the 0–20 cm soil layer. However, in the 20–40, 60–70, and 90–100 cm soil layers, the OM treatment had a more beneficial effect.
Figure 4D shows that the available water content changed gradually with depth, except in the 0–20 cm soil layer. In the 30–50 cm and 60–70 cm soil layers, the OM treatment was more beneficial for increasing the available water content.
The wilting point slowly decreased with an increase in depth. The SAP and OM treatments led to higher wilting points at 10–30 cm than the control. However, in the 40–70 cm and 80–100 cm soil layers (Figure 4E), the wilting point under SAP treatment was lower than that under the other treatments. The wilting point at 60–70 and 80–90 cm was highest under the OM treatment.
As seen in Figure 4F, the saturated hydraulic conductivity of the soil was the lowest at 20–30 cm, while the highest value was observed in the soil layers between 10 and 20 cm. The saturated hydraulic conductivity changed slowly with depth. In general, the saturated hydraulic conductivity was ranked as SAP > OM > control in 0–20 cm and 80–90 cm soil layers, but OM > SAP > control in 30–50 cm and 60–70 cm soil layers.
Distribution of Different Types of Soil Organic Carbon and Water-Stable Macroaggregates
As shown in Figure 5A, the total organic carbon (TOC) of the soil first increased with depth and then decreased gradually. The TOC content in the 10–20 cm soil layer was the highest, with values ranked as SAP > OM > control. In the 40–50 cm soil layer, the TOC of the SAP and OM treatments was still significantly higher than that of the control treatment, but with the increase in soil layer, the TOC of the SAP treatment became lower than that of the control, which may be related to the difference in the initial soil. In Figure 5B, AOC was shown to increase first and then decrease with depth. In the 0–40 cm soil layer, the AOC content of soil was ranked as SAP > OM > control. However, the IOC (Figure 5C) decreased rapidly with depth, except under SAP treatment in the 10–20 cm soil layer, with the highest value among the treatments, followed by OM. In the 0–10, 30–40, and 70–100 cm soil layers, the control had relatively larger amounts of soil IOC, whereas SAP and OM increased the IOC in the 10–20 cm and 40–50 cm soil layers.
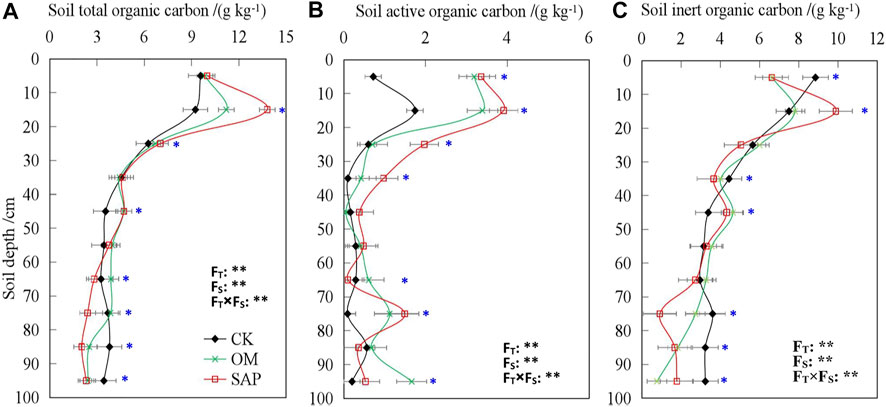
FIGURE 5. Soil total organic carbon content (A), soil active organic carbon content (B), and soil inert organic carbon content (C) in the soil profile (0–100 cm) under the control, SAP and OM treatments. Error bars represent one standard deviation. Asterisk indicated differences between CK, OM and SAP (p < 0.05). FT, Fs and FTXFs mean F-values of three treatments, soil depth and their interactions in variance analysis respectively. ** indicate difference at the 0.01 probability levels.
As seen in Figure 6, with increasing soil layer, the WSM showed a trend that initially increased and then significantly decreased. In the 0–30 cm soil layer, the ranking of the WSM was SAP > OM > control. In the 40–60 cm soil layer, the highest WSM occurred under the SAP treatment.
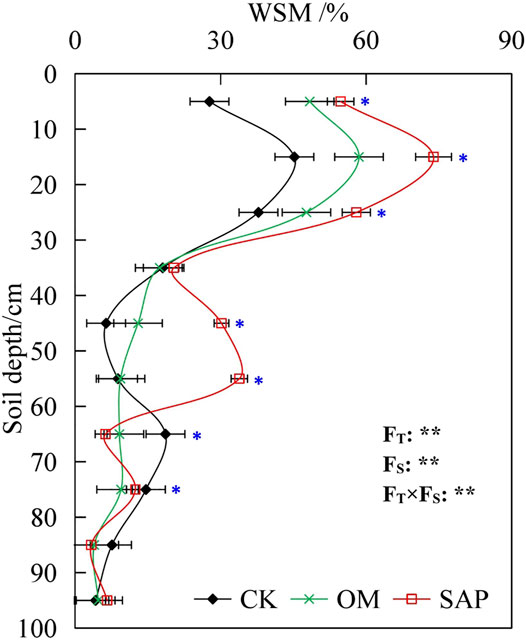
FIGURE 6. The WSM in the soil profile (0–100 cm) under control, SAP and OM treatments. WSM, proportion of water-stable macroaggregate (> 0.25 mm). Error bars represent one standard deviation. Asterisk indicated differences between CK, OM and SAP (p < 0.05). FT, Fs and FTXFs mean F-values of three treatments, soil depth and their interactions in variance analysis respectively. ** indicate difference at the 0.01 probability levels.
Correlation Analysis of Different Soil Physical Characteristics
According to correlation analyses of the soil pore parameters (pore number and porosity), content of different types of organic carbon, and soil physical parameters (WSM, field water capacity, saturated water content, wilting point, saturated hydraulic conductivity, available water content and soil bulk density) resulting from different treatments (Table 2), it is can be concluded that all soil physical parameters showed significant (p < 0.05) or extremely significant (p < 0.01) positive correlations with pore parameters and the soil organic carbon content. However, the soil bulk density had extremely significant (p < 0.01) negative correlations with the pore number and soil organic carbon content. TOC (R2 = 0.413–0.931) had higher correlation coefficients with the different soil physical parameters than IOC (R2 = 0.312–0.870), followed by AOC (R2 = 0.500–0.791). There was a stronger correlation between soil porosity (R2 = 0.447–0.861) and the different soil physical parameters than between soil porosity and the pore number (R2 = 0.462–0.806).
Table 3 shows that the TOC, AOC and IOC contents had significant positive correlations with porosities (number) of different diameters (160–1,000 μm, >1,000 μm) in the soil. Furthermore, the correlation between the AOC and the parameters of the different pore diameters (160–1,000 μm, >1,000 μm and >160 μm) was the strongest (R2 = 0.742–0.793), followed by TOC (R2 = 0.657–0.717) and IOC (R2 = 0.539–0.639), which indicates that AOC is more related to the improvement in soil pore characteristics than TOC or IOC.
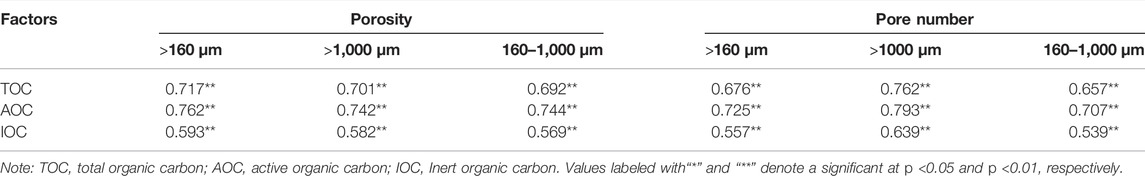
TABLE 3. Correlation coefficients between different types of soil organic carbon content and soil pore parameters.
There were significant (p < 0.05) or extremely (p < 0.01) significant positive correlations between the WSM and field water capacity, saturated water content, available water content, and wilting point (Table 4). There were also significant (p < 0.05) or extremely (p < 0.01) significant positive correlations among the field water content, saturated water content, available water content, and wilting point. Soil bulk density displayed extremely significant negative correlations with the WSM, field water capacity, saturated water content, available water content, wilting point and saturated hydraulic conductivity.
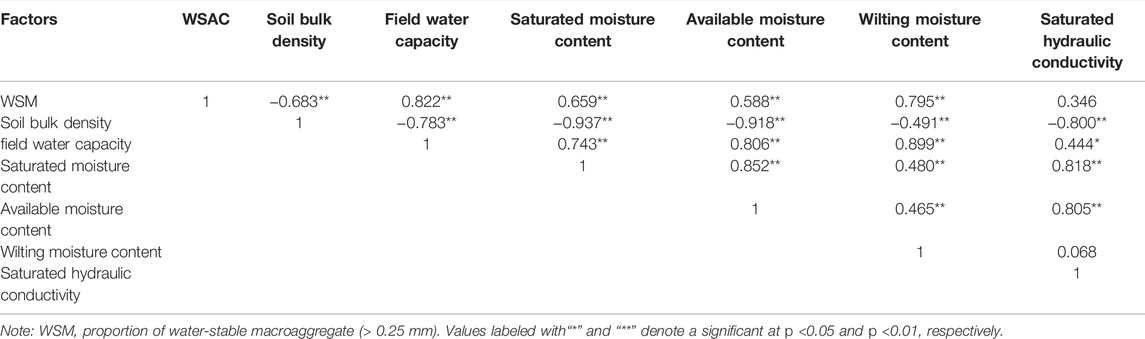
TABLE 4. Correlation coefficients among soil physical parameters.
Effects of SAP and OM on Wheat and Maize Yields From 2011 to 2017
We measured the wheat and maize yields from 2011 to 2017 (Figure 7), and the yield of wheat in 2013 and 2017 was lower than that in other years, which may be related to the wheat cultivar. Overall, in 2012, 2014, 2016 and 2017, the yield of wheat under SAP treatment was the highest, followed by that under OM treatment. The yield of wheat under OM treatment was the highest in 2015, followed by that of the SAP treatment, and the wheat yield of the control was the lowest among the treatments. In the case of maize, the yield under the different treatments generally decreased from 2013 to 2017; the yield of the different treatments increased significantly in 2017, whereas the yield of the control was the lowest in different years. The maize yield under SAP treatment was the highest in 2012, 2014, 2015 and 2017, followed by that under OM treatment, whereas the reverse was true in other years.
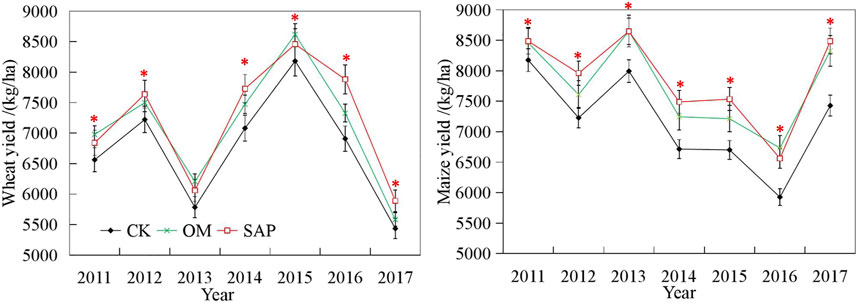
FIGURE 7. Yield of wheat and maize from 2011 to 2017 under the control, SAP and OM treatments. Error bars represent one standard deviation. Asterisk indicated differences among different treatments.
Correlation Analysis Between Crop Yields and Soil Physical Properties
From Table 5 (a case study of wheat and maize yields in 2017), it is apparent that all soil properties except bulk density showed positive correlations with wheat and maize yields. Total organic carbon, saturated hydraulic conductivity, field water capacity, saturated water content and available moisture content had significant (p < 0.05) or extremely significant (p < 0.01) positive correlations with wheat yield. The total organic carbon showed a significant (p < 0.05) positive correlation with maize yield.
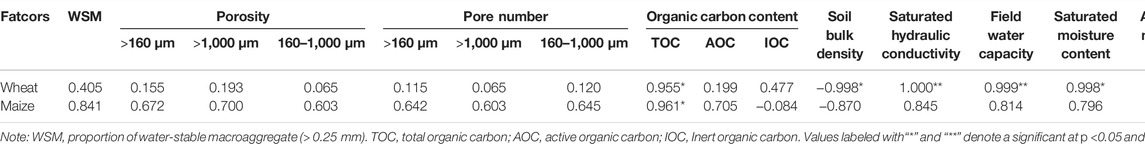
TABLE 5. Correlation coefficients between yields of wheat and maize and soil physical properties.
Discussion
The Infuence of SAP and OM on Soil Pore Characteristics
Soil pores play an important role in mediating the movement of water, heat, nutrients and gas (Berisso et al., 2012). In our study, from the 3D figures (Figure 1) and Figure 2, we found that the soil pore density and number in the 0–5 cm soil layer under SAP was lower than that under OM treatment and similar to the control. This may be due to the shrinking of SAP, which leads to a decrease in macropore number (Sojka et al., 2006; Yang et al., 2011a) and SAP increases pore sizes (small pores expand; in a given finite total soil volume, macropore volume increases when pores expand, even if the number does not change) when the swelling and shrinkage of SAP occurs during the process of absorbing and releasing water, which then decreases the number of pores in the 0–5 cm soil layer (Yang et al., 2011a). However, in the 5–20 cm soil layer, the total pore and macropore number of SAP was significantly higher than that of the control. In the 30–40 cm soil layer, there were even fewer pores and the soil porosities were lower than that of other soil layer (Figures 1–3), possibly because the application of SAP in the upper layer led to a higher soil water content, which caused a larger concentration of crop roots to grow into this layer, in turn leading to a lower root density in the bottom ploughed layer at 30–40 cm. Furthermore, another possible cause is the reduced activity of microorganisms and soil fauna because of low soil water and crop root presence, which caused the porosity of this soil layer to be lower than that of other soil layers (Recknagel, 2008). However, compared to the control, the pore density under SAP treatment was higher in the 40–100 cm soil layer, and the presence of macropores and earthworm burrows suggest earthworm activity (Figure 1). This may have occurred because SAP treatment improved water retention below the 40 cm soil layer, which was beneficial for root activity (Li et al., 2015) and other biological activities (Joshua et al., 1999).
However, in the 0–10 cm soil layer, the total porosity and macroporosity of the OM treatment were greater than those of the SAP and control treatments. As OM provides suitable conditions for crop roots and soil organisms, more biological activity occurs in the 0–10 cm soil layer (Joshua et al., 1999) than in the lower soil layer, which is beneficial for the soil structure. From Figure 1, we found found that OM treatment resulted in an increased number of pores and a more uniform distribution across the whole soil profile. This may be the activity of earthworms, as other studies (Standen, 1984; Andriuzzi 2015) have found such a pore distribution to indicate the activity of earthworms or other soil organisms, resulting in the creation of more pores that are conducive to the downward growth of crop roots, thus expanding access to soil water and benefiting crop growth (Bierhuizen and de Vos, 1959). The soil pore distribution in the 30–60 cm soil layer under the control treatment had fragmented or unconnected pores compared with that under the SAP and OM treatments (Figure 1). In addition, Compared with OM, SAP had a greater effect on soil porosity because of hydrophilic networks structure of SAP, the agglutination of SAP and soil particles, and the expansion and shrinkage of SAP in the process of absorbing or releasing water. These factors led to an increase in the number of soil pores and an increase in porosity (Yang et al., 2011a; Yang et al., 2013).
The above results show that SAP and OM can reduce the compaction of soil due to natural or external forces while improving soil structure and pore conditions (Sojka et al., 2007; Alagoz and Yilmaz, 2009; Yang et al., 2018). The SAP and OM treatments improved the soil total porosity and macroporosity and in 0–20 cm and 25–30 cm soil layers and mesoporosity in 10–25 cm 30–35 cm soil layers. These effects are beneficial for the transport and exchange of water and air in the soil, especially in the ploughed layer.
The Influence of SAP and OM on Soil Structure, Physical Parameters, Soil Organic Carbon and Crop Yield
Soil compaction is a key issue for plant growth (Chen and Weil, 2011). In addition, Long-term tillage accelerates the decomposition of organic carbon in soil, and catalyzes the decrease of soil organic carbon in soil aggregates. However, applying SAP and OM improves soil structure, increases the physical protection of soil organic carbon by stable aggregates, slows down the decomposition rate of soil organic carbon, and enhances the ability of soil carbon sequestration (Zhong et al., 2017), thereby providing good growth conditions for the crops.
The proportion of water-stable macroaggregates (> 0.25 mm) (WSM) was used to characterize the soil structure stability (Six et al., 2000). We found that in the 0–30 cm soil layer, the WSM of SAP was the highest, followed by OM and the control was the lowest. In the 40–60 cm soil layer, the WSM under the SAP treatment was also the highest, which supports the argument that SAP improves the soil structure and stability (Gardner, 1956; Yan et al., 2007) in topsoil, promotes infiltration (Yang et al., 2009), and increases the soil water in the subsoil (35–60 cm). These in turn result in good conditions for crop growth, which then improves the soil aggregates (Czarnes et al., 2000). The same effect was observed under the OM treatment. However, Guo et al. (2019) found that animal manure improved soil aggregation in southern China but not in northern China. Domingo-Olivé et al. (2016) found that the application of pig manure had no effect on soil aggregation, while Zhang et al. (2014) found that chicken manure increases soil aggregates. This suggests the effects of OM application may depend on animal manure type and soil type, and will have to be studied in further detail.
Different types of soil organic carbon have various critical relationships with the soil structure. Soil active organic carbon (AOC) refers to the active part of soil organic matter, which is easily decomposed and mineralized by soil microorganisms, and has the most direct effect on plant nutrient supply in soil (Dong et al., 2015). However, soil inert organic carbon (IOC) characterizes the long-term accumulation and carbon sequestration ability of soil (Zhang et al., 2012).
We found that SAP and OM are better than the control for increasing TOC content in 0–20 and 40–50 cm soil layers by improving the soil structure and water retention, thus promoting root (Morris et al., 2006) and microbial (Lovell et al., 1995; Joshua et al., 1999) activity. In the 0–55 cm soil layer, the AOC content of soil was ranked as SAP > OM > control, which suggests that although AOC is easily transported following rain or irrigation into the deeper soil (Zhu et al., 2017), large amounts of AOC remained in the 0–40 cm soil layer due to retention and physical protection and sorption by SAP. However, SAP and OM were conducive to the preservation of organic carbon or for carbon sinks at 10–20 cm and 40–50 cm.
The soil structure, organic carbon, and soil physical properties such as the bulk density, field water capacity, and soil saturated water content, are also subject to the long-term influence of external conditions (Xu et al., 2019). We found that different soil physical parameters vary differently with depth. The effect of the treatments on the saturated water content and saturated hydraulic conductivity spanned the entire soil profile, but were concentrated especially at the 0–20 cm soil layer, which may be related to earthworm activity (Weil and Kroontje, 1979). Large changes at 0–70 cm occurred in bulk density, while marked changes in the field water capacity, available water content and wilting point were observed only in the 0–20 cm soil layer. The data indicates that overall, SAP was better than OM in the 0–20 cm soil layer. However, if too much SAP is applied, it will lead to soil compaction and an increase in soil bulk density. Hou et al. (2018) found that a dose of 60 kg/ha SAP decreased the soil bulk density. In this study, we also used the optimum SAP dose of 60 kg/ha, based on our previous research (Yang et al., 2011b), which yielded favourable results.
Soil organic carbon directly affects the distribution of soil pores, and Lugato et al. (2009) found that the soil organic carbon was negatively correlated with the 30–75 μm pore size class (mesopores) in sandy soil and was positively correlated with the 0.1–5 μm pore size class (ultramicropores) in clay and peaty soil. We found that the TOC, AOC and IOC contents had significant positive correlations with porosities (number) of 160–1,000 μm, >1,000 μm in sandy loam soil. And the correlation between the AOC and the parameters of 160–1,000 μm, >1,000 μm and >160 μm was the strongest.
Due to the improvement in soil physical properties, soil water retention improved (Franzluebbers, 2002), and crop yield increased (Wu et al., 2017). The measured the wheat and maize yields from 2011 to 2017 showed that SAP and OM treatments increased wheat and maize yields. SAP treatment increased wheat yield in 2012, 2014, 2016 and 2017, followed by OM treatment. The yield of wheat under OM treatment increased wheat yield in 2015, followed by that of the SAP treatment, and the control was the lowest among the treatments. The maize yield under SAP treatment was the highest in 2012, 2014, 2015 and 2017, followed by that under OM treatment. This indicates that SAP and OM improve soil physical parameters such as structure (Gardner, 1956) and soil porosity (Yang et al., 2018), which then enhances water retention and water availability, thus increasing crop yield. Furthermore, OM treatment increased soil organic carbon content, which also enhanced crop production by maintaining soil structure and moderating soil microbial activities (Plaza et al., 2004; Ghimire et al., 2017; Pant et al., 2017).
The results of the correlation analysis indicates that the improvement in soil physical properties may have been responsible for improving drainage capacities and the increased crop yields (Jiang et al., 2018), especially for wheat. Therefore, SAP was arguably more beneficial than OM in causing an increase in the yields of wheat and maize, because it resulted in more improvements to soil quality.
General Implications on the Use of SAP and OM Treatments
Soil structures improve gradually after the application of SAP into the soil. Eventually, part of the SAP gradually penetrates the pores within the aggregates (Lu and Wu, 2003; Sojka et al., 2007), binds soil particles together, and increases soil aggregation (Lu and Wu, 2003) and pore continuity (Ajwa and Trout, 2006). The application of OM, as a binding agent (Zhang et al., 2016), also significantly improves soil structure, soil pore characteristics and other soil physical properties, because it is rich in organic matter (Yan et al., 2013) and nutrient components. OM also promotes soil biological activity, which is beneficial for the formation of macropores and increases soil structure stability. However, when the application rate of SAP exceeds a certain threshold, it will cause soil consolidation (Pramthawee et al., 2017), soil pore blockages and soil structure deterioration (Yang et al., 2005). In addition, when disintegration of the SAP several years after application results in its reduced ability to bind soil particles, soil structural stability will decrease as well. This negatively affects the circulation and exchange of water and air in the soil, and the growth of crop roots and microorganisms, resulting in a decline in soil quality (Wang et al., 2017b). Accordingly, the effects and required dosages or frequency of SAP application is a critical factor that depends on soil type.
Guo et al. (2019) found that soil structure stability increased after animal manure application in southern China but not in northern China because of high Na+ from animal manure remaining in northern soil due to low rainfall (Yan et al., 2013). However, chicken manure itself functions well as a binding agent and increases soil aggregate stability (Zhang et al., 2014). Kuncoro et al. (2014a), Kuncoro et al. (2014b) found that when large quantities of organic materials are applied into soil, soil macropores can be blocked during the initial stages of the treatment, resulting in decreased hydraulic conductivity. In addition, excessive manure has a negative or neutral effect (Zhang et al., 2016; Guo et al., 2018) on soil structure, may lead to soil acidification, and cause the soil structure to be hardened and soil quality to be reduced (Yang et al., 2005), which may ultimately result in lower microbial activity and poor soil porosity. In summary, although SAP and OM are good amendments for improving soil structure, increasing soil organic carbon, and increasing crop yield, the dosage and frequency of application has to be appropriate for the soil type and climate.
Conclusion
Long-term application of SAP and OM significantly improved soil pore numbers and porosities at 5–20 cm depth, while improving the connectivity of soil pores across the soil profile, increasing the TOC (10–20 cm and 40–50 cm), AOC (0–40 cm), field water capacity (0–20 cm), available water content (0–20 cm), wilting point (10–30 cm), saturated water content (10–70 cm), saturated hydraulic conductivity (0–90 cm), WSM (0–30 cm and 40–50 cm), and reducing the soil bulk density (0–70 cm). Compared with OM, SAP had a stronger positive effect on the total organic carbon, soil field water capacity, available water content, saturated water content, saturated hydraulic conductivity, and WSM in the 0–20 cm soil layer. SAP and OM application improved the pore size distribution in the soil profile by increasing the TOC and AOC contents, and by enhancing the water-stability of aggregates. Therefore, we conclude that long-term application of SAP and OM, in appropriate amounts, provides conducive conditions for crop growth, and increases the yields of wheat and maize. Between the studied treatments SAP and OM, SAP led to greater increases in yields. Based on correlations between the soil organic carbon content, soil pore parameters and soil physical properties, the effect of the SAP and OM treatments on soil quality may possibly be characterized in the future without having to measure all of the soil physical properties.
Data Availability Statement
The raw data supporting the conclusions of this article will be made available by the authors, without undue reservation.
Author Contributions
YY wrote the main manuscript. JW and Y-LD revised and gave some advice for the manuscript. CG performed most of the experiments and prepared the figure and table of the manuscript. DT and MP edited language and modified the main manuscript. All authors reviewed the manuscript.
Funding
This work was financially supported by the National Key R & D Program of China (project no. 2017YFD0301102), Key scientific and technological research projects of Henan Non-ferrous Metals Geological and Mineral Resources Bureau (project no. KCXM202108) and the Re-USe of Treated effluent for agriculture (RUST) project of the Netherlands Organization for Scientific Research (NWO).
Conflict of Interest
The authors declare that the research was conducted in the absence of any commercial or financial relationships that could be construed as a potential conflict of interest.
Publisher’s Note
All claims expressed in this article are solely those of the authors and do not necessarily represent those of their affiliated organizations, or those of the publisher, the editors and the reviewers. Any product that may be evaluated in this article, or claim that may be made by its manufacturer, is not guaranteed or endorsed by the publisher.
References
Abramoff, M. D., Magelhaes, P. J., and Ram, S. J. (2004). Image Treatment with Image. J. Biophoton. Int. 11, 36–42. doi:10.3390/met2040508
Ajwa, H. A., and Trout, T. J. (2006). Polyacrylamide and Water Quality Effects on Infiltration in sandy Loam Soils. Soil Sci. Soc. Am. J. 70, 643–650. doi:10.2136/sssaj2005.0079
Alagoz, Z., and Yilmaz, E. (2009). Effects of Different Sources of Organic Matter on Soil Aggregate Formation and Stability: A Laboratory Study on a Lithic Rhodoxeralf from Turkey. Soil Tillage Res. 103, 419–424. doi:10.1016/j.still.2008.12.006
Alaoui, A., Lipiec, J., and Gerke, H. H. (2011). A Review of the Changes in the Soil Pore System Due to Soil Deformation: A Hydrodynamic Perspective. Soil Tillage Res. 115-116, 1–15. doi:10.1016/j.still.2011.06.002
Andriuzzi, W. S. (2015). Ecological Functions of Earthworms in Soil. Wageningen: Wageningen University. Available at: https://library.wur.nl/WebQuery/wurpubs/fulltext/352649.
Bai, W., Zhang, H., Liu, B., Wu, Y., and Song, J. (2010). Effects of Super-absorbent Polymers on the Physical and Chemical Properties of Soil Following Different Wetting and Drying Cycles. Soil Use Manage 26, 253–260. doi:10.1111/j.1475-2743.2010.00271.x
Berisso, F. E., Schjønning, P., Keller, T., Lamandé, M., Etana, A., de Jonge, L. W., et al. (2012). Persistent Effects of Subsoil Compaction on Pore Size Distribution and Gas Transport in a Loamy Soil. Soil Tillage Res. 122, 42–51. doi:10.1016/j.still.2012.02.005
Bierhuizen, J. F., and de Vos, N. M. (1959). The Effect of Soil Moisture on the Growth and Yield of Vegetable Crops. No. 11. Wageningen: Technical bulletin/Institute for Land and Water Management Research. Available at: https://library.wur.nl/WebQuery/wurpubs/fulltext/394520.
Blair, G., Lefroy, R., and Lisle, L. (1995). Soil Carbon Fractions Based on Their Degree of Oxidation, and the Development of a Carbon Management index for Agricultural Systems. Aust. J. Agric. Res. 46, 1459–1466. doi:10.1071/ar9951459
Bolan, N. S., Adriano, D. C., Natesan, R., and Koo, B.-J. (2003). Effects of Organic Amendments on the Reduction and Phytoavailability of Chromate in mineral Soil. J. Environ. Qual. 32, 120–128. doi:10.2134/jeq2003.1200
Busscher, W. J., Bjorneberg, D. L., and Sojka, R. E. (2009). Field Application of PAM as an Amendment in Deep-Tilled US southeastern Coastal plain Soils. Soil Tillage Res. 104, 215–220. doi:10.1016/j.still.2009.02.009
Cao, Y., Wang, B., Guo, H., Xiao, H., and Wei, T. (2017). The Effect of Super Absorbent Polymers on Soil and Water Conservation on the Terraces of the Loess Plateau. Ecol. Eng. 102, 270–279. doi:10.1016/j.ecoleng.2017.02.043
Celik, I., Ortas, I., and Kilic, S. (2004). Effects of Compost, Mycorrhiza, Manure and Fertilizer on Some Physical Properties of a Chromoxerert Soil. Soil Tillage Res. 78, 59–67. doi:10.1016/j.still.2004.02.012
Chen, G., and Weil, R. R. (2011). Root Growth and Yield of maize as Affffected by Soil Compaction and Cover Crops. Soil Till. Res. 117, 17–27. doi:10.1016/j.still.2011.08.001
Czarnes, S., Hallett, P. D., Bengough, A. G., and Young, I. M. (2000). Root- and Microbial-Derived Mucilages Affect Soil Structure and Water Transport. Eur. J. Soil Sci. 51, 435–443. doi:10.1046/j.1365-2389.2000.00327.x
Domingo-Olivé, F., Bosch-Serra, À. D., Yagüe, M. R., Poch, R. M., and Boixadera, J. (2016). Long Term Application of Dairy Cattle Manure and Pig Slurry to winter Cereals Improves Soil Quality. Nutr. Cycl. Agroecosyst. 104, 39–51. doi:10.1007/s10705-015-9757-7
Dong, Y. H., Zeng, Q. C., Li, Y. Y., Li, Y., Zhang, H., and An, S. S. (2015). The Characteristics of Soil Active Organic Carbon Composition under Different Vegetation Types on the Loess Plateau. Acta Agrestia Sin. 23, 277–284.
Du, T. S., Kang, S. Z., and Wei, H. (2000). Research Status and prospect on Application of Water Holding Agent in Water-Saving Agriculture. Res. Agric. Modern. 21, 317–320. doi:10.1088/1742-6596/490/1/012100
Franzluebbers, A. J. (2002). Water Infiltration and Soil Structure Related to Organic Matter and its Stratification with Depth. Soil Tillage Res. 66, 197–205. doi:10.1016/S0167-1987(02)00027-2
Gantzer, C. J., and Anderson, S. H. (2002). Computed Tomographic Measurement of Macroporosity in Chisel-Disk and No-Tillage Seedbeds. Soil Tillage Res. 64, 101–111. doi:10.1016/S0167-1987(01)00248-3
Gardner, W. R. (1956). Representation of Soil Aggregate-Size Distribution by a Logarithmic-Normal Distribution. Soil Sci. Soc. Am. J. 20, 151–153. doi:10.2136/sssaj1956.03615995002000020003x
Ghimire, R., Machado, S., and Bista, P. (2017). Soil pH, Soil Organic Matter, and Crop Yields in Winter Wheat-Summer Fallow Systems. Agron.J. 109, 706–717. doi:10.2134/agronj2016.08.0462
Giannitsopoulos, M. L., Burgess, P. J., and Rickson, R. J. (2019). Effects of Conservation Tillage Systems on Soil Physical Changes and Crop Yields in a Wheat-Oilseed Rape Rotation. J. Soil Water Conserv. 74, 247–258. doi:10.2489/jswc.74.3.247
Githinji, L. (2014). Effect of Biochar Application Rate on Soil Physical and Hydraulic Properties of a sandy Loam. Arch. Agron. Soil Sci. 60, 457–470. doi:10.1080/03650340.2013.821698
Guo, Z. C., Zhang, Z. B., Zhou, H., Rahman, M. T., Wang, D. Z., Guo, X. S., et al. (2018). Long-term Animal Manure Application Promoted Biological Binding Agents but Not Soil Aggregation in a Vertisol. Soil Tillage Res. 180, 232–237. doi:10.1016/j.still.2018.03.007
Guo, Z., Zhang, J., Fan, J., Yang, X., Yi, Y., Han, X., et al. (2019). Does Animal Manure Application Improve Soil Aggregation? Insights from Nine Long-Term Fertilization Experiments. Sci. Total Environ. 660, 1029–1037. doi:10.1016/j.scitotenv.2019.01.051
Hou, X., Li, R., He, W., Dai, X., Ma, K., and Liang, Y. (2018). Superabsorbent Polymers Influence Soil Physical Properties and Increase Potato Tuber Yield in a Dry-Farming Region. J. Soils Sediments 18, 816–826. doi:10.1007/s11368-017-1818-x
Hua, M., and Wang, J. (1993). Soil Physics. Beijing: Beijing Agricultral University Press. 38, 1438.
Institute of Soil Science, Chinese Academy of Sciences (1978). Determination Methods for Soil Physical Properties. Beijing: Science Press.
Jiang, H., Han, X., Zou, W., Hao, X., and Zhang, B. (2018). Seasonal and Long-Term Changes in Soil Physical Properties and Organic Carbon Fractions as Affected by Manure Application Rates in the Mollisol Region of Northeast China. Agric. Ecosyst. Environ. 268, 133–143. doi:10.1016/j.agee.2018.09.007
Joshua, P. S., Jay, M. G., Joy, S. C. C., Jon, E. L., and Joan, F. B. (1999). Moisture Effect on Microbial Activity and Community Structure in Decomposing Birch Litter in the Alaskan Taiga. Soil Biol. Biochem. 31, 831–838. doi:10.1016/S0038-0717(98)00182-5
Karami, A., Homaee, M., Afzalinia, S., Ruhipour, H., and Basirat, S. (2012). Organic Resource Management: Impacts on Soil Aggregate Stability and Other Soil Physico-Chemical Properties. Agric. Ecosyst. Environ. 148, 22–28. doi:10.1016/j.agee.2011.10.021
Keck, R. W., and Boyer, J. S. (1974). Chloroplast Response to Low Leaf Water Potentials. Plant Physiol. 53, 474–479. doi:10.1104/pp.53.3.474
Kuncoro, P. H., Koga, K., Satta, N., and Muto, Y. (2014a). A Study on the Effect of Compaction on Transport Properties of Soil Gas and Water I: Relative Gas Diffusivity, Air Permeability, and Saturated Hydraulic Conductivity. Soil Tillage Res. 143, 172–179. doi:10.1016/j.still.2014.02.006
Kuncoro, P. H., Koga, K., Satta, N., and Muto, Y. (2014b). A Study on the Effect of Compaction on Transport Properties of Soil Gas and Water. II: Soil Pore Structure Indices. Soil Tillage Res. 143, 180–187. doi:10.1016/j.still.2014.01.008
Lee, S. B., Lee, C. H., Jung, K. Y., Park, K. D., Lee, D., and Kim, P. J. (2009). Changes of Soil Organic Carbon and its Fractions in Relation to Soil Physical Properties in a Long-Term Fertilized Paddy. Soil Tillage Res. 104, 227–232. doi:10.1016/j.still.2009.02.007
Li, Z., Liu, M., Wu, X., Han, F., and Zhang, T. (2010). Effects of Long-Term Chemical Fertilization and Organic Amendments on Dynamics of Soil Organic C and Total N in Paddy Soil Derived from Barren Land in Subtropical China. Soil Tillage Res. 106, 268–274. doi:10.1016/j.still.2009.12.008
Li, X., He, J.-Z., Hughes, J. M., Liu, Y.-R., and Zheng, Y.-M. (2014). Effects of Super-absorbent Polymers on a Soil-Wheat (Triticum aestivum L.) System in the Field. Appl. Soil Ecol. 73, 58–63. doi:10.1016/j.apsoil.2013.08.005
Li, Z. Y., Lyu, M. C., Fan, X. Y., Du, Z. J., and Hu, C. (2015). Influences of Different Kinds of Water Retentive Agents on Water Use Efficiency and Root Mor- Phology of winter Wheat. Ying Yong Sheng Tai Xue Bao 26, 3753–3758. doi:10.13287/j.1001-9332.20151016.007
Lin, X., Wen, Q., and Xu, N. (1985). Study on Decomposition of Plant Residues in Soils of Guangzhou and Wuxi. Acta Pedol. Sin. 22, 47–55. Available at: http://www.cnki.com.cn/Article/CJFD1985-TRXB198501004.htm.
Lovell, R. D., Jarvis, S. C., and Bardgett, R. D. (1995). Soil Microbial Biomass and Activity in Long-Term Grassland: Effects of Management Changes. Soil Biol. Biochem. 27, 969–975. doi:10.1016/0038-0717(94)00241-R
Lu, J., and Wu, L. (2003). Polyacrylamide Distribution in Columns of Organic Matter-Removed Soils Following Surface Application. J. Environ. Qual. 32, 674–680. doi:10.1016/S0301-4797(02)00180-910.2134/jeq2003.6740
Lugato, E., Morari, F., Nardi, S., Berti, A., and Giardini, L. (2009). Relationship between Aggregate Pore Size Distribution and Organic-Humic Carbon in Contrasting Soils. Soil Tillage Res. 103, 153–157. doi:10.1016/j.still.2008.10.013
Luo, L., and Lin, H. (2009). Lacunarity and Fractal Analyses of Soil Macropores and Preferential Transport Using Micro‐X‐Ray Computed Tomography. Vadose Zone J. 8, 233–241. doi:10.2136/vzj2008.0010
Luxmoore, R. J. (1981). Micro-, Meso-, and Macroporosity of Soil. Soil Sci. Soc. Am. J. 45 (3), 671–672. doi:10.2136/sssaj1981.03615995004500030051x
Mooney, S. J. (2010). Three-dimensional Visualization and Quantification of Soil Macroporosity and Water Flow Patterns Using Computed Tomography. Soil Use Manag. 18, 142–151. doi:10.1111/j.1475-2743.2002.tb00232.x
Morris, L. A., Ludovici, K. H., Torreano, S. J., Carter, E. A., Lincoln, M. C., and Will, R. E. (2006). An Approach for Using General Soil Physical Condition-Root Growth Relationships to Predict Seedling Growth Response to Site Preparation Tillage in Loblolly pine Plantations. For. Ecol. Manage. 227, 169–177. doi:10.1016/j.foreco.2006.02.031
Nimmo, J. R., and Perkins, K. S. (2002). “Aggregate Stability and Size Distribution,” in Methods of Soil Analysis: Part 4-Physical Methods (Madison: Soil Science Society of America), 317–328. doi:10.2136/sssabookser5.4.c14
Ou, S. (2003). Compilation of Common Standards and Policies and Regulations of Forestry. Jilin: Jilin Electronic Publishing House, 1218–1999.
Pagliai, M., Vignozzi, N., and Pellegrini, S. (2004). Soil Structure and the Effect of Management Practices. Soil Tillage Res. 79 (2), 131–143. doi:10.1016/j.still.2004.07.002
Pant, P. K., Ram, S., and Singh, V. (2017). Yield and Soil Organic Matter Dynamics as Affected by the Long-Term Use of Organic and Inorganic Fertilizers under Rice-Wheat Cropping System in Subtropical Mollisols. Agric. Res. 6, 399–409. doi:10.1007/s40003-017-0282-6
Plaza, C., Hernández, D., García-Gil, J. C., and Polo, A. (2004). Microbial Activity in Pig Slurry-Amended Soils under Semiarid Conditions. Soil Biol. Biochem. 36, 1577–1585. doi:10.1016/j.soilbio.2004.07.017
Pramthawee, P., Jongpradist, P., and Sukkarak, R. (2017). Integration of Creep into a Modified Hardening Soil Model for Time-dependent Analysis of a High Rockfill Dam. Comput. Geotechn. 91, 104–116. doi:10.1016/j.compgeo.2017.07.008
Recknagel, F. (2008). “Ecological Informatics: Overview,” in Encyclopedia of Ecology. Editors S. E. Jorgensen, and B. Fath (Oxford: Elsevier), 2, 1041–1058. doi:10.1016/b978-008045405-4.00170-1
Sander, T., Gerke, H. H., and Rogasik, H. (2008). Assessment of Chinese Paddy-Soil Structure Using X-ray Computed Tomography. Geoderma 145, 303–314. doi:10.1016/j.geoderma.2008.03.024
Scott, G. J. T., Webster, R., and Nortcliff, S. (2010). The Topology of Pore Structure in Cracking clay Soil I. The Estimation of Numerical Density. Eur. J. Soil Sci. 39 (3), 303–314. doi:10.1111/j.1365-2389.1988.tb01217.x
Six, J., Elliott, E. T., and Paustian, K. (2000). Soil Structure and Soil Organic Matter II. A Normalized Stability Index and the Effect of Mineralogy. Soil Sci. Soc. Am. J. 64 (3), 1042–1049. doi:10.2136/sssaj2000.6431042x
Sojka, R. E., Entry, J. A., and Fuhrmann, J. J. (2006). The Influence of High Application Rates of Polyacrylamide on Microbial Metabolic Potential in an Agricultural Soil. Appl. Soil Ecol. 32, 243–252. doi:10.1016/j.apsoil.2005.06.007
Sojka, R. E., Bjorneberg, D. L., Entry, J. A., Lentz, R. D., and Orts, W. J. (2007). Polyacrylamide in Agriculture and Environmental Land Management. Adv. Agron. 92, 75–162. doi:10.1016/S0065-2113(04)92002-0
Standen, V. (1984). Production and Diversity of Enchytraeids, Earthworms and Plants in Fertilized hay Meadow Plots. J. Appl. Ecol. 21, 293–312. doi:10.2307/2403055
Udawatta, R. P., and Anderson, S. H. (2008). CT-measured Pore Characteristics of Surface and Subsurface Soils Influenced by Agroforestry and Grass Buffers. Geoderma 145, 381–389. doi:10.1016/j.geoderma.2008.04.004
Wamer, G. S., Nieber, J. L., Moore, I. D., and Geise, R. A. (1989). Characterizing Macropores in Soil by Computed Tomography. Soil Sci. Soc. Am. J. 53, 653–660. doi:10.2136/sssaj1989.03615995005300030001x
Wang, Y., Hu, N., Ge, T., Kuzyakov, Y., Wang, Z.-L., Li, Z., et al. (2017a). Soil Aggregation Regulates Distributions of Carbon, Microbial Community and Enzyme Activities after 23-year Manure Amendment. Appl. Soil Ecol. 111, 65–72. doi:10.1016/j.apsoil.2016.11.015
Wang, Y., Jing, D. W., Fu, X. Y., Liu, F. G., Duan, X. C., Liu, F., et al. (2017b). Effects of Application Amount of Super-absorbent Polymer on Soil Physical Characteristics and Microbial Activity under Polar Seedlings. Bull. Soil Water Conserv. 37 (3), 53–58. doi:10.13961/j.cnki.stbctb.2017.03.009
Wang, J., Qin, Q., and Bai, Z. (2018). Characterizing the Effects of Opencast Coal-Mining and Land Reclamation on Soil Macropore Distribution Characteristics Using 3D CT Scanning. Catena 171, 212–221. doi:10.1016/j.catena.2018.07.022
Wang, M., Xu, S., Kong, C., Zhao, Y., Shi, X., and Guo, N. (2019). Assessing the Effects of Land Use Change from rice to Vegetable on Soil Structural Quality Using X-ray CT. Soil Tillage Res. 195, 104343. doi:10.1016/j.still.2019.104343
Weil, R. R., and Kroontje, W. (1979). Physical Condition of a Davidson clay Loam after Five Years of Heavy Poultry Manure Applications. J. Environ. Qual. 8, 387–392. doi:10.2134/jeq1979.00472425000800030024x
Wu, C. F., Wen, Q., Han, Y. L., Wang, Q., Jiang, Y., and Li, P. P. (2017). Effect of Water Retaining Agent and Straw Applications on Water and Fertilizer Status and Wheat Yield in Sandy Chao Soil. Chin. J. Soil Sci. 48, 692–700. doi:10.19336/j.cnki.trtb.2017.03.26
Xie, H., Li, J., Zhang, B., Wang, L., Wang, J., He, H., et al. (2015). Long-term Manure Amendments Reduced Soil Aggregate Stability via Redistribution of the Glomalin-Related Soil Protein in Macroaggregates. Sci. Rep. 5, 14687. doi:10.1038/srep14687
Xu, J., Han, H., Ning, T., Li, Z., and Lal, R. (2019). Long-term Effects of Tillage and Straw Management on Soil Organic Carbon, Crop Yield, and Yield Stability in a Wheat-maize System. Field Crops Res. 233, 33–40. doi:10.1016/j.fcr.2018.12.016
Yan, Y. L., Yu, J., Wei, Z. M., Zhang, J. S., and Wang, Z. G. (2007). Effects of Soil Properties on Water Absorption of Super Absorbent Polymers. Trans. CSAE 23, 76–79. doi:10.3321/j.issn:1002-6819.2007.07.014
Yan, X., Zhou, H., Zhu, Q. H., Wang, X. F., Zhang, Y. Z., Yu, X. C., et al. (2013). Carbon Sequestration Efficiency in Paddy Soil and upland Soil under Long-Term Fertilization in Southern China. Soil Tillage Res. 130, 42–51. doi:10.1016/j.still.2013.01.013
Yang, H. S., Liu, R. F., Zhang, J. P., and Wang, A. Q. (2005). Effects of Poly (Acrylic-acylamide)/Attapulgite Superabsorbent Composite on Soil Water Content and Physical Properties. J. Soil Water Conserv. 19, 38–41. doi:10.3321/j.issn:1009-2242.2005.03.010
Yang, Y. H., Wu, J. C., Zhao, S. W., Cao, L. H., and Huang, Z. B. (2007). Effects of PAM on Soil Retention Water. J. Northwest A F Univ. (Nat. Sci. Ed. ). 35, 120–124. doi:10.3321/j.issn:1671-9387.2007.12.024
Yang, Y. H., Wu, J. C., and Wu, P. T. (2009). Effect Mechanism of Straw Mulching and Water-Retaining Agent on Soil Structure, Evaporation, and Infiltration Process. Sci. Soil Water Conserv. 7, 70–75. doi:10.3969/j.issn.1672-3007.2009.05.013
Yang, Y. H., Wu, J. C., Han, Q. Y., He, F., Han, W. F., and Yang, X. M. (2011a). Quantitative Analysis of the Effect of Water-Retaining Agent on Soil Pores. Sci. Soil Water Conserv. 9, 88–93. doi:10.3969/j.issn.1672-3007.2011.06.015
Yang, Y. H., Wu, J. C., Wu, P. T., Huang, Z. B., Zhao, X. N., Guan, X. J., et al. (2011b). Effects of Different Application Rates of Water-Retaining Agent on Root Physiological Characteristics of winter Wheat at its Different Growth Stages. Ying Yong Sheng Tai Xue Bao 22, 73–78.
Yang, Y. H., Wu, J. C., Mao, Y. P., Han, Q. Y., and He, F. (2013). Using Computed Tomography Scanning to Study Soil Pores under Different Soil Structure Improvement Measures. Trans. CSAE 29, 99–108. doi:10.3969/j.issn.1002-6819.2013.23.014
Yang, Y., Wu, J., Zhao, S., Han, X., He, F., and Chen, C. (2018). Assessment of the Responses of Soil Pore Properties to Combined Soil Structure Amendments Using X-ray Computed Tomography. Sci. Rep. 8, 695. doi:10.1038/s41598-017-18997-1
Yang, Y., Wu, J., Zhao, S., Mao, Y., Zhang, J., Pan, X., et al. (2021). Impact of Long‐term Sub‐soiling Tillage on Soil Porosity and Soil Physical Properties in the Soil Profile. Land Degrad. Dev. 32, 2892–2905. doi:10.1002/ldr.3874
Zhang, Y., Zhao, S. W., Liang, X. F., and Hua, J. (2009). Effects of Super Absorbent on Growth of Patato and Soil Water Utilization in the Mountain Area of Southern Ningxia. Agric. Res. Arid Area 27, 27–32.
Zhang, J. H., Li, G. D., Wang, Y. S., Man, Z. R., and Zhao, L. P. (2012). Relationships of Soil Organic Carbon with its Active and Non-active Components under Different Land Use Types in the Middle Reaches of Heihe River, China. J. Appl. Ecol. 23, 3273–3280. doi:10.5846/stxb201110091473
Zhang, X., Wu, X., Zhang, S., Xing, Y., Wang, R., and Liang, W. (2014). Organic Amendment Effects on Aggregate-Associated Organic C, Microbial Biomass C and Glomalin in Agricultural Soils. Catena 123, 188–194. doi:10.1016/j.catena.2014.08.011
Zhang, S., Wang, R., Yang, X., Sun, B., and Li, Q. (2016). Soil Aggregation and Aggregating Agents as Affected by Long Term Contrasting Management of an Anthrosol. Sci. Rep. 6, 39107. doi:10.1038/srep39107
Zhong, X.-l., Li, J.-t., Li, X.-j., Ye, Y.-c., Liu, S.-s., Hallett, P. D., et al. (2017). Physical protection by Soil Aggregates Stabilizes Soil Organic Carbon under Simulated N Deposition in a Subtropical forest of China. Geoderma 285, 323–332. doi:10.1016/j.geoderma.2016.09.026
Zhou, H., Peng, X., Perfect, E., Xiao, T., and Peng, G. (2013). Effects of Organic and Inorganic Fertilization on Soil Aggregation in an Ultisol as Characterized by Synchrotron Based X-ray Micro-computed Tomography. Geoderma 195-196, 23–30. doi:10.1016/j.geoderma.2012.11.003
Zhou, H., Fang, H., Hu, C., Mooney, S. J., Dong, W., and Peng, X. (2017). Inorganic Fertilization Effects on the Structure of a Calcareous silt Loam Soil. Agron.J. 109, 2871–2880. doi:10.2134/agronj2016.10.0590
Keywords: superabsorbent polymer, organic manure, CT scanning, soil properties, crop yield
Citation: Yang Y, Wu J, Du Y-L, Gao C, Tang DWS and van der Ploeg M (2022) Effect on Soil Properties and Crop Yields to Long-Term Application of Superabsorbent Polymer and Manure. Front. Environ. Sci. 10:859434. doi: 10.3389/fenvs.2022.859434
Received: 21 January 2022; Accepted: 30 March 2022;
Published: 19 April 2022.
Edited by:
Gilles Colinet, University of Liège, BelgiumReviewed by:
Henry Oppong Tuffour, Kwame Nkrumah University of Science and Technology, GhanaYuyi Li, Institute of Agricultural Resources and Regional Planning (CAAS), China
Copyright © 2022 Yang, Wu, Du, Gao, Tang and van der Ploeg. This is an open-access article distributed under the terms of the Creative Commons Attribution License (CC BY). The use, distribution or reproduction in other forums is permitted, provided the original author(s) and the copyright owner(s) are credited and that the original publication in this journal is cited, in accordance with accepted academic practice. No use, distribution or reproduction is permitted which does not comply with these terms.
*Correspondence: Yonghui Yang, yangyongh2020@126.com