Visualization analysis of research on climate innovation on CiteSpace
 Zhice Cheng1,2
  Huwei Wen
- 1Research Center of the Central China for Economic and Social Development, Nanchang University, Nanchang, China
- 2School of Economics and Management, Nanchang University, Nanchang, China
- 3Ji Luan Academy, Nanchang University, Nanchang, China
Climate change has brought great challenges to global sustainability, but only few research achievements in innovation for climate change mitigation and adaptation have been reported. This study aims to identify the current research status and trends in climate innovation via CiteSpace visual analysis. We searched for published papers (up to 2021) in the core repository of Web of Science by using the theme of innovation for climate change mitigation and adaptation. Using the collected articles, we conducted co-authorship analysis, co-citation analysis, and keyword co-occurrence analysis and found that the main contributors are from America, England, and China. Moreover, climate innovation has an interdisciplinary knowledge source, and its main research frontier focuses on the design of policies for energy efficiency improvement and new energy technologies. These results point out some directions for further research on climate innovation and outline the knowledge structure in this field, thereby addressing the lack of studies on such topic. By analyzing the lineage of research developments, it is found that energy technology and energy efficiency would be the main research hotspots in climate innovation in the future, and relevant policies also need to strengthen incentives for research in this area. This study is particularly helpful for those researchers who are interested in climate innovation and can subsequently contribute to the long-term development of various research directions in this field, to the formulation of climate change mitigation and adaptation policies, and to the sustainable development of human society.
Introduction
Climate change is the most significant challenge to human survival and global sustainable development in the 21st century, and innovations to mitigate and adapt to climate change have attracted much scholarly attention accordingly (Stern, 2006; IPCC, 2007; Diffenbaugh and Field, 2013; Wen et al., 2022). Global warming may lead to a dramatic increase in global temperatures, thereby leading to increased evaporation and atmospheric water content and associated changes in rainfall patterns (De Frenne et al., 2021; Wang et al., 2021). Even small changes in the mean and variability of rainfall can lead to a significant increase in cases of extreme rainfall (Shahid et al., 2016) and jeopardize the safe development of human society. International organizations, government departments, and scholars are thus actively exploring policies and innovations to deal with climate change, the most important of which is to reduce energy consumption and carbon emissions (Hao et al., 2022; Wen et al., 2023).
Innovation is looked upon as the main solution to mitigate and adapt to climate change (Duan et al., 2015; Seddon et al., 2020). In this paper, the term “climate innovation” refers to any new technologies, policy initiatives, and business models that aim to alleviate climate change. One example of climate innovation is green finance (Wen et al., 2021; Lee and Lee, 2022). Meanwhile, “mitigation” refers to those measures taken to reduce greenhouse gas emissions and thus address the causes of climate change, whereas “adaptation” refers to those measures taken to address the precedents and consequences of climate change (Tompkins and Adger, 2005). The greenhouse effect is the core of climate change, which characterizes the process from the emission of greenhouse gases to the formation of the greenhouse effect (Wigley and Raper, 2001; IPCC, 2007). Effectively reducing carbon dioxide emissions is widely recognized as the most important way to control atmospheric concentrations of greenhouse gases and consequently mitigate climate change (Duan et al., 2015). Therefore, those innovations that facilitate the reduction of carbon emissions significantly contribute to climate change mitigation.
Climate policy is an important component of climate innovation and is regarded both as a form of management or institutional innovation and a guarantee that encourages private individuals or institutions to engage in climate innovation (Adkin, 2019; Tang et al., 2021; Zhou and Wang, 2022). A set of climate policies with clear objectives, including those that directly target science and innovation, can be instrumental in reducing the overall cost of emissions reductions (Newell, 2010; Galbreath et al., 2016). “Climate mitigation policies” refer to any policy that can drive reductions in greenhouse gas emissions. This type of innovation can drive various sectors to adapt to climate change, including agriculture, construction, and energy (Miklian and Hoelscher, 2020; López-Gunn et al., 2021; Ortiz-Bobea et al., 2021; Timilsina, 2021). For example, farmers and their support institutions have successfully adapted to environmental changes by introducing technological innovation measures (Brush and Turner, 1987; Chhetri et al., 2012). Considering energy security, energy sustainability, and the negative effects of climate change, a large number of climate policies have been formulated or introduced, but scholars remain doubtful about the effectiveness of such policies (Lee et al., 2022).
Many studies have highlighted how climate change mitigation and adaptation can be achieved through development innovation. Van den Bergh (2013) argued that adopting technological innovations to address environmental issues can positively contribute to the climate change problem and recommended that the corresponding policy innovations should be promptly implemented. Many studies have also examined the progress of government programs established to promote the development and diffusion of climate mitigation technologies and found that these programs have been moderately successful (Mowery et al., 2010; Dhar and Marpaung, 2015; Haselip et al., 2015; Watson et al., 2015; De Jong et al., 2016). Meanwhile, economic scholars have examined climate change along with economic growth using empirical models, whereas studies on renewable energy sources show that the increased consumption of renewable energy for climate change adaptation can contribute to economic growth (Mele et al., 2021). Another study examined the heterogeneous effects of carbon dioxide emissions and temperature changes on income and found that increasing temperature has a strong negative effect on income and that fossil fuels can positively contribute to both income growth and carbon emissions (Magazzino et al., 2021). In other words, those energy innovations that mitigate climate change can also reduce the impact of temperature change on income. While research on climate innovation has reported some progress, only few scholars have systematically investigated the integrated knowledge landscape of climate innovation. Research related to the field of climate innovation is rapidly attracting the attention of researchers in various countries, and has yielded many important results. With such rapid development, researchers are focusing on producing more relevant research results faster and more often, but neglecting to enhance the overall understanding of this research area. It is good that a field can develop rapidly, but only a reasonable rationalization of the knowledge of the field can make the research in the field more in-depth and meet the needs of reality. Therefore, for the long-term development of climate innovation research, we should understand the knowledge landscape of the field.
The knowledge landscape of a scientific domain can be represented by mapping a network of various entities, such as cited references, co-authors, and co-occurring keywords (Chen et al., 2014). Through visual analysis, we can understand the knowledge structure of a field and identify the main research directions and research frontiers. The general knowledge of a researcher about the research area and frontiers in a specific field plays an indispensable role in identifying the research direction and selecting a research topic. Therefore, to elucidate the knowledge landscape of climate innovation and promote the development of climate innovation, we employed bibliometric methods and visualization analysis as research methods (Van Leeuwen, 2006). We also used the Science Citation Index Expand (SCIE) and Social Science Citation Index (SSCI) citation databases as data retrieval sources and performed a visual analysis of climate innovation research using the CiteSpace software. We generated co-authorship networks to identify the authors, institutions, and countries with the highest number of published articles and generated co-citation networks from three levels of journals, literature, and authors to understand the distribution of core journals, the main research topics, the knowledge structure, and the influential authors in the field. We eventually built a co-occurrence network for keywords to understand the research hotspots and frontiers in the field.
Through the above analysis, the knowledge landscape of climate innovation research can be illustrated clearly. We identified the main contributors in the field of climate innovation at the micro, medium, and macro levels and establish partnerships between these contributors at different levels to facilitate the identification of the key authors, leading scientific institutions, and countries with the most advanced research processes in this field. We also learned about the important journals in the field to quickly identify the most important knowledge sources. We sorted out the research lineage, came up with several main research directions, and illustrated the overall knowledge landscape. Through the keyword co-occurrence analysis, we identified the research hotspots and frontiers in climate innovation, which helped us quickly understand the research development in this field and its future development trend, thereby providing researchers who are interested in climate innovation with some references regarding the most pressing issues in this area.
In sum, this paper provides an overview of the field of climate innovation to help interested researchers gain a general understanding of the subject. This paper provides a detailed analysis of current research in the field of climate innovation in terms of authorship, co-citation relationships, and keyword analysis. It enables the reader to gain an overview of the research in the field, thus enabling the researcher to quickly capture the current state of research in the field, as well as the main research directions. The paper identifies energy technologies and energy efficiency as the main research hotspots in the field of climate innovation in the future, enabling researchers to better respond to the trends in the development of research in the field of climate innovation. It helps researchers to reduce the waste of time and resources and to promote the development of human-friendly research in the most efficient way. Eventually, this paper facilitates the development of climate innovation research and accelerate climate change mitigation and adaptation. Once adaptation and mitigation of climate change is developed, sustainable development of human societies will be close at hand. Therefore, this paper not only contributes to the economic, political, or other aspects of human society but also to the sustainable development of people and nature. However, there are still some limitations in this paper. The data in this paper were downloaded from the SCIE and SSCI databases, where more than 99% of the articles were written in English. In this case, articles written in other languages were somehow ignored.
The rest of this paper is organized as follows. Section 2 presents the data sources and research methodology. Section 3 conducts a co-citation analysis at three levels, namely, micro (authors), medium (institutions), and macro (countries) levels, whereas Section 4 presents a more detailed co-citation analysis from the aspects of authors, journals, and literature. Section 5 conducts a keyword co-occurrence analysis to summarize the hot research topics and frontiers. Section 6 summarizes the article and proposes some directions for future research on climate innovation.
Data collection and research methods
Data collection
The Web of Science has long been considered the most authoritative tool for indexing scientific and technical literature in the most critical areas of scientific and technical research (Boyack et al., 2005). This database is often considered an ideal data source for bibliometric surveys (Van Leeuwen, 2006). Our data sources mainly included the SCIE and SSCI databases in the Web of Science Core Collection databases. The data were collected in May 2022 from the web version of the Nanchang University Library by employing a specific search strategy.
Topic = “Climate change” and “Innovation.” We retrieved articles whose titles, abstracts, or keywords include both “climate change” and “innovation” by using these two terms as search keywords. In this way, our retrieved articles are not limited to either climate change or innovation but also includes content that is at the intersection between climate change and innovation. To better define the scope of climate innovation in our selection of articles, we broke down the concept of climate innovation into the following categories (Dale et al., 2020):
(1) Climate technology innovation. Climate change mitigation technologies (CCMTs) are effective innovation tools for mitigating climate change (Bel and Joseph, 2018). The patent database of the European Patent Office contains 3 million patent documents related to CCMTs with the code Y02, which refers to technologies and applications for mitigating or adapting to climate change. These technologies can be further divided into the following sub-categories: Y02B (CCMTs for the construction industry), Y02C (CCMTs for greenhouse gas collection and storage), Y02E (CCMTs for energy production, storage, and distribution), Y02P (CCMTs for the production industry), Y02T (CCMTs for the transportation industry), and Y02W (waste treatment CCMTs) (Su and Moaniba, 2017).
(2) Climate policy innovation. Theoretical innovation, which includes macroeconomic policy and micro business management innovations, does not have a direct effect on climate change but indirectly promotes technological innovation to play a role in mitigating or adapting to climate change (Upham et al., 2014).
(3) Other innovations. This category includes other innovations in agriculture and biology that contribute to climate change adaptation.
Document type = article. Given that only peer-reviewed original article data can represent original scientific developments (Yao et al., 2014), we restricted the document type to articles during our search. However, given that some articles may also be classified as other document types, we also included compound types of documents as data sources.
Timespan = before 2022. We did not restrict our search period to ensure that all the literature related to climate change and innovation will be included in our analysis. We selected 30 December 2021 as the final time point for screening the literature.
Database = SSCI and SCIE databases. The subject characteristics in these two databases are different, and social science papers tend to take a longer time to finish compared with engineering papers. Therefore, we searched and analyzed these two databases separately to obtain highly comparable data and ensure a highly reasonable data analysis.
Following the above search principles, we eventually extracted 1406 and 1492 articles from the SSCI and SCIE databases, respectively. We stored these articles in two file formats, namely, “record content” for complete records and cited references, and “file format” for plain texts.
Research method
Visualizing scientific knowledge based on social network analysis and graph theory has become an emerging field in bibliometric methods. Nine representative software tools have been specified for development to facilitate the use of scientific mapping by other researchers to analyze scientific domains (Cobo et al., 2011; Chen and Liu, 2020). The scientific knowledge graphs analysis software used in this paper, CiteSpace, is a freely available Java-based analysis software developed by Prof. Chaomei Chen (Liu et al., 2015) that has been used globally given its advanced and powerful features (Hou and Hu, 2013). This paper used CiteSpace v. 5.8.R3. To use this software, the main steps are to first import the data into the software and adjust the appropriate parameters, such as year, node type, etc. From there, the software is able to process the data and provides useful network figures. And the main analysis steps are as follows:
First, we created two projects in CiteSpace called “Climate and Innovation SSCI” and “Climate and Innovation SCIE.” We then imported into these projects 1406 and 1493 documents containing full records and references in plain text files, respectively.
Second, we set the following parameters in the software interface:
1. Time. We set the time span starting from the year of the documented records up to 2021 as the cut-off year. The time span for the SSCI database ranged from 2010 to 2021, whereas that for the SCIE database ranged from 1997 to 2021. We set the time slice year to 1 for the co-authorship analysis and to 5 for all other analyses.
2. Term source. Our term source included titles, abstracts, author keywords, and keywords.
3. Node type. Our node type included authors, institutions, countries, cited references, cited authors, cited journals, and keywords. In the different analyses that follow, we use different types of nodes. For example, in the keyword analysis, the node type we use is the “keyword.”
4. Selection criteria. We set pruning to “pathfinder” and “pruning sliced networks,” set the link to “default,” and set visualization to “cluster view static” and “show merged networks.”
Third, we obtained a co-occurrence network and data using CiteSpace. The nodes in the obtained networks included the authors, institutions, and countries that have published two or more articles. Using the screenshot function that comes with Windows, we exported the network figures generated by CiteSpace. We used the figures of these networks for the co-authorship, co-citation, and keyword co-occurrence analyses and then examined the co-occurrence network results and data to derive the final results of our climate innovation visualization analysis.
Co-authorship analysis of climate change innovation research
Co-authorship is among the most tangible, logical, and well-documented forms of scientific collaboration (Glänzel and Schubert, 2004). Co-authorship often takes place at three levels, namely, individual, institutional unit, and country. Co-authorship analysis allows us to understand the cooperation among research institutions and the research strength of these institutions. This technique also allows us to know the core authors and the cooperation among scholars in the field of climate innovation, thereby shedding light on the overall research development process and the research cooperation among countries.
Author co-authorship analysis
Authorship is the smallest unit of publication of a paper. By conducting author co-authorship analysis, we can understand the publication status at the micro level. We plotted the graphical network of author co-authorship in two fields, namely, SCIE and SSCI (Figure 1). Table 1 summarizes the information about the top 10 authors in terms of number of publications.
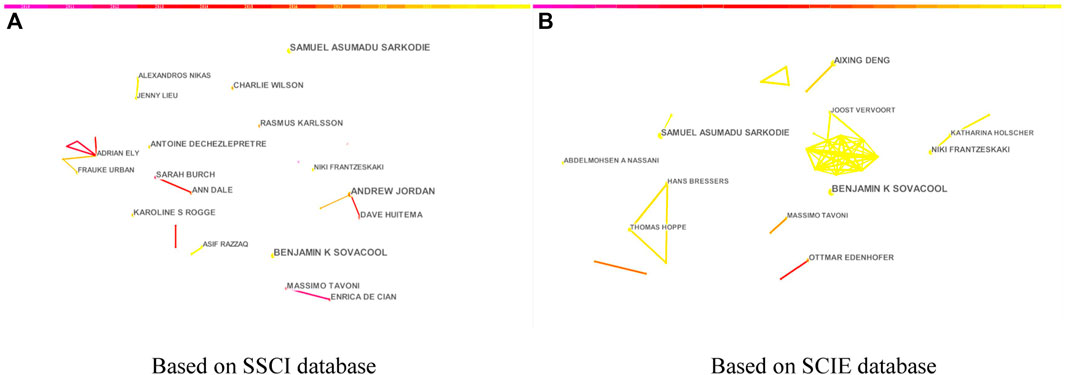
FIGURE 1. Map of the author co-authorship network of climate innovation research. (A) refers to the SSCI database and (B) refers to the SCI database.
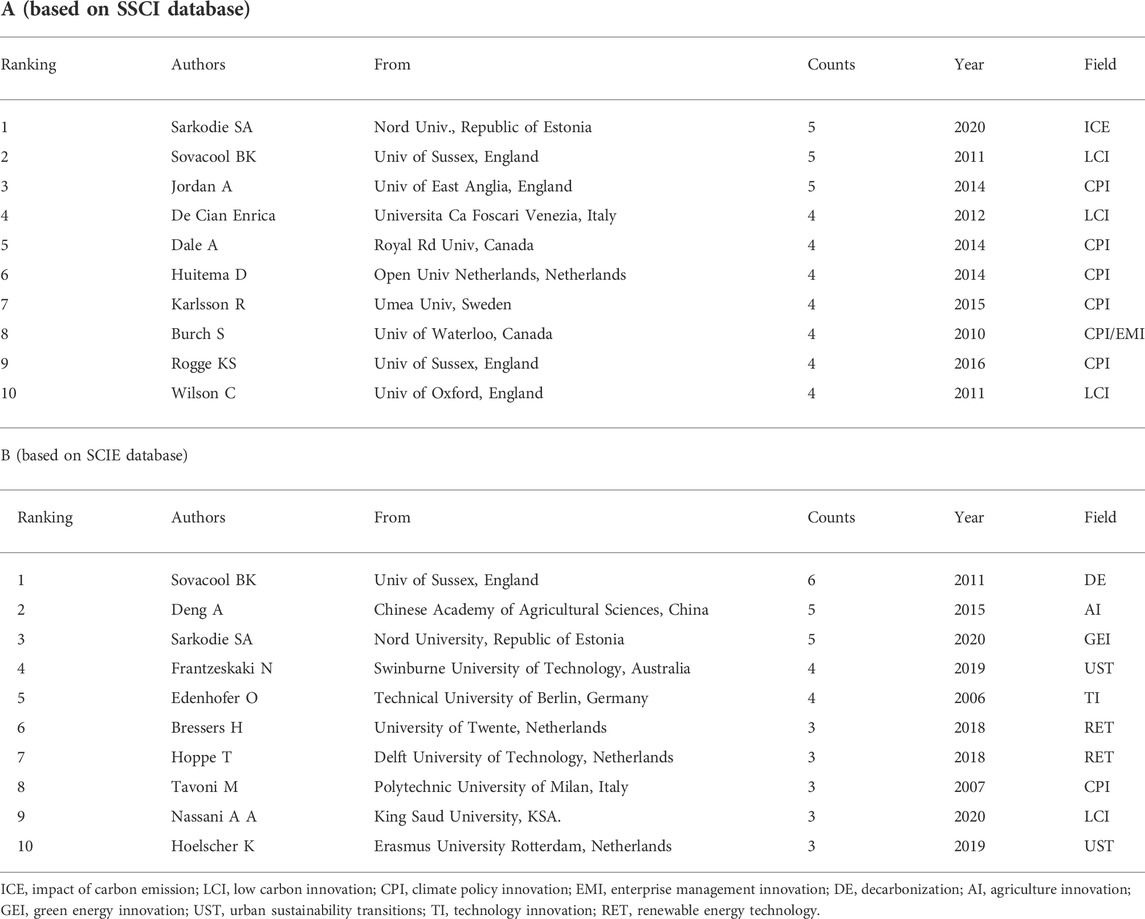
TABLE 1. Top 10 most productive authors in climate innovation research.
Figures 1A,B show the academic collaboration between authors. To generate reasonable network co-occurrence graphs, we set reasonable thresholds and excluded some isolated nodes. Therefore, only the most effective information is kept in the graph. Each label next to the node means the author. The size of nodes indicates the number of articles published by an author, and the lines between nodes indicate the collaboration between authors. A thicker line indicates a stronger connection between authors.
The graph in Figure 1A reflects the collaborative relationships among authors in SSCI. The figure marks those authors with three or more publications. The network has 358 nodes and 142 connecting lines, and the density of collaboration is only 0.0022, indicating a lack of collaboration among the issuing institutions. The most prolific research team in this network is a three-member team headed by Jordan A and including Huitema D and Tosun J, whereas the largest research team is a six-member group headed by Ely A and Urban F, with the remaining four members being Stirling A, Smith A, Stirling A, and Geall S.
The authors with three or more publications in Figure 1B are flagged. The graph has 491 nodes and 329 links, and the collaboration density is only 0.0027, indicating a weak collaboration among authors. However, a sub-network with more nodes and other decentralized collaborative node connections can be seen. The presence of 11 nodes in this sub-network indicates the formation of a large research team of some size in SCIE. This research team is headed by Vervoort J, and the remaining 11 members are Masond’croz D, Barrett CB, Obersteiner M, Benton TG, Nelson R, Fanzo J, Herrero M, Bryan B, Mathys A, Campbell BM, and Mcgeoch MA.
To give a more visual representation of which authors are more prolific, Table 1 lists the top 10 authors in terms of the number of articles published and their related information. From Table 1A, we can see that Sarkodie SA and Sovacool BK are the most prolific authors, contributing five articles on research on climate innovation, with their main research interests being carbon emission impacts and low-carbon innovation, respectively. The remaining authors all contributed four articles in different research areas. Specifically, Jordan A mainly focused on climate policy innovation, De Cian E focused on low carbon innovation, and Dale A, Huitema D, Karlsson R, Burch S, and Rogge KS mainly contributed articles on climate policy innovation, of whom Burch S also contributed to corporate management innovation in response to climate change and Huitema D being part of the same research team led by Jordan A.
From Table 1B, we can see that the most prolific author in SCIE is Sovacool, B.K., with six articles focusing on decarbonization. The second and third most prolific authors contributed five articles each, with Deng A focusing on agricultural innovation, and Sarkodie SA focusing on green energy innovation. The next two authors contributed four articles each, with Frantzeskaki N focusing on urban sustainability transitions, and Edenhofer O focusing on technological innovation. The remaining 6–10 authors contributed three articles each. Specifically, Bressers H and Hoppe T contributed to renewable energy technology, Tavoni M mainly focused on climate policy innovation, Nassani AA contributed to low carbon innovation, and Hoelscher K focused on urban sustainability transitions. Both Frantzeskaki N and Hoelscher K are part of the same research team led by the former, whereas Bressers H and Hoppe T are part of the same team also led by the former.
In general, the collaboration among researchers was weak, and the authors preferred to conduct their studies individually. Even when collaborating, the collaborative research teams only had a few members. The authors in SCIE tend to collaborate more than those in SSCI and had formed larger collaborative teams. Although authors prefer to collaborate with authors from the same country, inter-country authorships were also observed, thereby suggesting that collaboration breaks down geographical barriers to some extent. Highly prolific authors generally come from a dispersed set of countries, with European countries (e.g., the UK and the Netherlands) comprising the majority. In SSCI, eight authors were from European countries, such as Sweden, the Netherlands, and Italy, with four authors coming from the UK. Meanwhile, in SCIE, seven authors came from European countries.
Institution co-authorship analysis
The identified authors were affiliated with different or similar institutions, thereby allowing these institutions to form collaborative networks of co-authorship at the medium level. We mapped the co-authorship networks of institutions in SCIE and SSCI (Figure 2). Table 2 summarizes the top 10 institutions in terms of the number of publications and their corresponding information.
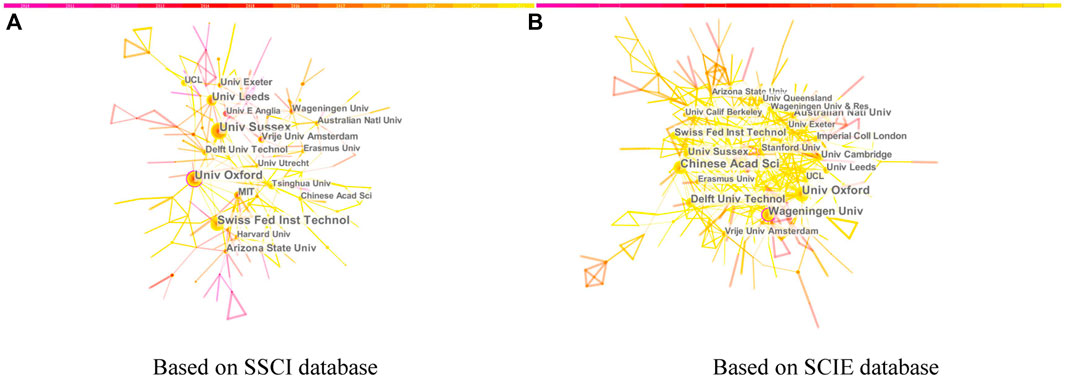
FIGURE 2. Map of the institution co-authorship network of climate innovation research. (A) refers to the SSCI database and (B) refers to the SCI database.
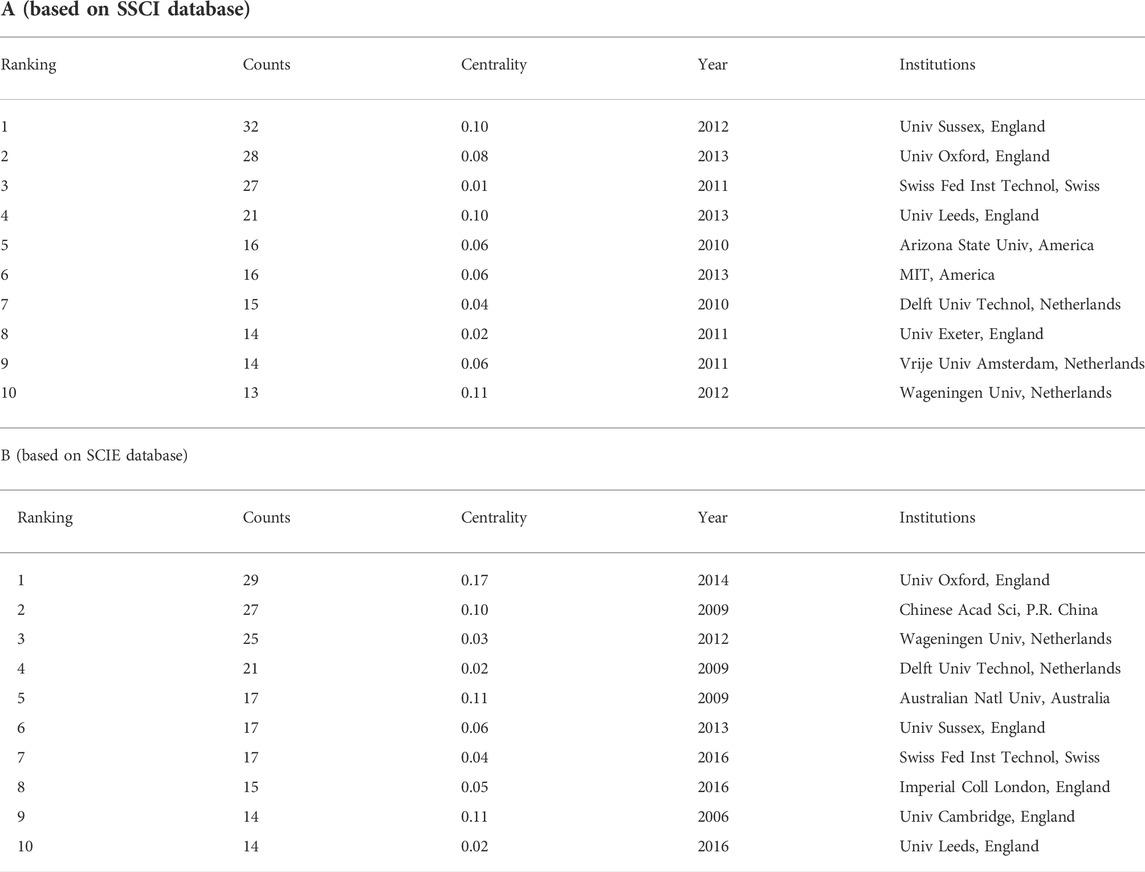
TABLE 2. Top 10 most productive institutions in climate innovation research.
Similar to authors co-authorship, each lable next to the node means the institution, and the size of each node indicates the number of articles published by an institution. The lines between the nodes indicate the collaboration between the institutions, and a thicker line indicates a stronger connection.
Figure 2A marks those institutions in SSCI with more than 10 publications. The graph has 368 nodes, 334 connected lines, and 0.0049 collaboration density. In other words, the collaborating institutions in SSCI are closely connected, and the internal substructures of the main network are connected by various bridges. The main issuing institutions are also closely connected. For example, Univ Sussex and Univ Oxford rank as the first and second institutions with the most number of issued articles and have a direct and close cooperation. In addition to the highly centralized institutions, sporadic collaborations also exist among the remaining institutions, indicating a relatively good state of inter-institutional collaboration in social sciences.
Figure 2B marks those institutions in SCIE with more than 10 publications. The graph has 476 nodes, 630 links, and 0.0056 collaboration density. Inter-institutional cooperation dominates the main network. Many close and large-scale collaborations are observed among the issuing institutions. For example, the node corresponding to Wageningen Univ is connected to the remaining 23 nodes at the same time, indicating that this institution has engaged in some form of cooperation with the other 23 institutions. Meanwhile, Swiss Fed Inst Technol is connected to 17 nodes at the same time, indicating that this institution cooperates with 17 other institutions simultaneously. In addition to those institutions with high centrality, sporadic collaborations are also observed among the remaining institutions, thereby indicating a relatively good state of inter-institutional cooperation in science and engineering.
Table 2 lists the top 10 institutions in terms of the number of articles published and their related information. As shown in Table 2A, Univ of Sussex ranks first with 32 articles published, followed by Univ Oxford (28), Swiss Fed Inst Technol (27), Univ Leeds (21), Arizona State Univ (16), MIT (16), Delft Univ Technol (15), Univ Exeter (14), Vrije Univ Amsterdam (14), and Wageningen Univ (13). All of these institutions are universities and contributed 196 articles, which accounted for 13.94% of all articles (1406) on climate and innovation research in SSCI.
As shown in Table 2B, Univ Oxford ranks first with 29 articles, followed by Chinese Acad Sci (27 articles), Wageningen Univ (25 articles), Delft Univ Technol (21 articles), Australian Natl Univ (17 articles), Univ Sussex (17 articles), Swiss Fed Inst Technol (17 articles), Imperial Coll London (15 articles), Univ Cambridge (14 articles), and Univ Leeds (14 articles). Nine of these institutions are universities, and one is an academic institution. These ten institutions contributed 196 articles (169 articles from the universities, and 27 articles from the academic institution, accounting for 11.32% and 1.81% of all 1492 articles in SCIE, respectively). Univ Sussex, Univ Oxford, Swiss Fed Inst Technol, Univ Leeds, Arizona State Univ, Delft Univ Technol, and Wageningen Univ all appeared in both Tables 2A,B.
In sum, the university still acts as the main driving force behind climate innovation research. Moreover, the total number of articles produced by the top 10 highest-producing institutions does not account for a large proportion of all research articles, thereby indicating that research institutions with absolute dominance in this field have not yet been formed. Among these institutions, Univ Sussex, Univ Oxford, and Swiss Fed Inst Technol all perform well and have great research strength. Most of these high-producing institutions are located in Europe.
Country co-authorship analysis
The fact that the identified authors and their institutions come from different or similar countries allows us to examine the distribution of authors at a macro level. We mapped the collaboration network among countries in SCIE and SSCI (Figure 3). Table 3 summarizes the top 10 countries in terms of the number of publications and their related information.
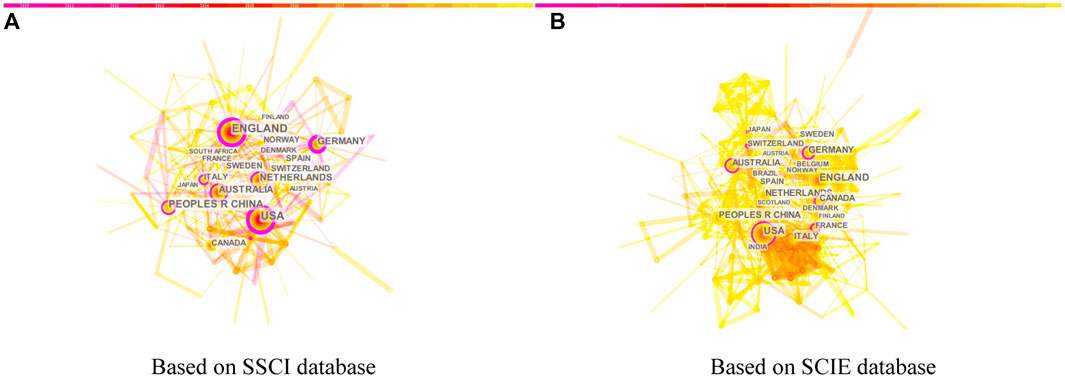
FIGURE 3. Map of the country co-authorship network of climate innovation research. (A) refers to the SSCI database and (B) refers to the SCI database.
TABLE 3. Top 10 most productive countries in climate innovation research.
Figures 3A,B show the networks of national co-authors of climate innovation research in SCIE and SSCI to reveal the status of respective research across countries. The nodes represent the countries, and their size indicates the number of papers published. The distance between these nodes and the thickness of the links represent the degree of cooperation among countries. The purple circle on the periphery of a node indicates that this node is highly central.
Figure 3A marks those countries with 25 or more articles. This graph consists of 99 nodes and 383 links. These 99 countries are widely distributed and found in all continents of the world, except Antarctica. Among the top 20 countries, two are from North America (the USA and Canada), 13 are from Europe (the UK, the Netherlands, Germany, Italy, Spain, Sweden, Switzerland, Norway, France, Denmark, Austria, Finland, and Scotland), two are from Asia (China and Japan), two are from Oceania (Australia and New Zealand), and one is from Africa (South Africa). As shown in Figure 3A, the cooperation network is dense, and the cooperation between countries is close. Eight nodes corresponding to the UK, the USA, Germany, Australia, China, Kenya, the Netherlands, and Italy had purple outer rings, indicating that these countries play a key role in innovative climate change adaptation research.
Figure 3B shows those countries with more than 30 articles. The graph contains 129 nodes and 703 links and has a collaboration density of 0.0852. These 129 countries are also widely distributed across the world, except in Antarctica. Among the top 20 countries, two are from North America (the USA and Canada), 13 are from Europe (the UK, Germany, the Netherlands, Italy, Spain, France, Sweden, Switzerland, Norway, Denmark, Belgium, Austria, and Finland), three are from Asia (China, Japan, and India), one is from Oceania (Australia), and one is from South America (Brazil). Seven nodes corresponding to France, Germany, Canada, the USA, Australia, Switzerland, and Japan have purple outer rings, indicating that these countries play key roles in the innovative climate change adaptation research.
Tables 3A,B show the top 10 countries in these two areas ranked in a descending order according to their number of publications. As shown in Table 3A, in SSCI, the highest number of publications came from the USA (329), followed by the UK (283), China (170), the Netherlands (123), Germany (120), Australia (116), Canada (90), Italy (68), Sweden (62), and Spain (62). Meanwhile, Table 3B shows that in SCIE, the largest contributor was the USA (372), followed by the UK (267), China (210), Germany (153), the Netherlands (149), Australia (132), Italy (101), Canada (97), Spain (79), and France (67).
From the above analysis, we can find that climate innovation has attracted increasing attention from various countries. In general, these countries cooperate closely in these two areas, with the US, Germany, and Australia playing key roles in connecting the two areas of transnational cooperation.
Co-citation analysis of climate change innovation research
Co-citation analysis builds professional structures or maps, monitors the development of scientific fields, and evaluates the degree of interrelationship among professions (Small, 1973). A co-citation relationship holds when two or more authors, journals, and documents appear simultaneously in the reference list of a third document (Osareh, 1996). Therefore, the three main forms of co-citation analysis can reveal the structure and relationships among authors, journals, and documents.
Author co-citation analysis
Author co-citation analysis allows us to visualize which authors have the greatest influence in the field of climate innovation and understand the overall development of this field. We mapped the co-occurrence network of author co-citation in SCIE and SSCI (Figure 4). Table 4 summarizes the top 10 cited authors and their related information. In Figures 4A,B, a larger node indicates a greater number of citations of the author corresponding to such node. The connection between nodes indicates the presence of a co-citation relationship between the authors corresponding to these nodes. The closer the nodes are to each other, the stronger the connection between these two nodes and the higher the number of co-citations.
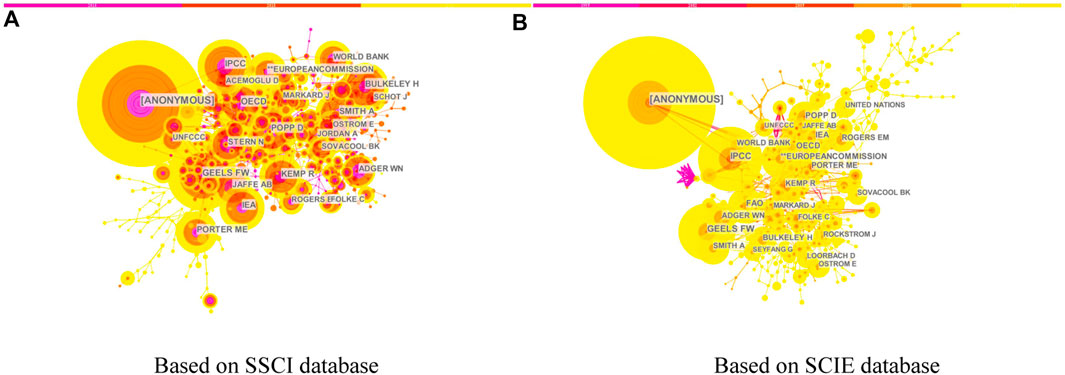
FIGURE 4. Map of the author co-citation network of climate innovation research. (A) refers to the SSCI database and (B) refers to the SCI database.
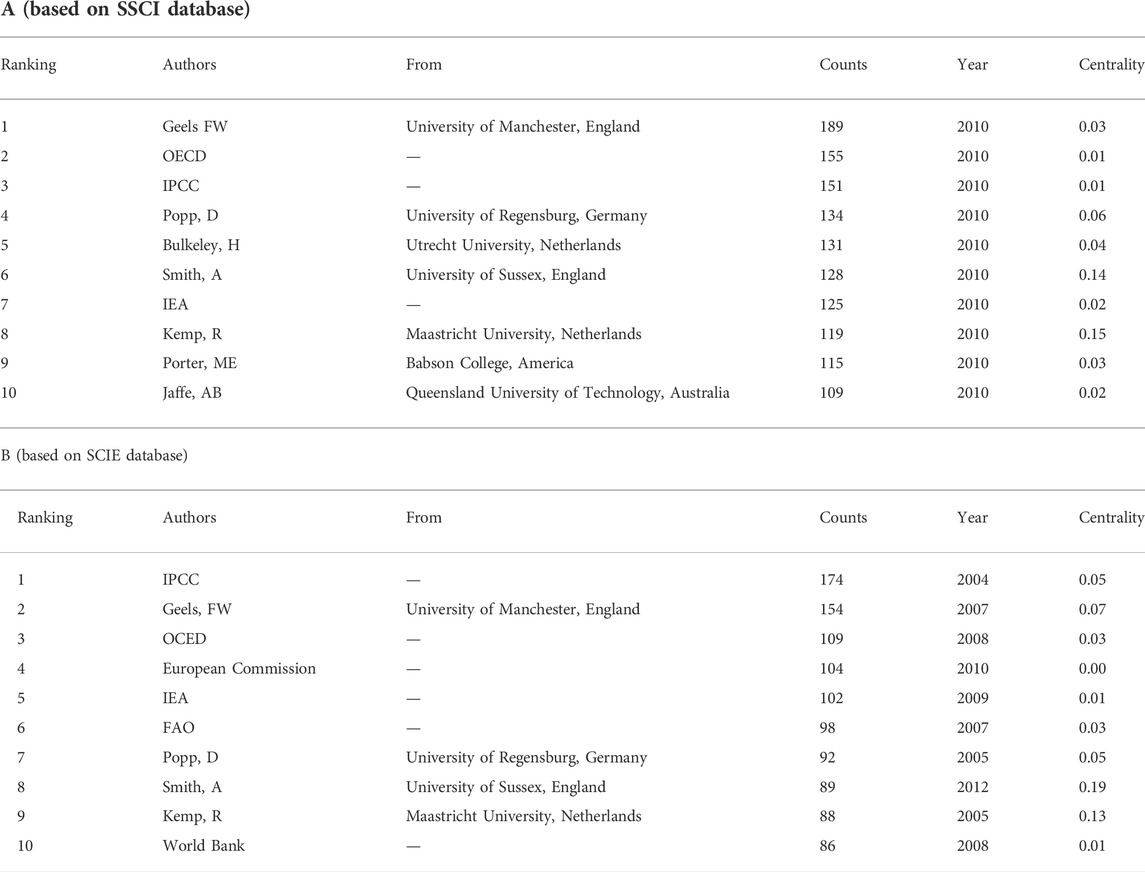
TABLE 4. Top 10 most cited authors in climate innovation research.
Figure 4A marks those author nodes with 60 or more citations. With the anonymous authors being excluded, the largest node in SSCI corresponds to Geels, F. W., who was co-cited with Smith A and other authors (Markard J, Bolton R, Turnheim B, Loorbach D, Kemp R, and Schot J), all of whom share a concern for sustainability transition policy and climate policy innovation. The second largest node represents the Organization for Economic Cooperation and Development (OECD), an intergovernmental international economic organization of 38 market economy countries that aims at jointly addressing the economic, social, and governmental governance challenges of globalization and seizing opportunities. The co-authors include the European Commission, Griliches Z, Keller W, and Fankhauser S, who focused on climate change policies and related legislation. The nodes in this co-occurrence network are closely linked, indicating that the research of the involved authors consistently focuses on climate policy innovation.
Figure 4B marks those author nodes with more than 50 citations. With the anonymous authors being excluded, the largest node in SCIE corresponds to the Intergovernmental Panel on Climate Change (IPCC), which was co-cited with the World Bank and other authors (United Nations Climate Change Conference, Weyant JP, Arrouw KJ, Barker T, and Peters GP). The IPCC is a non-departmental public body that oversees the system for handling complaints made against police forces in England and Wales. These authors are jointly concerned about the global approaches to climate change governance and decarbonization. Meanwhile, the second largest node represents Geels FW, who was co-cited with Verbong G, Markard J, Berkhout F, Rotmans J, Kohler J, Smith A, Seyfang G, and Loorbach D, all of whom focused on sustainability transition and related policy and management innovations. In this co-occurrence network, the nodes of the main sub-networks are closely linked, indicating a relatively consistent research direction among the authors.
Tables 4A,B list the top 10 authors in a descending order according to the number of citations received by their articles. Table 4A shows that in SSCI, the most cited author is Geels FW (189), followed by the OECD (155), IPCC (151), Popp D (134), Bulkeley H (131), Smith A (128), the International Energy Agency (125), Kemp R (119), Porter ME (115), and Jaffe AB (109). Among them, three are official institutions, and seven are researchers. Meanwhile, Table 4B shows that the most cited author in SCIE is IPCC (174), followed by Geels FW (154), the OECD (109), the European Commission (104), the International Energy Agency (102), the Food and Agriculture Organization of the United Nations (98), Popp D (92), Smith A (89), Kemp R (88), and the World Bank (86). Six of these authors are official institutions, and the four remaining authors are researchers. These results show that the research of these authors has played a key role in the development of climate change research and that they are influential in this field.
In sum, the results of author co-citation analysis in both fields not only clarify the main areas of research on climate innovation and the intellectual framework but also allow us to identify more influential authors in this field.
Journal co-citation analysis
Given that scholarly journals are the primary means of communication, journal co-citation analysis can help us understand the structure of a scholarly field (Hu et al., 2011). The condition for two journals to be co-cited is that at least one article from these journals is included in the reference list of the cited article (McCain, 1991).
We used CiteSpace to plot Figures 5A,B, where the nodes represent the journals and the connections between nodes represent the co-citation relationships between journals. The size of each node represents the number of times that a journal has been cited, and the distance between two nodes represents to some extent how often a journal has been co-cited. A larger node indicates the greater importance of a journal, and a smaller distance between two nodes indicates a higher co-citation frequency of a journal.
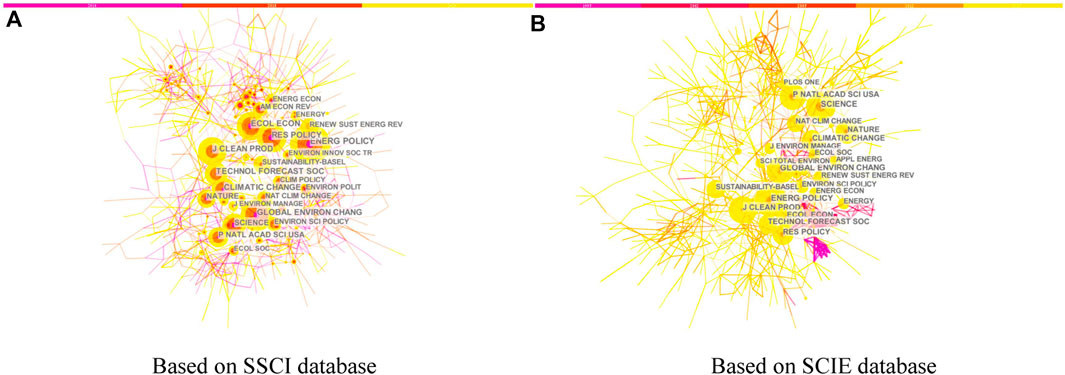
FIGURE 5. Map of the journal co-citation network of climate innovation research. (A) refers to the SSCI database and (B) refers to the SCI database.
Figure 5A marks those journals with more than 180 citations. The graph includes 737 nodes and 1169 links. These nodes are closely connected and form a high-density co-occurrence network, indicating a strong journal co-citation relationship in SSCI. Figure 5B marks those journals with more than 170 citations. This graph contains 794 nodes and 1231 links. Compared with Figure 5A, the nodes in this graph are more closely connected, with those journals having slightly earlier citation years being scattered around. The lower right corner of the graph shows a highly independent sub-structure of the cited journals. Overall, strong journal co-citation relationships can be observed in SCIE. Therefore, the disciplines of research on climate innovation are concentrated in both SSCI and SCIE.
In general, core journals refer to those journals with a high number of citations. Tables 5A,B list the top 10 cited journals along with their citation counts, centrality, cited journal name, impact factor (IF) in 2021, and JCR subject classification. Both these tables list the same 10 journals, indicating that these journals with the top 10 citation counts are considered core journals in both SSCI and SCIE. Moreover, the IF of these journals all exceed 3, thereby confirming their high quality.
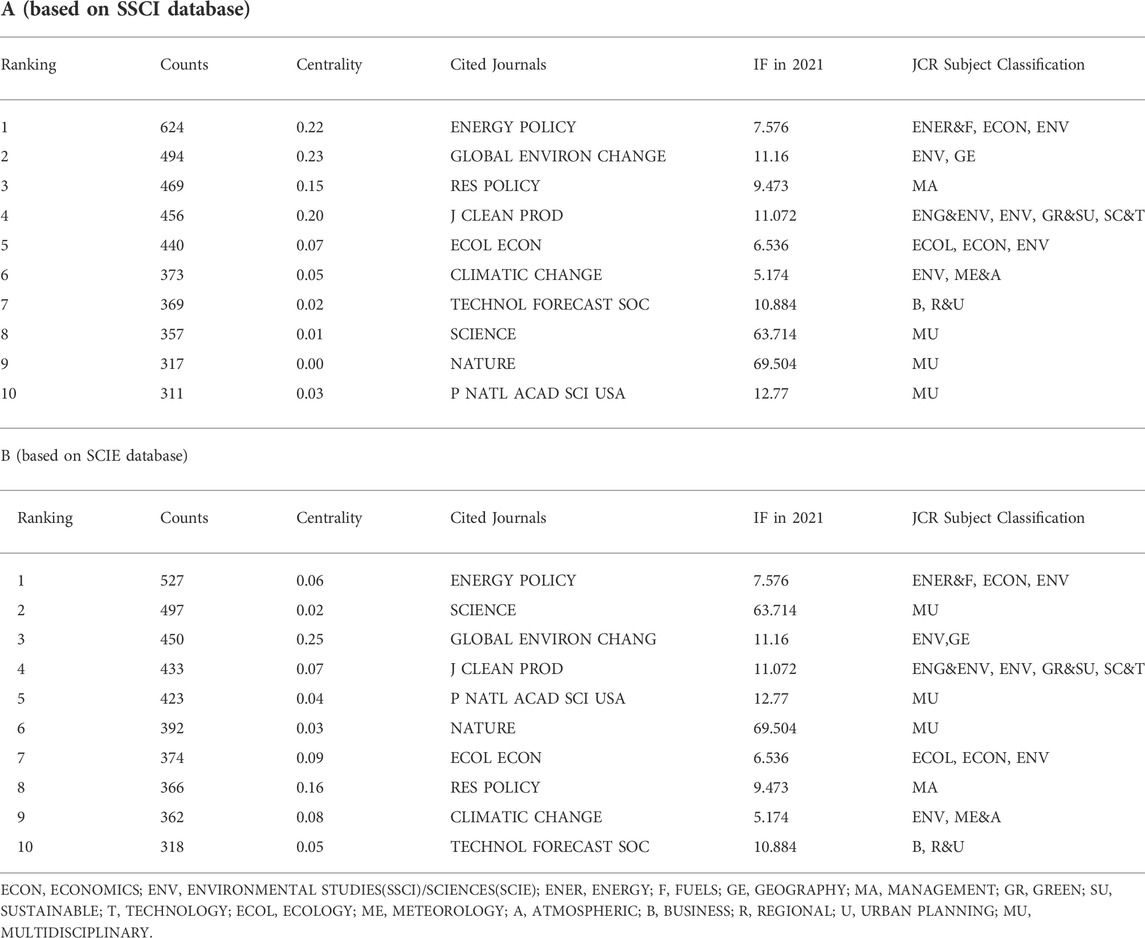
TABLE 5. Top 10 most cited core journals on climate innovation.
A co-citation analysis of journals reveals the distribution of key knowledge sources for research in both fields, thereby allowing us to identify which journals are highly cited and establish links between the core and non-core journals in the field. Most of these journals cover a wide range of subjects, including SCIENCE and NATURE, both of which are generally subject journals. This result also confirms the interdisciplinary nature of climate innovation research.
Document co-citation analysis
Documents serve as important knowledge bases of domain articles. By selecting representative studies as the objects of analysis, document co-citation analysis can provide an important means for detecting domain-specific structures and evolutionary paths (Liao et al., 2018). We built Figures 6A,B using CiteSpace, where the nodes represent the cited documents, and the connections between the nodes represent the co-citation relationships between these documents. A larger node corresponds to the greater importance of the literature, whereas a smaller distance between two nodes indicates the higher co-citation frequency of the literature and a greater similarity in their research topics.
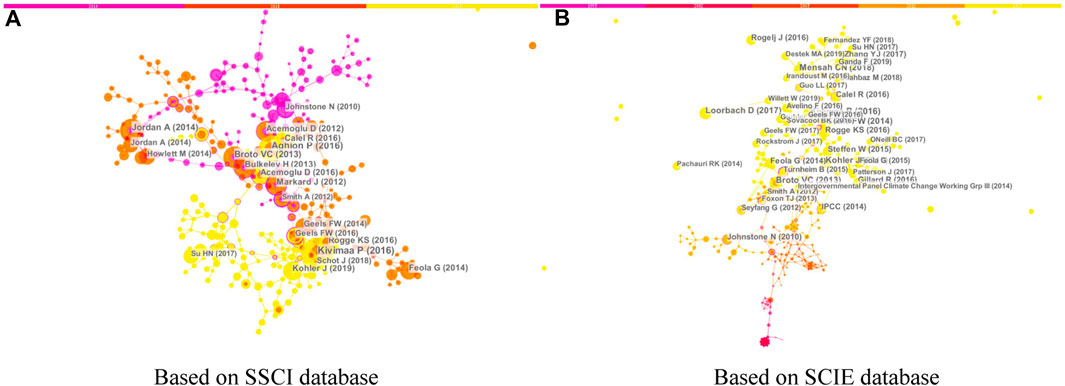
FIGURE 6. Map of the document co-citation network of climate innovation research. (A) refers to the SSCI database and (B) refers to the SCI database.
Figure 6A marks those articles with 13 or more citations. Those nodes with a purple outer ring have a high centrality. The node corresponding to Smith A (2012) has the highest centrality of 0.44 and is therefore located at the center of the literature co-citation network in SSCI. The node with the second highest node centrality corresponds to Geels et al. (2016), which connects the backbone in the network to its branches. Both of these articles are published in RES POLICY and focus on the same issues regarding sustainability transitions. In Smith A, solar power was used as an example to underscore the need to provide a protected space to promote sustainable innovation (2012). Meanwhile, Geels FW conducted a comparative analysis of UK and German electricity transitions using the conceptual categories in Geels FW (2004) to reformulate and distinguish the existing transition pathways in terms of endogenous enactment. Both of these articles provide basic theoretical pathways for the development of climate innovation research from which other branches, such as climate change policy innovation, have been derived.
Figure 6B marks those articles with nine or more citations. The co-occurrence network in this figure demonstrates a consistent development and only has one branch headed by Johnston N (2014). One of the nodes with the highest node centralities corresponds to Foxon. (2013), which has a centrality of 0.5. This article, which was published in ENERGY POLICY, focused on the energy transition in the UK and described a low-carbon electricity development scenario or transition pathway in the UK to 2050 by developing and analyzing three core transition pathways from the perspective of actors at the government, market, and private levels. This article contributes to the development of climate innovation research at these three levels in the SCIE.
Tables 6A,B list the top 10 cited papers in both fields along with their citation numbers, centralities, authors, years of publication, and journal information. As shown in Table 6A, five studies (Markard et al., 2012; Bulkeley and Castan Broto, 2013; Jordan and Huitema, 2014; Kivimaa and Kern, 2016; Rogge and Reichardt, 2016) were frequently cited in the field of environmental studies, four studies (Acemoglu et al., 2012; Acemoglu et al., 2016; Aghion et al., 2016; Calel and Dechezlepretre, 2016) were frequently cited in economics, and one article (Acemoglu et al., 2016) was frequently cited in environmental science. Meanwhile, in Table 6B, three papers (Kivimaa and Kern, 2016; Loorbach et al., 2017; Kohler et al., 2019) were frequently cited in environmental studies, four articles (Broto and Bulkeley, 2013; Geels, 2014; Steffen et al., 2015; Mensah et al., 2018) were frequently cited in environmental science, and thre papers were frequently cited in economics (Calel and Dechezlepretre, 2016), business economics (Johnstone et al., 2010), and environmental sciences ecology (Rogelj et al., 2016). Most of the latest 2022 publications, much of the literature focused on the mitigation effect of green innovation on climate change (Dong et al., 2022; Sun et al., 2022). These studies serve as roots of knowledge in their respective research areas.
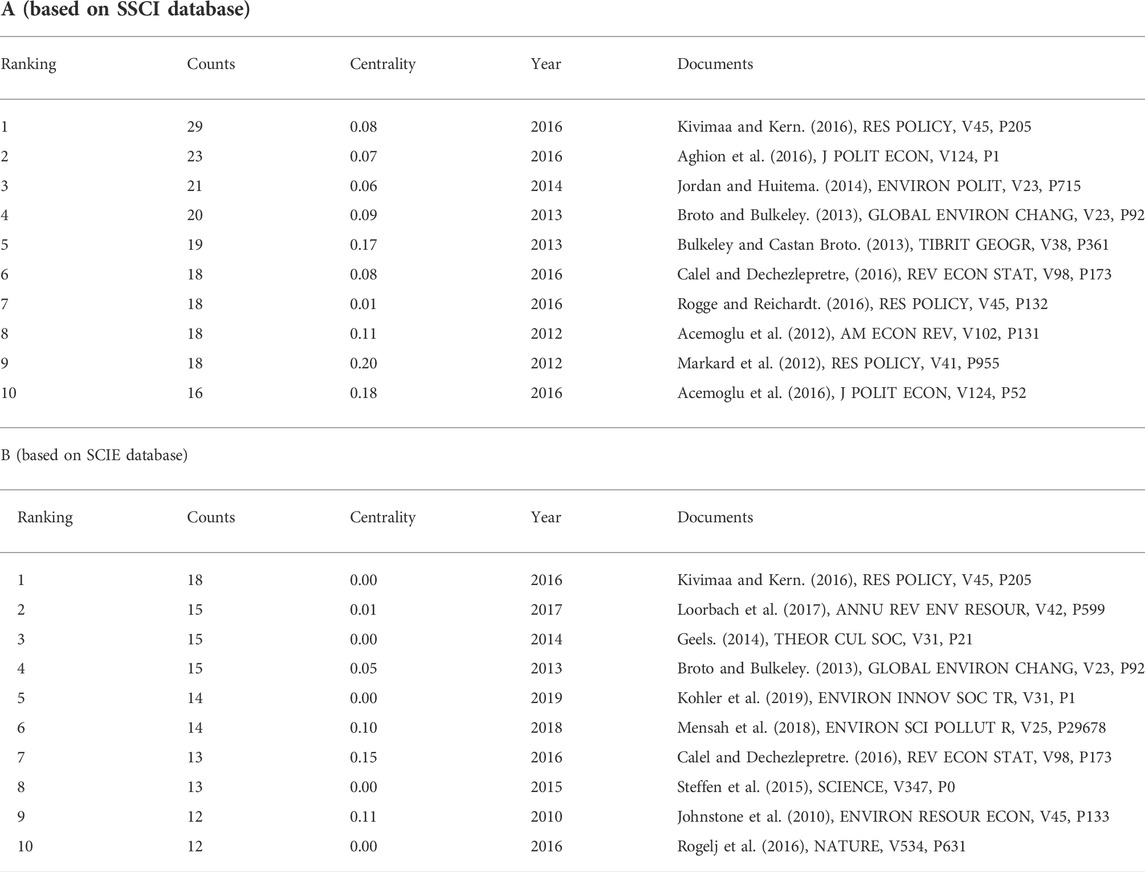
TABLE 6. Top 10 most cited documents on climate innovation.
As we analyzed above, the knowledge structure of climate innovation research is taking shape. Through literature co-citation analysis, we can not only identify the highly cited and influential research but also understand the interaction between our research area of interest and other areas.
Keywords co-occurrence analysis of climate change innovation research
Keywords allow us to quickly capture the core content of an article. By observing the changes that occur over time, the knowledge graph of keyword co-occurrence can reflect the hottest topics in a certain field. Simultaneously burst keywords (i.e., keywords that are frequently cited over time) can indicate cutting-edge topics (Yu et al., 2017). We built Figures 7A,B using CiteSpace, where each node represents a keyword, and the size of a node is proportional to the co-occurrence frequency of such keyword. Tables 7A,B list the 10 burst keywords with the highest citation burst rate in the two domains.
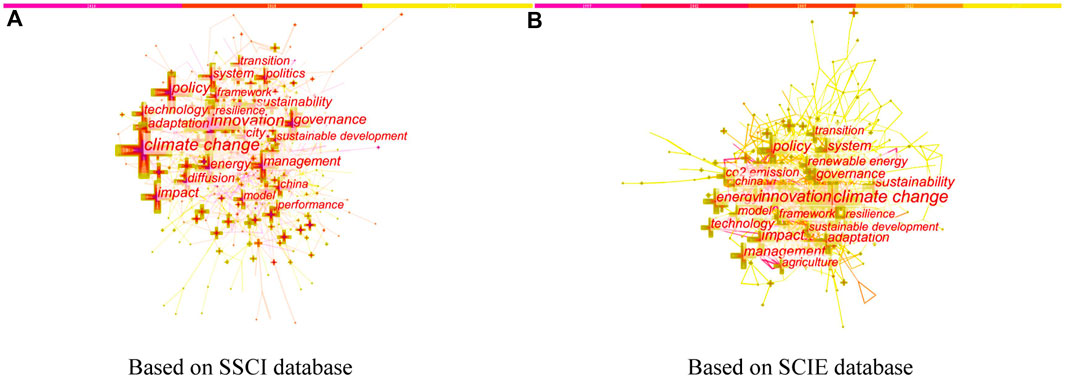
FIGURE 7. Map of the keywords co-occurrence network of climate change innovation research. (A) refers to the SSCI database and (B) refers to the SCI database.
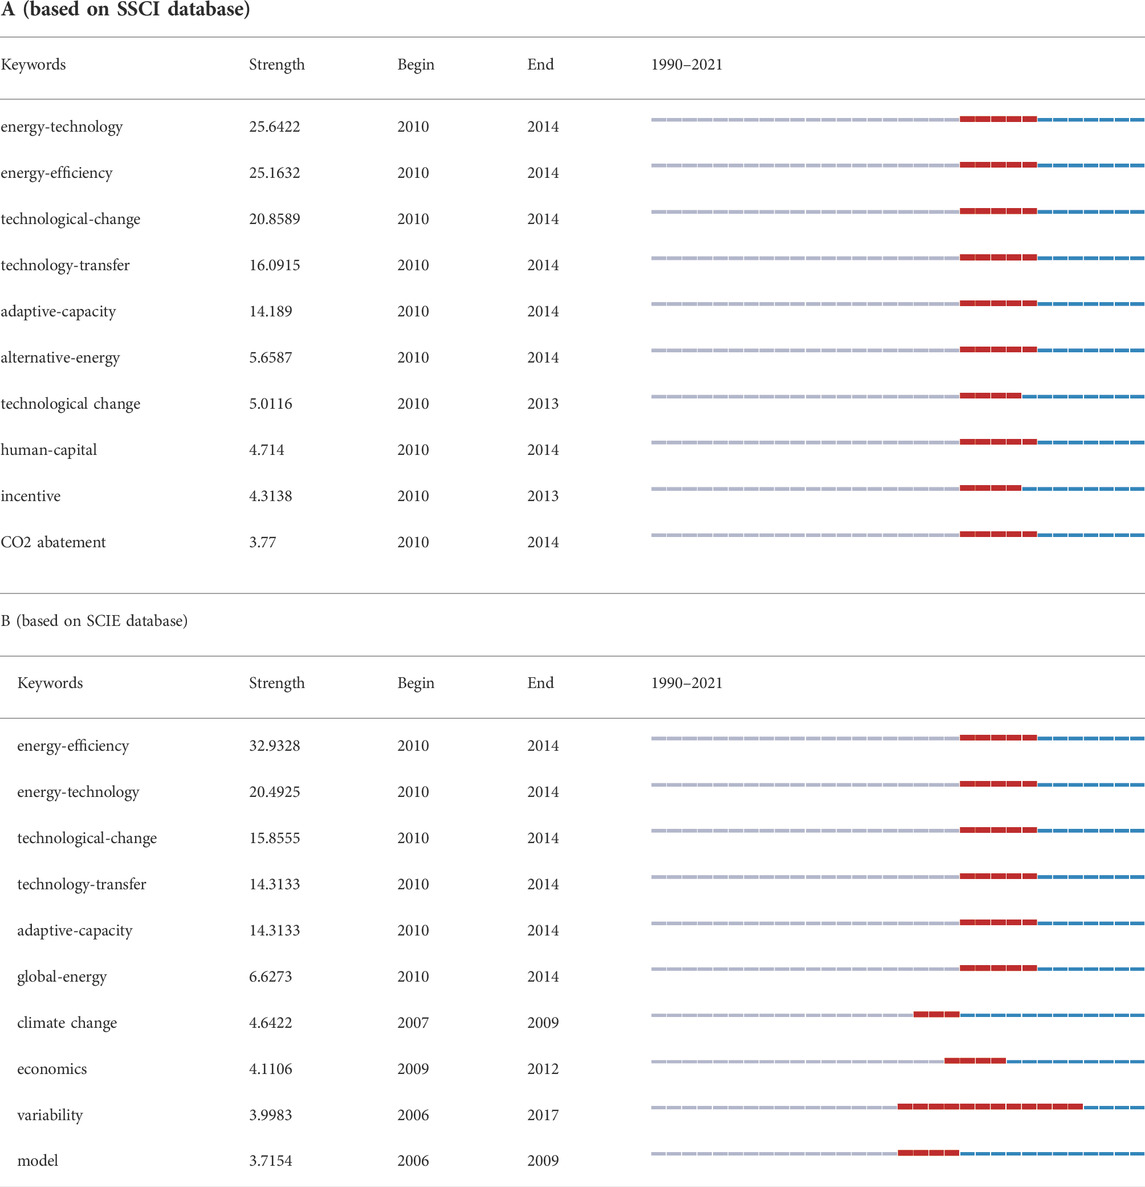
TABLE 7. Top 10 keywords with the strongest citation burst.
Hot research topics
Hot research topics reflect the current state of development in the field of climate innovation by reflecting the most current hot topics of interest to researchers. In reference to Figure 7A, we can summarize the three main research hotspots in SSCI for climate innovation research as follows:
(1) Research methods: Empirical methods are widely used in SSCI. Empirical research is conducted when the researcher personally collects the observations. This method aims to formulate or test theoretical hypotheses. Both mathematical and case empirical research have been widely used in the field.
(2) Climate adaptation governance: This topic examines climate innovation at the level of government governance across countries and regions, primarily in the context of climate policy innovation. This type of innovation includes government macro-regulation, resource allocation issues, and various policy approaches to promote technological innovation. In SSCI, how to rationally promote climate innovation in government policies has gradually attracted much research attention.
(3) Various impacts: By exploring the impacts of climate change, we can understand this phenomenon and respond accordingly. The impacts of climate change focus on three aspects:
1. In the environmental aspect, climate change can directly trigger extreme weather events, such as droughts, floods, and heat waves, which can have serious or irreversible impacts on ecosystems, such as soil degradation and ecological imbalance.
2. In the social aspect, climate change can directly affect the quality of life of individuals. For example, tsunamis triggered by climate change directly threaten the lives of people living in coastal areas.
3. In the economic aspect, climate change affects the layout and structure of agricultural production and cropping systems, hence threatening food security. Climate change can also pose a serious threat to ecological security, homeland security, and water security and negatively affect the global economy.
Referring to the information provided in Figure 7B, the three main research hotspots in SCIE for climate innovation research can be summarized as follows:
(1) Research methods: Modeling is a commonly employed research method in SCIE. When modeling, researchers often analyze and solve problems by modifying the existing models or creating new models. These models are not only mathematical but may also be theoretical.
(2) Sustainability transition: How to achieve a sustainable transition is widely studied in SCIE. Sustainability transition is a long-term, multidimensional, and fundamental transformation process (Shaw et al., 2014) that facilitates the shift of established socio-technical systems to highly sustainable production and consumption patterns. This transition process is often driven by guidance and governance (Smith et al., 2005; Smith and Raven, 2012). Sustainability transition discussions often cover different topics, such as decarbonization and promotion of renewable energy development.
(3) Various causes and results: By exploring the different causes of climate change, we can understand how to promote climate innovation. For example, given that the heavy use of fireworks and inappropriate energy consumption patterns can further exacerbate climate change, the related innovations should also start from these aspects. The impacts of climate change have also been widely studied in SCIE, such as migration issues and adverse impacts on the economy. These issues all need to be considered for innovation to adapt to climate change.
Research frontiers
Research frontiers are the best visual representations of cutting-edge research developments in the field of climate innovation and foreshadow the future direction of this field. As shown in Table 7A, by combining the burst intensity with the top 10 burst keywords and their corresponding red lines, we can obtain the following research frontiers in SSCI:
(1) Energy-technology: To cope with global climate change and ensure energy security, many countries or regions have started shifting to a low-carbon development model. Through this shift, they can formulate the corresponding development strategies, action plans, and policy measures, with renewable energy and clean energy technologies becoming their main development directions. Many studies have combined energy security and green innovation, and discussed the impact of energy insecurity on green innovation (Yang et al., 2022).
(2) Energy-efficiency: Energy use efficiency measures the amount of economic benefits generated per unit of energy.
(3) Technological-change: Technological change refers to the process of producing or introducing a new product that results in more progressive output for the same inputs. Studies have combined energy productivity and innovation to examine whether major technological innovations can truly drive energy productivity (Yu et al., 2022).
Meanwhile, Table 7B lists the following research frontiers in SCIE:
(1) Energy-efficiency: Energy-efficient, sometimes called energy efficiency use, aims to reduce the amount of energy consumed to provide products and services and the effects of air pollution. Several new studies discuss green total factor energy efficiency and explain it from the perspective of low-carbon city policy and digital economy (Gao et al., 2022; Zhao et al., 2022).
(2) Energy-technology: Energy technology mainly refers to those new energy technologies that can improve climate innovation, including nuclear energy technology, solar energy technology, coal combustion, magnetic fluid power generation technology, geothermal energy technology, and ocean energy technology. Some of the research on energy technology innovation is already available in SCIE. For example, Qamar et al. (2022) examines the use of energy technologies in reality from a business perspective. Ahmad et al. (2022) explains how sustainable energy technology innovation research and development can best be carried out from a financial risk perspective.
(3) Variability: Variability innovation, also known as breakthrough innovation, differs from incremental innovation given its aim to solve problems creatively.
Conclusion
We draw several conclusions from our above co-authorship, co-citation, and keyword co-occurrence analyses. In terms of the main contributors to climate innovation research, at the micro (author) level, the prolific authors in SSCI include Sarkodie SA, Sovacool BK, and Jordan A et al., whereas those in SCIE include Sovacool BK, Deng A, and Sarkodie SA et al. Meanwhile, the highly cited authors in SSCI include Geels FW, the OECD, and the IPCC, whereas those in SCIE include the IPCC, Geels FW, and the OECD. At the medium (institutional) level, the core research strength is mainly from universities, with Univ Sussex, Univ Oxford, Swiss Fed Inst Technol, and Univ Leeds all being prolific institutions in both fields. At the macro (national) level, the USA, England, China, the Netherlands, Germany, Australia, Canada, Italy, and Spain are prolific in both fields. The co-authorship analysis, which was conducted at the author, institution, and country levels, visualizes the major contributors to the field at the micro, medium, and macro levels and allows researchers to quickly capture the core authors and important research institutions in the field of climate innovation and to understand the research differences across countries.
Most of the core journals are of high quality, including ENERGY POLICY and GLOBAL ENVIRON CHANGE. Their distribution provides an important knowledge source for both fields while revealing the interdisciplinary nature of research. The main research themes are reflected in several areas, such as policy innovation for climate change and energy technology innovation to promote climate innovation and innovation in the agricultural and building sectors. Several conventional knowledge bases have been established in these areas. Therefore, in general, a knowledge structure in this research area has gradually started to take shape. The co-citation analysis helps us find the core journals in the field and those documents that serve as important bridges in the research process. By sorting out the research process lineage, the main research directions of the field can be determined.
The research hotspots in SSCI include “Research methods,” “Climate adaptation governance,” and “Various impacts,” whereas those in SCIE include “Research methods,” “Sustainability transition,” and “Various causes and results.” Meanwhile, the latest research frontiers in SSCI include “Energy-technology,” “Energy-efficiency,” “Energy-technology,” and “Variability,” among which “Energy-technology” and “Energy-efficiency” are also considered frontiers in SCIE. The keyword co-occurrence analysis allowed us to quickly understand the hot topics and research frontiers in climate innovation. The above findings can help researchers interested in climate innovation to quickly identify the top research issues in the field and subsequently contribute to the further development of this area.
The main directions for future research on climate innovation are energy-technology and energy-efficiency, which are also considered research frontiers in both SCIE and SSCI and have strong potential for development to minimize carbon emissions and promote economic development simultaneously, thereby addressing the pain points of climate change mitigation and facilitating an efficient and sustainable development of human society. Researchers in SCIE should intensify their examination of energy technology innovation to improve the efficiency of energy use in various ways, develop new renewable energy sources, and realize the key role of energy technologies in climate change mitigation. Meanwhile, researchers in SSCI should innovate policies and corporate management methods that promote energy technology innovation in order to gain enough motivation and funding for energy technology innovation to successfully adapt to and mitigate climate change. This area is increasingly attracting the attention of climate innovation researchers. However, most developed areas of research have focused on the development of relevant climate policy frameworks. Therefore, on the basis of these studies, future research should focus on the difficult aspects of climate innovation in order to promote a coordinated development of all areas of climate innovation research.
Although the two hot spots of energy technology and energy efficiency are gradually attracting the attention of researchers, there is still a great lack of relevant studies in the current research. Current research is more concerned with real-world issues. For example, in SCIE, climate change directly affects agriculture, construction industry, etc., and the related issue of climate change adaptation is more fully studied. In SSCI, the impact of energy technology and energy efficiency on climate change mitigation is empirically verified to some extent. These empirical results with their associated recommendations have not been fully translated into appropriate policies to promote energy technology and energy efficiency. However, achieving a key technological innovation requires policy support, researcher efforts, and time to polish, and does not happen overnight.
Therefore, to realize the development of climate innovation research, we hereby make some suggestions as follows. First, the efforts of researchers are central to the development of research. In SCIE, researchers need to seize the hot spots in the field of climate innovation and follow the research trends. They should not be intimidated, but should know the difficulties and overcome them, and work hard on the key innovation points of the technology in order to make research that is really useful to society. In the SSCI, relevant researchers should seize the hot issues of research, make detailed analysis and elaboration, and put forward practical and effective policy recommendations. Second, governments should actively encourage innovative research in the field of climate innovation. Improve the incentive mechanism for innovation, improve the research conditions for researchers, and guarantee the smooth implementation of innovation. They should actively listen to policy recommendations and work with researchers to transform research from articles to policies with practical implications. Companies should also actively participate in innovation and use their own characteristics to contribute to the development of climate innovation research.
The effects of climate change are expected to continue to worsen in the coming years. This will lead to more extreme weather events such as droughts, floods, heat waves and unpredictable precipitation distribution. More and more greenhouse gases are being released from the soil into the atmosphere, leading to global warming and further impacting already fragile ecosystems. Facing the current climate change situation, promoting the development of climate change adaptation and mitigation innovations will help humanity to better cope with the impact of climate change. The results of these studies can provide an excellent perspective on climate innovation and valuable information for researchers to understand the current state of research and trends in the field. These findings will encourage researchers in the field of climate innovation to further deepen their studies or reorient their works to benefit the overall development of this area. These findings can also help resea rchers interested in climate innovation to quickly capture general information about the development of the field and to promote its further expansion. This study also has implications for climate policymakers that can help them understand the direction of climate policymaking to achieve climate change mitigation and adaptation.
The complete knowledge landscape in the field of climate innovation is presented in its entirety by elaborating on the above analyses and conclusions. Readers are able to visualize the future trends and issues facing climate innovation. For climate innovation to effectively mitigate and adapt to climate change, technological innovation needs to be fully promoted. Technological innovation allows for increased efficiency in various fields while reducing carbon emissions, thus making the carbon cycle run smoothly, reducing the burden on the environment, and ultimately mitigating climate change. Promoting climate policy innovation is just as important. Climate policies should not only create conditions for accelerating technological innovation but also realize a deployment of resources and sustainable development in areas that are directly affected by climate change. In this way, climate policies can achieve a balance between mitigation and adaptation to climate change, promote the sustainable development of human society, and guarantee a harmonious relationship between humans and nature.
Although some meaningful and helpful results can be obtained from this visual analysis, many shortcomings need to be considered. First, the data in this paper were downloaded from the SCIE and SSCI databases, where more than 99% of articles are written in English. In this case, articles written in other languages were ignored to some extent. Second, given that the articles used in this study were manually screened and were retrieved from a huge database of articles, some data may have been omitted. Third, during the keyword co-occurrence analysis, clustering analysis was performed to extract keyword-related topics, but the images of the clustering analysis were not inserted into the text, hence omitting some information. Fourth, given that screening the literature data takes some time, to ensure completeness, 2021 was selected as the time point for the selected literature. Therefore, articles published in 2022 were ignored, which may affect the timeliness of our findings.
Data availability statement
The original contributions presented in the study are included in the article/Supplementary Materials, further inquiries can be directed to the corresponding author.
Author contributions
ZC, YX, and HW contributed to conception and design of the study. ZC and YX organized the database. YX performed the software analysis. YX wrote the first draft of the manuscript. ZC, YX, and HW wrote sections of the manuscript. All authors contributed to manuscript revision, read, and approved the submitted version.
Funding
This research was funded by the Social Science “14th Five-Year Plan” Key Project in Jiangxi, China (22ST04).
Conflict of interest
The authors declare that the research was conducted in the absence of any commercial or financial relationships that could be construed as a potential conflict of interest.
Publisher’s note
All claims expressed in this article are solely those of the authors and do not necessarily represent those of their affiliated organizations, or those of the publisher, the editors and the reviewers. Any product that may be evaluated in this article, or claim that may be made by its manufacturer, is not guaranteed or endorsed by the publisher.
References
Acemoglu, D., Aghion, P., Bursztyn, L., and Hemous, D. (2012). The environment and directed technical change. Am. Econ. Rev. 102 (1), 131–166. doi:10.1257/aer.102.1.131
Acemoglu, D., Akcigit, U., Hanley, D., and Kerr, W. (2016). Transition to clean technology. J. political Econ. 124 (1), 52–104. doi:10.1086/684511
Adkin, L. E. (2019). Technology innovation as a response to climate change: The case of the climate change emissions management corporation of alberta. Rev. Policy Res. 36 (5), 603–634. doi:10.1111/ropr.12357
Aghion, P., Dechezleprêtre, A., Hemous, D., Martin, R., and Van Reenen, J. (2016). Carbon taxes, path dependency, and directed technical change: Evidence from the auto industry. J. Political Econ. 124 (1), 1–51. doi:10.1086/684581
Ahmad, M., Ahmed, Z., Gavurova, B., and Oláh, J. (2022). Financial risk, renewable energy technology budgets, and environmental sustainability: Is going green possible? Front. Environ. Sci. 518, 9190. doi:10.3389/fenvs.2022.909190
Bel, G., and Joseph, S. (2018). Climate change mitigation and the role of technological change: Impact on selected headline targets of Europe's 2020 climate and energy package. Renew. Sustain. Energy Rev. 82, 3798–3807. doi:10.1016/j.rser.2017.10.090
Boyack, K. W., Klavans, R., and Börner, K. (2005). Mapping the backbone of science. Scientometrics 64 (3), 351–374. doi:10.1007/s11192-005-0255-6
Broto, V. C., and Bulkeley, H. (2013). A survey of urban climate change experiments in 100 cities. Glob. Environ. change 23 (1), 92–102. doi:10.1016/j.gloenvcha.2012.07.005
Brush, S. B., and Turner, B. L. (1987). The nature of farming systems and views of their change. Comp. farming Syst., 11
Bulkeley, H., and Castán Broto, V. (2013). Government by experiment? Global cities and the governing of climate change. Trans. Inst. Br. Geogr. 38 (3), 361–375. doi:10.1111/j.1475-5661.2012.00535.x
Calel, R., and Dechezleprêtre, A. (2016). Environmental policy and directed technological change: Evidence from the European carbon market. Rev. Econ. statistics 98 (1), 173–191. doi:10.1162/rest_a_00470
Chen, C., Dubin, R., and Kim, M. C. (2014). Orphan drugs and rare diseases: A scientometric review (2000–2014). Expert Opin. Orphan Drugs 2 (7), 709–724. doi:10.1517/21678707.2014.920251
Chen, X., and Liu, Y. (2020). Visualization analysis of high-speed railway research based on CiteSpace. Transp. Policy 85, 1–17. doi:10.1016/j.tranpol.2019.10.004
Chhetri, N., Chaudhary, P., Tiwari, P. R., and Yadaw, R. B. (2012). Institutional and technological innovation: Understanding agricultural adaptation to climate change in Nepal. Appl. Geogr. 33, 142–150. doi:10.1016/j.apgeog.2011.10.006
Cobo, M. J., López‐Herrera, A. G., Herrera‐Viedma, E., and Herrera, F. (2011). Science mapping software tools: Review, analysis, and cooperative study among tools. J. Am. Soc. Inf. Sci. Technol. 62 (7), 1382–1402. doi:10.1002/asi.21525
Dale, A., Robinson, J., King, L., Burch, S., Newell, R., Shaw, A., et al. (2020). Meeting the climate change challenge: Local government climate action in British columbia, Canada. Clim. Policy 20 (7), 866–880. doi:10.1080/14693062.2019.1651244
De Frenne, P., Lenoir, J., Luoto, M., Scheffers, B. R., Zellweger, F., Aalto, J., et al. (2021). Forest microclimates and climate change: Importance, drivers and future research agenda. Glob. Chang. Biol. 27 (11), 2279–2297. doi:10.1111/gcb.15569
De Jong, S. P., Wardenaar, T., and Horlings, E. (2016). Exploring the promises of transdisciplinary research: A quantitative study of two climate research programmes. Res. Policy 45 (7), 1397–1409. doi:10.1016/j.respol.2016.04.008
Dhar, S., and Marpaung, C. O. (2015). Technology priorities for transport in Asia: Assessment of economy-wide CO2 emissions reduction for Lebanon. Clim. change 131 (3), 451–464. doi:10.1007/s10584-014-1309-7
Diffenbaugh, N. S., and Field, C. B. (2013). Changes in ecologically critical terrestrial climate conditions. Science 341 (6145), 486–492. doi:10.1126/science.1237123
Dong, F., Zhu, J., Li, Y., Chen, Y., Gao, Y., Hu, M., et al. (2022). How green technology innovation affects carbon emission efficiency: Evidence from developed countries proposing carbon neutrality targets. Environ. Sci. Pollut. Res. 29 (24), 35780–35799. doi:10.1007/s11356-022-18581-9
Duan, H. B., Zhu, L., and Fan, Y. (2015). Modelling the evolutionary paths of multiple carbon-free energy technologies with policy incentives. Environ. Model. Assess. (Dordr). 20 (1), 55–69. doi:10.1007/s10666-014-9415-5
Foxon, T. J. (2013). Transition pathways for a UK low carbon electricity future. Energy Policy 52, 10–24. doi:10.1016/j.enpol.2012.04.001
Galbreath, J., Charles, D., and Oczkowski, E. (2016). The drivers of climate change innovations: Evidence from the Australian wine industry. J. Bus. Ethics 135 (2), 217–231. doi:10.1007/s10551-014-2461-8
Gao, D., Li, Y., and Li, G. (2022). Boosting the green total factor energy efficiency in urban China: Does low-carbon city policy matter? Environ. Sci. Pollut. Res. 29, 56341–56356. doi:10.1007/s11356-022-19553-9
Geels, F. W., Kern, F., Fuchs, G., Hinderer, N., Kungl, G., Mylan, J., et al. (2016). The enactment of socio-technical transition pathways: A reformulated typology and a comparative multi-level analysis of the German and UK low-carbon electricity transitions (1990–2014). Res. policy 45 (4), 896–913. doi:10.1016/j.respol.2016.01.015
Geels, F. W. (2014). Regime resistance against low-carbon transitions: Introducing politics and power into the multi-level perspective. Theory, Cult. Soc. 31 (5), 21–40. doi:10.1177/0263276414531627
Glänzel, W., and Schubert, A. (2004). “Analysing scientific networks through co-authorship,” in Handbook of quantitative science and technology research (Dordrecht: Springer), 257
Hao, Y., Guo, Y., and Wu, H. (2022). The role of information and communication technology on green total factor energy efficiency: Does environmental regulation work? Bus. Strategy Environ. 31 (1), 403–424. doi:10.1002/bse.2901
Haselip, J., Hansen, U. E., Puig, D., Trærup, S., and Dhar, S. (2015). Governance, enabling frameworks and policies for the transfer and diffusion of low carbon and climate adaptation technologies in developing countries. Clim. Change 131 (3), 363–370. doi:10.1007/s10584-015-1440-0
Hou, J., and Hu, Z. (2013). Review on the application of CiteSpace at home and abroad. J. Mod. Inf. 33 (4), 99. (In Chinese).
Hu, C. P., Hu, J. M., Gao, Y., and Zhang, Y. K. (2011). A journal co-citation analysis of library and information science in China. Scientometrics 86 (3), 657–670. doi:10.1007/s11192-010-0313-6
IPCC (2007). Impacts, adaptation and vulnerability. Contribution of working group II to the fourth assessment report of the intergovernmental panel on climate change. Cambridge, UK: Cambridge University Press. Available at: https://acsess.onlinelibrary.wiley.com/doi/full/10.2134/jeq2008.0015br. Access (Accessed on August 15, 2022).
Johnstone, N., Haščič, I., and Popp, D. (2010). Renewable energy policies and technological innovation: Evidence based on patent counts. Environ. Resour. Econ. (Dordr). 45 (1), 133–155. doi:10.1007/s10640-009-9309-1
Jordan, A., and Huitema, D. (2014). Innovations in climate policy: The politics of invention, diffusion, and evaluation. Environ. Polit. 23 (5), 715–734. doi:10.1080/09644016.2014.923614
Kivimaa, P., and Kern, F. (2016). Creative destruction or mere niche support? Innovation policy mixes for sustainability transitions. Res. policy 45 (1), 205–217. doi:10.1016/j.respol.2015.09.008
Köhler, J., Geels, F. W., Kern, F., Markard, J., Onsongo, E., Wieczorek, A., et al. (2019). An agenda for sustainability transitions research: State of the art and future directions. Environ. innovation Soc. transitions 31, 1–32. doi:10.1016/j.eist.2019.01.004
Lee, C. C., and Lee, C. C. (2022). How does green finance affect green total factor productivity? Evidence from China. Energy Econ. 107, 105863. doi:10.1016/j.eneco.2022.105863
Lee, C. C., Xing, W., and Lee, C. C. (2022). The impact of energy security on income inequality: The key role of economic development. Energy 248, 123564. doi:10.1016/j.energy.2022.123564
Liao, H., Tang, M., Luo, L., Li, C., Chiclana, F., and Zeng, X. J. (2018). A bibliometric analysis and visualization of medical big data research. Sustainability 10 (1), 166. doi:10.3390/su10010166
Liu, Z., Yin, Y., Liu, W., and Dunford, M. (2015). Visualizing the intellectual structure and evolution of innovation systems research: A bibliometric analysis. Scientometrics 103 (1), 135–158. doi:10.1007/s11192-014-1517-y
Loorbach, D., Frantzeskaki, N., and Avelino, F. (2017). Sustainability transitions research: Transforming science and practice for societal change. Annu. Rev. Environ. Resour. 42 (1), 599–626. doi:10.1146/annurev-environ-102014-021340
López-Gunn, E., Swinkels, J., Anzaldúa, G., Bea, M., Colaço, M. C., Deksne, M., et al. (2021). Communities of innovation for climate change adaptation and disaster risk reduction: Niche creation and anticipation. Sustainability 13 (9), 5180. doi:10.3390/su13095180
Magazzino, C., Mutascu, M., Sarkodie, S. A., Adedoyin, F. F., and Owusu, P. A. (2021). Heterogeneous effects of temperature and emissions on economic productivity across climate regimes. Sci. Total Environ. 775, 145893. doi:10.1016/j.scitotenv.2021.145893
Markard, J., Raven, R., and Truffer, B. (2012). Sustainability transitions: An emerging field of research and its prospects. Res. policy 41 (6), 955–967. doi:10.1016/j.respol.2012.02.013
McCain, K. W. (1991). Mapping economics through the journal literature: An experiment in journal cocitation analysis. J. Am. Soc. Inf. Sci. 42 (4), 290–296. doi:10.1002/(sici)1097-4571(199105)42:4<290::aid-asi5>3.0.co;2-9
Mele, M., Gurrieri, A. R., Morelli, G., and Magazzino, C. (2021). Nature and climate change effects on economic growth: An LSTM experiment on renewable energy resources. Environ. Sci. Pollut. Res. 28 (30), 41127–41134. doi:10.1007/s11356-021-13337-3
Mensah, C. N., Long, X., Boamah, K. B., Bediako, I. A., Dauda, L., and Salman, M. (2018). The effect of innovation on CO2 emissions of OCED countries from 1990 to 2014. Environ. Sci. Pollut. Res. 25 (29), 29678–29698. doi:10.1007/s11356-018-2968-0
Miklian, J., and Hoelscher, K. (2020). Entrepreneurial strategies to address rural-urban climate-induced vulnerabilities: Assessing adaptation and innovation measures in dhaka, Bangladesh. Sustainability 12 (21), 9115. doi:10.3390/su12219115
Mowery, D. C., Nelson, R. R., and Martin, B. R. (2010). Technology policy and global warming: Why new policy models are needed (or why putting new wine in old bottles won’t work). Res. Policy 39 (8), 1011–1023. doi:10.1016/j.respol.2010.05.008
Newell, R. G. (2010). The role of markets and policies in delivering innovation for climate change mitigation. Oxf. Rev. Econ. Policy 26 (2), 253–269. doi:10.1093/oxrep/grq009
Ortiz-Bobea, A., Ault, T. R., Carrillo, C. M., Chambers, R. G., and Lobell, D. B. (2021). Anthropogenic climate change has slowed global agricultural productivity growth. Nat. Clim. Chang. 11 (4), 306–312. doi:10.1038/s41558-021-01000-1
Osareh, F. (1996). Bibliometrics, citation analysis and co-citation analysis: A review of literature I. Libri 46 (3), 149–158. doi:10.1515/libr.1996.46.3.149
Qamar, S., Ahmad, M., Oryani, B., and Zhang, Q. (2022). Solar energy technology adoption and diffusion by micro, small, and medium enterprises: Sustainable energy for climate change mitigation. Environ. Sci. Pollut. Res. 29, 49385–49403. doi:10.1007/s11356-022-19406-5
Rogelj, J., Den Elzen, M., Höhne, N., Fransen, T., Fekete, H., Winkler, H., et al. (2016). Paris Agreement climate proposals need a boost to keep warming well below 2 C. Nature 534 (7609), 631–639. doi:10.1038/nature18307
Rogge, K. S., and Reichardt, K. (2016). Policy mixes for sustainability transitions: An extended concept and framework for analysis. Res. Policy 45 (8), 1620–1635. doi:10.1016/j.respol.2016.04.004
Seddon, N., Chausson, A., Berry, P., Girardin, C. A., Smith, A., and Turner, B. (2020). Understanding the value and limits of nature-based solutions to climate change and other global challenges. Phil. Trans. R. Soc. B 375, 20190120. doi:10.1098/rstb.2019.0120
Shahid, S., Wang, X. J., Harun, S. B., Shamsudin, S. B., Ismail, T., and Minhans, A. (2016). Climate variability and changes in the major cities of Bangladesh: Observations, possible impacts and adaptation. Reg. Environ. Change 16 (2), 459–471. doi:10.1007/s10113-015-0757-6
Shaw, A., Burch, S., Kristensen, F., Robinson, J., and Dale, A. (2014). Accelerating the sustainability transition: Exploring synergies between adaptation and mitigation in British Columbian communities. Glob. Environ. Change 25, 41–51. doi:10.1016/j.gloenvcha.2014.01.002
Small, H. (1973). Co‐citation in the scientific literature: A new measure of the relationship between two documents. J. Am. Soc. Inf. Sci. 24 (4), 265–269. doi:10.1002/asi.4630240406
Smith, A., and Raven, R. (2012). What is protective space? Reconsidering niches in transitions to sustainability. Res. policy 41 (6), 1025–1036. doi:10.1016/j.respol.2011.12.012
Smith, A., Stirling, A., and Berkhout, F. (2005). The governance of sustainable socio-technical transitions. Res. policy 34 (10), 1491–1510. doi:10.1016/j.respol.2005.07.005
Steffen, W., Richardson, K., Rockström, J., Cornell, S. E., Fetzer, I., Bennett, E. M., et al. (2015). Sustainability. Planetary boundaries: Guiding human development on a changing planet. science 347 (6223), 1259855. doi:10.1126/science.1259855
Stern, N. (2006). Stern Review: The economics of climate change. London, United Kingdom: Cambridge University Press.
Su, H. N., and Moaniba, I. M. (2017). Does innovation respond to climate change? Empirical evidence from patents and greenhouse gas emissions. Technol. Forecast. Soc. Change 122, 49–62. doi:10.1016/j.techfore.2017.04.017
Sun, Y., Razzaq, A., Sun, H., and Irfan, M. (2022). The asymmetric influence of renewable energy and green innovation on carbon neutrality in China: Analysis from non-linear ARDL model. Renew. Energy 193, 334–343. doi:10.1016/j.renene.2022.04.159
Tang, C., Xu, Y., Hao, Y., Wu, H., and Xue, Y. (2021). What is the role of telecommunications infrastructure construction in green technology innovation? A firm-level analysis for China. Energy Econ. 103, 105576. doi:10.1016/j.eneco.2021.105576
Timilsina, G. R. (2021). Financing climate change adaptation: International initiatives. Sustainability 13 (12), 6515. doi:10.3390/su13126515
Tompkins, E. L., and Adger, W. N. (2005). Defining response capacity to enhance climate change policy. Environ. Sci. Policy 8 (6), 562–571. doi:10.1016/j.envsci.2005.06.012
Upham, P., Kivimaa, P., Mickwitz, P., and Åstrand, K. (2014). Climate policy innovation: A sociotechnical transitions perspective. Environ. Polit. 23 (5), 774–794. doi:10.1080/09644016.2014.923632
Van den Bergh, J. C. (2013). Environmental and climate innovation: Limitations, policies and prices. Technol. Forecast. Soc. Change 80 (1), 11–23. doi:10.1016/j.techfore.2012.08.004
Van Leeuwen, T. (2006). The application of bibliometric analyses in the evaluation of social science research. Who benefits from it, and why it is still feasible. Scientometrics 66 (1), 133–154. doi:10.1007/s11192-006-0010-7
Wang, C., Geng, L., and Rodríguez-Casallas, J. D. (2021). How and when higher climate change risk perception promotes less climate change inaction. J. Clean. Prod. 321, 128952. doi:10.1016/j.jclepro.2021.128952
Watson, J., Byrne, R., Ockwell, D., and Stua, M. (2015). Lessons from China: Building technological capabilities for low carbon technology transfer and development. Clim. Change 131 (3), 387–399. doi:10.1007/s10584-014-1124-1
Wen, H., Chen, S., and Lee, C. C. (2023). Impact of low-carbon city construction on financing, investment, and total factor productivity of energy-intensive enterprises. Energy J. 44 (2), 56574. doi:10.5547/01956574.44.2.hwen
Wen, H., Lee, C. C., and Zhou, F. (2021). Green credit policy, credit allocation efficiency and upgrade of energy-intensive enterprises. Energy Econ. 94, 105099. doi:10.1016/j.eneco.2021.105099
Wen, H., Lee, C. C., and Zhou, F. (2022). How does fiscal policy uncertainty affect corporate innovation investment? Evidence from China's new energy industry. Energy Econ. 105, 105767. doi:10.1016/j.eneco.2021.105767
Wigley, T. M., and Raper, S. C. (2001). Interpretation of high projections for global-mean warming. Science 293 (5529), 451–454. doi:10.1126/science.1061604
Yang, H. C., Feng, G. F., Zhao, X. X., and Chang, C. P. (2022). The impacts of energy insecurity on green innovation: A multi-country study. Econ. Analysis Policy 74, 139–154. doi:10.1016/j.eap.2022.01.017
Yao, Q., Lyu, P. H., Yang, L. P., Yao, L., and Liu, Z. Y. (2014). Current performance and future trends in health care sciences and services research. Scientometrics 101 (1), 751–779. doi:10.1007/s11192-014-1383-7
Yu, D., Xu, Z., Pedrycz, W., and Wang, W. (2017). Information sciences 1968–2016: A retrospective analysis with text mining and bibliometric. Inf. Sci. 418, 619–634. doi:10.1016/j.ins.2017.08.031
Yu, Y., Chen, X., and Zhang, N. (2022). Innovation and energy productivity: An empirical study of the innovative city pilot policy in China. Technol. Forecast. Soc. Change 176, 121430. doi:10.1016/j.techfore.2021.121430
Zhao, S., Peng, D., Wen, H., and Wu, Y. (2022). Nonlinear and spatial spillover effects of the digital economy on green total factor energy efficiency: Evidence from 281 cities in China. Environ. Sci. Pollut. Res. Int. doi:10.1007/s11356-022-22694-6
Keywords: climate innovation, climate change, citespace, visualization analysis, energy
Citation: Cheng Z, Xie Y and Wen H (2022) Visualization analysis of research on climate innovation on CiteSpace. Front. Environ. Sci. 10:1025128. doi: 10.3389/fenvs.2022.1025128
Received: 22 August 2022; Accepted: 29 September 2022;
Published: 13 October 2022.
Edited by:
Hêriş Golpîra, Islamic Azad University, Sanandaj Branch, IranReviewed by:
Cosimo Magazzino, Roma Tre University, ItalyErfan Babaee Tirkolaee, University of Istinye, Turkey
Copyright © 2022 Cheng, Xie and Wen. This is an open-access article distributed under the terms of the Creative Commons Attribution License (CC BY). The use, distribution or reproduction in other forums is permitted, provided the original author(s) and the copyright owner(s) are credited and that the original publication in this journal is cited, in accordance with accepted academic practice. No use, distribution or reproduction is permitted which does not comply with these terms.
*Correspondence: Huwei Wen, wenhuwei@ncu.edu.cn