The importance of calcium and amorphous silica for arctic soil CO2 production
 Peter Stimmler1
  Mathias Göckede2
  Susan M. Natali3 Oliver Sonnentag4
  Benjamin S. Gilfedder5 Nia Perron4
  Jörg Schaller1*
- 1Centre for Agriculture Landscape Research e.V. (ZALF), Müncheberg, Germany
- 2Max Planck Institute for Biogeochemistry, Jena, Germany
- 3Woodwell Climate Research Center, Falmouth, MA, United States
- 4Département de Géographie, Université de Montréal, Montréal, QC, Canada
- 5Limnological Station, Bayreuth Center of Ecology and Environmental Research (BAYCEER), University of Bayreuth, Bayreuth, Germany
Future warming of the Arctic not only threatens to destabilize the enormous pool of organic carbon accumulated in permafrost soils but may also mobilize elements such as calcium (Ca) or silicon (Si). While for Greenlandic soils, it was recently shown that both elements may have a strong effect on carbon dioxide (CO2) production with Ca strongly decreasing and Si increasing CO2 production, little is known about the effects of Si and Ca on carbon cycle processes in soils from Siberia, the Canadian Shield, or Alaska. In this study, we incubated five different soils (rich organic soil from the Canadian Shield and from Siberia (one from the top and one from the deeper soil layer) and one acidic and one non-acidic soil from Alaska) for 6 months under both drained and waterlogged conditions and at different Ca and amorphous Si (ASi) concentrations. Our results show a strong decrease in soil CO2 production for all soils under both drained and waterlogged conditions with increasing Ca concentrations. The ASi effect was not clear across the different soils used, with soil CO2 production increasing, decreasing, or not being significantly affected depending on the soil type and if the soils were initially drained or waterlogged. We found no methane production in any of the soils regardless of treatment. Taking into account the predicted change in Si and Ca availability under a future warmer Arctic climate, the associated fertilization effects would imply potentially lower greenhouse gas production from Siberia and slightly increased greenhouse gas emissions from the Canadian Shield. Including Ca as a controlling factor for Arctic soil CO2 production rates may, therefore, reduces uncertainties in modeling future scenarios on how Arctic regions may respond to climate change.
1 Introduction
Near-surface air temperatures in northern high-latitude regions have been increasing twice as much as the global average within the last few decades and are also projected to increase further in the future (Allan, 2021). This temperature increase leads to thawing of the permafrost, i.e., perennially frozen ground (Brown and Romanovsky 2008; Romanovsky et al., 2010). Permafrost thaw may increase the release of greenhouse gases such as carbon dioxide (CO2) and methane by accelerated soil organic-carbon mineralization (Schuur et al., 2015; Miner et al., 2022). The frozen ground of Arctic–boreal regions is the largest pool of soil organic-carbon, with ca. 1014 to 1035 Pg of organic carbon being stored within the upper 3 m in permafrost-affected regions (Hugelius et al., 2014; Mishra et al., 2021).
Thawing of permafrost may mobilize large amounts of nutrients stored in permafrost soils. In addition to primary nutrients such as nitrogen (N) or phosphorous (P), the thawing of permafrost may also mobilize elements such as calcium (Ca) and amorphous silicon (ASi) (Walker et al., 2001; Alfredsson et al., 2015; Stimmler et al., 2022a). Ca is known to potentially decrease soil respiration by cation bridging making the organic carbon in the soil (Corg) less available for microbial respiration (Whittinghill and Hobbie 2012; Rowley et al., 2018; Schaller et al., 2019). Reactive Si is stored in soils in the form of amorphous silica (Asi) as phytoliths from plant or microbial residuals (Schaller et al., 2021). Asi in soils can reduce hydraulic conductivity near saturation, increase hydraulic conductivity in dry soils, and is the main source of silicic acid (Schaller et al., 2020; Schaller et al., 2021). With this reduction in hydraulic conductivity near saturation, Asi may reduce the availability of electron acceptors leading to potentially more reduced conditions (Hömberg et al., 2021a; Hömberg et al., 2021b). Silicic acid competes with nutrients such as P and Corg for binding at the surface of iron minerals (Schaller et al., 2019; Hömberg et al., 2020). Through the effect of Asi mobilizing silicic acid, Asi can potentially increase P and Corg availability for microbial respiration (Reithmaier et al., 2017; Schaller et al., 2019).
The increasing and strongly decreasing effects of Si and ca on the microbial respiration of Arctic soils, respectively, were shown only in one study so far on different Greenlandic soils (Schaller et al., 2019) and were further discussed by Stimmler et al. (2022b). However, Greenlandic soils feature a relatively low Corg pool, compared to soils from other Arctic regions, and therefore the potential increases in soil respiration under predicted future climates might be substantially less in Greenland than in Siberia, the Canadian Shield, or Alaska (Hugelius et al., 2014). Accordingly, the effects of Si and Ca on soil respiration of these vast Arctic regions with large Corg pools are poorly understood. Hence, knowledge about this interdependency between Asi, Ca, and soil respiration may be crucial to reduce uncertainties for reliable modeling of future scenarios of how Arctic systems may respond to global warming. Additional important controls on the production of potent greenhouse gases such as CO2 and CH4 is the initial oxygen supply and associated drained or waterlogged conditions (Stein 2020). It was shown at the field scale that drainage increased soil-CO2 emissions compared to waterlogged conditions (Kwon et al., 2019), and in an incubation study, it was shown that the large soil carbon © storage in deep soil layers (Hugelius et al., 2014) was generally less vulnerable to soil respiration (Kwon et al., 2019).
Here, we assessed the relevance of both ASi and Ca for CO2 and CH4 production in soils collected from Siberia, the Canadian Shield, and Alaska. Five different soils from those regions were incubated under both drained and waterlogged conditions for 6 months under different Ca and ASi concentrations. For Alaska, we used soils from moist acidic and moist non-acidic tundras, as both soils differ substantially in available Ca in the active layer and permafrost layer (Walker et al., 2001). Especially for the moist acidic tundra, available Ca may increase with permafrost thaw as the permafrost layer contains much higher Ca concentrations compared to the active layer soil (Walker et al., 2001). For the Canadian Shield, we used organic-rich soil. For the soil from Siberia, we incubated two different soil depths to analyze the effect of soil depth on soil respiration.
2 Materials and methods
2.1 Sample collection and storage
The soil samples were collected using a spade or an auger from various sites (Table 1). All soils were stored at −20°C.
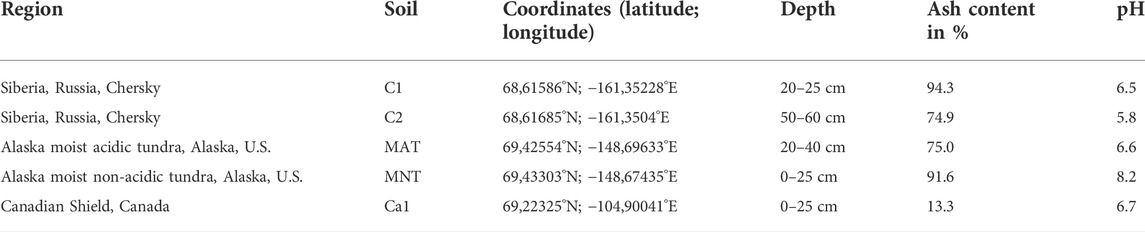
TABLE 1. Coordinates, soil sampling depth, ash content, and pH of the different soils used.
To prepare the soil for these incubation treatments, the frozen soil was crushed with a hammer and sieved to a particle size <650 µm. Subsequently, the sieved soil was homogenized, and for each sample, 5 g of soil was weighed into a 20 ml incubation vial (Ochs Laborbedarf, Bovenden, Germany).
2.2 Element extraction
For extraction of available concentrations of inorganic Si and Ca, the Mehlich III method was used (Mehlich 1984). In brief, 0.5–5 g of the original or freeze-dried soil sample was weighted in a 50 ml Falcon tube and mixed with 10 ml g−1 Mehlich III (0.015 M NH4F, 0.001 M EDTA, 0.25 M NH4NO3, 0.00325 M HNO3, and 0.2 m HAc) extraction solution. The samples were shaken for 5 min at 200 min−1 and centrifuged for 5 min at 10.000 g. The supernatant was collected with a syringe and filtered through a 0.2 µm cellulose acetate filter. The quantification of element concentrations was done by ICP-OES with all results given in mg g−1 dry weight (DW).
For extraction of available biogenic ASi, alkaline extraction was used (DeMaster 1981). 30 mg of freeze-dried soil was weighted in falcon tubes and incubated for 1 h with 40 ml 0.1 M Na2CO3 solution at 85°C. After 1 h, 3 h, and 5 h, 10 ml of the supernatant was sampled and filtered through a 0.2 µm cellulose acetate filter. The silicon concentration in solution was quantified by ICP-OES. The ASi concentrations were calculated as the ordinate intercept of the linear function of silicon concentration over incubation time and are given in mg g−1 dw−1.
For total P analysis, 100 mg of the freeze-dried soil material was extracted using HNO3/H2O2 followed by HNO3/HCl 3:1 in a closed vessel microwave system. The extract was cleared with a 0.2 µm cellulose acetate filter and quantified with ICP-OES. For dry weight (DW) determination as the basis for element availability and concentrations on DW, 0.5–2 g of frozen material was weighed prior and after freeze-drying until a constant weight. All ICP-OES measurements were carried out using the iCAP 6000 Series (Thermo scientific) in the axial mode.
2.3 Incubation experiment
All soils were incubated with 16 treatments for different Si and Ca concentrations, supplemented by a control sample without modification of the ASi or Ca levels (control treatment). The treatments included all combinations of four different levels of ASi addition (0, 3, 6, or 10 mg g−1 dw−1, Aerosil 300 ®, Evonik, Essen, Germany) and four different levels of Ca addition (0, 5, 10, and 15 mg g−1 (DW)−1 Ca (CaCl2 × 2 H2O, Grüssing, Filsum, Germany). Such an increase in ASi and Ca availability in the soil was shown to be within the expected natural range upon permafrost thaw (Stimmler et al. in revision). Each treatment was applied using 2 ml pure water. To examine the effect of this water addition on C cycle processes, the soils were incubated with and without pure water as reference. As additional treatment, all the Si and Ca treatments and controls were incubated under both drained and waterlogged conditions (170 incubations in total for each soil type). After ASi and/or Ca addition and also for control the soil was saturated with a few millimeters of the water supernatant (waterlogged treatment). For the drained treatment the supernatant water was removed. All treatments were done with a replication of five.
To enable gas exchange but prevent water loss, vials were closed with Parafilm and stored at 5°C in an incubation fridge. The supernatant of the drained treatment was removed (the drained water) after 2 weeks to facilitate a more efficient oxygen entry.
2.4 Greenhouse gas analysis
After 4, 8, 12, and 24 weeks of the incubation experiment, the samples were closed with a rubber stopper and crimp caps 4 days before sampling of the gas phase. Next, the gas phase of each sample was collected from the head space using a syringe, and analyzed with GC-FID (8610C Gas Chromatograph, SRI Instruments, Bad Honnef, Germany) for the greenhouse gases such as CO2 and CH4. Calibration was done with 1,000 and 10,000 ppm of CH4 and 5,000 and 50,000 ppm of CO2 (Riessner Gase, Lichtenfels, Germany). The greenhouse gas production rates were calculated as follows:
2.5 Statistical analysis and data visualization
For statistical analysis and visualization, the R computational environment was used (R_Core_Team, 2021). The data over all Ca and silica treatments were analyzed by a two-way analysis-of-variance (two-way ANOVA), using Si and Ca treatments as factors. Figures were plotted using the “geom_tile” function from the “ggplot2” package.
3 Results
3.1 Element concentrations
Samples from the Siberian site near Chersky (Chersky C1 and C2) were low in Ca. Alaska MNT showed the highest Ca concentration, followed by Alaska MAT, while ASi was low in both Alaskan samples. Soils from the Canadian Shield showed low Ca concentrations and ASi was nearly zero. In all samples, the available P in the Mehlich III extract was very low, whereas the total P amount was almost equal across regions (Table 2).
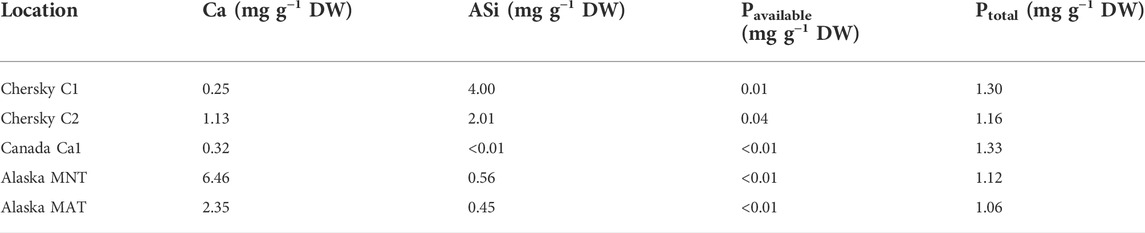
TABLE 2. Element concentrations of the five incubated soils. Ca and available P (Pavailable) were extracted with the Mehlich III method, ASi with the alkaline extraction, and total P (Ptotal) with the aqua regia extraction.
3.2 Greenhouse gas production for different soils
We found considerable differences in CO2 production for the soils from three different Arctic regions for all Si and Ca treatments under drained and waterlogged conditions. In contrast, we detected no CH4 production under the experimental conditions. The most pronounced and clear effects were found for Ca (Table 3). In most cases, even the lowest Ca addition (+5 mg Ca) led to a pronounced reduction in soil-CO2 production. The differences between the different Ca-addition treatments and the initially drained and waterlogged conditions were small (Table 3).
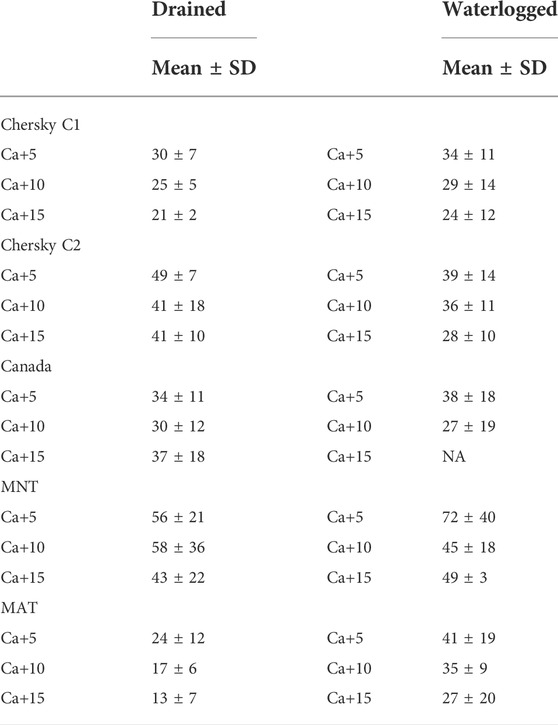
TABLE 3. CO2 production for the different soils and Ca treatments compared to the control treatment in % difference from the treatment means.
3.3 Soil from Siberia Chersky C1
The CO2 production in the Siberia soil Chersky C1 was constant after 12 weeks (compared to the measurements before, data not shown) under drained and waterlogged conditions. CO2 production rates decreased significantly following Ca addition (p < 0.001, F = 134.986, df = 3). For example, CO2 emissions were reduced from 228 ± 59 μmol d−1 kg−1 DW in the control soil to 44–90 μmol d−1 kg−1 DW with Ca addition of +5 to +15 mg g−1 DW soil under the initial drained conditions (Figure 1A). Nearly the same decrease in CO2 production rates following Ca addition (p < 0.001, F = 54.151, df = 3) was found for Chersky C1 under the initial waterlogged conditions (Figure 1B). Addition of Si in the form of ASi significantly increased CO2 production under waterlogged conditions (p = 0.001, F = 6.051, and df = 3), but no significant effects were observed under drained conditions (p = 0.592, F = 0.641, and df = 3) (Figures 1A,B). The interaction between Si and Ca addition was significant under waterlogged conditions (p = 0.001, F = 3.601, and df = 9) but not under drained conditions (p = 0.476, F = 0.996, and df = 9). Our reference treatment (no water addition) showed a CO2 production rate of 178 ± 59 μmol d−1 kg−1 DW after 12 weeks. With this, the CO2 production rate of the reference without water addition is in the range between the control treatment of the drained and waterlogged treatments for the Siberia Chersky C1 soil.
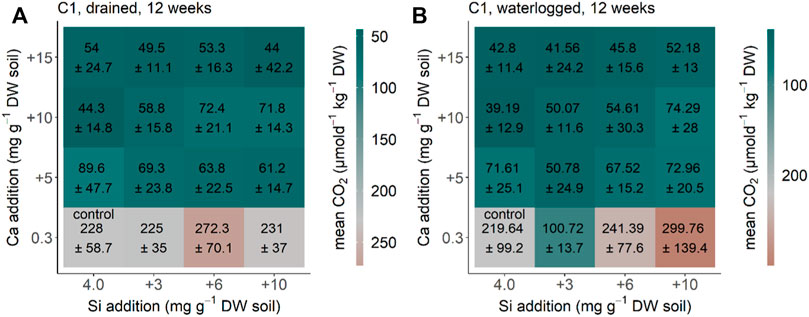
FIGURE 1. CO2 production for the soil from Siberia Chersky C1, NE-Russia after 12 weeks (A) drained and (B) waterlogged incubation. Each square represents a treatment (n = 5) with Si (+0, +3, +6, and +10 mg g−1 DW) and Ca (+0, +5, +10, and +15 mg g−1 DW). Color represents the differences of the treatment of CO2 production in comparison to the control treatment, with green–blue showing a decreased CO2 production and red showing an increased CO2 production in comparison to the control treatment.
3.4 Soil from Siberia Chersky C2
CO2 production in the Siberia Chersky C2 soil equilibrated after 24 weeks (compared to the measurements before, data not shown) under drained and waterlogged conditions. The CO2 production rate decreased significantly by Ca addition under the initial drained conditions (p < 0.001, F = 21.049, and df = 3) (Figure 2A). The same pattern with Ca addition decreasing the CO2 production rate (p < 0.001, F = 58.934, and df = 3) was found for Chersky C2 under initial waterlogged conditions (Figure 2B). Addition of ASi significantly decreased CO2 production under drained conditions (p < 0.001, F = 9.638, and df = 3), but not significantly under waterlogged conditions (p = 0.09, F = 2.221, and df = 3) (Figures 2A,B). The interaction between Si and Ca addition was not significant under both drained conditions (p = 0.371, F = 1.107, and df = 9) and waterlogged conditions (p = 0.49, F = 0.95, and df = 9). Our reference treatment (no water addition) showed a CO2 production rate of 7 ± 3 μmol d−1kg−1 DW after 24 weeks. With this, the CO2 production rate of the reference without water addition is lower than the control treatment of the drained and waterlogged treatments for the Siberia Chersky C2 soil.
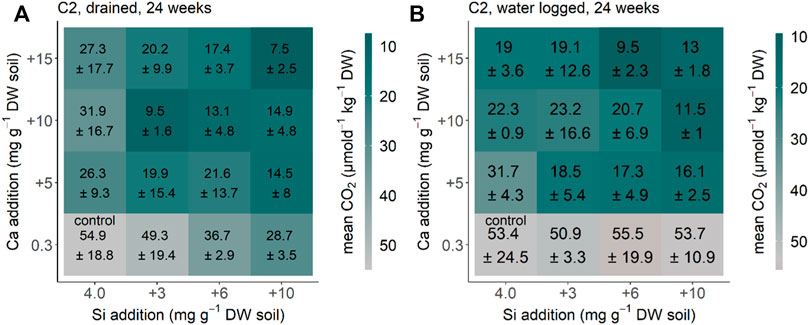
FIGURE 2. CO2 production for the Siberia Chersky C2 from NE-Russia after 24 weeks (A) drained and (B) waterlogged incubation. Each square represents a treatment (n = 5) with Si (+0, +3, +6, and +10 mg g−1 DW) and Ca (+0, +5, +10, and +15 mg g−1 DW). Color represents the differences of the treatment CO2 production in comparison to the control treatment, with green–blue showing a decreased CO2 production and red showing an increased CO2 production in comparison to the control treatment.
3.5 Soil from the Canadian Shield
For the soil from the Canadian Shield (Canada Ca1) the CO2 production equilibrated after 24 weeks (compared to the measurements before, data not shown) under drained and waterlogged conditions. The CO2 production rate decreased significantly after Ca addition under the initial drained conditions (p < 0.001, F = 28.877, and df = 3) (Figure 3A). The same pattern with Ca addition decreasing the CO2 production rate (p < 0.001, F = 24.637, and df = 3) was found for the soil from Canada under the initial waterlogged conditions (Figure 3B). Addition of Si significantly increased CO2 production under drained conditions in the treatments with no Ca addition, but changes were not significant considering all treatments (p = 0.063, F = 2.569, and df = 3), and were also not significant under waterlogged conditions (p = 0.096, F = 2.245, and df = 3) (Figures 3A,B). The interaction of Si and Ca addition was not significant under drained conditions (p = 0.281, F = 1.254, and df = 9) but under waterlogged conditions (p = 0.019, F = 2.843, and df = 9). Our reference treatment (no water addition) showed a CO2 production rate of 2,210 ± 1,440 μmol d−1 kg−1 DW after 24 weeks. With this, the CO2 production rate of the reference without water addition is in the range between the control treatment of the drained and waterlogged treatments for the soils from the Canadian Shield.
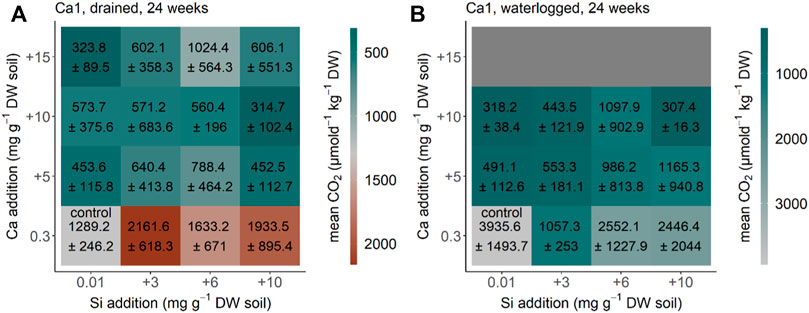
FIGURE 3. CO2 production for the soil Ca1 from the Canadian Shield, Canada, Baffin Bay after 24 weeks (A) drained and (B) waterlogged incubation. Each square represents a treatment (n = 5) with Si (+0, +3, +6, and +10 mg g−1 DW) and Ca (+0, +5, +10, and +15 mg g−1 DW). Color represents mean and standard deviation of CO2 production. A Ca+15 mg g−1 DW was not possible for this soil under waterlogged conditions as we had too less soil material.
3.6 Soil from moist non-acidic tundra in Alaska (MNT)
CO2 production in the MNT soil from Alaska equilibrated after 24 weeks (compared to the measurements before, data not shown) under drained and waterlogged conditions. CO2 production rate decreased significantly after Ca addition under the initial drained conditions (p < 0.001, F = 6.905, and df = 3) (Figure 4A). The same pattern with Ca addition decreasing the CO2 production rate (p < 0.001, F = 7.763, df = 3) was found for MNT soil from Alaska under initial waterlogged conditions (Figure 4B). Addition of Si increased CO2 production under drained conditions but not significantly (p = 0.8338, F = 0.833, and df = 3), and also not significantly under the initial waterlogged conditions (p = 0.1, F = 2.186, and df = 3) (Figures 4A, B). The interaction of Si and Ca addition was not significant under both drained conditions (p = 0.485, F = 0.48, and df = 9) and waterlogged conditions (p = 0.116, F = 1.675, and df = 9). Our reference treatment (no water addition) showed a CO2 production rate of 331 ± 38 μmol d−1 kg−1 DW after 24 weeks, which is in the range between the control treatment of the drained and waterlogged treatments for the soil from the moist non-acidic tundra from Alaska.
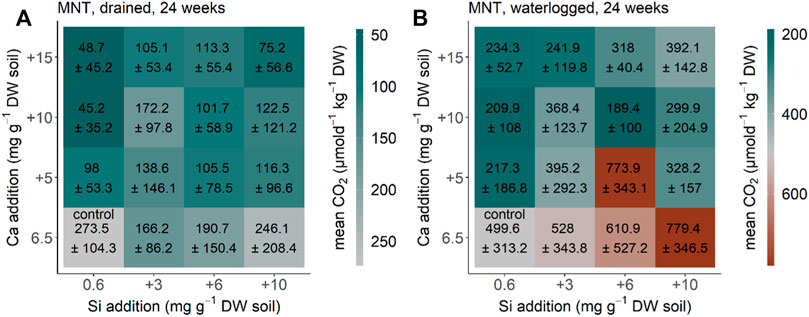
FIGURE 4. CO2 production for the MNT soil from moist non-acidic tundra, Alaska after 24 weeks (A) drained and (B) waterlogged incubation. Each square represents a treatment (n = 5) with Si (+0, +3, +6, and +10 mg g−1 DW) and Ca (+0, +5, +10, and +15 mg g−1 DW). Color represents mean and standard deviation of CO2 production.
3.7 Soil from moist acidic tundra Alaska (MAT)
CO2 production in the MAT soil from Alaska equilibrated after 24 weeks (compared to the measurements before, data not shown) under drained and waterlogged conditions. CO2 production rate decreased significantly by Ca addition under initial drained conditions (p < 0.001, F = 40.664, df = 3) (Figure 5A). The same pattern with Ca addition decreasing CO2 production rate (p < 0.001, F = 25.163, df = 3) was found for MAT soil from Alaska under initial waterlogged conditions (Figure 5B). Addition of Si had no clear effect on CO2 production under drained conditions (p = 0.921, F = 0.164, df = 3), and significantly decreased CO2 production under initial waterlogged conditions (p < 0.001, F = 7.098, df = 3) (Figure 5A, B). The interaction of Si and Ca additions was not significant under initial drained conditions (p = 0.527, F = 0.904, df = 9) but under initial waterlogged conditions (p = 0.003, F = 3.177, df = 9). Our reference treatment (no water addition) showed a CO2 production rate of 2,660 ± 1,120 μmol d−1kg−1 DW after 24 weeks, which is in the range between the control treatment of the drained and waterlogged treatments for the soil from the moist non-acidic tundra from Alaska.
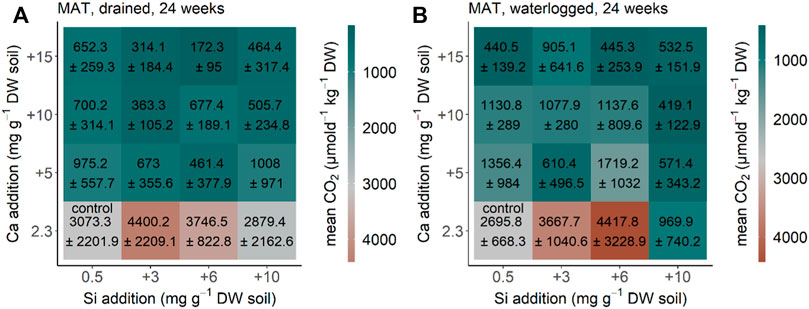
FIGURE 5. CO2 production for the MAT soil from moist acidic tundra, Alaska after 24 weeks (A) drained and (B) waterlogged incubation. Each square represents a treatment (n = 5) with Si (+0, +3, +6, and +10 mg g−1 DW) and Ca (+0, +5, +10, and +15 mg g−1 DW). Color represents mean and standard deviation of CO2 production.
4 Discussion and conclusion
For all soils, increasing Ca concentrations decreased the soil CO2 production rate dramatically (Figures 1–5). The effect of Si was not clear, with Si increasing the soil CO2 production rate for some treatments of some soils; for other soils, it decreased the soil CO2 production rate, and for others it had no effect. The decrease of soil-CO2 production rate by Ca agrees with earlier findings (Whittinghill and Hobbie 2012; Schaller et al., 2019). This effect may be explained by either cation-bridging of soil organic matter by Ca ions (Whittinghill and Hobbie 2012; Schaller et al., 2019), or by increasing the salinity by Ca addition potentially decreasing the activity of the microbial decomposer community (Mavi et al., 2012), or a combination of both. The large response variation of the Si effect on the soil-CO2 production rate (from increasing to decreasing) is in contrast to previous studies, reporting a positive effect of Si on soil respiration or organic-matter decomposition (Schaller et al., 2014; Marxen et al., 2015; Schaller et al., 2019). The effect of Si addition increased the soil-CO2 production rate and might be explained by the silicic acid increasing both the soil phosphorus and soil’s organic matter availability for microbial decomposers (Reithmaier et al., 2017; Schaller et al., 2019; Hömberg et al., 2020; Hömberg et al., 2021b). Polysilicic acid is competing with both dissolved organic carbon and phosphate for sorption sites at the surface of soil particles (Schaller et al., 2019; Hömberg et al., 2020; Schaller et al., 2021), mostly iron oxidic phases. The subsequent higher availability of both organic carbon and phosphate may result in an increase of greenhouse gas production by accelerating soil respiration afterward (Reithmaier et al., 2017; Schaller et al., 2019; Hömberg et al., 2021b; Hömberg et al., 2021c). A decreasing effect of Si on soil-CO2 production rates was observed especially under waterlogged conditions. Such a decreasing effect might be due to the potential dissolution of iron oxides as a binding partner for phosphate, organic carbon, and silicic acid and afterward co-precipitating all those compounds in some form of silica (Liu et al., 2009).
We found no differences between drained and waterlogged conditions for Chersky C1 and C2 as well as MAT. However, for Ca1 and MNT soil, respiration increased from drained to waterlogged conditions. Both soils (Ca1 and MNT) are from the top layer, potentially consisting of younger organic carbon (Shi et al., 2020). The Ca effect on soil respiration was lowest for MNT, which might be explained by the fact that this soil has high ash content, hence having low organic carbon content. However, for the Chersky C1 soil, we did not find such a low effect of Ca on soil respiration despite its comparable ash content to the MNT soil. For the soil from Siberia (Chersky), the lower concentrations of both ASi and Ca in the uppermost part of the current permafrost layers suggest that deeper thaw, as a consequence of Arctic warming, would also lower the concentrations of these elements in the seasonally thawed and biogeochemically active layer by depletion (Stimmler et al. in revision). In this context, the soil ASi concentration are forecast to decrease more strongly than Ca concentrations (Stimmler et al. in revision), potentially leading to a domination of the effect of Ca on soil-CO2 production and release over the Si effect, with its proceeding Arctic warming and associated permafrost thaw. Assuming the Chersky soils to be representative for a larger Arctic domain, this decrease in CO2 production and release due to higher Ca availability in the future would lead to more potential CO2 emissions than currently thought from Siberia in the future. Similarly, for the soil from the Canadian Shield (Canada Ca1) a slight decrease in soil-Ca concentrations is predicted (Stimmler et al. in revision). Data from Walker et al. (2001) suggest a strong increased Ca concentration upon permafrost thaw (higher Ca concentration in the permafrost layer compared to the current active layer) for the moist acidic tundra in Alaska (MAT). This may lead to a strong decrease in the soil-CO2 production rates for the acid soils from Alaska (MAT); whereas, for the non-acid tundra in Alaska (MNT), data from Walker et al. (2001) suggest a potential depletion of Ca concentration in those non-acidic soils (lower Ca concentration in the permafrost compared to the current active layer). Such a decrease in the soil-Ca concentration may lead to increased soil CO2 production rates for the non-acid soils from Alaska (MNT). A potential explanation for the absence of CH4 emissions are the extremely low temperatures and the low amounts of soil organic carbon used in the incubations.
Overall, our data suggest that the soil Ca concentration may be a main control on the soil CO2 production rates for all the soils from the different regions of the Arctic. Including Ca as the main factor for Arctic soil-CO2 production rates may reduce uncertainties when modeling future climate scenarios on how the Arctic system may respond to global warming and will make those models more reliable. The ASi effect seems to be complex and need further investigations. We did not find any CH4 production under the used experimental conditions. This may be related to the sample size used in the experiments. As CH4 is a very important greenhouse gas for Arctic systems (Treat et al., 2015) and was shown to also be abundant under field conditions in relation to waterlogging and drainage (Kwon et al., 2019), future experiments should be designed to reproduce the CH4 production as observed natural field conditions (Corradi et al., 2005).
Data availability statement
The raw data supporting the conclusion of this article will be made available by the authors, without undue reservation.
Author contributions
JS and MG planed the experiment with help from PS. MG, SN, OS, and NP provided the soils. PS conducted the experiment. The measurements were carried out by PS with the help of BG. PS and JS wrote the first draft of the manuscript. All authors commented on and approved the manuscript.
Funding
This work was funded by the German Research Foundation (DFG), grant number SCHA 1822/12-1 to Jörg Schaller.
Acknowledgments
The authors would like to thank the staff at the Limnological station and the Agroecology department (both University Bayreuth) for their help with the experiment.
Conflict of interest
The authors declare that the research was conducted in the absence of any commercial or financial relationships that could be construed as a potential conflict of interest.
Publisher’s note
All claims expressed in this article are solely those of the authors and do not necessarily represent those of their affiliated organizations, or those of the publisher, the editors, and the reviewers. Any product that may be evaluated in this article, or claim that may be made by its manufacturer, is not guaranteed or endorsed by the publisher.
Supplementary material
The Supplementary Material for this article can be found online at: https://www.frontiersin.org/articles/10.3389/fenvs.2022.1019610/full#supplementary-material
References
Alfredsson, H., Hugelius, G., Clymans, W., Stadmark, J., Kuhry, P., and Conley, D. J. (2015). Amorphous silica pools in permafrost soils of the Central Canadian Arctic and the potential impact of climate change. Biogeochemistry 124, 441–459. doi:10.1007/s10533-015-0108-1
Allan, R. P. (2021). Climate change 2021: The physical science basis. Contribution of working group I to the sixth assessment report of the intergovernmental panel on climate change. Geneva, Switzerland: WMO.
Brown, J., and Romanovsky, V. E. (2008). Report from the international permafrost association: State of permafrost in the first decade of the 21st century. Permafr. Periglac. Process. 19 (2), 255–260. doi:10.1002/ppp.618
Corradi, C., Kolle, O., Walter, K., Zimov, S. A., and Schulze, E. D. (2005). Carbon dioxide and methane exchange of a north‐east Siberian tussock tundra. Glob. Change Biol. 11, 1910–1925. doi:10.1111/j.1365-2486.2005.01023.x
DeMaster, D. J. (1981). The supply and accumulation of silica in the marine environment. Geochim. Cosmochim. Acta 45, 1715–1732. doi:10.1016/0016-7037(81)90006-5
Hömberg, A., Broder, T., Knorr, K.-H., and Schaller, J. (2021a). Divergent effect of silicon on greenhouse gas production from reduced and oxidized peat organic matter. Geoderma 386, 114916. doi:10.1016/j.geoderma.2020.114916
Hömberg, A., Broder, T., Schaller, J., and Knorr, K. H. (2021b). Methane fluxes but not respiratory carbon dioxide fluxes altered under Si amendment during drying–rewetting cycles in fen peat mesocosms. Geoderma 404, 115338. doi:10.1016/j.geoderma.2021.115338
Hömberg, A., Knorr, K.-H., and Schaller, J. (2021c). Methane production rate during anoxic litter decomposition depends on Si mass fractions, nutrient stoichiometry and carbon quality. Plants (Basel). 10, 618. doi:10.3390/plants10040618
Hömberg, A., Obst, M., Knorr, K.-H., Kalbitz, K., and Schaller, J. (2020). Increased silicon concentration in fen peat leads to a release of iron and phosphate and changes in the composition of dissolved organic matter. Geoderma 374, 114422. doi:10.1016/j.geoderma.2020.114422
Hugelius, G., Strauss, J., Zubrzycki, S., Harden, J. W., Schuur, E. A. G., Ping, C. L., et al. (2014). Estimated stocks of circumpolar permafrost carbon with quantified uncertainty ranges and identified data gaps. Biogeosciences 11, 6573–6593. doi:10.5194/bg-11-6573-2014
Kwon, M. J., Natali, S. M., Hicks Pries, C. E., Schuur, E. A. G., Steinhof, A., Crummer, K. G., et al. (2019). Drainage enhances modern soil carbon contribution but reduces old soil carbon contribution to ecosystem respiration in tundra ecosystems. Glob. Change Biol. 25, 1315–1325. doi:10.1111/gcb.14578
Liu, M.-C., Sheu, H.-S., and Cheng, S. (2009). Anion-exchange induced phase transformation of mesostructured silica. J. Am. Chem. Soc. 131, 3998–4005. doi:10.1021/ja808025m
Marxen, A., Klotzbücher, T., Jahn, R., Kaiser, K., Nguyen, V. S., Schmidt, A., et al. (2015). Interaction between silicon cycling and straw decomposition in a silicon deficient rice production system. Plant Soil 398, 153–163. doi:10.1007/s11104-015-2645-8
Mavi, M. S., Marschner, P., Chittleborough, D. J., Cox, J. W., and Sanderman, J. (2012). Salinity and sodicity affect soil respiration and dissolved organic matter dynamics differentially in soils varying in texture. Soil Biol. Biochem. 45, 8–13. doi:10.1016/j.soilbio.2011.10.003
Mehlich, A. (1984). Mehlich-3 soil test extractant - a modification of Mehlich-2 extractant. Commun. Soil Sci. Plant Anal. 15, 1409–1416. doi:10.1080/00103628409367568
Miner, K. R., Turetsky, M. R., Malina, E., Bartsch, A., Tamminen, J., McGuire, A. D., et al. (2022). Permafrost carbon emissions in a changing Arctic. Nat. Rev. Earth Environ. 3, 55–67. doi:10.1038/s43017-021-00230-3
Mishra, U., Hugelius, G., Shelef, E., Yang, Y., Strauss, J., Lupachev, A., et al. (2021). Spatial heterogeneity and environmental predictors of permafrost region soil organic carbon stocks. Sci. Adv. 7, eaaz5236. doi:10.1126/sciadv.aaz5236
Reithmaier, G. M. S., Knorr, K. H., Arnhold, S., Planer-Friedrich, B., and Schaller, J. (2017). Enhanced silicon availability leads to increased methane production, nutrient and toxicant mobility in peatlands. Sci. Rep. 7, 8728. doi:10.1038/s41598-017-09130-3
Romanovsky, V. E., Drozdov, D., Oberman, N. G., Malkova, G. V., Kholodov, A. L., Marchenko, S. S., et al. (2010). Thermal state of permafrost in Russia. Permafr. Periglac. Process. 21, 136–155. doi:10.1002/ppp.683
Rowley, M. C., Grand, S., and Verrecchia, É. P. (2018). Calcium-mediated stabilisation of soil organic carbon. Biogeochemistry 137, 27–49. doi:10.1007/s10533-017-0410-1
Schaller, J., Cramer, A., Carminati, A., and Zarebanadkouki, M. (2020). Biogenic amorphous silica as main driver for plant available water in soils. Sci. Rep. 10, 2424. doi:10.1038/s41598-020-59437-x
Schaller, J., Fauchere, S., Joss, H., Obst, M., Goeckede, M., Planer-Friedrich, B., et al. (2019). Silicon increases the phosphorus availability of Arctic soils. Sci. Rep. 9, 449. doi:10.1038/s41598-018-37104-6
Schaller, J., Hines, J., Brackhage, C., Baucker, E., and Gessner, M. O. (2014). Silica decouples fungal growth and litter decomposition without changing responses to climate warming and N enrichment. Ecology 95, 3181–3189. doi:10.1890/13-2104.1
Schaller, J., Puppe, D., Kaczorek, D., Ellerbrock, R., and Sommer, M. (2021). Silicon cycling in soils revisited. Plants 10, 295. doi:10.3390/plants10020295
Schuur, E., McGuire, A., Schädel, C., Grosse, G., Harden, J. W., Hayes, D. J., et al. (2015). Climate change and the permafrost carbon feedback. Nature 520, 171–179. doi:10.1038/nature14338
Shi, Z., Allison, S. D., He, Y., Levine, P. A., Hoyt, A. M., Beem-Miller, J., et al. (2020). The age distribution of global soil carbon inferred from radiocarbon measurements. Nat. Geosci. 13, 555–559. doi:10.1038/s41561-020-0596-z
Stein, L. Y. (2020). The long-term relationship between microbial metabolism and greenhouse gases. Trends Microbiol. 28, 500–511. doi:10.1016/j.tim.2020.01.006
Stimmler, P., Goeckede, M., Elberling, B., Natali, S., Kuhry, P., Perron, N., et al. (2022a). Pan-Arctic soil element bioavailability estimations. Earth System Science Data. Available at: https://essd.copernicus.org/preprints/essd-2022-123/(Accessed Apr 07, 2022).
Stimmler, P., Priemé, A., Elberling, B., Goeckede, M., and Schaller, J. (2022b). Arctic soil respiration and microbial community structure driven by silicon and calcium. Sci. Total Environ. 838, 156152. doi:10.1016/j.scitotenv.2022.156152
Treat, C. C., Natali, S. M., Ernakovich, J., Iversen, C. M., Lupascu, M., McGuire, A. D., et al. (2015). A pan‐Arctic synthesis of CH4 and CO2 production from anoxic soil incubations. Glob. Change Biol. 21, 2787–2803. doi:10.1111/gcb.12875
Walker, D., Bockheim, J., Chapin, F., Eugster, W., Nelson, F., and Ping, C. (2001). Calcium-rich tundra, wildlife, and the “mammoth steppe”. Quat. Sci. Rev. 20, 149–163. doi:10.1016/s0277-3791(00)00126-8
Keywords: Arctic soil, climate change, GHG production, greenhouse gas emissions, silicon, soil respiration
Citation: Stimmler P, Göckede M, Natali SM, Sonnentag O, Gilfedder BS, Perron N and Schaller J (2022) The importance of calcium and amorphous silica for arctic soil CO2 production. Front. Environ. Sci. 10:1019610. doi: 10.3389/fenvs.2022.1019610
Received: 15 August 2022; Accepted: 06 September 2022;
Published: 01 November 2022.
Edited by:
Wei He, China University of Geosciences, ChinaReviewed by:
Petr Semenov, All Russian Research Institute of Geology and Mineral Resources of the World Ocean, RussiaYinghui Wang, Southern University of Science and Technology, China
Copyright © 2022 Stimmler, Göckede, Natali, Sonnentag, Gilfedder, Perron and Schaller. This is an open-access article distributed under the terms of the Creative Commons Attribution License (CC BY). The use, distribution or reproduction in other forums is permitted, provided the original author(s) and the copyright owner(s) are credited and that the original publication in this journal is cited, in accordance with accepted academic practice. No use, distribution or reproduction is permitted which does not comply with these terms.
*Correspondence: Jörg Schaller, Joerg.Schaller@zalf.de