Phytoplankton Drivers of Dissolved Organic Material Production in Colorado Reservoirs and the Formation of Disinfection By-Products
 Alia L. Khan1,2*
  Eric R. Sokol3,4
  Diane M. McKnight3,5
  James F. Saunders5
  Amanda K. Hohner6 R. Scott Summers5
- 1Department of Environmental Sciences, Western Washington University, Bellingham, WA, United States
- 2National Snow and Ice Data Center, University of CO-Boulder, Boulder, CO, United States
- 3Institute of Arctic and Alpine Research, University of CO-Boulder, Boulder, CO, United States
- 4Battelle, National Ecological Observatory Network, Boulder, CO, United States
- 5Department of Civil, Environmental and Architectural Engineering, University of CO-Boulder, Boulder, CO, United States
- 6Department of Civil and Environmental Engineering, Washington State University, Pullman, WA, United States
Previous studies have shown that algal-derived dissolved organic matter (DOM) has a strong influence on the formation of disinfection byproducts (DBPs) during the treatment of drinking water. In the summer of 2010, we evaluated the role of nitrogen and phosphorus loading and phytoplankton abundance as drivers of the concentrations and quality of DOM and the associated DBP formation in 30 reservoirs in the mountains and plains of the State of Colorado. Optical properties such as Specific Ultraviolet Absorbance at 254 nm (SUVA254) and fluorescence spectroscopy were used to characterize DOM quality. Nutrient concentrations such as total nitrogen were also assessed and were associated with high concentrations of chlorophyll a (Chl-a). In turn, high total organic carbon (TOC) concentrations were associated with high concentrations of Chl-a, and the DOM in these reservoirs had a fluorescence signature indicative of contributions from phytoplankton growth. The reservoirs with TOC concentrations above 4 mgC/L were predominantly located in the plains and many are impacted by agricultural runoff and wastewater discharges, rather than in the mountains and are characterized by warm water conditions and shallow depths. For a subset of fourteen reservoirs, we characterized the composition of the phytoplankton using a rapid imaging microscopy technique and observed a dominance by filamentous Cyanobacteria in reservoirs with TOC concentrations above 4 mgC/L. The combination of high TOC concentrations with microbial characteristics resulted in high potential for production of two major classes of regulated DBPs, trihalomethanes and haloacetic acids. While fluorescence spectroscopy was useful in confirming the contribution of phytoplankton growth to high TOC concentrations, evaluation of predictive models for DBP yields found that all equally predictive models included SUVA254 and some of these models also included fluorescence indices or logTOC. These findings provide a limnological context in support of the recent guidelines that have been implemented for protection of high-quality drinking water supplies in the State of Colorado.
Introduction
In recent years, increases in total organic carbon (TOC) concentrations have been observed in surface waters (e.g. Rosén, 2005; Monteith et al., 2007; Erlandsson et al., 2008; O’Beirne et al., 2009; Ouehle and Hruska, 2009; SanClements et al., 2012; Meyer-Jacob et al., 2015; De Wit et al., 2016) including the State of Colorado (Beggs et al., 2013). The increases in dissolved organic matter (DOM) in reservoirs may be driven by greater inputs of DOM from the surrounding catchments (allochthonous sources), wastewater effluents, or greater production by phototrophic biota in the reservoirs (autochthonous sources) such as wetland vegetation, mosses, reeds and water lilies, and planktonic or benthic algae and Cyanobacteria (e.g., Strock et al., 2017).
Concomitantly, drinking water utilities have faced the challenge of treating source waters with increasing DOM levels of while avoiding the formation of potentially carcinogenic disinfection by-products (DBPs) (Beggs et al., 2013; Lavonen et al., 2013; Ritson et al., 2014; Greenstein and Wert, 2019). Recent studies have shown that spectroscopic characteristics of DOM are useful indicators of precursors for the two main classes of the regulated DBPs that require monitoring, total trihalomethanes (TTHMs) and five haloacetic acids (HAA5) (Beggs et al., 2009; Golea et al., 2017). For surface water sources with TOC > 2 mgC/L, the 1998 Stage1 DBP-Rule requires TOC removal prior to chlorination and the required percent TOC removal are a function of source water alkalinity and are applied in increments as >2.0–4.0, >4.0–8.0, and >8.0 mgC/L (U.S. EPA, 2006).
For mountainous regions such as Colorado, United States, systems of interconnected raw water storage reservoirs in the mountains and plains regions allow utilities to optimize water supply by capturing water during the spring snowmelt to maintain water supplies during drought and meet peak demands throughout the year. During storage, the water quality may be influenced by autochthonous production of DOM due to algal growth and photochemical degradation of allochthonous DOM. For example, algal-derived DOM has been shown to be produced in proportion to the chlorophyll-a (Chl-a) concentration during the summer phytoplankton bloom (Miller et al., 2009) and to influence DBP formation (Kraus et al., 2011). Further, laboratory studies have shown that algal-derived DOM is reactive in forming DBPs (e.g., Huang et al., 2009; Fang et al., 2010; Yang et al., 2011; Zamyadi et al., 2012; Wert and Rosario-Ortiz 2013; Zhou et al., 2014; Gonsior et al., 2019; Hua et al., 2019).
Harmful algal blooms (HABs) have been increasing globally in recent years (Backer et al., 2015) and have been observed across all 50 states of the United States. Freshwater HABs, such as in Lake Erie, can be large enough to be monitored by satellite remote sensing (Schmale et al., 2019). HABs are also increasing in frequency due to increased nutrient supplies (Ho and Michalak 2017; Del Giudice et al., 2018; Glibert, 2020) and warming temperatures (e.g. Pearl and Scott, 2010), leading to contamination of municipal water supplies (e.g. Schmale et al., 2019). Since surface waters are often used as drinking water sources, drinking water treatment systems are faced with the challenge of balancing short-term and long-term health risks by treating the potentially toxin-producing HAB, while also managing for disinfection byproduct (DBP) formation (Foreman et al., 2021). Earlier ice-out under a warming climate is a further consideration that will prolong warmer summer conditions favoring algal growth (Magnuson et al., 1997; Sharma et al., 2014) and amplify the challenges for drinking water utilities in managing DBP formation. Thus, a greater understanding of underlying limnological processes that influence DOM quality and DBP precursors in reservoirs would be useful.
These factors controlling DOM concentration are now being considered in water quality management. This study was part of a larger effort that helped inform the Water Quality Control Division of the Colorado Department of Public Health and Environment (CDPHE) adoption of a Chl-a standard of 5 μg/L as an option for providing protection of direct use water supply reservoirs (Colorado Water Quality Control Commission, 2013; Saunders et al., 2015). This standard was adopted based on results from a study conducted in the summer of 2010 by the CDPHE of 38 reservoirs in Colorado, of which 30 reservoirs are described in this study. The approach in this standard relies on Chl-a as an indicator of algal biomass. Further, this approach represents a bridge between nutrient controls, which states can adopt under the Clean Water Act, and the drinking water quality safeguards associated with the Safe Drinking Water Act (Callinan et al., 2013; Saunders et al., 2015). The analysis of the CDPHE study was based on the use of data from reservoirs in Colorado to develop quantitative relationships between algal abundance (Chl-a) and organic carbon levels. Monitoring data from drinking water treatment facilities were then explored to determine trends between DBP concentrations in treated water and organic carbon concentrations in raw water. Together, these measurements were applied to determine a Chl-a threshold that can initiate a protocol to limit nutrient sources within a watershed (Saunders et al., 2015). This paper builds on the results of a subset (4 overlapping lakes) of the data that was also presented in Saunders et al. (2015) by including 26 additional lakes that span a larger geographic range and include surface waters more wastewater inputs. The four lakes overlapping between the two studies are Boulder Reservoir (BD), Milton Seaman Reservoir (GS), Standley Lake (WM), and Chatfield Reservoir (CH) (Table 1). BD, GS, and WM were monitored weekly over the summer. The data presented in this study are from a synoptic water sampling campaign conducted at the height of the summer algal growing season, including CH. The samples that most similarly correspond to the dates of the synoptic survey were utilized from BD, GS and WM. By including these additional lakes in this study, the span of concentrations for nutrients, dissolved organic carbon, and chlorophyll-a is greatly increased. Additional fluorescence spectroscopic techniques are included in this study to characterize the contribution of DOM derived from phototrophic microbes and phytoplankton biomass and identification and using a FlowCAM®.
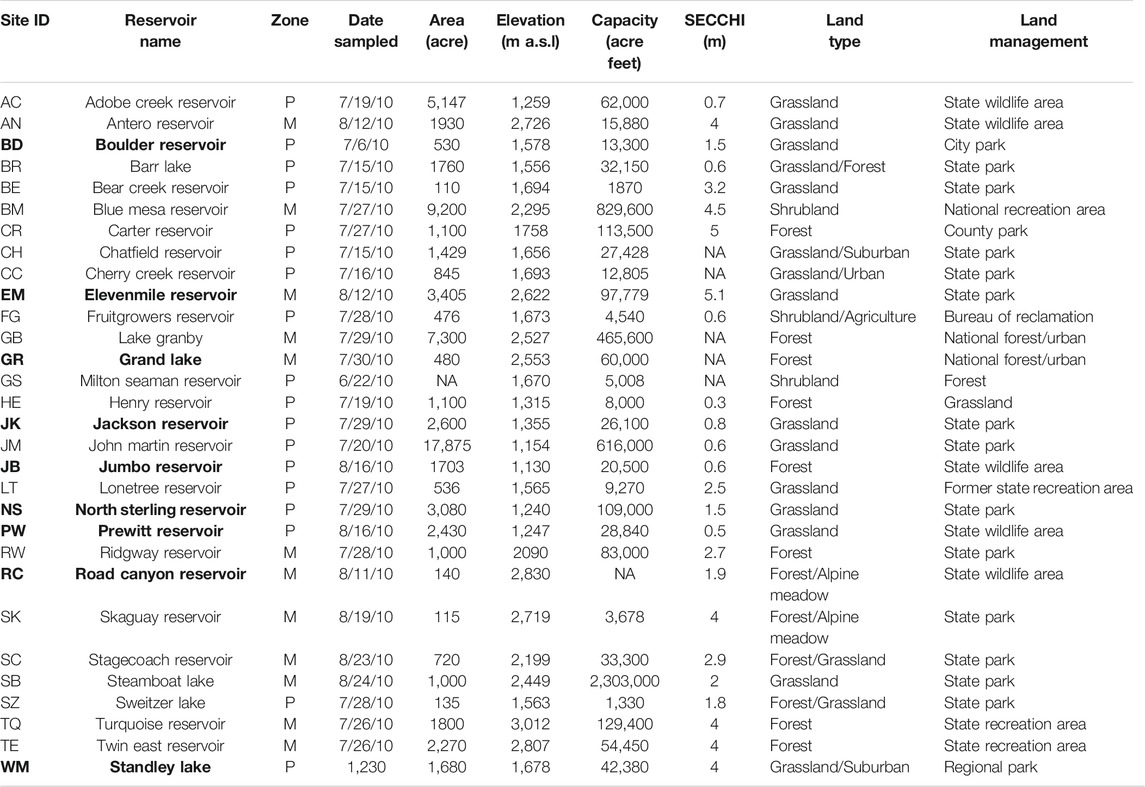
TABLE 1. Summary of physical and geographical characteristics of Colorado reservoirs studied divided into two zones: Mountain (M) and Plains (P). The nine reservoirs with complete data sets that include all analyses are in bold.
The DOM sources to lakes and reservoirs differ in their chemical characteristics in ways that can be detected using spectroscopic methods (Jaffé et al., 2008). Because lignin and plant pigments are common precursor organic materials from terrestrial and littoral zone vegetation, these DOM sources generally have similar chemical characteristics. The spectral signal in water samples is associated primarily with the humic DOM fraction, which can range from over 85% of the DOM in wetlands to less than 20% of the DOM in lakes and streams where most of the DOM derives from phototrophic microbes. One spectral indicator of DOM source is the absorbance of light at 254 nm divided by the concentration of dissolved organic carbon (DOC), referred to as specific UV absorbance or SUVA254 (e.g., Weishaar et al., 2003). Given the aromaticity of lignin and plant pigments, SUVA254 is higher for DOM derived from plants and soils than for DOM derived from phototrophic microbes (Weishaar et al., 2003). The study by Saunders et al. (2015) found a strong relationship between SUVA254 and the yield of TTHMs per mg DOC, and a weaker relationship between SUVA254 and the yield of HAA5 per mg DOC. A complementary approach to SUVA254 for characterizing DOM source and reactivity is provided by several fluorescence indices (Gabor et al., 2013). For example, the fluorescence index (FI) (McKnight et al., 2001; Cory and McKnight 2005) ranges from 1.3 for plant/soil derived DOM to 1.8 for DOM from phototrophic microbes. Recently, Khan et al. (2019) have identified certain wavelengths that could be useful in designing fluorescence probes for monitoring the production of algal organic matter released by Cyanobacteria and algae in reservoirs.
Our overall objective was to determine the influence of summertime algal growth on DBP precursors. Our specific objectives were to investigate additional limnological relationships in the dataset from the CDPHE study, which included 13 reservoirs in the Rocky Mountains and 17 in the foothills and plains. Such insight could inform the implementation of algal controls through the Clean Water Act and regulation of drinking water quality through the Safe Drinking Water Act. The reservoirs of the CDPHE study were sampled during July and August, at the height of the expected summer algal bloom. We evaluated the relationship between Chl-a concentrations and ratios of total nitrogen to total phosphorus to the Redfield ratio. For a subset of samples, the phytoplankton community was examined using fluid imaging approaches and we evaluated the relative abundance of Cyanobacteria across the range of TOC concentrations in the dataset. We used fluorescence spectroscopy to characterize the contribution of DOM derived from phototrophic microbes in relationship to Chl-a concentrations. Finally, we examined the relationship between DOM quality, as measured by both SUVA254 and fluorescence spectroscopy, and the formation of TTHMs and HAA5s. Due to recent increases in surface water HABs across the state of Colorado (CDPHE, Algae Tracking Dashboard), there is a growing need to not only monitor and track them, but also understand their potential repercussions on wastewater and drinking water treatment. The data from this study provide a baseline of algal organic matter in CO lakes and reservoirs that will become increasingly important for referencing in future years and decades.
Materials and Methods
Site Description
In the summer of 2010, the CDPHE conducted a High-Quality Water Supply study to assess the impact of algal growth in Colorado reservoirs on TOC concentrations and the potential to form DBPs. Most of the 30 reservoirs (Figure 1 and Table 1) have been classified for the Water Supply use, although only a few currently provide raw water for treatment facilities. The reservoirs varied in elevation (∼1,100 m a.s.l–∼3,000 m a.s.l), area (110–17,875 acres), capacity (1,330–829,600 acre ft), and secchi depth (0.3–5.1 m). The reservoirs were chosen to include a balance of lakes in the mountains and the plains, representing diverse climatic and watershed characteristics across Colorado. The lower elevation reservoirs tend to be shallow and have warmer temperatures compared to the high elevation reservoirs. In addition, most of the plains reservoirs are strongly influenced by agriculatural runoff and discharge of treated wastewater from large urban areas along the Front Range. In this study, the reseroivrs at and above 1700 m were considered mountain reservoirs (n = 13) and those below 1700 m a.s.l were included in the plains category (n = 17). Many of these reservoirs were located in state or county parks, wildlife and/or recreation areas where fishing, boating, hiking and camping are common actvities.
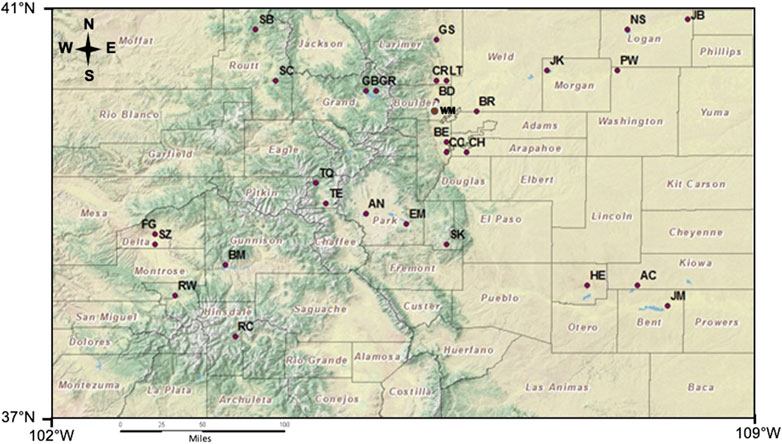
FIGURE 1. Distribution of the 30 reservoirs sampled across the state of Colorado.
Sample Collection
The 30 lakes were sampled during July and August (Table 1) at the peak of summer stratification. The Boulder and Westminster drinking water reservoirs were sampled biweekly from May through September 2010. The CDPHE staff collected 1,000 ml surface-water grab samples from the 30 lakes. The biweekly sampling was conducted by staff at the respective utility. The raw water for DOC, TOC and SUVA254 was stored in pre-cleaned and pre-combusted amber glass bottles and stored on ice. Nutrient samples were collected in plastic HDPE bottles and stored on ice. Upon delivery to the University of Colorado by the following day, water samples were immediately refrigerated at 4°C. For 25 of the 30 lake samples which were analyzed for spectroscopic analysis and DOC, the samples were filtered through 0.7 µm pore size pre-combusted glass fiber filters (GFF). A 1000 ml sample of raw water was transferred to the Kiowa Laboratory at the Institute of Arctic and Alpine Research for TOC, Total Nitrogen (TN), inorganic nitrogen, and Total Phosphorous (TP) analysis. In addition, 1,000 to 1,500 ml of water was filtered on 0.7 µm GFF filters and frozen for Chl-a analysis. The analysis of phytoplankton for 14 of the 30 lakes was done for 500 ml surface grab samples collected in amber Nalgene bottles, preserved with Lugol’s solution, and stored at 4°C until analysis.
Analytical Methods
TOC, DOC and TN were measured on raw water using a Shimadzu TOC-V CSN at the Kiowa Laboratory. Total inorganic nitrogen species (nitrate, nitrite and ammonium), as well as TP, were analyzed at the Kiowa Laboratory on a Lachat 8,500. Chl-a concentrations were measured using a fluorescence method with acetone extraction (Wetzel and Likens, 2000). Accurate dilutions of a Chl-a standard from Fisher Scientific were analyzed to establish a linear calibration curve and a linear calibration factor between the UV-Vis Spectrophotometer and the Fluoromax 2 (F2) fluorometer. The fluorescence method was used due to higher sensitivity than the UV-Vis Spectrophotometer method. 3 ml aliquots of extracted Chl-a were measured on the F2 and were corrected for phaeophytin through acidification of 100 µL of HCL. Chl-a concentrations were determined using the formula established by Wetzel and Likens (2000).
Analysis of the phytoplankton using the FlowCAM® was conducted to understand the relationships between the phytoplankton species, Chl-a, nutrient levels, physical characteristics of the lake, and TOC concentrations. For a subset of 14 reservoirs (eight mountain and six plains), phytoplankton identification and enumeration was conducted with a Fluid Imaging Technologies FlowCAM®. Unlike traditional microscopy, the FlowCAM® enables rapid monitoring of particles in fluid by combining flow cytometry with microscopy. The FlowCAM® automatically counts and images each particle, while also evaluating characteristics of the digital image, such as shape and intensity. Such imaging microscopes are becoming more commonly used by water treatment utilities to monitor phytoplankton abundance in source water lakes and reservoirs, as well as to identify invasive species.
For these analyses, 150 ml of the 500 ml grab sample was transferred to a 250 ml centrifuge tube and settled for 24 h. Then, 130 ml of the sample was aspirated from the top of the sample in a manner that did not disturb the settled particles. The concentrated sample was then transferred to a 50 ml centrifuge tube. If the sample looked visibly cloudy, it was filtered with a 100 µm mesh net to avoid clogging in the flow cell. The 10X objective was used with a 100 µm flow cell. Acetone was run for five minutes to clean the flow cell and tubing. The FlowCAM® was focused using a small volume of spare sample. A 2 ml of sub-sample was then run through the FlowCAM®. After the sample finished running, image library files were made through the interactive data platform and sorted based on image characteristics associated with each of three dominant algal groups, Cyanobacteria, diatoms and chlorophytes (green algae). An automated filter was set up based on image analysis, and then files were verified by human-eye. Algal groups were then quantified by assessing the concentration as cells or colonies per mL, taking into account the amount of sample imaged. Area based diameter (ABD) calculated by the FlowCAM® was then multiplied by the number of counts in the file for each algal group to get an approximation of biovolume. The number of cells or colonies for each group with respect to total count was multiplied by ABD in order to calculate % biovolume of each group. Further linear regressions in Excel and two-tailed t-tests were applied to interpret key physical relationships driving the DOM quality.
A subset of 25 filtered water samples from the 30 lakes sampled were analyzed on a Fluoromax 3 to obtain Excitation Emission Matrices (EEMs), following the methods of Cory and McKnight (2005). The full sample set was not analyzed due to logistical constraints. The FI (McKnight et al., 2001; Cory and McKnight, 2005) was calculated as an indicator of the DOM contribution from phototrophic microbes on a scale of 1.3 (terrestrial source) to 1.9 (microbial source). The Parallel Factor Analysis Model (PARAFAC) model developed by Cory and McKnight (2005) was used to quantify the loading and relative distribution of components. Although the samples span lakes and reservoirs from both mountains and plains across the state of Colorado, this individual regional dataset is not subjected to the accuracy and sensitivity limitations of PARAFAC analysis models of diverse samples that have been observed across large global datasets (Yu et al., 2015). The percent of the total fluorescence associated with protein-like components was calculated by summing the contributions of components 8 and 13. The distribution of quinone-like components was used to calculate the redox index (RI) as described by Miller et al. (2009). In surface water lakes, RI is a potential indicator for the extent of photobleaching of the humic fraction of the DOM, which is also related to the residence time of the DOM in the lakes. For example, Miller et al. (2009) showed that the RI n a high alpine lake in CO decreased throughout the summer as the residence time increased. Photobleaching also has the potential to reduce SUVA254 independent of the DOM source.
The formation of DBPs by chlorination of reservoir water was evaluated using the uniform formation conditions method (Summers et al., 1996), which provides a representative simulation of typical U.S. drinking water distribution systems. Samples were chlorinated with a sodium hypochlorite solution, adjusted to pH 8 with a borate buffer and incubated in the dark for 24 h (±1 h) at room temperature (20 ± 1.0°C). Chlorine doses were determined from demand studies to obtain a chlorine residual of 1.0 mg/L (±0.4 mg/L) after 24 h. Chlorine residuals were measured with the N,N-diethyl-p-phenylenediamine, or DPD colorimetric method, Standard Method 4500-Cl G (Standard Methods 1998) and were quenched with ammonium chloride. The four regulated TTHMs (EPA Method 551.1) and the five regulated haloacetic acids (EPA Method 552.2) were measured by gas chromatography with an electron capture detector.
Statistical Analyses
All analyses were based on data from the synoptic survey of lakes (Table 1) and were conducted using R v3.5.1 (R Core Team 2018). Pairwise relationships were assessed using simple linear regression based on ggplot2::smooth, and plots include a confidence interval that represents the standard error of the predicted value (Wickham 2016). The analysis of models for DBP efficiency that included the natural log of the DOC concentration and DOM quality indices is shown in Table 2. The models were evaluated based on the difference between the AICC for the model with the lowest AICC and the AICc for that model, referred to as deltaAIC (Burnham and Anderson, 2004).
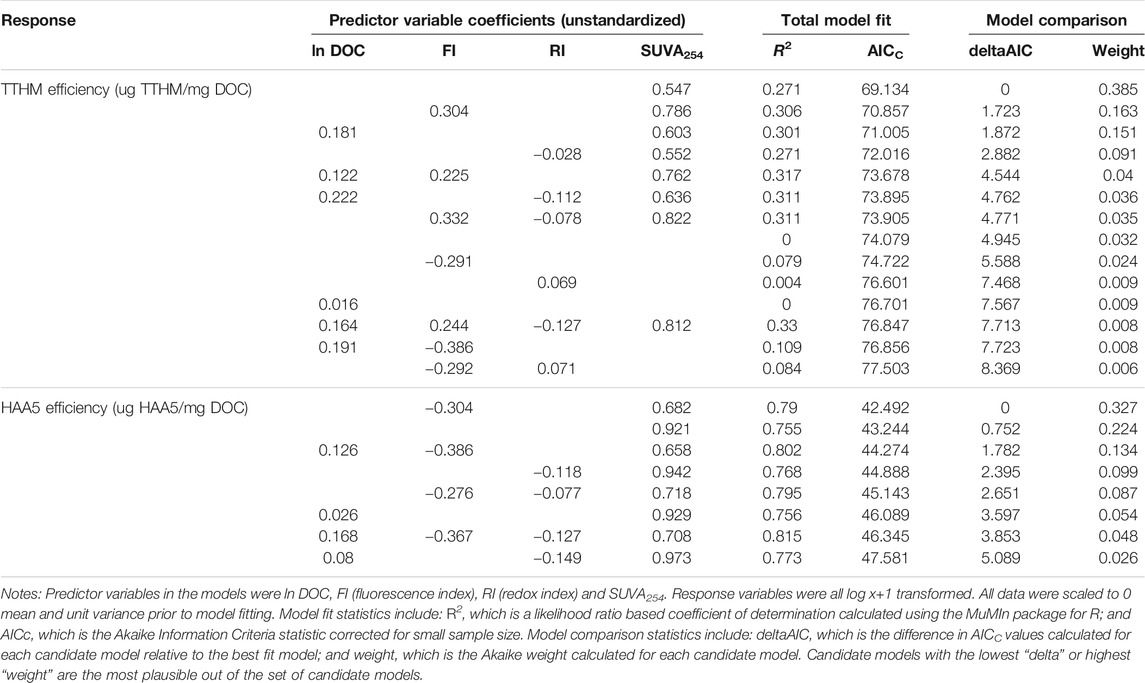
TABLE 2. Model comparison results for linear models predicting TTHM and HAA5 yield efficiency (µg DBP/mg DOC).
We explored linear models explaining variation in DBP yield efficiency (ug DBP/mg DOC) each for TTHMs or HAA5s. We used the MuMIn package (Bartoń, 2018) for R to compare all possible candidate models using AICC scores to evaluate the plausibility of each model (Burnham and Anderson, 2004). The global model in the analysis was y ∼ FI + RI + SUVA254 + ln (DOC +1), where y is the ln (x+1) transformed yield efficiency of the DBP of interest, FI is fluorescence index, RI is redox index, SUVA254 is Specific UV Absorbance at 254 nm, and DOC is mg L−1 dissolved organic carbon. All predictor variables were centered to a mean of 0 and standardized to unit variance. When global models were assessed, all predictor variables had a variance inflation factor <3, indicating the predictor variables included in the analysis were not multicolinear. During the model comparison analysis, we considered the global model as well as all possible combinations of predictor variables and a null model where the only predictor was the global mean of the data. We report unstandardized model coefficients because all data in the models have been centered and scaled. Only models with a delta AICC < 10 were considered in the final model comparison results. For each analysis, all lakes/sites were used for which the necessary data were available. In all cases, there was good representation (in terms of replicated observations) across the variables being assessed. Each model analysis compared candidate models against null models using AICc values, which provides a method to evaluate if/when a fixed effect is more likely, given the data, than the null hypothesis. Our sample sizes were sufficient to detect statistically significant effects given our results.
Results
Nutrients, Phytoplankton and DOM Concentrations Among 30 Colorado Reservoirs
The nutrient concentrations in the reservoirs studied encompassed a broad range (0.16–1.98 mg/L TN) (Table 3). TP to TN molar ratios are compared to the 16:1 N:P Redfield ratio and the 23:1 Wetzel (2001) ratio that is considered to be an indicator of severe P limitation (Figure 2). Furthermore, higher total inorganic nitrogen (TIN) concentrations were associated with greater algal biomass as measured by Chl-a concentrations (Figure 3), with the strongest log-log relationship being between NH4+ and Chl-a.
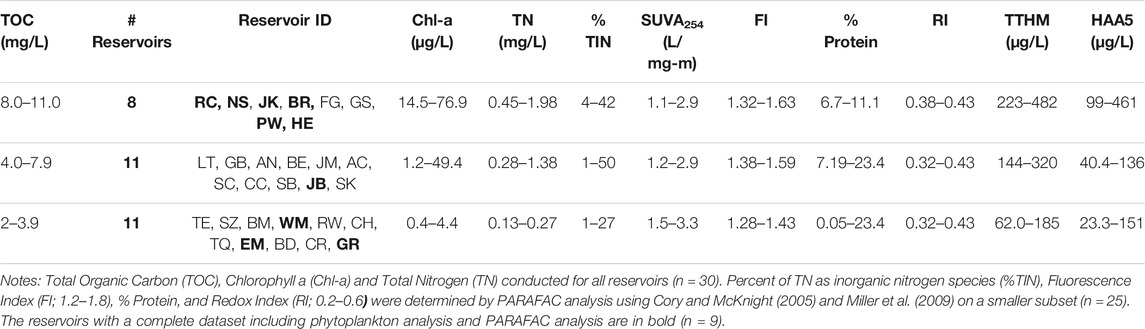
TABLE 3. Reservoir Water Quality Data summary organized by TOC concentration.
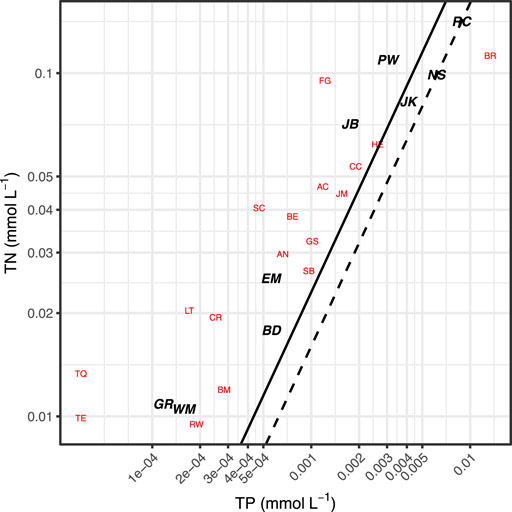
FIGURE 2. Reservoir total N and total P molar concentrations. Solid line indicates a 23:1 N:P ratio, the dashed line indicates a 16:1 N:P ratio (Redfield ratio). N:P ratios >23:1 are considered P limiting (Wetzel, 2001). Labels correspond with lake IDs. Reservoirs with complete data sets are bold and in black, lakes without complete data sets (e.g., missing DOC quality data or FlowCAM counts) are in red.
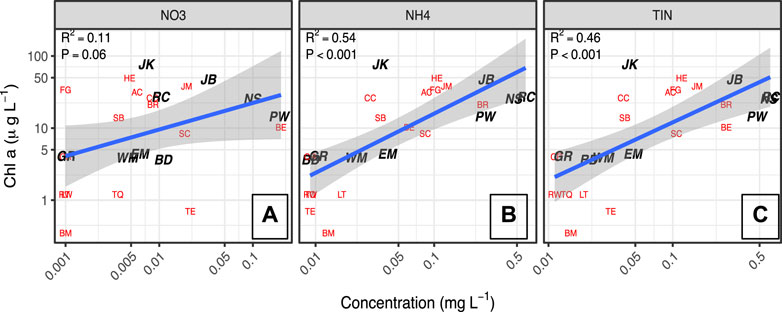
FIGURE 3. Log Chl-a concentrations as a function of log concentrations of NO3−, NH4+, and total inorganic N. Labels correspond with reservoir IDs. Lakes with complete data sets are bold and in black, lakes without complete data sets (e.g., missing DOC quality data or FlowCAM counts) are in red.
The characterization of the phytoplankton community composition was applied for a subset of 14 reservoirs. Filamentous cyanobacteria dominated the %Biovolume of phytoplankton species in five of the eight mountain reservoirs and in five of the six plains reservoirs (Figure 4). A representative FlowCam® image of filamentous cyanobacteria from Prewitt Reservoir (Supplementary Figure 1) shows the presence of distinctive heterocysts. The greatest frequency of heterocysts for the filamentous cyanobacteria were observed in a mountain reservoir, Grand Lake (GR), with about 28% of the imaged filaments containing one or two heterocysts. The total nutrient concentrations in Grand Lake are at the low end of the range in this data set (Figure 2). In the three plains reservoirs for which heterocysts observed, Jumbo Reservoir (JB), Jackson Reservoir (JR), and Prewitt Reservoir (PW), the frequency ranged from 6-8% of the imaged filaments containing heterocysts. These three reservoirs are at the high end of the range for total nutrients (Figure 2).
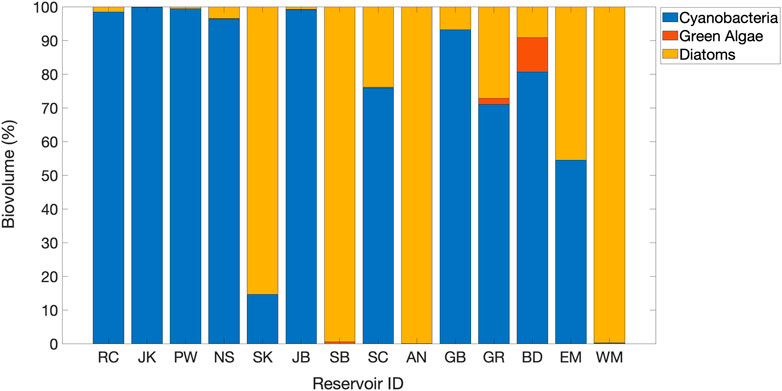
FIGURE 4. Distribution of phytoplankton Biovolume % of 14 reservoirs identified by the FlowCAM. Reservoirs are arranged from highest TOC (11.5 mg/L) on the left to lowest TOC (2.5 mg/L) on the right. RC, SK SB, SC, AN GB, GR and EM are mountain reservoirs. JK, PW, NS, JB, BD and WM are plains reservoirs.
The TOC concentrations in the 30 reservoirs ranged from a high value of 11.5 mg C/L to a low value of 2.1 mg C/L, and a strong positive log-linear relationship was found between Chl-a concentrations and TOC concentrations (Figure 5). To consider the details of this relationship in the context of DBP formation, the 30 reservoirs were grouped by TOC range, high (>8.1 mg/L, moderate (4.1–8.0 mg/L), and low (≤4.0 mg C/L) (Table 3).
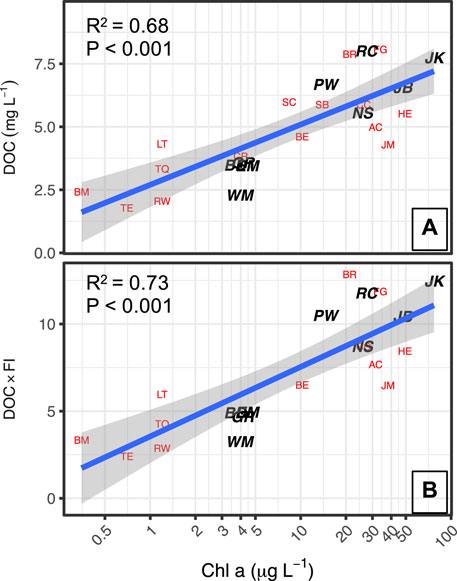
FIGURE 5. A) DOC plotted against log Chl-a concentrations. B) DOC weighted by FI plotted against log Chl-a concentrations. CR, SB and SC are in panel A and not panel B because they are among the subset missing FI analysis.
Influence of Phytoplankton Growth on DOM Quality and DBP Formation
As noted by Saunders et al. (2015), characterization of DOM chemical quality using spectroscopic indices provides complementary data for evaluating the underlying processes that yield the relationships found between nutrients, phytoplankton and TOC concentrations. The SUVA254 values of the 30 reservoirs ranged from 1.1 to 3.3 L/mg-m (Table 3). The fluorescence index (FI) ranged from 1.28 to 1.63, encompassing the range generally found in surface waters, with higher values corresponding to DOM derived from phytoplankton, such as microbes and algae. Figure 6 shows that FI was strongly positively correlated in a log-linear relationship (r2 = 0.63) with Chl-a, and that the reservoirs with the high FI values (>1.50) generally had low SUVA254 values (<2.0 L/mg-m: JM, AC, NS, HE, PW, JK, JB, BR) and all of these were plains reservoirs. Further, when the FI was used as a multiplicative factor for TOC concentration to increase the weight of algal-derived DOM, the strength of the log-linear relationship with Chl-a concentration increased slightly (Figure 5B). The relationship of SUVA254 to the N:P ratio was somewhat weaker (r2 = 0.26) than the relationship for FI (r2 = 0.33). The relationship of FI to the log of the N:P ratio was also significant, but not as strong as the relationship with Chl-a. The plains reservoirs which had the highest FI values also had low N:P ratios, below the 23:1 threshold, and were associated with high TN. The high FI, low SUVA254, high nutrients and relatively low N:P are consistent with wastewater influence common to all of these reservoirs.
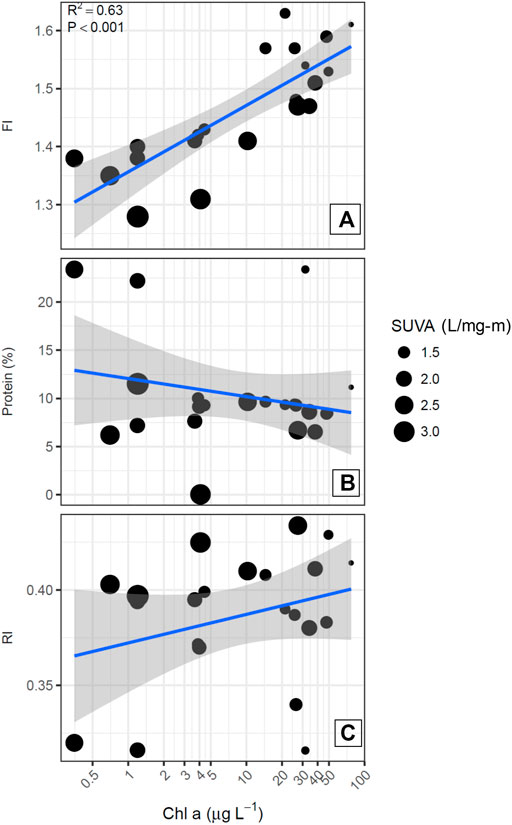
FIGURE 6. DOM quality metrics plotted as a function of log Chl-a concentrations. Point size corresponds with SUVA254 value.
Other characteristics of the fluorescence spectra that were quantified using the Cory and McKnight (2005) model did not show significant relationships with Chl-a or N:P ratios (Figures 6, 7). In particular, the percent of the fluorescence intensity accounted for by protein-like fluorescence had a broad range from 23% to very low values, with high values occurring for reservoirs along the full range of Chl-a concentrations and SUVA254 values. Therefore, because %protein had a similar pattern to the RI (Figure 7), and represents a smaller portion of the EEM, which could be subject to more error than the RI, we included RI as a candidate predictor for DBP yield efficiency, but not %protein.
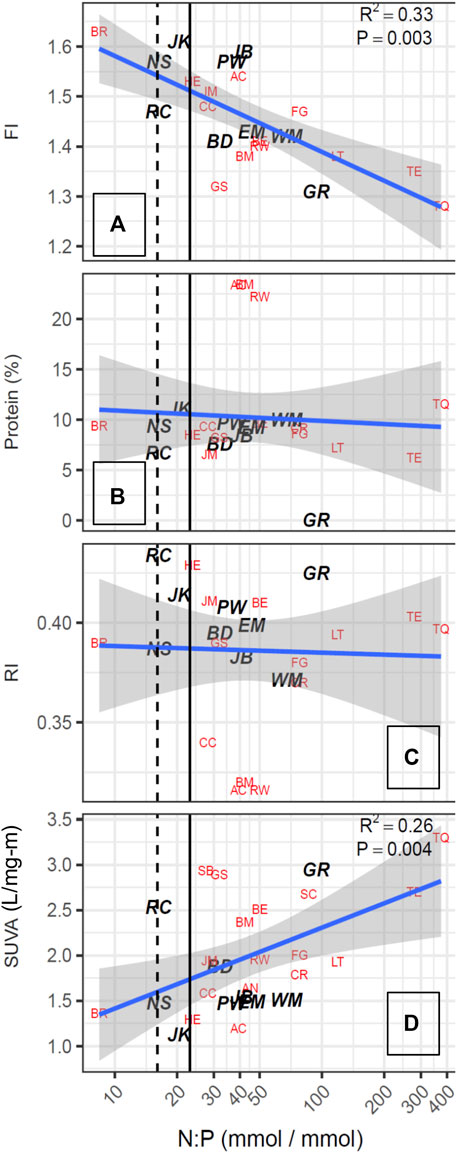
FIGURE 7. DOM quality metrics plotted as a function of atomic N:P ratios. Dashed line indicates 16:1 (Redfield ratio), solid line indicates 23:1. N:P ratios >23:1 are considered P limiting.
As expected, the highest formation of the two regulated organic DPBs, TTHMs and HAA5s occurred in the reservoirs with high TOC concentrations comprised predominantly of plains reservoirs (Table 3). However, it should be noted that increased HAA5 formation occurred in a wide range of TOC concentrations, overlapping across low, moderate and high TOC groups. Whereas, for TTHM formation, the range in the low TOC group of reservoirs (2–4 mgC/L) comprised predominantly of mountain reservoirs did not overlap with the range in the high TOC group (8–11 mgC/L).
The models for predicting TTHM and HAA5 yield efficiency differed in level for explaining variation and in the influence of spectral characteristics of the DOM (Table 2). None of the plausible models for TTHM or HAA5 based on a deltaAIC of less than five included only lnDOC; however, three of the seven plausible models for HAA5 did include a positive influence of ln DOC. For TTHM efficiency, there were seven plausible models and the null model was marginally plausible with a deltaAIC of 4.945. The model which included only SUVA254 had the lowest AICC value, but had a low level for explaining variation (r2 = 0.271). Furthermore, all of the other six plausible models also included SUVA254. as a predictor variable with a positive influence, and had a low level for explaining variation. Addition of FI as a predictor variable yielded the model with the lowest deltaAIC and had a positive influence of FI.
For HAA5 efficiency there were also seven plausible models and one that was marginally plausible. All models included a positive influence of SUVA254 and had high levels of explaining variation, with r2 ranging from 0.79 to 0.815. The null model was not plausible at all. The model with the lowest AICc for HAA5 efficiency included a negative influence by FI.
Discussion
Nutrients, Phytoplankton and DOM Concentrations Among 30 Colorado Reservoirs
Most the lakes and reservoirs studied had TN:TP ratios exceeding 23, indicating that P deficiency predominated during the mid-summer sampling campaign. In general, as TN and TP concentrations increased, the ratios decreased consistent with expectations for anthropogenic nutrient loading. For example, Barr Lake, which receives treated wastewater and urban runoff from the Denver area, was the only lake with a N:P ratio that indicated N deficiency (Figure 2); Barr Lake also had high TN (1.6 mg/L) and Chl-a (21.2 μg/L).
Road Canyon Reservoir was the only mountain reservoir among the eight reservoirs in the high TOC range (8.1 mgC/L to 11.5 mgC/L). The plains reservoirs in this group were Barr, Fruitgrowers, Henry, Jackson, Milton-Greeley Seaman, North Sterling, and Prewitt Reservoirs. This high TOC group also contained some of the highest concentrations of Chl-a (43.5 μg/L) and TN (2.0 mg/L), along with higher percentages of total inorganic nitrogen (%TIN). Road Canyon Reservoir had both high TN (2.0 mg/L) and TP (0.27 mg/L) values. Except for Barr Lake, the other reservoirs had N:P ratios close to or above the N:P ratio of 23 indicating P limitation. The three reservoirs with complete datasets in this group (Jackson, Prewitt and Road Canyon) all had phytoplankton communities dominated by filamentous cyanobacteria.
The 11 reservoirs with moderate TOC concentrations (4.1 mgC/L–7.99 mgC/L) included roughly the same number of mountain reservoirs (5) and plains reservoirs (6). Several of these reservoirs had low Chl-a concentrations, and all had TN:TP ratios indicating P limitation. Diatoms were dominant in three mountain reservoirs (Antero, Skaguay and Steamboat Reservoirs), and filamentous cyanobacteria were dominant in two mountain reservoirs (Granby Lake, and Stagecoach Reservoir) and one in the plains (Jumbo Reservoir). It is also notable that the phytoplankton community was dominated by filamentous cyanobacteria, which commonly thrive in warm lakes in the summer (Goldman and Horne, 1983), for 8 of the 11 reservoirs in the high and moderate TOC groups for which the phytoplankton community was characterized.
The group of 11 reservoirs with TOC concentrations between two and 4 mgC/L all still exceeded the lower limit for TOC removal prior to chlorination (2 mgC/L). This set included seven mountain reservoirs and 4 in the plains. These reservoirs generally had lower Chl-a concentrations (average 1.8 μg/L ± 1.3 μg/L), and also had lower TN (average 0.3 ± 0.2 mg/L) and lower %TIN. Filamentous cyanobacteria and diatoms were both abundant in the two mountain reservoirs for which the phytoplankton were characterized (Elevenmile Reservoir and Grand Lake), with the abundance of cyanobacterial filaments containing heterocysts in grand lake suggesting the possibility for nitrogen fixation occurring. In contrast, filamentous cyanobacteria dominated in one plains reservoir (Boulder Reservoir), and diatoms dominated in the other (Westminster Reservoir).
Influence of Phytoplankton Growth on DOM Quality and DBP Formation
Given the evidence for high TOC concentrations being an outcome of TOC production by summer phytoplankton blooms, the findings of the highest formation of the two regulated organic DPBs, TTHMs and HAA5s, occurring in reservoirs with high TOC concentrations is generally consistent with findings of Saunders et al. (2015). In particular, the results in Table 3 indicate that controlling nutrient loadings that promote such blooms will limit the likelihood of excessive TTHM formation at drinking water treatment facilities.
A further question is whether or not the influence of algal production on DOM quality results in a change of the efficiency of DBP formation from DOM. All the plausible models for TTHM and HAA5 efficiency included a positive influence of SUVA254, and the models for HAA5 efficiency had high levels of explaining variation compared to models for TTHM efficiency. The inclusion of FI contributed to the level of explaining variation for both TTHM and HAA5 efficiency, however with opposing influences. Because photobleaching and other processes occurring in the water column of the reservoir may have a greater influence on compared to FI, here may be value in including FI as an additional spectral property for some reservoirs used for water supply.
It is notable that three plausible models for HAA5 efficiency included a positive influence of lnDOC. Other influences on DOM quality beyond algal growth, such as wastewater inputs, may not be directly reflected in FI or SUVA254. Thus, this finding may reflect the influences of other DOM sources in contributing to greater DBP formation efficiency. Nonetheless, the results of this analysis with a broad range of reservoirs strongly support the finding of Saunders et al. (2015) that SUVA254 is a highly valuable predictor of DBP formation efficiency.
Implications for Drinking Water Management
Overall, the strong relationships between Chl-a, N:P and FI provides additional support to the interpretation that nutrient loading is a driver for high TOC concentrations by increasing phytoplankton productivity in these reservoirs. Further, the stronger relationships for FI compared with SUVA254 suggest that fluorescence measurements may be useful complementary measurements to SUVA254 for establishing the contribution of phytoplankton growth to DOM production for some drinking water supply reservoirs.
In general, the reservoirs in the low TOC group were predomiantly located in the mountains and conversely the high TOC group was composed of plains reservoirs with one exception. Given the broad range of reservoirs and conditions represented in this study, we expect that these results will be useful for comparison to other regions that have both mountain and plains lakes, especially since monitoring and treating freshwater HABs is an increasingly important issue in the global drinking water supply (e.g. Backer et al., 2015; Schmale et al., 2019; Glibert, 2020). However, it should be noted that other regions may have different regional factors such as climate, altitude and precipitation patterns that may influence local water quality and treatment, warranting further investigation. As mentioned earlier, in Spring 2012, the Colorado Water Quality Control Commission adopted new regulations based on the results of this study (excluding phytoplankton analysis). As part of this plan, a Chl-a criterion is now available for protecting water supplies classified as Direct Use Water Supply Reservoirs (Colorado Water Quality Control Commission, 2013). The additional DOM optical characterization and phytoplankton identification suggests that monitoring algal species, and specifically filamentous Cyanobacteria, may provide useful ancillary information for understanding the drivers of high DOM concentrations during the summer.
There is a potential for watershed management to control the sources of excess nutrients to water supply reservoirs, which can include agricultural runoff, leakage from residential septic systems and upstream wastewater treatment effluent, augmented by atmospheric deposition of nitrogen. Therefore, prevention of elevated TOC levels through pre-treatment by management of nutrients in source waters could be more efficient and cost effective for drinking water utilities than removal of TOC that exceed standards. The results further suggest that watershed management could provide further benefits of limiting blooms of filamentous Cyanobacteria, which have the potential to develop into toxic blooms.
Furthermore, longer periods of ice-free conditions in spring and summer may cause greater light levels to support algal growth. Similarly, warmer lake temperatures could help promote the growing season for filamentous Cyanobacteria, which were commonly associated with DOM derived from microbial phototrophs. As a result, these findings may help future drinking water utilities plan and adapt to earlier lake cover ice out as a result of a changing climate (Sharma and Magnuson, 2014). Additionally, drought years, which result in a smaller snowpack, may increase the need for reservoir storage. Therefore, improved understanding of how dominant phytoplankton species and algal-derived DOM impact the formation of DBPs could help provide targeted approaches for water utilities in maintaining storage water quality in a changing climate.
Data Availability Statement
The original contributions presented in the study are included in the article/Supplementary Material, further inquiries can be directed to the corresponding author.
Author Contributions
AK and AH conducted sample analysis. ES conducted statistical analysis. DM provided advising. All authors contributed to writing and editing of the manuscript.
Funding
The authors acknoweldge the NSF’s Niwot Ridge LTER Program (DEB-0423662), Critical Zone Observatory project (EAR-0724960), and the Colorado Water Research Institute for a Student Research Grant which funded the phytoplankton analysis. Data collection and analysis was supported in part by set-aside funds from the Safe Drinking Water Program of the Colorado Department of Public Health and Environment (CDPHE).
Conflict of Interest
ES was employed by Battelle, National Ecological Observatory Network.
The authors declare that the research was conducted in the absence of any commercial or financial relationships that could be construed as a potential conflict of interest.
Publisher’s Note
All claims expressed in this article are solely those of the authors and do not necessarily represent those of their affiliated organizations, or those of the publisher, the editors and the reviewers. Any product that may be evaluated in this article, or claim that may be made by its manufacturer, is not guaranteed or endorsed by the publisher.
Acknowledgments
The authors also thank S. Crisp and M. Sanclements for help with sample and data analysis, as well as the Kiowa Laboratory at INSTAAR for sample analysis. Additionally, the authors thank Rebecca Anthony, Maggie Pierce, and Nicole Graziano from CDPHE for assistance with project logistics; Dorothy Noble and Caitlin Glover at the University of Colorado-Boulder for DBP analysis; Carleigh Samson and Cary Ellmers for logistical support and help with handling samples. Lastly, special thanks go to the water utilities that participated in the sampling.
Supplementary Material
The Supplementary Material for this article can be found online at: https://www.frontiersin.org/articles/10.3389/fenvs.2021.673627/full#supplementary-material
References
Backer, L., Manassaram-Baptiste, D., LePrell, R., and Bolton, B. (2015). Cyanobacteria and Algae Blooms: Review of Health and Environmental Data from the Harmful Algal Bloom-Related Illness Surveillance System (HABISS) 2007-2011. Toxins. 7 (4), 1048–1064. doi:10.3390/toxins7041048
Bartoń, K. (2018). MuMIn: Multi-Model Inference. R package version 1.42.1. Available at: https://CRAN.R-project.org/package=MuMIn.
Beggs, K. M. H., Billica, J. A., Korak, J. A., Rosario-Ortiz, F. L., McKnight, D. M., and Summers, R. S. (2013). Spectral Evaluation of Watershed DOM and DBP Precursors. J. - Am. Water Works Assoc. 105 (4), E173–E188. doi:10.5942/jawwa.2013.105.0063
Beggs, K. M. H., Summers, R. S., and McKnight, D. M. (2009). Characterizing Chlorine Oxidation of Dissolved Organic Matter and Disinfection By-Product Formation with Fluorescence Spectroscopy and Parallel Factor Analysis. J. Geophys. Res. 114 (G4), G04001. doi:10.1029/2009JG001009
Burnham, K. P., and Anderson, D. R. (2004). Multimodel Inference. Sociological Methods Res. 33, 261–304. doi:10.1177/0049124104268644
Callinan, C. W., Hassett, J. P., Hyde, J. B., Entringer, R. A., and Klake, R. K. (2013). Proposed Nutrient Criteria for Water Supply Lakes and Reservoirs. J. Am. Water Works Assoc. 105 (4), E157–E172. doi:10.5942/jawwa.2013.105.0034
Colorado Water Quality Control Commission (2013). Colorado’s Nutrients Rules and Implementation Status. Available at: http://www.colorado.gov/cs/Satellite?blobcol=urldata&blobheadername1=Content-Disposition&blobheadername2=Content-Type&blobheadervalue1=inline%3B+filename%3D%22summary+.pdf%22&blobheadervalue2=application%2Fpdf&blobkey=id&blobtable=MungoBlobs&blobwhere=1251851108194&ssbinary=true (Accessed April 30, 2019).
Cory, R. M., and McKnight, D. M. (2005). Fluorescence Spectroscopy Reveals Ubiquitous Presence of Oxidized and Reduced Quinones in Dissolved Organic Matter. Environ. Sci. Technol. 39 (21), 8142–8149. doi:10.1021/es0506962Available at: http://www.ncbi.nlm.nih.gov/pubmed/16294847.
De Wit, H. A., Valinia, S., Weyhenmeyer, G. A., Futter, M. N., Kortelainen, P., Austnes, K., et al. (2016). Current Browning of Surface Waters Will Be Further Promoted by Wetter Climate. Environ. Sci. Techn. Lett. 3 (12), 430–435. doi:10.1021/acs.estlett.6b00396
Del Giudice, D., Zhou, Y., Sinha, E., and Michalak, A. M. (2018). Long-term Phosphorus Loading and Springtime Temperatures Explain Interannual Variability of Hypoxia in a Large Temperate lake. Environ. Sci. Technol. 52 (4), 2046–2054. doi:10.1021/acs.est.7b04730
Erlandsson, M., Buffam, I., Fölster, J., Laudon, H., Temnerud, J., Weyhenmeyer, G. a., et al. (2008). Thirty-five Years of Synchrony in the Organic Matter Concentrations of Swedish Rivers Explained by Variation in Flow and Sulphate. Glob. Change Biol. 14 (5), 1191–1198. doi:10.1111/j.1365-2486.2008.01551.x
Fang, J., Yang, X., Ma, J., Shang, C., and Zhao, Q. (2010). Characterization of Algal Organic Matter and Formation of DBPs from Chlor(am)ination. Water Res. 44 (20), 5897–5906. doi:10.1016/j.watres.2010.07.0010.1016/j.watres.2010.07.009
Foreman, K., Vacs Renwick, D., McCabe, M., Cadwallader, A., Holsinger, H., Kormondy, C., et al. (2021). Effects of Harmful Algal Blooms on Regulated Disinfection Byproducts: Findings from Five Utility Case Studies. AWWA Water Sci. 3 (3), e1223. doi:10.1002/aws2.1223
Glibert, P. M. (2020). From Hogs to HABs: Impacts of Industrial Farming in the US on Nitrogen and Phosphorus and Greenhouse Gas Pollution. Biogeochemistry. 10, 1–42. doi:10.1007/s10533-020-00691-6
Golea, D. M., Upton, A., Jarvis, P., Moore, G., Sutherland, S., Parsons, S. A., et al. (2017). THM and HAA Formation from NOM in Raw and Treated Surface Waters. Water Res. 112, 226–235. doi:10.1016/j.watres.2017.01.051
Gonsior, M., Powers, L. C., Williams, E., Place, A., Chen, F., Ruf, A., et al. (2019). The Chemodiversity of Algal Dissolved Organic Matter from Lysed Microcystis Aeruginosa Cells and its Ability to Form Disinfection By-Products during Chlorination. Water Res. 155, 300–309. doi:10.1016/j.watres.2019.02.030
Greenstein, K. E., and Wert, E. C. (2019). Using Rapid Quantification of Adenosine Triphosphate (ATP) as an Indicator for Early Detection and Treatment of Cyanobacterial Blooms. Water Res. 154, 171–179. doi:10.1016/j.watres.2019.02.005
Ho, J. C., and Michalak, A. M. (2017). Phytoplankton Blooms in Lake Erie Impacted by Both Long-Term and Springtime Phosphorus Loading. J. Great Lakes Res. 43 (3), 221–228. doi:10.1016/j.jglr.2017.04.001
Hua, L. C., Chao, S. J., and Huang, C. (2019). Fluorescent and Molecular Weight Dependence of THM and HAA Formation from Intracellular Algogenic Organic Matter (IOM). Water Res. 148, 231–238. doi:10.1016/j.watres.2018.10.051
Huang, J., Graham, N., Templeton, M. R., Zhang, Y., Collins, C., and Nieuwenhuijsen, M. (2009). A Comparison of the Role of Two Blue-green Algae in THM and HAA Formation. Water Res. 43 (12), 3009–3018. doi:10.1016/j.watres.2009.04.029
Jaffé, R., McKnight, D., Maie, N., Cori, R., McDowell, W. H., and Campbell, J. L. (2008). Spatial and Temporal Variations in DOM Composition in Ecosystems: The Importance of Long-Term Monitoring of Optical Properties. J. Geophys. Res. 113, G04032. doi:10.1029/2008JG000683
Khan, S., Zamyadi, A., Rao, N. R. H., Li, X., Stuetz, R. M., and Henderson, R. K. (2019). Fluorescence Spectroscopic Characterization of Algal Organic Matter: Towards Improved: In Situ Fluorometer Development. Environ. Sci. Water Res. Techn. 5 (2), 417–432. doi:10.1039/c8ew00731d
Kraus, T. E. C., Bergamaschi, B. a., Hernes, P. J., Doctor, D., Kendall, C., Downing, B. D., et al. (2011). How Reservoirs Alter Drinking Water Quality: Organic Matter Sources, Sinks, and Transformations. Lake Reservoir Manage. 27 (3), 205–219. doi:10.1080/07438141.2011.597283
Lavonen, E. E., Gonsior, M., Tranvik, L. J., Schmitt-Kopplin, P., and Köhler, S. J. (2013). Selective Chlorination of Natural Organic Matter: Identification of Previously Unknown Disinfection Byproducts. Environ. Sci. Techn. 47 (5), 2264–2271. doi:10.1021/es304669p
Magnuson, J. J., Webster, K. E., Assel, Y. R. A., Bowser, C. J., Dillon, P. J., Eaton, J. G., et al. (1997). POTENTIAL EFFECTS OF CLIMATE CHANGES ON AQUATIC SYSTEMS: LAURENTIAN GREAT LAKES AND PRECAMBRIAN SHIELD REGION. Wiley Online Library. 11, 825-871. doi:10.1002/(sici)1099-1085(19970630)11:8<825::aid-hyp509>3.0.co;2-g
McKnight, D. M., Boyer, E. W., Westerhoff, P. K., Doran, P. T., Kulbe, T., and Andersen, D. T. (2001). Spectrofluorometric Characterization of Dissolved Organic Matter for Indication of Precursor Organic Material and Aromaticity. Limnol. Oceanogr. 46 (1), 38–48. doi:10.4319/lo.2001.46.1.0038
Meyer-Jacob, C., Tolu, J., Bigler, C., Yang, H., and Bindler, R. (2015). Early Land Use and Centennial Scale Changes in lake-water Organic Carbon Prior to Contemporary Monitoring. Proc. Natl. Acad. Sci. USA. 112 (21), 6579–6584. doi:10.1073/pnas.1501505112
Miller, M. P., McKnight, D. M., Chapra, S. C., and Williams, M. W. (2009). A Model of Degradation and Production of Three Pools of Dissolved Organic Matter in an alpine lake. Limnol. Oceanogr. 54 (6), 2213–2227. doi:10.4319/lo.2009.54.6.2213
Monteith, D. T., Stoddard, J. L., Evans, C. D., de Wit, H. A., Forsius, M., Høgåsen, T., et al. (2007). Dissolved Organic Carbon Trends Resulting from Changes in Atmospheric Deposition Chemistry. Nature 450, 537–539. doi:10.1038/nature06316
O’Beirn, , Oulehle, F., and Hruska, J. (2009). Rising Trends of Dissolved Organic Matter in Drinking-Water Reservoirs as a Result of Recovery from Acidification in the Ore Mts., Czech Republic. Environ. Pollut. (Barking, Essex: 1987). 157 (12), 3433–3439. doi:10.1016/j.envpol.2009.06.020
Oulehle, F., and Hruska, J. (2009). Rising Trends of Dissolved Organic Matter in Drinking-Water Reservoirs as a Result of Recovery from Acidification in the Ore Mts., Czech Republic. Environ. Pollut. 157, 3433–3439. doi:10.1016/j.envpol.2009.06.020
Paerl, H. W., and Scott, J. T. (2010). Throwing Fuel on the Fire: Synergistic Effects of Excessive Nitrogen Inputs and Global Warming on Harmful Algal Blooms, Environ. Sci. Technol. 44, 7756, 7758. doi:10.1021/es102665e
R Core Team (2018). R: A Language and Environment for Statistical Computing. Vienna, Austria: R Foundation for Statistical Computing.
Ritson, J. P., Graham, N. J. D., Templeton, M. R., Clark, J. M., Gough, R., and Freeman, C. (2014). The Impact of Climate Change on the Treatability of Dissolved Organic Matter (DOM) in upland Water Supplies: A UK Perspective. Sci. Total Environ. 473–474, 714–730. doi:10.1016/j.scitotenv.2013.12.095
Rosén, P. (2005). Total Organic Carbon (TOC) of Lake Water during the Holocene Inferred from Lake Sediments and Near-Infrared Spectroscopy (NIRS) in Eight Lakes from Northern Sweden. Biogeochemistry. 76, 503–516. doi:10.1007/s10533-005-8829-1
SanClements, M. D., Oelsner, G. P., McKnight, D. M., Stoddard, J. L., and Nelson, S. J. (2012). New Insights into the Source of Decadal Increases of Dissolved Organic Matter in Acid-Sensitive Lakes of the Northeastern United States. Environ. Sci. Technol. 46 (6), 3212–3219. doi:10.1021/es204321x
Saunders, J., Hohner, A., Summers, S., and Rosario-Ortiz, F. (2015). Regulating Chlorophyll a to Control DBP Precursors in Water Supply Reservoirs. Am. Water Work. Assoc. 2015, E603–E612. doi:10.5942/jawwa.2015.107.0153
Schmale, D. G., Ault, A. P., Saad, W., Scott, D. T., and Westrick, J. A. (2019). Perspectives on Harmful Algal Blooms (HABs) and the Cyberbiosecurity of Freshwater Systems. Front. Bioeng. Biotechnol. 7, 128. doi:10.3389/fbioe.2019.00128
Sharma, S., and Magnuson, J. J. (2014). Oscillatory Dynamics Do Not Mask Linear Trends in the Timing of Ice Breakup for Northern Hemisphere Lakes from 1855 to 2004. Climatic Change. 124 (4), 835–847. doi:10.1007/s10584-014-1125-0
Standard Methods (1998). Standard Methods for the Examination of Water and Wastewater, (20th ed.). APHA, AWWA, and WEF, Washington.
Strock, K. E., Theodore, N., Gawley, W. G., Ellsworth, A. C., and Saros, J. E. (2017). Increasing Dissolved Organic Carbon Concentrations in Northern Boreal Lakes: Implications for lake Water Transparency and thermal Structure. J. Geophys. Res. Biogeosci. 122, 1022–1035. doi:10.1002/2017JG003767
Summers, R. S., Hooper, S. M., Shukairy, H. M., Solarik, G., and Owen, D. (1996). Assessing DBP Yield: Uniform Formation Conditions. J. - Am. Water Works Assoc. 88 (6), 80–93. doi:10.1002/j.1551-8833.1996.tb06573.x
U.S. EPA (2006). National Primary Drinking Water Regulations: Long Term 2 Enhanced Surface Water Treatment Rule: Final Rule: 40 CFR Parts 9, 141 and 142. Washington, D.C.
Weishaar, J. L., Aiken, G. R., Bergamaschi, B. A., Fram, M. S., Fujii, R., and Mopper, K. (2003). Evaluation of Specific Ultraviolet Absorbance as an Indicator of the Chemical Composition and Reactivity of Dissolved Organic Carbon. Environ. Sci. Technol. 37 (20), 4702–4708. doi:10.1021/es030360x
Wert, E. C., and Rosario-Ortiz, F. L. (2013). Intracellular Organic Matter from Cyanobacteria as a Precursor for Carbonaceous and Nitrogenous Disinfection Byproducts. Environ. Sci. Technol. 47, 6332–6340. doi:10.1021/es400834k
Wetzel, R. G. (2001). Limnology: lake and River Ecosystems. 3rd Edition. San Diego: Academic Press, Elsevier.
Wetzel, R. G., and Likens, G. E. (2000). Composition and Biomass of Phytoplankton, in Limnological Analyses (New York, NY: Springer), 147–174.
Yang, X., Guo, W., and Shen, Q. (2011). Formation of Disinfection Byproducts from Chlor(am)ination of Algal Organic Matter. J. Hazard. Mater. 197, 378–388. doi:10.1016/j.jhazmat.2011.09.098
Yu, H., Liang, H., QuZheng-shuang, F. H., Han, Z.-s., Shao, S., Chang, H., et al. (2015). Impact of Dataset Diversity on Accuracy and Sensitivity of Parallel Factor Analysis Model of Dissolved Organic Matter Fluorescence Excitation-Emission Matrix. Sci. Rep. 5, 10207. doi:10.1038/srep10207
Zamyadi, A., Ho, L., Newcombe, G., Bustamante, H., and Prévost, M. (2012). Fate of Toxic Cyanobacterial Cells and Disinfection By-Products Formation after Chlorination. Water Res. 46 (5), 1524–1535. doi:10.1016/j.watres.2011.06.029
Keywords: DOM, DBPs, HABs, climate change, phytoplankton, reservoirs
Citation: Khan AL, Sokol ER, McKnight DM, Saunders JF, Hohner AK and Summers RS (2021) Phytoplankton Drivers of Dissolved Organic Material Production in Colorado Reservoirs and the Formation of Disinfection By-Products. Front. Environ. Sci. 9:673627. doi: 10.3389/fenvs.2021.673627
Received: 28 February 2021; Accepted: 27 June 2021;
Published: 30 July 2021.
Edited by:
Mauri Pelto, Nichols College, United StatesReviewed by:
YoonKyung Cha, University of Seoul, South KoreaRenata Panosso, Federal University of Rio Grande do Norte, Brazil
Copyright © 2021 Khan, Sokol, McKnight, Saunders, Hohner and Summers. This is an open-access article distributed under the terms of the Creative Commons Attribution License (CC BY). The use, distribution or reproduction in other forums is permitted, provided the original author(s) and the copyright owner(s) are credited and that the original publication in this journal is cited, in accordance with accepted academic practice. No use, distribution or reproduction is permitted which does not comply with these terms.
*Correspondence: Alia L. Khan, alia.khan@wwu.edu