Projection of the Precipitation Extremes in Thailand Under Climate Change Scenario RCP8.5
 Teerachai Amnuaylojaroen1,2,3*
- 1Department of Environmental Science, School of Energy and Environment, University of Phayao, Phayao, Thailand
- 2Atmospheric Pollution and Climate Change Research Unit, School of Energy and Environment, University of Phayao, Phayao, Thailand
- 3Atmospheric Environment Research Unit, University of Phayao, Phayao, Thailand
This study explores the predicted extreme precipitation during 2020–2029 in Thailand, using the output of the nested regional climate model (NRCM) with the Representative Concentration Pathway (RCP) 8.5 emission scenario. The research used five different extreme precipitation indices, i.e., annual precipitation total (PRCPTOT), the annual number of rainy days (RD), simple daily intensity index (SDII), consecutive dry days (CDDs), and consecutive wet days (CWD). The PRCTOT was generally located in eastern Thailand, with significant declining trends, while the increasing trend was found in northern Thailand. The quantity of the PRCPTOT varies marginally from 100 to 200 mm per decade. The annual RD was influenced mostly by the negative trends in Thailand. A remarkable trend is a rising of annual SDII, with major statistical increases ranging from 5 to 20%. A widespread decline in CWD was found in most regions. The statistically significant pattern of CWD has been geographically concentrated in the northern, southern, and eastern regions of Thailand. Southern Thailand continues to decline by −10 to −30%. A drastic decline has been observed in the south of Thailand. Projected interannual precipitation variability shows that December–January–February (DJF) variability will be greater than either annual or June–July–August (JJA) variability in most years, with the exception of 2022, 2025, and 2026, in which the JJA variability will be greater than both the annual variability and the DJF variability.
Introduction
Precipitation is an important factor in the hydrological cycle. It is one of the most important variables affecting life and human well-being because precipitation change can cause consequences to both the environment and the human society (Pielke and Downton, 2000; Trenberth et al., 2003; Barretta and Santos, 2014; Guan et al., 2014). During the last decades, it has become apparent that, during anthropogenic climate warming, the intensity and the frequency of extreme precipitation events increase, consecutively (Allan and Soden, 2008; Min et al., 2011; Coumou and Rahmstorf, 2012; Donat et al., 2013). Recently, the research focusing on extreme precipitation events has increased in the tropics and subtropics. For example, Endo et al. (2009) expressed that rainfall severity has increased over time. Goswami et al. found that, in the monsoon seasons from 1951 to 2000, the intensity and strength of the extremes in the precipitation events in India increased. An analysis of daily rainfall data across the Philippines between 1951 and 2010 demonstrated that the frequency and the severity of the extreme rainfall events substantially increased (Cinco et al., 2014). Also, the information from regional workshops shows that the patterns in precipitation extremes vary regionally and are not uniform across Southeast Asia to Arab regions (Choi et al., 2009; Caesar et al., 2011; Donat et al., 2014).
In Southeast Asia, the future of the precipitation extremes was pedicted using the output from CORDEX-SEA simulation with 25-km grid spacing under emission scenarios of RCP4.5 and 8.5 at the end of the twenty-first century. Their results indicate that changes in extreme indices are more pronounced and cover a wider area under RCP8.5 than RCP4.5, with the most significant change in consecutive dry days (CDD) (Tangang et al., 2020). However, in order to support decision-making in relation to agriculture, water resources, and disasters in the near future, the study of precipitation extremes, using the fine resolution of climate change output, is required. In this study, we used the output from the simulation of the nested regional climate model (NRCM) with 10-km grid spacing under climate change scenario RCP8.5 for input data in the precipitation extreme indices, including annual precipitation total (PRCPTOT), the annual number of rainy days (RD), simple daily intensity index (SDII), consecutive dry days (CWD), and CDD, for studying the precipitation extremes in Thailand during the period 2020–2029.
Materials and Methods
To analyze the precipitation extreme, the output from the simulation of the NRCM was used as input data in five extreme precipitation indices that were suggested by the World Meteorological Organization (WMO)–Commission for Climatology (WMO–CCI), the World Climate Research Programme (WCRP), The Climate and Ocean: Variability, Predictability and Change (CLIVAR), and The Expert Team on Climate Change Detection and Indices (ETCCDI) projects, namely, annual PRCPTOT, the annual RDs=, SDII, CDD, and CWD (Zhang et al., 2011).
General Information of Nested Regional Climate Model Configurations
The data used in the simulation of the NRCM are based on Amnuaylojaroen and Chanvichit, 2019 and Amnuaylojaroen et al., 2021. The output from the NRCM, with resolution of 10-km grid spacing under the RCP8.5 scenario, was used for both time periods of 1990–1999 and 2020–2029. The NRCM is based on the Weather Research and Forecasting (WRF) model and has been forced by the Community Climate System Model version 4 (CCSM4) for meteorological initial and boundary conditions (Gent et al., 2011; Done et al., 2013; Bruyère et al., 2017). In the model configuration, the interaction between land and ocean estimating oceanic parameters using the Price–Weller–Pinkel (PWP) model (Price et al., 1986). The PWP model is an oceanic mixing layer model that accounts for the oceanic mixing layer convection change and oceanic shear stability. It was created in the HYbrid Coordinate Ocean Model (HYCOM) (Chassignet et al., 2007) model for vertical mixing. Other model configurations were set up similar to the one set up by Amnuaylojaroen et al. (2018). The feedback and the evolution of the aerosol in the atmosphere were carried out through the Rapid Radiative Transfer Model for General Circulation (RRTMG). In this model, feedback is taken from aerosols on meteorological processes under the Thompson scheme (Thompson et al., 2004). Grell-3 and the Noah Land Surface Model were responsible for sub-grid scale calculation and the interaction between land and atmosphere in the model (Chen and Dudhia, 2001). Grid nudging was also applied precisely to provide large-scale meteorology (Stauffer and Seaman, 1990).
Performance of Nested Regional Climate Model
The good performance of the NRCM was shown by statistical analysis, i.e., index of agreement (IOA), mean bias (MB), SD, and R-square (R2), in a study by Amnuaylojaroen and Chanvichit (2019). The statistical calculations between the model data and the observed data (TMD, GPCP, and APHRODITE) are averaged over 1990–1999 from 44 station locations of TMD annually and for the rainy season and the dry season, as shown in Table 1. The model has a high ability to capture precipitation that is indicated by R-squared values, ranging from 0.94 to 0.97. Similar to R-squared, IOA values were in the range of 0.60–0.68 in the annual precipitation. In the dry season and in the rainy season, the modeled precipitation was underestimated as compared with observations with an MB ranging from – 3 to −2 mm. The SD of the residuals of the model is 2–3.
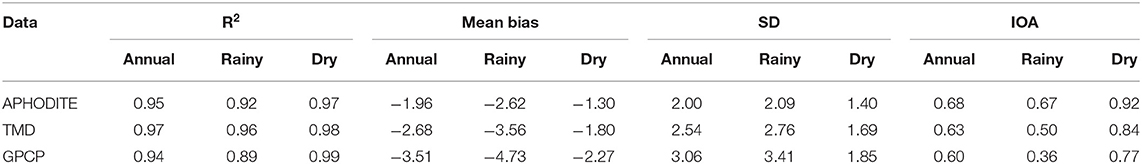
Table 1. Statistics comparing the modeled precipitation and observation [adapted from Amnuaylojaroen and Chanvichit (2019)].
Results and Discussion
The results of spatial distribution of the yearly PRCTOT showed that there were both wetting and drying patterns in Thailand during 2020–2029 (Figure 1A). The quantity of PRCPTOT slightly changes in the ranges of 100–200 mm per decade, as shown in Figure 2A. The annual RD (Figure 1B) affected most of Thailand with negative patterns. A remarkable pattern that is noticeable in Figure 1C is the domination of increasing annual SDII in Thailand, with significant statistical rises, ranging from 5 to 20%. The conclusion of this study reasonably indicates that the substantial rise in SDII across most of Thailand represents a decrease in RD instead of an increase in the overall rainfall. Indices of extreme precipitation events were analyzed, using CWD throughout Thailand. The analysis of indices indicates a widespread reduction of CWD in most areas. In the central, southern, and eastern regions of the country, the statistically significant trend of CWD was geographically localized. Southern Thailand continues to decrease by −10 to −30%. A dramatic decrease was found in the south of Thailand. Compared to CWD, CDD normally displayed the opposite signal (Figures 1D,E). The CDD showed a general drying trend, with statistically significant trends in two areas, including the eastern and southern regions of Thailand. Although the spatial distribution of increasing CDD pattern was robust in most of the country, no statistically significant regional relation was found. During the years 2020–2029, the plot of the probability density function of five indices (Figures 2A–E) will, in general, not be significantly different compared to the present day (1990–1999). For example, PRCPTOT, SDII, and CDD had smaller change; in contrast, there were some indices, such as RD (Figure 2B) and CWD (Figure 2E), that showed great difference compared to the present-day simulation. In Figure 2B, the substantial decreasing trends in annual RD varied from 10 to 20 days per decade. The annual RD decreased dramatically by 5–15% when considering the entirety of Thailand, while the CWD generally decreased in ranges of 2–4 days per decade.
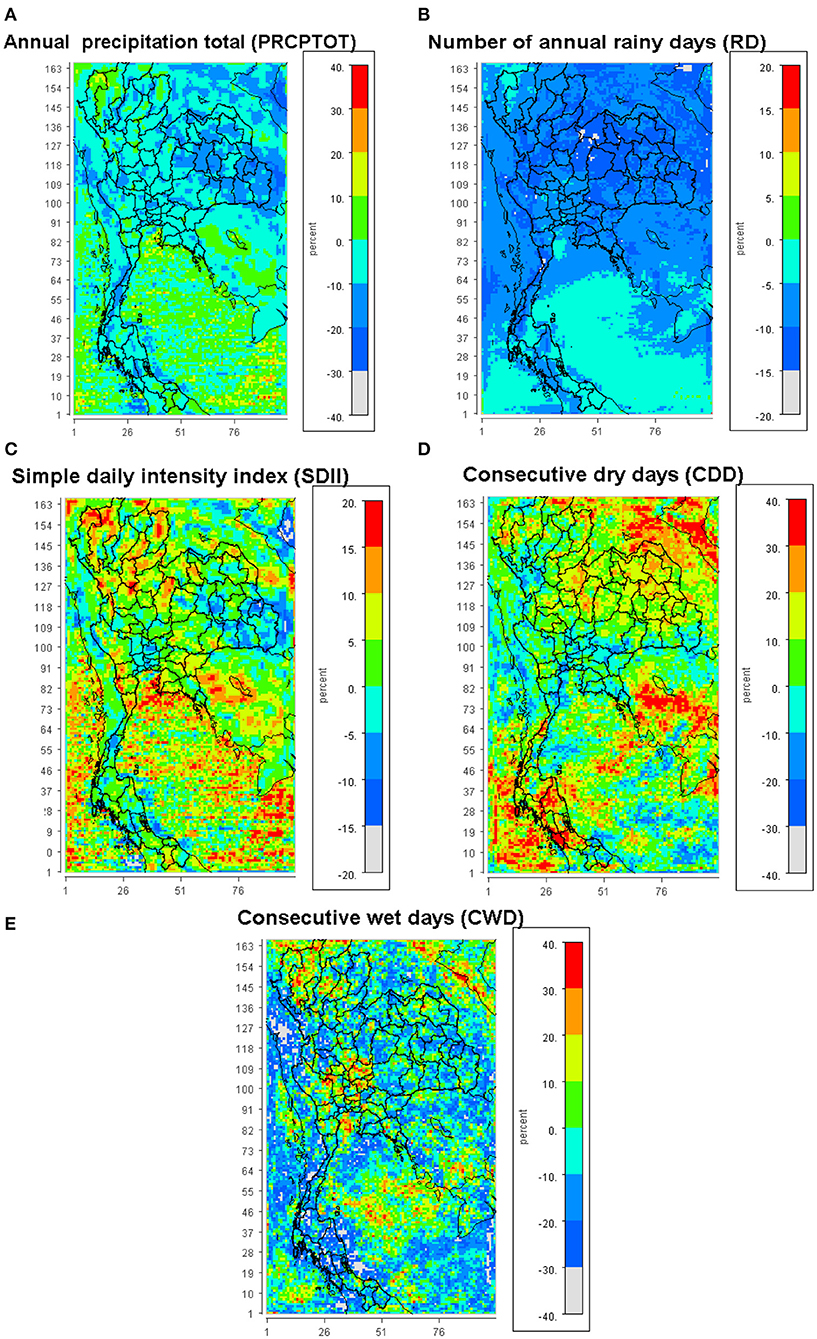
Figure 1. Spatial distribution of percentage differences in (A) PRCPTOT, (B) RD, (C) SDII, (D) CDD, and (E) CWD between years 2020 and 2029 and between years 1990 and 1999 in Thailand.
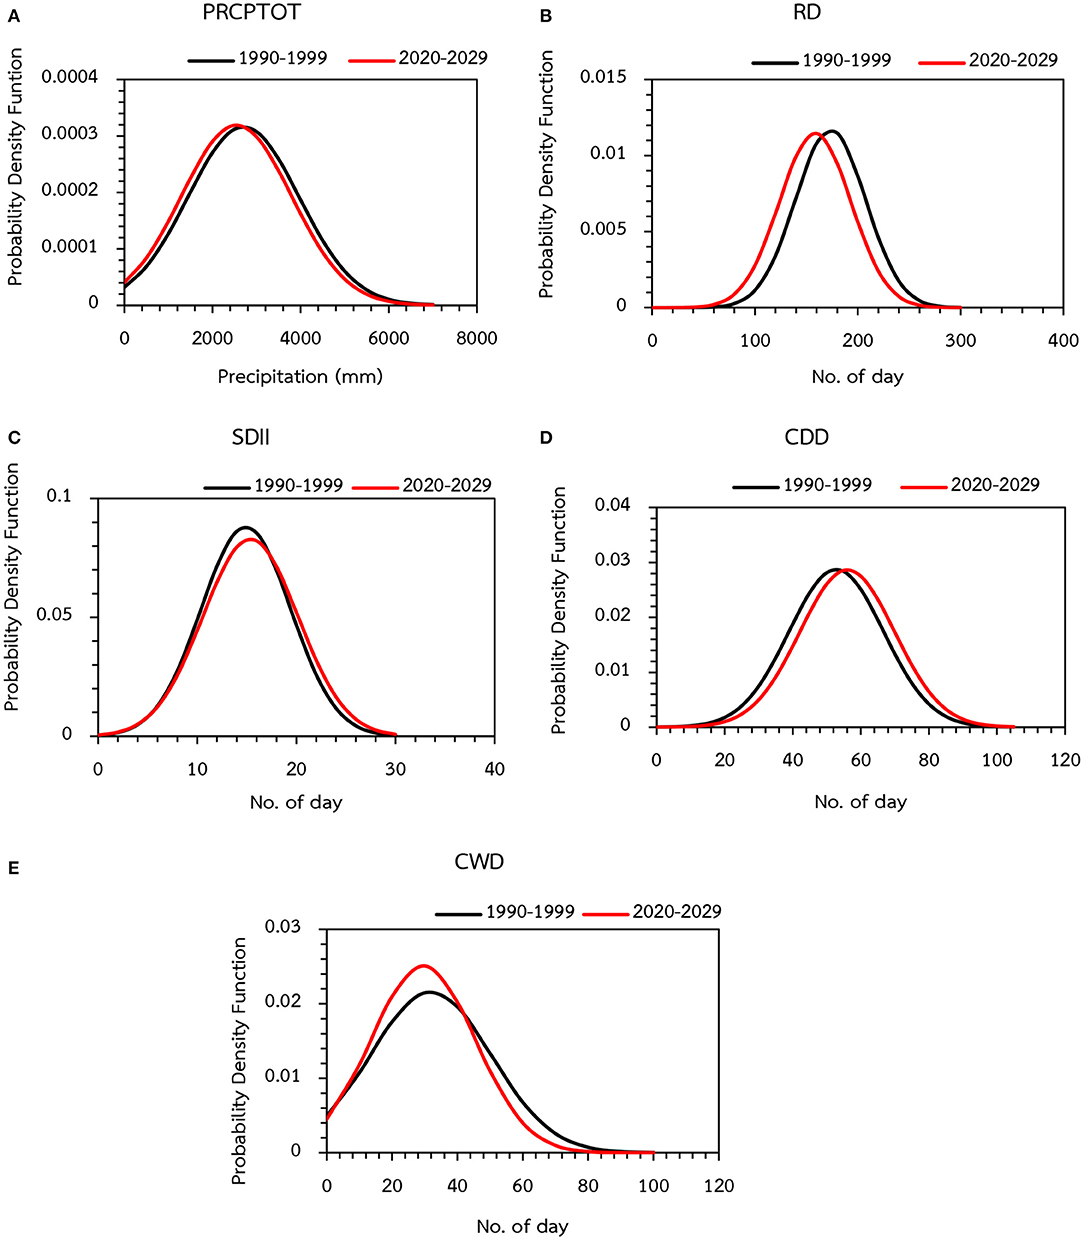
Figure 2. Probability distribution function of (A) PRCPTOT, (B) RD, (C) SDII, (D) CDD, and (E) CWD between years 2020 and 2029 and between years 1990 and 1999.
The ability of a regional climate model to capture realistic interannual variability in the future is shown in Figure 3. We use the SD of yearly annual and seasonal (DJF, JJA) means simulated between the years 2020 and 2029 to show the magnitude of the interannual variability of precipitation of the model. Using the year 2020 as a baseline, we found that only the year 2029 is adequate for capturing the relative magnitude of annual, DJF, and JJA variability. The DJF variability is greater than either the annual or JJA variability in the years 2021, 2023, 2024, 2027, and 2028; whereas, the JJA variability is greater than both the annual variability and the DJF variability in the years 2022, 2025, and 2026.
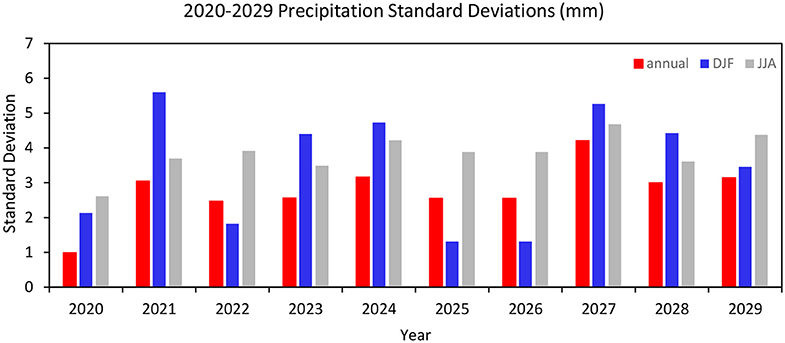
Figure 3. The standard deviation of yearly annual and seasonal (DJF, JJA) means simulated between the years 2020 and 2029.
Mostly, the result of this study was similar to those of the previous studies in the other regions of Asia (Choi et al., 2009; Endo et al., 2009; Caesar et al., 2011; Limsakul and Singhruck, 2016). However, compared to the previous regional studies, this study, which is based on the regional climate model, could bring some difference. For example, by comparing the ensemble mean of projected change by the regional climate model, with 25-km grid spacing in Southeast Asia (Supari et al., 2020), their results showed decreasing the PRCPTOT in northern Thailand, but the PRCTOT was generally located in eastern Thailand, with substantial decreasing patterns, while the rising pattern was in northern Thailand in this study. In general, increasing resolution may better capture small-scale processes and features (downscaling effect), but increased GCM resolution may also improve the representation of large-scale atmospheric circulation (upscaling effect) (Iles et al., 2020). Particularly, precipitation extremes are sensitive to resolution over complex orography. In addition, some studies suggest that country-scale higher-resolution precipitation datasets still give heavier precipitation extremes, which may agree best with the 0.11° simulations. For example, Prein et al. (2016) and Torma et al. (2015) found that various aspects (biases, frequency–intensity distributions, spatial patterns) of the mean and extreme precipitation improved in EURO668 CORDEX at 0.11° compared with at 0.44°. Prein et al. (2016) ascribe this mostly to the better representation of orography at higher resolution and the ability to capture the larger scales of convection.
As mentioned in the previous research, (i.e., Caesar et al., 2011; Nguyen et al., 2014; Villafuerte et al., 2014), the El Niño-Southern Oscillation (ENSO) has a strong impact on the year-to-year precipitation variability in Southeast Asia. In addition, Limsakul and Singhruck discussed that the La Niña and El Niño years have more precipitation and less extreme events, and vice versa, during the negative years of Pacific Decadal Oscillation (PDO) in Thailand. It is, primarily, warming of the Walker circulation in the eastern Pacific Ocean that has been suggested to influence the moisture and the cell movement in the Indo-Pacific region, hence the incidence of El Niño (Juneng and Tangang, 2005; Singhrattna et al., 2005; Nguyen et al., 2014). The ENSO events were recorded to disrupt the monsoon vertical atmospheric circulation in Thailand and caused decreased precipitation (Wang et al., 2003; Juneng and Tangang, 2005; Singhrattna et al., 2005). A rise in the formation of tropical cyclones may well be connected to increases in the number of days with heavy precipitation in the area, which is a potential factor in the shift in storm tracks in the east Indian Ocean, and maybe a factor contributing to the increased number of days with tropical cyclones (Caesar et al., 2011). Krishnamurthy and Krishnamurthy (2014) found that the PDO phase is essential for the Walker circulation patterns in the Pacific and Indian Oceans. One of the mechanisms by which PDO influences the monsoon rains is the Hadley circulation in the monsoon region. Changes in the Walker circulation over the Pacific and Indian Oceans also follow the PDO. The PDO, which causes the monsoon rainfall, is being linked to the Hadley circulation; hence, the mechanism by which it impacts the monsoon rainfall is limited to the monsoon region (Krishnamurthy and Krishnamurthy, 2014). However, the limitation of this study is that it is not represented well in terms of climate change. With a 10-year integration period, it is difficult to express the interannual variability, but it is noteworthy that people can do adaptation in the future. To extend the knowledge and better expression of the precipitation variability in Thailand and Southeast Asia, further study of the mechanisms underlying the ENSO and PDO linkage is required. Moreover, climate adaptation, a mitigation plan in the future, a regional climate simulation, and a long-term precipitation-variation analysis should be performed in Thailand.
Conclusion
This study predicts the future extreme precipitation in Thailand during the years 2020 and 2029 relative to the reference period 1990–1999 under the RCP8.5 scenario. The output from the NRCM was used as input into five indices, i.e., PRCPTOT, RD, SDII, CWD, and CDD. The evaluation of the model, with ground-based measurement and APHRODTE and GCPD data, represents well the precipitation in Thailand. The analysis of the indices expressed that precipitation is becoming less frequent in the entirety of Thailand, and the frequency of the CWD has decreased significantly; precipitation has also become more intensive. The indexes calculating the amount of heavy precipitation caused by wet daytime events and the maximum 1-day precipitation showed a negative trend in wetter conditions. The annual PRCPTOT, RD, SDII, and CWD illustrated spatially consistent patterns with important trends in the regional average annual series.
Data Availability Statement
The original contributions presented in the study are included in the article/supplementary material, further inquiries can be directed to the corresponding author/s.
Author Contributions
TA: conceived and designed the experiments, performed the experiments, analyzed and interpreted the data, contributed reagents, materials, analysis tools, or data, and wrote the paper.
Funding
This research was funded by the University of Phayao, Thailand (Grant No. FF64-UoE015).
Conflict of Interest
The author declares that the research was conducted in the absence of any commercial or financial relationships that could be construed as a potential conflict of interest.
Acknowledgments
The author would like to thank the Atmospheric Environment Research Unit of the University of Phayao for their financial support.
References
Allan, R. P., and Soden, B. J. (2008). Atmospheric warming and the amplification of precipitation extremes. Science 321, 1481–1484. doi: 10.1126/science.1160787
Amnuaylojaroen, T., Barth, M. C., Pfister, G., and Bruyere, C. (2018). “Simulations of emissions, air quality, and climate contribution in southeast asia for march and december,” in Land-Atmospheric Research Applications in South and Southeast Asia, eds K. Vadrevu, T. Ohara, C. Justice (Cham: Springer). doi: 10.1007/978-3-319-67474-2_12
Amnuaylojaroen, T., and Chanvichit, P. (2019). Projection of near-future climate change and agricultural drought in Mainland Southeast Asia under RCP8.5. Clim. Change 155, 175–193. doi: 10.1007/s10584-019-02442-5
Amnuaylojaroen, T., Chanvichit, P., Janta, R., and Surapipith, V. (2021). Projection of rice and maize productions in northern thailand under climate change scenario RCP8.5. Agriculture 11:23. doi: 10.3390/agriculture11010023
Barretta, C. B., and Santos, P. (2014). The impact of changing rainfall variability on resourcedependent wealth dynamics. Ecol. Econ. 105, 48–54. doi: 10.1016/j.ecolecon.2014.05.009
Bruyère, C., Raktham, C., Done, J., Kreasuwun, J., Thongbai, C., and Promnopas, W. (2017). Major weather regime changes over Southeast Asia in a near-term future scenario. Clim. Res. 2017, 1–18. doi: 10.3354/cr01442
Caesar, J., Alexander, L. V., Trewin, B., Tse-ring, K., Sorany, L., Vuniyayawa, V., et al. (2011). Changes in temperature and precipitation extremes over the IndoPacific region from 1971 to 2005. Int. J. Climatol. 31, 791–801. doi: 10.1002/joc.2118
Chassignet, E. P., Hurlburt, H. E., Smedstad, O. M., Halliwell, G. R., Hogan, P. J., Wallcraft, A. J., et al. (2007). The HYCOM (hybrid coordinate ocean model) data assimilative system. J. Marine Sys. 65, 60–83.
Chen, F., and Dudhia, J. (2001). Coupling an advanced land surface–hydrology model with the Penn state–NCAR MM5 modeling system. Part I: model implementation and sensitivity. Mon. Weather Rev. 129, 569–585. doi: 10.1175/1520-0493(2001)129<0569:CAALSH>2.0.CO;2
Choi, G., Collins, D., Ren, G., Trewin, B., Baldin, M., Fukuda, Y., et al. (2009). Changes in means and extreme events of temperature and precipitation in the Asia-Pacific Network region, 1955–2007. Int. J. Climatol. 29, 1906–1925. doi: 10.1002/joc.1979
Cinco, T. A., de Guzman, R. G., Hilario, F. D., and Wilson, D. M. (2014). Long-term trends and extremes in observed daily precipitation and near surface air temperature in the Philippines for the period 1951–2010. Atmos. Res. 145–146, 12–26. doi: 10.1016/j.atmosres.2014.03.025
Coumou, D., and Rahmstorf, S. (2012). A decade of weather extremes. Nat. Clim. Change 2, 491–496. doi: 10.1038/nclimate1452
Donat, M. G., Alexander, L. V., Yang, H., Durre, I., Vose, R., Dunn, R. J. H., et al. (2013). Updated analyses of temperature and precipitation extreme indices since the beginning of the twentieth century: the HadEX2 dataset. J. Geophys. Res. Atmos. 118, 1–16. doi: 10.1002/jgrd.50150
Donat, M. G., Peterson, T. C., Brunet, M., King, A. D., Almazroui, M., Kolli, R. K., et al. (2014). Changes in extreme temperature and precipitation in the Arab region: long-term trends and variability related to ENSO and NAO. Int. J. Climatol. 34, 581–592. doi: 10.1002/joc.3707
Done, J. M., Holland, G. J., Bruyère, C. L., Leung, L. R., and Suzuki-Parker, A. (2013). Modeling high-impact weather and climate: lessons from a tropical cyclone perspective. Clim. Change 129, 381–395. doi: 10.1007/s10584-013-0954-6
Endo, N., Matsumoto, J., and Lwin, T. (2009). Trends in precipitation extremes over Southeast Asia. SOLA 5, 168–171. doi: 10.2151/sola.2009-043
Gent, P. R., Danabasoglu, G., Donner, L. J., Holland, M. M., Hunke, E. C., Jayne, S. R., et al. (2011). The community climate system model version 4. J. Clim. 24, 4973–4991. doi: 10.1175/2011JCLI4083.1
Guan, K., Good, S. P., Caylor, K. K., Sato, H., Wood, E. F., and Li, H. (2014). Continental-scale impacts of intra-seasonal rainfall variability on simulated ecosystem responses in Africa. Biogeosciences 11, 6939–6954. doi: 10.5194/bg-11-6939-2014
Iles, C. E., Vautard, R., Strachan, J., Joussaume, S., Eggen, B. R., and Hewitt, C. D. (2020). The benefits of increasing resolution in global and regional climate simulations for European climate extremes. Geosci. Model Dev. 13, 5583–5607. doi: 10.5194/gmd-13-5583-2020
Juneng, L., and Tangang, F. T. (2005). Evolution of ENSO-related rainfall anomalies in Southeast Asia region and its relationship with atmosphere–ocean variations. Clim. Dyn. 25, 337–350. doi: 10.1007/s00382-005-0031-6
Krishnamurthy, L., and Krishnamurthy, V. (2014). Influence of PDO on South Asian summer monsoon and monsoon–ENSO relation. Climate Dyn. 42, 2397–2410. doi: 10.1007/s00382-013-1856-z
Limsakul, A., and Singhruck, P. (2016). Long-term trends and variability of total and extreme precipitationin Thailand. Atmos. Res. 169, 301–317. doi: 10.1016/j.atmosres.2015.10.015
Min, S.-K., Zhang, X., Zwiers, F. W., and Hegerl, G. C. (2011). Human contribution to more intense precipitation extremes. Nature 470, 378–381. doi: 10.1038/nature09763
Nguyen, D.-Q., Renwick, J., and McGregor, J. (2014). Variations of surface temperature and rainfall in Vietnam from 1971 to 2010. Int. J. Climatol. 34, 249–264. doi: 10.1002/joc.3684
Pielke, R. A. Jr, and Downton, M.W. (2000). Precipitation and damaging floods: trends in the United States, 1932–97. J. Clim. 13, 3625–3637. doi: 10.1175/1520-0442(2000)013<3625:PADFTI>2.0.CO;2
Prein, A. F., Gobiet, A., Truhetz, H., Keuler, K., Goergen, K., Teichmann, C., et al. (2016). Precipitation in the EURO-CORDEX 0.11° and 0.44°simulations: high resolution, high benefits? Climate Dyn. 46, 383–412. doi: 10.1007/s00382-015-2589-y
Price, J. F., Weller, R. A., and Pinkel, R. (1986). Diurnal cycling: observations and models of the upper ocean response to diurnal heating, cooling, and wind mixing. J. Geophys. Res. Space Phys. 91, 8411–8427. doi: 10.1029/JC091iC07p08411
Singhrattna, N., Rajagopalan, B., Kumar, K. K., and Clark, M. (2005). Article has an altmetric score of 1 Interannual and interdecadal variability of Thailand summer monsoon season. J. Climate 18, 1697–1708. doi: 10.1175/JCLI3364.1
Stauffer, D. R., and Seaman, N. L. (1990). Use of four-dimensional data assimilation in a limited-area mesoscale model. Part I: Experiments with synoptic-scale data. Mon. Weather Rev. 118, 1250–1277. doi: 10.1175/1520-0493(1990)118<1250:UOFDDA>2.0.CO;2
Supari, T. F., Juneng, L., Cruz, F., Chung, J. X., Ngai, S. T., Salimun, E., et al. (2020). Multi-model projections of precipitation extremes in Southeast Asia based on CORDEX-Southeast Asia simulations. Environ. Res. 184:109350. doi: 10.1016/j.envres.2020.109350
Tangang, F., Chung, J. X., Juneng, L., Salimun, E., Ngai, S. T., Jamaluddin, A. F., et al. (2020). Projected future changes in rainfall in Southeast Asia based on CORDEX-SEA multi-model simulations. Clim. Dyn. 55, 1247–1267.
Thompson, G., Rasmussen, R. M., and Manning, K. (2004). Explicit forecasts of winter precipitation using an improved bulk microphysics scheme. Part I: description and sensitivity analysis. Mon. Weather. Rev. 132, 519–542. doi: 10.1175/1520-0493(2004)132<0519:EFOWPU>2.0.CO;2
Torma, C., Giorgi, F., and Coppola, E. (2015). Added value of regional climate modeling over areas characterized by complex terrain—precipitation over the Alps. J. Geophys. Res. Atmosph. 120, 3957–3972. doi: 10.1002/2014JD022781
Trenberth, K. E., Dai, A., Rasmussen, R. M., and Parsons, D. B. (2003). The changing character of precipitation. Bull. Am. Meteorol. Soc. 84, 1205–1217. doi: 10.1175/BAMS-84-9-1205
Villafuerte, M. Q. II., Matsumoto, J., Akasaka, I., Takahashi, H. G., Kubota, H., and Cinco, T. A. (2014). Long-term trends and variability of rainfall extremes in the Philippines. Atmos. Res. 137, 1–13. doi: 10.1016/j.atmosres.2013.09.021
Wang, B., Wu, R., and Li, L. (2003). Atmosphere–warm ocean interaction and its impacts on Asian–Australian monsoon variation. J. Clim. 16, 1195–1211. doi: 10.1175/1520-0442(2003)16<1195:AOIAII>2.0.CO;2
Keywords: precipitation, extreme events, climate change, Thailand, climate extreme
Citation: Amnuaylojaroen T (2021) Projection of the Precipitation Extremes in Thailand Under Climate Change Scenario RCP8.5. Front. Environ. Sci. 9:657810. doi: 10.3389/fenvs.2021.657810
Received: 24 January 2021; Accepted: 19 March 2021;
Published: 14 April 2021.
Edited by:
Suvarna Sanjeev Fadnavis, Indian Institute of Tropical Meteorology (IITM), IndiaReviewed by:
M. D. Wahiduzzaman, University of Tasmania, AustraliaT. P. Sabin, Indian Institute of Tropical Meteorology (IITM), India
Copyright © 2021 Amnuaylojaroen. This is an open-access article distributed under the terms of the Creative Commons Attribution License (CC BY). The use, distribution or reproduction in other forums is permitted, provided the original author(s) and the copyright owner(s) are credited and that the original publication in this journal is cited, in accordance with accepted academic practice. No use, distribution or reproduction is permitted which does not comply with these terms.
*Correspondence: Teerachai Amnuaylojaroen, teerachai.am@up.ac.th; teerachai4@gmail.com