Combined Approaches to Predict Microplastic Emissions Within an Urbanized Estuary (Warnow, Southwestern Baltic Sea)
 Sarah Piehl1*
  Rahel Hauk1
  Esther Robbe1,2
  Boris Richter3 Frauke Kachholz3 Jannik Schilling3
  Robin Lenz1
  Dieter Fischer4
  Franziska Fischer4
  Matthias Labrenz1
  Gerald Schernewski1,2
- 1Leibniz Institute for Baltic Sea Research, Rostock, Germany
- 2Marine Research Institute, Klaipėda University, Klaipeda, Lithuania
- 3Department of Water Management, University of Rostock, Rostock, Germany
- 4Leibniz Institute of Polymer Research, Dresden, Germany
Microplastic river emissions are known to be one of the major sources for marine microplastic pollution. Especially urbanized estuaries localized at the land-sea interface and subjected to microplastic emissions from various sources exhibit a high microplastic discharge potential to adjacent coasts. To adapt effective measures against microplastic emissions a more detailed knowledge on the importance of various microplastic sources is necessary. As field data is scarce we combined different approaches to assess microplastic emissions into the Warnow estuary, southwestern Baltic Sea. Resulting microplastic emission estimates are based on in-situ measurements for the catchment emissions, whereas for the remaining microplastic sources within the estuary literature data on microplastic abundances, and various parameters were used (e.g. demographical, hydrological, geographical). The evaluation of the different emission scenarios revealed that the majority of microplastic is likely discharged by the Warnow river catchment (49.4%) and the separated city stormwater system (43.1%) into the estuary, followed by combined sewer discharges (6.1%). Wastewater treatment plant emissions exhibit the lowest percentage (1.4%). Our approach to estimate anti-fouling paint particles emissions from leisure and commercial shipping activities was associated with highest uncertainties. However, our results indicate the importance of this source highlighting the necessity for future research on the topic. Based on our assumptions for microplastic retention within the estuary, we estimate a potential annual emission of 152–291 billion microplastics (majority within the size class 10–100 µm) to the Baltic Sea. Considering all uncertainties of the different applied approaches, we could assess the importance of various microplastic sources which can be used by authorities to prioritize and establish emission reduction measures. Additionally, the study provides parameters for microplastic emission estimates that can be transferred from our model system to other urbanized Baltic estuaries.
Introduction
Since the first description of small plastic particles in the marine environment (Colton et al., 1974; Morris and Hamilton, 1974), assessments of “microplastic” (MP) contamination revealed its ubiquitous distribution within aquatic ecosystems (Burns and Boxall, 2018; Geilfus et al., 2019). Concentrations of MPs span several orders of magnitude ranging from less than one to several hundreds of thousands of MPs per cubic meter in sea water (Wu et al., 2019). In sediments over ten thousand MPs per kilogram dry weight (DW) have been reported (Cunningham and Sigwart, 2019). Especially semi-enclosed seas with a large catchment area and limited water exchange through narrow straits, such as the Baltic Sea, are subjected to anthropogenic pressures deriving mainly from land-based activities like MP litter. Due to the omnipresence and longevity of MP litter and its potential adverse effects on organisms and human health (Sharma and Chatterjee, 2017; Wang et al., 2019) it has become an integral part of regulations for the protection of the marine environment (Directive of the European parliament, 2008; HELCOM, 2008; Resolution, 2020). The most relevant within the European Union, the Marine Strategy Framework Directive (MSDF, 2008/56/EC), requires its member states to achieve a good environmental status (GES) with marine litter representing one of the qualitative descriptors (D10) for the GES. For Baltic Sea member states, the directive is implemented within the Baltic Sea Action Plan (BSAP) of the Helsinki Convention (HELCOM). Its Regional Action Plan on Marine Litter (RAP ML) requires further “to establish an overview of the importance of the different sources of primary and secondary microplastics” (RL6, HELCOM, 2015) and calls for actions addressing sources of MPs, (i.e. RL4).
Rivers have already been recognized as a major input source of MP litter into the ocean (van Wijnen et al., 2019). Especially urbanized estuaries depict a potential hotspot for MP emissions to coastal waters with measured MP concentrations in urban surface waters reaching 100 items per liter (Leslie et al., 2017). Here a multitude of MP emission sources congregate within a confined space, such as recreational activities, shipping, wastewater emissions, tributaries, and leisure boat facilities. To implement targeted prevention measures against marine MP litter a detailed overview and assessment of the importance of various MP emission sources within urban estuaries is necessary. Concerning southwestern Baltic estuaries, the Warnow estuary, with a high degree of urbanization and industrialization, depicts a suitable model system.
Considering land-based MP emissions, major point sources are municipal and industrial wastewaters (Baresel and Olshammar, 2019; Bellasi et al., 2020). Due to high discharge volumes of wastewater treatment plants (WWTPs) they are considered as significant source even though most plants obtain a MP removal efficiency of >90% (with up to 99.9%) (Prata, 2018; Cristaldi et al., 2020; Uddin et al., 2020). An even higher share of MP emissions has been reported for combined sewer overflows (CSOs) in combined systems (Baresel and Olshammar, 2019) as well as stormwater in separated systems (Liu et al., 2019). Paint particles from buildings, structures, and shipping are thought to be another relevant source of MPs within urban estuaries (Sundt et al., 2014; Soroldoni et al., 2018). Here it must be differentiated between anticorrosive and antifouling paint particles (AFPPs) with the latter possibly possessing a higher relevance due to the self-polishing behavior of AFPPs (Watermann and Eklund, 2019). For example, in the Warnow estuary, a medium of 86.5 MP per kilogram DW and a maximum of 379 (±28) MPs per kilogram DW was measured within subtidal sediments with paint particles generally as common as other microplastics (Enders et al., 2019).
Nevertheless, data on MP inputs from diverse sources and abundances within any river mouth is still scarce (Li et al., 2018; Rezania et al., 2018). Besides challenges on collection of environmental MP samples, cost-effective and standardized operational monitoring methods are currently lacking. An alternative approach to estimate MP emissions is the development of emission scenarios based on available literature data, expert knowledge and via indirect parameters. For example near shore population density, gross domestic product, and mismanaged plastic waste were already utilized as predictors for plastic litter emissions on a global scale (Sherman and van Sebille, 2016; Schmidt et al., 2017; Isobe et al., 2019). Regarding MPs, Siegfried et al. (2017) estimated MP fluxes from European rivers to the sea by combining information on MP litter point sources, sewage management, and plastic retention during river transport. Discharge of MPs by urban waters to the Baltic Sea was further assessed utilizing exemplary sewer systems and a model city (Bollmann et al., 2019). Nevertheless, a spatially resolved differentiation of MP emission sources within an urbanized Baltic estuary is currently missing to the best of our knowledge. Due to its relatively small and well-defined area the Warnow estuary provides an ideal model system for which a comprehensive approach can be applied.
To support authorities in establishing an effective monitoring as well as in implementing mitigation measures, we assessed the importance of different MP sources exemplarily for the Warnow estuary. We first localized major MP point sources, here defined as sources within the estuary where a spatially explicit localization is possible. Secondly, a combination of different approaches was used to estimate MP emissions from the city sewer system and the river catchment as well as to assess AFPP emissions. The specific aims were 1) to establish an overview of the importance of different MP sources within the urbanized Warnow estuary as a model system, 2) to provide a first estimation on annual MP emissions from the estuary to the Baltic Sea, and 3) to assess the suitability of utilized parameters to support the development of simplified indicators for estuarine MP emissions into the Baltic Sea.
Materials and Methods
Study System
The Warnow estuary (Figure 1), Mecklenburg-Western Pomerania, Germany, has a length of 13 km with a mean water depth of 5.6 m and a maximum depth of 15 m within the shipping channel up to the area of Breitling (Lange et al., 2020). The estuary holds a water volume of 49.6 million m3 within an area of 12 km2 (Bachor, 2005) and exhibits a water exchange time of around 30 days. The average water budget of the estuary is dominated by intruding Baltic Sea water with 1,180 km3/a in comparison to 440 km3/a freshwater inflow and a total outflow to the North Sea of 1,660 km3/a (Szymczycha et al., 2019). The estuarine exchange flow of the tidal weak estuary is sensitive to wind stress and varying salinities of the adjacent coastal waters, which leads to frequent inversion of the classical estuarine circulation (Lange et al., 2020). The 56.5 km long riverbank of the estuary is mostly artificial (74%), and harbor and shipping lanes occupy 37% of the water surface area (Schernewski et al., 2019). In 2018 around 200 cruise ships arrived and around 19.6 million tons of freight and 3.3 million passengers were handled (Hansestadt Rostock, 2019). Besides, leisure boat facilities are common with a share of 6% of all moorings along the German Baltic Sea coast (Watermann et al., 2014). To maintain and safeguard shipping activities, parts of the estuary are regularly dredged. The maintenance interval of the inner and outer shipping lane (access to industrial harbor) is five to ten years whereby on average 60,000 m3/a of dredged material is extracted (WSV, 2019). Other areas within the estuary are maintained on demand.
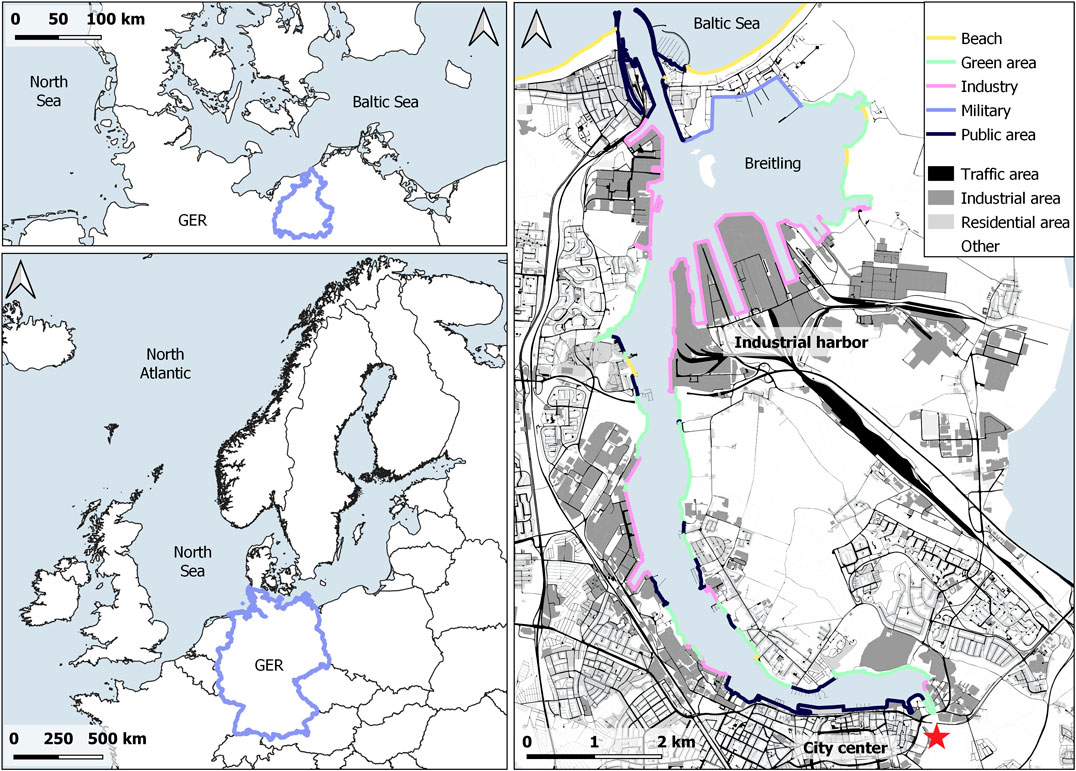
FIGURE 1. Map of the Warnow catchment (blue line upper left) located in northwestern Germany (lower left) and the Warnow estuary (right) with land use sections around the estuary. The position of the weir where the Warnow river is discharging into the estuary is indicated by a red star. “Other” includes unsealed areas such as forests, agri- and horticulture. Source: Hanse-und Universitätsstadt Rostock (CC BY 4.0).
The city of Rostock surrounds the estuary and counts about 209,000 residents within an area of 181.4 km2 yielding a population density of 1,151 residents per km2 (Hansestadt Rostock, 2019).
The city area is shaped by a dense network of natural and artificial waterways. About 200 small streams with a total length of 196 km exist within the catchment of the city of Rostock. The city center is connected to a combined sewer system (Figure 2) but most of the catchment is connected to a separate system with a 430 km long canal network (KOGGE et al., 2018). The wastewater of Rostock is treated at the central wastewater treatment plant (WWTP). The treatment technology comprises mechanical treatment, an activated sludge followed by a two-step biofilter for post nitrification and denitrification. Taking industrial and commercial wastewater contributions into account the population equivalent (PE) of the WWTP is 400,000, corresponding to a wastewater production of 100 L per PE per day.
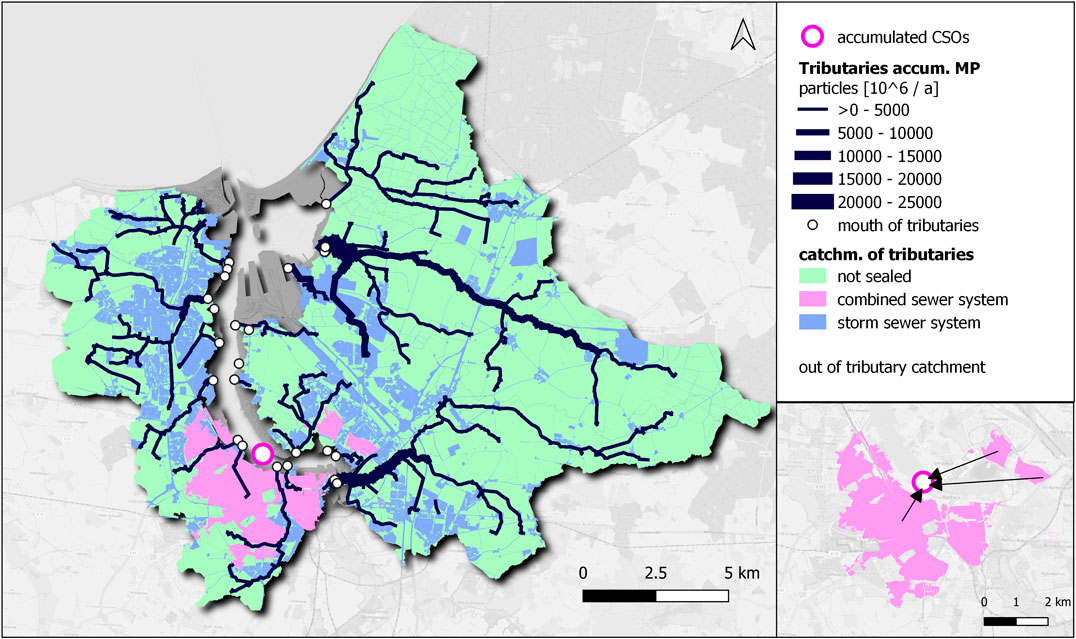
FIGURE 2. Accumulation of microplastic (MP) emissions from stormwater (blue areas) along tributaries (dark blue lines) within the catchment of the estuary and input of MP emissions from the combined sewer system (magenta areas). Green areas are assumed not to be sealed and include e.g., agriculture, grassland, and parks.
The mean annual rainfall amounts to 621 mm (DWD, 2020) and annually a mean of 16.5 m3/s of water is discharged from the Warnow river into the estuary. The discharge is regulated by a weir located at the southern part of the city of Rostock (Figure 1). The 149 km long Warnow river exhibits a catchment area of 3,280 km2 with a population density of 60 persons per km2.
The following described MP sources within the Warnow estuary were located through GIS data (KOGGE et al., 2018; OpenDataHRO, 2019; Wasserbuch, 2019). Despite additional diffuse emissions, e.g., through fragmentation of macroplastics or diffuse aerial inputs, the majority of land-based MP emissions is assumed to be covered according to current knowledge (Galafassi et al., 2019).
In total around 232 point sources for MPs and AFPPs are located within the estuary. Besides the input of the catchment, 24 tributaries discharge into the estuary (Figure 2). Among the 167 identified wastewater outlets are the WWTP outlet, 11 combined sewer outlets and 155 stormwater (STW) outlets. Regularly used moorings and leisure boat facilities depict potential emission points for AFPP. The industrial harbor maintains five docks with around 41 moorings. Additionally, five local ferry moorings, four cruise ship moorings as well as fifteen leisure boat facilities are located within the estuary. Due to insufficient data three operating shipyards were neglected for AFPP emission estimates in the current study.
The complex characteristics of MP particles (size, forms, types), the high number of potential sources and spatio-temporal variability of emissions as well as laborious and time-consuming analytical methods currently prevent comprehensive in-situ data collections. To provide a comprehensive picture for the Warnow Estuary the additional use of statistical data, literature, and the transfer of knowledge from similar systems was utilized. The different approaches to assess the importance of MP sources and emissions within the estuary are described in the following.
Rostock Sewer System Microplastic Emissions
Wastewater treatment plant
A concentration of 245 (IQR = 913–78) MPs/m3 (including MPs <100 µm) was applied corresponding to the median of values from WWTPs of various countries with tertiary treatment providing MP analysis for particles <100 µm (Supplementary Information SI1). Microplastic emissions were multiplied with monthly discharge data of the WWTP effluent from 2016 to 2018 which was provided by the local WWTP (Nordwasser GmbH).
Combined sewer overflow emissions
Currently, the CSOs are not measured since the discharges and concentrations have to be determined on a high temporal resolution or flow equivalent. Within the scope of this study, the discharge volume was therefore conceptually determined. Assuming that the spillway structures were dimensioned according to the chemical oxygen demand (COD) approach of the ATV-A 128 regulations (DWA, 1992) at the time, the annual discharge volumes can be calculated. The annual MP emission is in turn the product of the annual discharge volume and the MP concentration. For the calculation of the CSO discharge quantity (Eq. 1), the permissible overflow rate corresponding to the DWA 128 regulations (DWA, 1992) is assumed (Eq. 2).
where
The permissible overflow rate in relation to the COD was calculated using Eq. 2 (DWA, 2006). Since the city sewer system is in transition from a combined sewer system to a separated sewer system, the COD concentration of dry weather flow is high. To ensure that a critical COD of 178 mg/L is not exceeded a larger proportion of stormwater is mixed with the wastewater. Hence, the resulting average mixing ratio (m = 11.68:1) between rainwater and wastewater is quite high. Accordingly, the calculated overflow concentration of COD is 178 mg/L (Supplementary Information SI2). This results in a permissible overflow rate of 34%.
where
The rainfall runoff
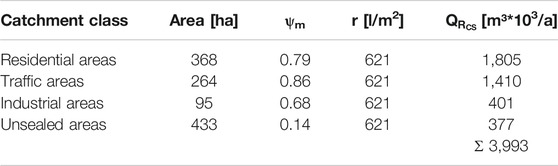
TABLE 1. Runoff of the annual precipitation of the combined sewerage catchment area. Runoff coefficients (ψm), annual rainfall (r), and rainfall runoff
According to the average mixing ratio (m = 11.68:1), the annual rainfall discharge of the CSOs is 1,269,794 m³ and the annual discharge wastewater of the CSO is 107,065 m³. The MP quantity (cMP) in Table 2 was derived from the use-specific concentration (Liu et al., 2019) and outflow fraction which corresponds to the percentage share of the rainfall runoff (Table 1). For untreated wastewater the median value of 143 (IQR = 910–68) MPs/l was calculated from data of nine studies (Supplementary Information SI1). All considered studies included the analysis of particles <100 µm.
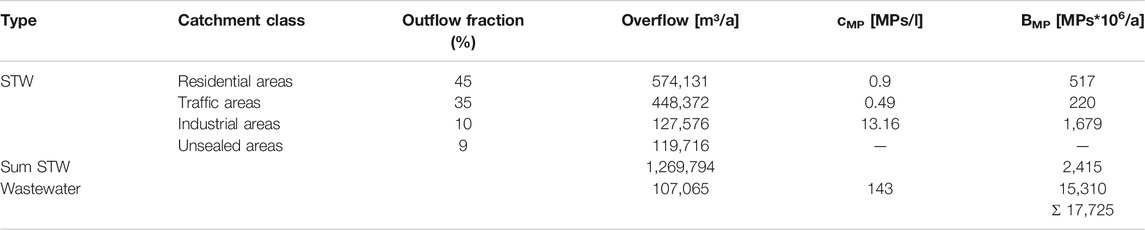
TABLE 2. Microplastic (MP) emission (BMP) due to combined sewer overflows separated according to the proportion of waste- and rainwater. The outflow fraction corresponds to the percentage share of the rainfall runoff
Stormwater emissions
Mean annual MP emissions by stormwater along 24 tributaries were estimated for the riverine inflows below the Mühlendamm weir (Figure 2). Sealed and drained areas
where
where QR is the stormwater runoff corresponding to the effective precipitation (l/a). Microplastic concentrations
Estimated MP emissions were allocated to the nearest watercourse section by a spatial join in GIS (Supplementary Information SI3). River geometries were available as line sections of 50 m length from the project KOGGE (KOGGE et al., 2018). Each river section is labeled by a unique identification number, which is composed of the classification number and a station number according to the German “LAWA guideline for the labeling of rivers” (WASSER, 2005). The hierarchical structure of the classification number and station number from the estuary to the river head makes it possible to identify river sections located below or above each section. The accumulation of these emissions along the flow path is performed by Python scripts in GIS.
Spatial resolved MP emissions of stormwater outlets directly discharging into the estuary are currently not possible due to lacking information regarding the wastewater system (grey area Figure 2). Nevertheless, similar calculations of MP runoff, based on available information on the share of industrial (5.3 km2), residential (3.7 km2), and traffic (2.4 km2) areas can be made based on Eqs. 4, 5.
River Catchment Microplastic Emissions
The number of MP particles released from the catchment into the estuary was taken from eight in-situ collected water surface samples from the Warnow river close to Kessin (N54°03′51.13, E12°10′15.60), about 3 km upstream the weir, during September and October 2018 and May to March 2019. Sampling was conducted using an encapsulated flow through filtration system as described by Lenz and Labrenz, (2018) with sample volumes between 150 and 600 L. The device was equipped with stainless steel filter cartridges (nominal 10 µm mesh size) in an enclosed setup. The sampling inlet was placed to sample the upper 10 cm of the water column facing the incoming flow. The individual sample volumes and dates can be found in the Supplementary Table SI4.
The sample material was further processed in a MP-work adapted laboratory according to Enders et al. (2020). All steps involving exposed sample material were conducted inside a laminar flow bench (S2020 1.8, Thermo Scientific). All chemicals and rinsing water used were filtered through muffled 1.5 µm glass fiber filters (Whatman 934-AH) in a MP-free environment. First, the sample material was recovered from the filter cartridges by soaking in a 15% H2O2 solution for 48 h with subsequent rinsing off the particulate matter into ceramic bowls. From there the decision tree proposed by Enders et al. (2020) was followed applying protocol module m1 (freeze drying), m4 (30% H2O2 digestion over 24 h), and m5 (simple density separation). In a final vacuum filtration on 10 µm stainless steel meshes the samples were thoroughly rinsed using MP-free ultrapurified water to wash out remaining solutes.
The samples were transferred from the 10 µm stainless steel meshes to 50 ml Erlenmeyer flasks and sent to the IPF Dresden for microspectroscopic analysis. For that purpose, the particle suspensions were filtrated onto 10 × 10 mm silicon filters (Käppler et al., 2015) for the following Raman analysis. The filtration took place in a particle-depleted laboratory under a laminar flow bench using a custom-made glass filtration device with PTFE adapters to host the silicon filters (Brandt et al., 2020). The silicon filters had a pore size of 50 µm with a pitch of 100 µm. The number, type, and color of the MP particles >50 µm of a filtrated sample were determined with a combination of optical particle detection and Raman microspectroscopy using the software GEPARD as described in Brandt et al., 2020.
Microplastic abundances in samples were corrected by MP abundances detected in laboratory and process blanks. Therefore, the mean MP number for each size and polymer type class was calculated and subtracted according to the size and polymer type class from each sample (Supplementary Information SI4). The MP data from the two different seasons (spring/autumn) were pooled for calculation of mean annual MP emissions from the catchment. Therefore, measured MP concentrations (C) were plotted against the river discharge (Q) measurements from the sampling day and a linear regression model was fitted to the data (in the following C-Q model; Supplementary Information SI5). Subsequently, the C-Q relationship was used to calculate annual MP emissions based on daily discharge data (m3 per second) from the closest gauging station Rostock/Geinitzbrücke (N54°04′41.17, E12°09′15.16) for the years 2016–2018 (data provided by Staatliches Amt für Landwirtschaft und Umwelt Mittleres Mecklenburg 2019) based on Eq. 6 (Supplementary Information SI5):
where C corresponds to the MP concentration (MPs/day) and Q corresponds to the river discharge (m3/s).
Anti-fouling Paint Particle Emissions
As another potentially significant MP source within urbanized estuaries we assessed anti-fouling paint particle (AFPP) emissions from leisure and commercial shipping activities (Supplementary Information SI6). For the leisure boat facility scenario AFPP release from the underwater ship hull of leisure boats were considered. Thereby, 65% of permanent leisure boats (PLANCO, 2004), which are assumed to be at berth for 50% of the time during the whole season (April-October), were considered. Number of berths within leisure boat facilities were obtained from the city of Rostock (OpenDataHRO). Utilizing emission scenarios for active ingredients from AFPPs it is assumed that 2.5 L of anti-fouling paint is applied per leisure boat and year by do-it-yourself maintenance work (OECD, 2005).
To convert paint volume applications to particle numbers a polymer content of 30% was assumed (Watermann and Eklund, 2019). As size distributions of AFPP particles detected in environmental samples are lacking, a basic emission scenario with an idealized AFP particle was applied to get a first impression on spatio-temporal emission patterns within the estuary. Therefore, MP spheres with a density of 1.6 g/cm3 (Daehne et al., 2017; Enders et al., 2019) and a diameter of 0.5 mm were used for conversion.
Generally, three AFPP emission scenarios were differentiated: emissions during in-service use (ISU), from high-pressure washing (HPW), and from maintenance and repair work (MR). Emissions during ISU were set to 1% of paint applied (OECD, 2009) of which 50% were assumed to be released while the boats are moored at berth. For the HPW and MR scenario particle emissions were assumed to be equally distributed to soil and water, resulting in a fraction of 0.5 being discharged to the water. At the end of the season in November boats are taken out of the water and often cleaned by HPW where a removal factor of 0.2 of AFPPs was set (OECD, 2005). Only leisure sport facilities offering a slipway were considered for AFPP release through HPW. For MR work during December till March a removal factor of 0.3 and an emission factor of paint application of 0.0125 was adapted (OECD, 2005). Only facilities that store boats in proximity to the water (identified through satellite images) were considered for MR particle emissions.
Oversea ferries, cruise ships, RoRo (Roll-on Roll-off), tanker, and cargo ships were considered for the AFPP emissions during ISU from commercial shipping. A conservative theoretical coverage of 13 m2/L of AFP was applied. To transfer the AFPP emissions of 1% during ISU to emissions within the estuary, average wetted surface area of different ship types (Miller et al., 2018), data on yearly inruns, and average time at berth for different ship categories (Lorentz and Moldsenhauer, 2014) were utilized (see Supplementary Information SI6 for calculation).
Comparison of Emission Estimates and Potential Microplastic Discharge to the Baltic Sea
For MP emission estimates of the city sewer system (WWTP, CSO, and STW), particle size was considered as important parameter. We only considered data from studies including the analysis of MPs <100 μm, as MP particle number increases rapidly with decreasing particle size. The MP concentration for raw wastewater and WWTP effluent was obtained as median from several studies, whereas for STW emissions only one study transferable to our system was available to the best of our knowledge (Liu et al., 2019).
The analysis of in-situ obtained MP data for the Warnow river did not include MPs between 10 and 50 µm. As fragmentation of MP particles causes the generation of continually smaller MPs, they are expected to follow a power law particle distribution (Kooi et al., 2019). Thus, MP counts from in-situ river samples were grouped into size bins of 10 µm and a power law model fitted to the data (Supplementary Information SI7). The obtained coefficients (a = 9.231, b = −1.293) were used to predict MP abundance down to 10 µm. Our calculated annual MP emissions by the C-Q model was concurrently corrected by the relative share of 91% of the size class 10–50 µm.
A comparison with AFPP emissions was not considered due to the different data basis, utilizing sales volume of AFP, expert knowledge, and an idealized AFP particle for emission estimates.
To further estimate MP discharge to the Baltic Sea the following considerations and assumptions on MP density, and thus sinking behavior, were made. Microplastic data from in-situ measurements and the literature were grouped into two density classes. Low density (LD) MPs with a density <1.0 g/cm3 included polymers such as polyethylene (PE) and polypropylene (PP). The high density (HD) class, with a density >1.0 g/cm3, contained polymers such as polyethylene terephthalate (PET), polyvinylchloride (PVC), polyamide etc (Supplementary Information SI4).
For high density AFPPs an accumulation close to their source could be shown for the Warnow estuary (Enders et al., 2019) and hence their retention within the estuary is very likely. In addition, HD-MPs with a higher density than seawater (1.025 g/cm3) were assumed to sink as processes, such as biofouling or agglomeration (Rummel et al., 2017; Michels et al., 2018), increase MP density and thus the probability of MPs sinking to the riverbed. Besides, for MPs between 1–200 µm retention is reported to strongly increase with density (Besseling et al., 2017).
To provide a conservative estimate on annual MP emissions to the Baltic Sea retention of buoyant LD-MPs was additionally considered. Due to the complex hydrodynamic behavior of the weakly tidal Warnow estuary, measuring discharge and assessing water retention time is difficult. For the saltwater influenced Warnow estuary Rönspieß et al. (2020) reported a retention capacity for particulate phosphorus. Similar calculations for suspended particulate matter (SPM) from the supplementary information of this study (see Suppl. 9_Balance calculations of Rönspieß et al., 2020) results in a retention capacity of 31% for SPM respectively. This retention capacity was further assumed for LD-MPs.
Results
Rostock City Sewer System Microplastic Emissions
On average an annual emission of about 4.1 billion MPs was calculated for the WWTP outlet based on the monthly discharge data of the years 2016–2018 (monthly mean emission of about 11 million MPs).
Similar to the discharge of the catchment, at the WWTP lowest and highest average daily discharge of treated wastewater, and thus MP emissions, were calculated for 2018 in November and April respectively (Figure 3).
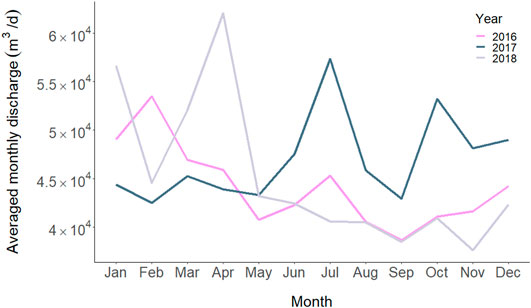
FIGURE 3. Averaged daily discharge of treated wastewater for the different month at the outlet of the WWTP (data source: Nordwasser GmbH).
Besides emissions from the WWTP, the rainwater from the combined sewer system pollutes the receiving water with around 2.4 billion particles per year, while around 15.3 billion particles per year are carried into the watercourse by the wastewater (Table 2). The total input of the combined sewer system is thus 17.7 billion particles per year.
Based on Eq. 4 an annual total stormwater runoff of about 41 million m3/a was calculated (Table 3). The 24 tributaries contribute to an additional 91 billion MP particles per year due to runoff from industrial (14.3 km2), residential (21.4 km2), and traffic areas (18.5 km2). The individual contributions of the tributaries range from 1.6 million to 23 billion MPs per year at their mouth into the estuary (white points in Figure 2). Around 15% are released close to the weir, 32% at the western and 53% at the eastern sides of the estuary. As industrial areas are supposed to deliver high MP inputs per area according to Liu et al. (2019), especially the eastern tributaries account for high MP emissions in the estimation.
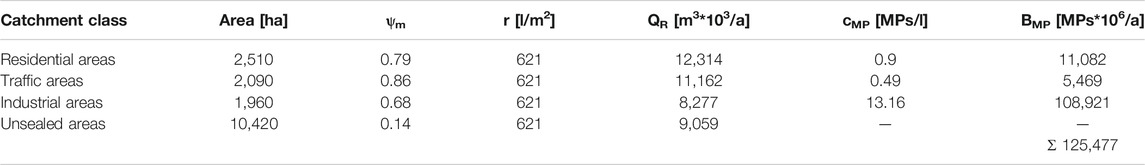
TABLE 3. Microplastic (MP) emission (BMP) due to stormwater runoff separated according to the catchment class. Accumulated results for the catchment area of the tributaries as well as areas connected to stormwater outlets (grey area Figure 2) are shown. Microplastic concentrations (cMP) were obtained from Liu et al. (2019). Runoff coefficients (ψm), annual rainfall (r), and rainfall runoff (QR).
In addition, 34.5 billion MP particles are potentially being directly discharged (grey area Figure 2) into the estuary through several stormwater outlets. From the resulting total annual emissions of 125.5 billion MPs, 73% are thus released by the tributaries and 27% through stormwater outlets distributed along the estuary.
River Catchment Microplastic Emissions
For the Warnow river, MP concentrations from 57 to 388 particles/m3 with a mean of 226.79 ± 119.39 and a median of 281 (IQR: 297–113) particles/m3 (size range 0.05–5 mm) were measured. Considering the size classes in MP river samples, more than 90% of MPs were <300 µm within the first sampling campaign in autumn 2018. In the second sampling campaign 63% of detected MPs exhibited sizes <300 μm and 30% were between 300–1,000 µm (Supplementary Information SI4). Polyolefins (PE and PP) dominated among detected polymer types (72%), followed by polystyrene (13%). Polyethylene terephthalate (8%), polyoxymethylene (4%) and silicone (2%) had a minor share and polymethyl methacrylate and PVC contributed with less than 1% among detected polymer types (Supplementary Information SI4).
Applying the C-Q model to daily discharge data for the years 2016–2018, average annual MP emission account for about 13 billion MPs with a daily average of about 36 million MPs being released into the estuary (Supplementary Information SI5). Highest average river discharge, and thus calculated MP emissions, was observed in 2017 (18.3 ± 8.4 m3/s), with high amounts of MPs being released during summer and October till December (Figure 4). In the years 2016 and 2018 monthly river discharge follows the generally observed pattern for the Warnow river (Pegelportal, 2020) with accordingly highest MP emissions calculated for January and February, thereafter decreasing until summer and starting to increase in autumn (Figure 4).
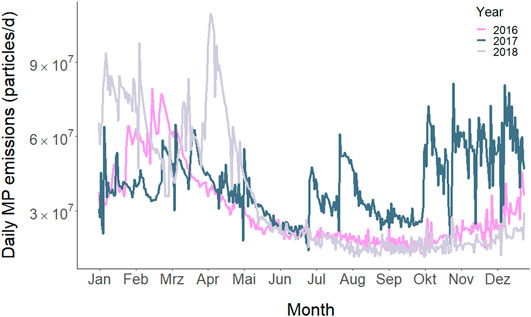
FIGURE 4. Daily microplastic (MP) emissions by the Warnow river into the estuary calculated based on a linear relationship (F = 11.04, adj. R2 = 0.6, p = 0.016; y = 132.41 + 18.62*x) of measured MP abundances in water surface (n = 8) and river discharge (data provided by Staatliches Amt für Landwirtschaft und Umwelt Mittleres Mecklenburg 2019).
Anti-fouling Paint Particle Emissions
For the considered 15 leisure boat facilities we estimated an annual emission of about 370 million AFPPs due to ISU, HPW, and MR. Thereof, 3% were released by presumably 1,625 permanent boats due to ISU during April and September. The majority was released by HPW after the season in November (1,274 boats) and due to MR work from November to March (50 and 47% respectively). Thus, areas where HPW is conducted depict potential spatio-temporal hotspots of AFPP release. Based on our assumptions there were no large differences between western and eastern sites of the estuary considering total AFPP emissions (42 and 58% of AFPP emissions; Supplementary Information SI6).
Applying the basic emission scenario for AFPP release during ISU from commercial shipping an annual emission of 4.4 billion AFPPs was estimated. Thereof, around 43 and 40% were released by tanker and cargo ships, 8% by ferries, and 6% by RoRo ships at the industrial port within the area of Breitling. Another 3% of AFPP emissions were released by cruise ships close to Warnemünde. Besides cruise ships, where the peak season is between May and September, a constant release of AFPPs can be assumed during the whole year for all other commercial ship types. For all scenarios it should be kept in mind that results are based on our assumptions and that the applied emission scenarios were calculated for idealized spherical AFPPs of 0.5 mm diameter (density 1.6 g/cm3).
Comparison of Emission Estimates and Potential Discharge to the Baltic Sea
A total discharge of about 291 billion MPs were estimated to enter the Warnow estuary annually. Thereof about 1.4% are emitted by the WWTP, 6.1% due to CSO emissions, 49.4% by the catchment of the Warnow river, and 43.1% due to stormwater discharges within the city area (Table 4).

TABLE 4. Annual microplastic (MP) emissions and percentage share of different sources and density classes. STW: stormwater, CSO: combined sewer overflows, WWTP: wastewater treatment plant, LD: low density MPs (<1.0 g/cm3), HD: high density MPs (>1 g/cm3).
Microplastic concentrations of WWTP influents (influencing CSO emission estimates), effluents and within STW, obtained as median value considering several studies, show highest variability from 93 to 134% respectively. Microplastic concentrations for the Warnow river catchment, exhibit considerably lower variability (CVM: 33%; Table 5).
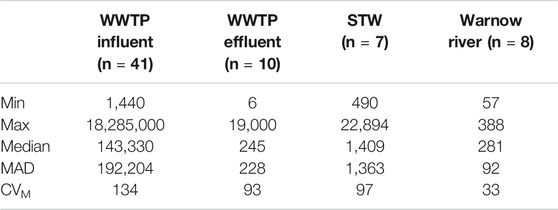
TABLE 5. Descriptive statistics for microplastic concentrations utilized for emission estimates. Data was obtained from the literature for wastewater treatment plant (WWTP) influents, effluents, and stormwater (STW). Microplastic concentration per m3. IQR: interquartile range, MAD: median absolute deviation, CVM: coefficient of variability for median. n: number of microplastic measurements.
Microplastics detected in the Warnow river samples were comprised of 72% LD and 28% HD polymers, with only small differences between sampling campaigns (Supplementary Information SI4). Low density polymers are also dominating in MP reports of stormwater runoff and combined sewer overflows. For stormwater runoff LD and HD polymers contribute to 81 and 19% respectively (Liu et al., 2019). Considering the mixing ratio of 11.68:1 for storm- and raw wastewater of the combined sewer system, a share of 76% for LD and 24% for HD polymers was calculated for CSO emissions (Supplementary Information SI1). For the MP composition within the effluent at the WWTP a detailed report on a plant with a tertiary treatment in Germany was utilized (Mintenig et al., 2014). Here a higher share of HD polymers (about 77%) was reported, which is in concordance with other reports (Sun et al., 2019).
In total, 75% of MPs released to the estuary belong to the class of LD-MPs and 25% to the class of HD-MPs (Table 4). Under the assumption that HD-MPs and 31% of LD-MPs are retained within the estuary (see Materials and Methods 2.5), about 152 billion MPs would be released into the Baltic Sea annually.
Discussion
Microplastic Emission Estimates Into the Estuary
Considering all limitations of our emission scenarios, about 291 billion MPs potentially enter the estuary annually. Thereby, the outlet of the WWTP has the lowest percentage of MP emissions (1.4%, Table 4), which is in line with previous studies (Simon et al., 2018; Conley et al., 2019). Calculated MP emissions due to CSOs (6.1%) are about five times higher and stormwater runoff from the city area of Rostock exhibits the highest percentage (43.1%) among sewer system emissions. The higher the retention of a compound within a WWTP, the more relevant are discharges due to CSOs and stormwater (Bollmann et al., 2019), which is in line for MPs with a retention by up to 99.9% for plants with tertiary treatment (Prata, 2018). A general seasonal pattern of MP emissions by WWTP outlets could not be detected by a comprehensive study of Conley et al. (2019). Instead, MP concentrations in effluents were found to vary by a factor of 4.8 over the course of the year. In our scenarios MP discharge by stormwater runoff and CSOs is related to precipitation and as a result MP emission for the Warnow estuary would be highest during summer month (Supplementary Information SI8). For stormwater runoff and CSOs other factors than precipitation could likewise influence temporal MP emissions. For example, precipitation pattern as well as deposition time before runoff will influence MP runoff from a surface to discharging natural and culture-technical waterways. Besides, particle retention within waterways will differ, which was not accounted for. In our scenarios data from one study reporting MP emissions separated by different land use categories (Liu et al., 2019) was used for MP emissions by stormwater runoff. Here MP emissions per area within the land use categories can vary over time and region. Our utilized MP values are rather conservative, considering reports of on average 7,713 to 111,000 MP/m3 (>20 µm) in stormwater (Bondelind et al., 2020). Further, tire and road wear particles which can exhibit a significant share were not included in the study by Liu et al. (2019) and are accordingly not represented by our results. When comparing MP emissions among sources the general high variability of MP concentrations has to be taken into account. In our scenarios utilized MP concentrations for raw wastewater (influencing CSO emission estimates) and WWTP effluent were highly variable (CVM: 134 and 93%) (Table 5). But even an increase of 93% of MP emissions for WWTP effluents and 134% for raw wastewater would not notably change the high share of stormwater and river catchment emissions which would still contribute with about 40 and 45% respectively.
Another relevant share of MP is very likely emitted by the catchment of the Warnow river (49.4%; Table 4) which discharges about 95% of river water into the estuary (Bachor 2005). The Warnow river discharge varied about 78% within the considered three years with a recorded minimum and maximum values of 0.03 and 60.97 m3/s respectively. Our in-situ measurements only covered river discharge values up to about 15 m3/s (Supplementary Information SI5). Due to high variability of MP concentrations for low flow conditions and a small number of measurements the C-Q relationship is not very robust and needs further validation. But in contrast to precipitation patterns in the city and thus MP discharge through stormwater runoff, highest mean annual discharge of the Warnow river is occurring during winter month (Pegelportal, 2020). An accordingly assumed higher probability of MP emissions agrees with predicted peak MP emissions for the northern hemisphere between January and April (Lebreton et al., 2017).
While our AFPP emission estimates are associated with highest uncertainty and provide qualitative rather than comparable quantitative information, they indicate the importance of this source for the estuary. In-service use (ISU) emissions by commercial shipping for example would result in an annual release of about 4.4 billion AFPPs. Total emissions of AFPP by leisure boats add to another 370 million AFPP according to our scenarios, which represent conservative estimates. Here it needs to be considered that the applied removal and emission factors for AFPPs were provided by experts over a decade ago and that their present-day validity needs further investigation. For comparison, an additional scenario was calculated based on the annual sales volume of AFP of 794 tons for leisure boats in Germany (and an emission factor of 50% during ISU (Daehne et al., 2017)). Considering the share of berth in the Warnow estuary of 0.79% and transferring this number to our scenario this would amount to about 3.7 billion AFPPs per year (Supplementary Information SI6). The example shows the high uncertainties associated with different assumptions. It should further be noted that a single estimate on plastic polymer content of a typical AFPP was used. Common commercial and leisure boat antifouling paint systems span a wide range of compositions, including several polymers in varying amounts as well as non-polymer-based matrices. Nevertheless, our estimates are again conservative considering the applied relatively large particle diameter of 0.5 mm. For example, if adjusting particle diameter to 0.1 mm the total release of AFPPs drastically increases to about 594 billion AFPPs per year. Although our AFPP emission scenarios only provide a very rough first estimation of this source, they are likewise able to provide spatial information on AFPP emissions (Supplementary Figure SI6).
Retention of Microplastics and Emission Potential to the Baltic Sea
According to our assumptions an estimated 152 to 291 billion MPs larger than 10 µm (majority <100 µm) are annually discharged from the Warnow estuary to the Baltic Sea.
Currently there is only limited information on MP retention within rivers and no comparable data for estuarine systems to the best of our knowledge. Besides particle characteristics (density, shape, size) and processes altering particle density (Rummel et al., 2017; Michels et al., 2018), the hydrology, morphology, and management of the estuary are important factors for MP retention.
For our study system there are several factors promoting the retention of MPs within the estuary. Deposited and/or sinking polymers are subjected to a predominating upward transport with higher saline bottom water under the general estuarine circulation pattern (Lange et al., 2020). Further river transport inland is prevented by a weir and in the city area close to the weir deposition of particles is promoted by decreased flow velocities (Rönspieß et al., 2020). In addition, floating MPs can be trapped within reed belts or retained due to deposition at riverbanks within the estuary. On the other hand, it has been reported that high amounts of MPs can be mobilized during storm events (Hurley et al., 2018; Hitchcock, 2020). Nevertheless, frequent dredging activities within the estuary to sustain the depth of shipping channels further indicate a net accumulation of particulate matter within the estuary.
Although there is a high probability that the HD-MPs and part of the LD-MPs are retained within the estuary, MPs <10 µm are currently not considered which would additionally contribute to MP emission numbers. Moreover, diffuse emission through for example aerial inputs or fragmentation of macroplastic were not accounted for within the current MP emission scenarios. Thus, the calculated 152 to 291 billion MPs entering the Baltic Sea annually provide a first reasonable estimate.
Besides, comparing our predicted MP emission estimates to the Baltic Sea with literature data yields a rather conservative estimate. For example, Zhao et al. (2019) estimated an annual discharge of 16–20 trillion MPs (>60 µm) from the Changjiang estuary to the ocean. Another study measuring a comparable size class of MPs (>20 µm) in the Nakdong River in South Korea report an annual discharge of 5.4–11 trillion MPs to the ocean (Eo et al., 2019). Dividing the values by the population of the Nakdong catchment results in an emission of 0.5–1.1 million MPs per capita per year which is in a comparable order of magnitude as compared to our calculation (388–746 thousand MPs per capita per year).
Practical Implications of Applied Emission Scenarios
To estimate and compare sewer system related MP emissions from the city area information on land use categories of the drained area in combination with corresponding runoff coefficients, MP concentrations, and amount of precipitation were combined (Table 6). With the applied routing-method (Supplementary Information SI3) spatially differentiated MP emission estimates by stormwater could be provided. The approach is transferable to other areas, provided that a coherent, hierarchical network of watercourses with associated subcatchments is available.
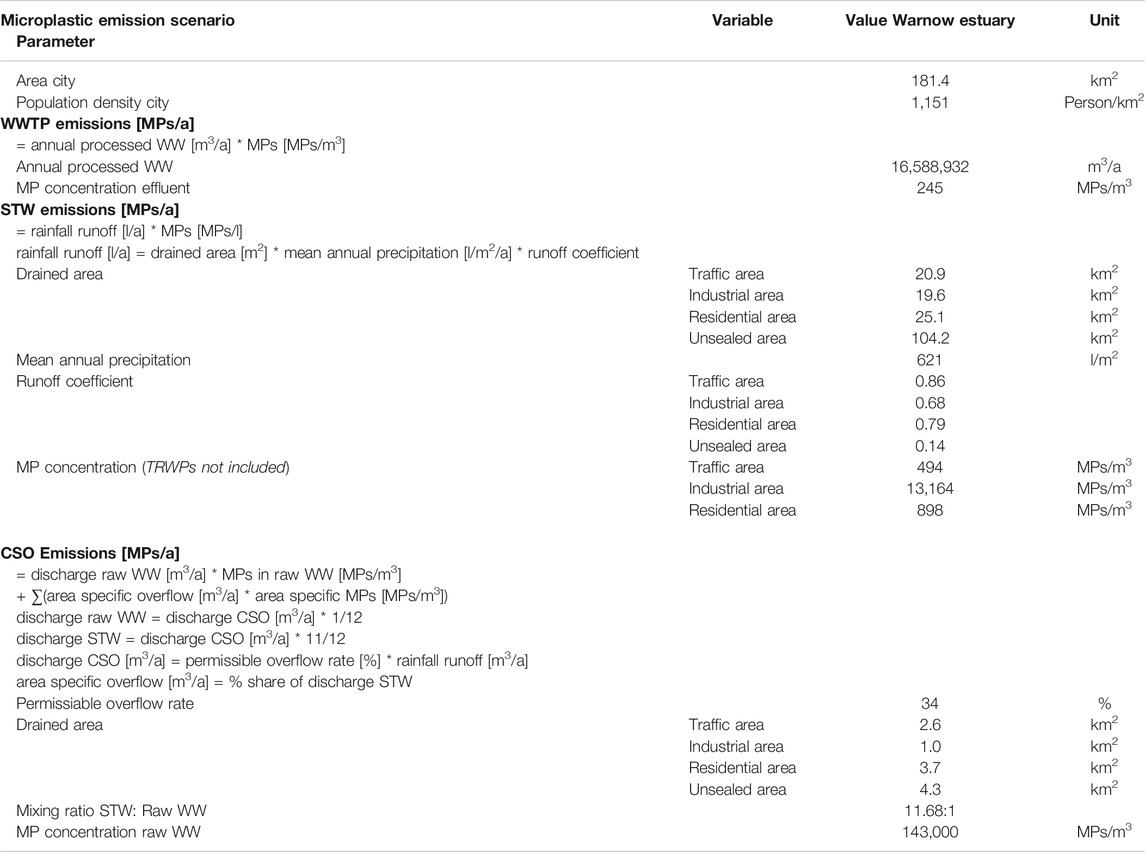
TABLE 6. Parameters for microplastic (MP) emission scenarios for the sewer system. WWTP: wastewater treatment plant, CSO: combined sewer overflow, STW: stormwater, WW: wastewater, TRWP: tire and road wear particles. Data sources for utilized MP concentrations are provided within Supplementary Table SI1).
Generally, precipitation seems to be a suitable proxy for temporal emissions of MPs from impervious surfaces. This is supported by a recent study, reporting a positive relationship between MP concentrations in an estuary and the average rainfall across previous five days (Hitchcock, 2020). For MP emission estimates through CSOs a permissible overflow rate was calculated based on German water management guidelines. In combination with the mixing ratio of discharged stormwater and raw wastewater (mixing ratio 11.68:1) comparable MP emissions could be calculated. Baresel and Olshammar (2019) calculated annual CSO by assuming a fraction of 1.5% of total WWTP inflows and assessed MP emissions by WWTPs and different CSO types. Results showed that weather induced CSO contributed to at least 18% to >50% of MP emissions to the Baltic Sea. Transferring this approach to the sewer system in Rostock would result in about two times higher annual inputs (37 billion MPs per year). In a study additionally considering stormwater MP emissions into the Baltic Sea, CSO emissions had the lowest contribution of MP discharge (Bollmann et al., 2019). And in contrast to our results, high amounts of MP were emitted by treated wastewater (WWTPs). The assumed high amount of treated wastewater discharge (about four times higher than untreated stormwater discharge) and a lower runoff coefficient for impervious surfaces by Bollmann et al. (2019) can explain the discrepancy. Stormwater discharge was about 2.5 times higher than processed wastewater discharge in our study. Moreover, area-specific runoff coefficients were utilized (Table 6) which is, considering potential local adaptions, recommended for future studies. Microplastic emissions are generally controlled by anthropogenic activities (Zhao et al., 2020). As those activities differ among land use, MP emissions should further be differentiated according to specific land use categories. The relevance of unsealed areas is still uncertain and despite the low runoff coefficient, meaning lower MP discharge, those areas contribute to the highest share, (e.g. ∼60% in the city area). However, for forst and agricultural soil a higher storage capacity as compared to urban soils has been postulated (Nizzetto et al., 2016) which needs further validation.
For the city area the calculated load of MPs per area would amount to about two billion MPs/km2/a accounting for traffic, industrial, and residential areas. For the Warnow catchment 3% (98 km2) of land use is urban area (Bauwe et al., 2019). Assuming a comparable share of catchment classes and population density this would amount to a calculated MP emission of about 200 billion MPs/a. At the weir MP concentration of about 144 billion MPs/a were estimated which is 28% less. This approximation is indeed very rough. But with knowledge on the share of catchment classes of urban areas and more robust data on MP concentration within the according runoff one could approximate retention within rivers.
To estimate river (micro) plastic emissions often mean or median (micro)plastic concentrations in conjunction with mean river discharge have been used (Lebreton et al., 2017; Atwood et al., 2019; Schöneich-Argent et al., 2020). Increased emissions of MPs with increased river discharge has been reported (Wagner et al., 2019) and for the rural Warnow river catchment we observed a significant linear C-Q relationship (p < 0.05). Opposed to our results, a C-Q relationship for the rural subcatchment in the study of Wagner et al. (2019) was not detected. The different results can be explained by different MP sampling and analysis techniques which were confined to three polymer types and a lower size limit of 0.5 mm (Wagner et al., 2019). Besides, varying characteristics of rivers and their catchment areas could lead to different results and thus, it needs further investigations on the transferability of C-Q relationships to other systems. A semi-log regression model exhibited a similar model fit (Supplementary Information SI5) but additional data covering a wider range of river discharge values would be needed to precisely describe the relationship between MP concentration and river discharge. An exponential or logarithmic increase of MP concentrations with river discharge seems likewise plausible. Higher flow velocities caused by higher discharge or floods can lead to a remobilization of MP within riverbed sediments (Hurley et al., 2018). In addition, increased flow velocities and water levels within a river course can result in remobilization of plastic litter from riverbanks (van Emmerik et al., 2019). High precipitation and following increased runoff from impervious surfaces of urban areas as well as additional wastewater discharges contribute to an increased MP emission into river systems. Yet, our approach accounts for the uncertainty of the Warnow river discharge which was highly variable among month (highest variability in 2018 from 82% in October to 12% in January). Nevertheless, to obtain information on temporal MP emission patterns we support previous suggestions by Wagner et al. (2019) to establish C-Q relationships as proxy to estimate river catchment plastic emissions. Thereby the whole size fraction of MPs as well as a broad range of discharge conditions should be covered.
Finally, combining information from our emission scenarios three potentially high influenced areas by MP emissions could be identified within the estuary (I) the area behind the weir due to emissions from the catchment and loadings of stormwater runoff from large industrial areas (∼18% of emissions from all tributaries) (II) the recreational city harbor receiving MPs from the CSO outlets and potential high inputs of AFPPs through several large leisure boat facilities, and (III) the area of Breitling within the northeastern part of the estuary due to high inputs of stormwater (∼51% of emissions from all tributaries) and potential MP emissions from the area of the industrial harbor as well as AFPP emissions from the high share of commercial shipping activities in this area (Figure 1).
Conclusion
Based on our combined approach major MP emissions into the Warnow estuary occur in the following order: stormwater and river catchment > CSO > WWTP. Keeping in mind differences among emission scenarios it still can be assumed that MP emissions by the city sewer system are likely as important as accumulated MP emissions by the catchment of the Warnow river. Furthermore, increased MP emissions from the river catchment probably occur during winter driven by higher water discharge, whereas higher MP emissions from the city sewer system are expected through higher precipitation during summer. Calculated annual MP discharges to the Baltic Sea ranged between 152 and 291 billion MPs whereas most uncertainty results from catchment emission scenarios as well as retention of MP particles within the estuary. A comparison of our MP emission estimates from the city sewer system with existing studies highlights the necessity to consider all components of a sewer system to gain a comprehensive knowledge on the importance of various MP sources and pathways.
Data Availability Statement
The original contributions presented in the study are included in the article/Supplementary Material, further inquiries can be directed to the corresponding author.
Author Contributions
SP and GS prepared the concept of the paper. All authors made substantial, direct, and intellectual contribution to the work and approved it for publication.
Funding
This research was funded by the German Federal Ministry of Education and Research (BMBF) project MicroCatch_Balt (03F0788A), and the BONUS MICROPOLL project supported by BONUS (Art 185), funded jointly by the European Union and BMBF (03F0775A).
Conflict of Interest
The authors declare that the research was conducted in the absence of any commercial or financial relationships that could be construed as a potential conflict of interest.
Acknowledgments
We like to thank Jens Tränckner and Kristina Enders for constructive discussions and comments on the manuscript as well as Anne Oelschner (Stalu-MM), Henri Hoche and Holger Stählke (Nordwasser GmbH), Ulrike Leppin, Ricarda Neumann, and Michael Jeschke (port authority) for providing data and information. Further we would like to thank the reviewers, helping to improve the quality of the manuscript through constructive comments and criticism.
Supplementary Material
The Supplementary Material for this article can be found online at: https://www.frontiersin.org/articles/10.3389/fenvs.2021.616765/full#supplementary-material.
References
Atwood, E. C., Falcieri, F. M., Piehl, S., Bochow, M., Matthies, M., Franke, J., et al. (2019). Coastal accumulation of microplastic particles emitted from the Po River, Northern Italy: comparing remote sensing and hydrodynamic modelling with in situ sample collections. Mar. Pollut. Bull. 138, 561–574. doi:10.1016/j.marpolbul.2018.11.045
Bachor, A. (2005). Nährstoff- und Schwermetallbilanzen der Küstengewässer Mecklenburg-Vorpommerns unter besonderer Berücksichtigung ihrer Sedimente. Greifswald: Landesamtes fur Umwelt Naturschutz und Geologie Mecklenburg-Vorpommern, 235.
Baresel, C., and Olshammar, M. (2019). On the importance of sanitary sewer overflow on the total discharge of microplastics from sewage water. J. Environ. Prot. 10, 1105–1118. doi:10.4236/jep.2019.109065
Bauwe, A., Eckhardt, K.-U., and Lennartz, B. (2019). Predicting dissolved reactive phosphorus in tile-drained catchments using a modified SWAT model. Ecohydrology and Hydrobiology 19, 198–209. doi:10.1016/j.ecohyd.2019.03.003
Bellasi, A., Binda, G., Pozzi, A., Galafassi, S., Volta, P., and Bettinetti, R. (2020). Microplastic contamination in freshwater environments: a review, focusing on interactions with sediments and benthic organisms. Environments 7, 30. doi:10.3390/environments7040030
Besseling, E., Quik, J. T., Sun, M., and Koelmans, A. A. (2017). Fate of nano- and microplastic in freshwater systems: a modeling study. Environ. Pollut. 220, 540–548. doi:10.1016/j.envpol.2016.10.001
Bollmann, U. E., Simon, M., Vollertsen, J., and Bester, K. (2019). Assessment of input of organic micropollutants and microplastics into the Baltic Sea by urban waters. Mar. Pollut. Bull. 148, 149–155. doi:10.1016/j.marpolbul.2019.07.014
Bondelind, M., Sokolova, E., Nguyen, A., Karlsson, D., Karlsson, A., and Björklund, K. (2020). Hydrodynamic modelling of traffic-related microplastics discharged with stormwater into the Göta River in Sweden. Environ. Sci. Pollut. Res. Int. 27, 24218–24230. doi:10.1007/s11356-020-08637-z
Brandt, J., Bittrich, L., Fischer, F., Kanaki, E., Tagg, A., Lenz, R., et al. (2020). High-throughput analyses of microplastic samples using fourier transform infrared and Raman spectrometry. Appl. Spectrosc. 74, 1185–1197. doi:10.1177/0003702820932926
Burns, E. E., and Boxall, A. B. A. (2018). Microplastics in the aquatic environment: evidence for or against adverse impacts and major knowledge gaps. Environ. Toxicol. Chem. 37, 2776–2796. doi:10.1002/etc.4268
Colton, J. B., Burns, B. R., and Knapp, F. D. (1974). Plastic particles in surface waters of the northwestern atlantic. Science 185, 491–497. doi:10.1126/science.185.4150.491
Conley, K., Clum, A., Deepe, J., Lane, H., and Beckingham, B. (2019). Wastewater treatment plants as a source of microplastics to an urban estuary: removal efficiencies and loading per capita over one year. Water Res. X 3, 100030. doi:10.1016/j.wroa.2019.100030
Cristaldi, A., Fiore, M., Zuccarello, P., Conti, G. O., and Grasso, A. (2020). Efficiency of wastewater treatment plants ( WWTPs ) for microplastic Removal : a systematic review. Int J Environ Res Public Health 17 (21), 8014. doi:10.3390/ijerph17218014
Cunningham, E. M., and Sigwart, J. D. (2019). Environmentally accurate microplastic levels and their absence from exposure studies. Integr. Comp. Biol. 59, 1485–1496. doi:10.1093/icb/icz068
Daehne, D., Fürle, C., Thomsen, A., Watermann, B., and Feibicke, M. (2017). Antifouling biocides in German marinas: exposure assessment and calculation of national consumption and emission. Integr. Environ. Assess. Manag. 13, 892–905. doi:10.1002/ieam.1896
Directive of the European Parliament (2008). Establishing a framework for Community action in the field of marine environmental policy (Marine Strategy Framework Directive). Official J. Eur. Union L164, 19–40.
DWA (1992). Arbeitsblatt ATV-A 128: richtlinien für die Bemessung und Gestaltung von Regenentlastungsanlagen in Mischwasserkanälen. Deutsche Vereinigung für Wasserwirtschaft, Abwasser und Abfall e. V.(London, United Kingdom: DWA).
DWA (2006). Arbeitsblatt 118: hydraulische Bemessung und Nachweis von Entwässerungssystemen. Deutsche Vereinigung für Wasserwirtschaft, Abwasser und Abfall e. V. (London, United Kingdom: DWA).
DWD (2020). Warnemünde. DWD – deutscher wetterdienst https://rcccm.dwd.de/DE/wetter/wetterundklima_vorort/mecklenburg-vorpommern/warnemuende/_node.html (German Weather Service) accessed on 07 23, 2020).
Enders, K., Käppler, A., Biniasch, O., Feldens, P., Stollberg, N., Lange, X., et al. (2019). Tracing microplastics in aquatic environments based on sediment analogies. Sci. Rep. 9, 15207. doi:10.1038/s41598-019-50508-2
Enders, K., Lenz, R., Ivar do Sul, J. A., Tagg, A. S., and Labrenz, M. (2020). When every particle matters: a QuEChERS approach to extract microplastics from environmental samples. MethodsX 7, 100784. doi:10.1016/j.mex.2020.100784
Eo, S., Hong, S. H., Song, Y. K., Han, G. M., and Shim, W. J. (2019). Spatiotemporal distribution and annual load of microplastics in the Nakdong River, South Korea. Water Res. 160, 228–237. doi:10.1016/j.watres.2019.05.053
Galafassi, S., Nizzetto, L., and Volta, P. (2019). Plastic sources: a survey across scientific and grey literature for their inventory and relative contribution to microplastics pollution in natural environments, with an emphasis on surface water. Sci. Total Environ. 693, 133499. doi:10.1016/j.scitotenv.2019.07.305
Geilfus, N. X., Munson, K. M., Sousa, J., Germanov, Y., Bhugaloo, S., Babb, D., et al. (2019). Distribution and impacts of microplastic incorporation within sea ice. Mar. Pollut. Bull. 145, 463–473. doi:10.1016/j.marpolbul.2019.06.029
Hansestadt Rostock (2019). Statistisches jahrbuch hansestadt Rostock 2019 https://rathaus.rostock.de/sixcms/media.php/rostock_01.a.4984.de/datei/_Statistisches%20Jahrbuch%202019.pdf (Accessed on 10 06, 2020)
Hitchcock, J. N. (2020). Storm events as key moments of microplastic contamination in aquatic ecosystems. Sci. Total Environ. 734, 139436. doi:10.1016/j.scitotenv.2020.139436
Hurley, R., Woodward, J., and Rothwell, J. J. (2018). Microplastic contamination of river beds significantly reduced by catchment-wide flooding. Nat. Geosci 11, 251–257. doi:10.1038/s41561-018-0080-1
Isobe, A., Iwasaki, S., Uchida, K., and Tokai, T. (2019). Abundance of non-conservative microplastics in the upper ocean from 1957 to 2066. Nat. Commun. 10, 13. doi:10.-019-0831610.1038/s41467-019-08316-9
KOGGE (2018). Kommunale Gewässer gemeinschaftlich Entwickeln. Ein Handlungskonzept für kleine urbane Gewässer am Beispiel der Hanse- und Universitätsstadt Rostock. Abschlussbericht des BMBF-Forschungsverbundprojektes KOGGE. Editors J. Tränckner, and A. Walter (Rostock, Germany: Universität Rostock. doi:10.18453/rosdok_id00002435
Kooi, M., and Koelmans, A. A. (2019). Simplifying microplastic via continuous probability distributions for size, shape, and density. Environ. Sci. Technol. Lett. 6, 551–557. doi:10.1021/acs.estlett.9b00379
Käppler, A., Windrich, F., Löder, M. G. J., Malanin, M., Fischer, D., Labrenz, M., et al. (2015). Identification of microplastics by FTIR and Raman microscopy: a novel silicon filter substrate opens the important spectral range below 1300 cm−1 for FTIR transmission measurements. Anal. Bioanal. Chem. 407, 6791–6801. doi:10.1007/s00216-015-8850-8
Lange, X., Klingbeil, K., and Burchard, H. (2020). Inversions of estuarine circulation are frequent in a weakly tidal estuary with variable wind forcing and seaward salinity fluctuations. J. Geophys. Res. Oceans 125. doi:10.1029/2019JC015789
Lebreton, L. C. M., van der Zwet, J., Damsteeg, J., Slat, B., Andrady, A., and Reisser, J. (2017). River plastic emissions to the world's oceans. Nat. Commun. 8, 15611. doi:10.1038/ncomms15611
Lenz, R., and Labrenz, M. (2018). Small microplastic sampling in water: development of an encapsulated filtration device. Water 10, 1055. doi:10.3390/w10081055
Leslie, H. A., Brandsma, S. H., van Velzen, M. J., and Vethaak, A. D. (2017). Microplastics en route: field measurements in the Dutch river delta and Amsterdam canals, wastewater treatment plants, North Sea sediments and biota. Environ. Int. 101, 133–142. doi:10.1016/j.envint.2017.01.018
Li, J., Liu, H., and Paul Chen, J. (2018). Microplastics in freshwater systems: a review on occurrence, environmental effects, and methods for microplastics detection. Water Res. 137, 362–374. doi:10.1016/j.watres.2017.12.056
Liu, F., Olesen, K. B., Borregaard, A. R., and Vollertsen, J. (2019). Microplastics in urban and highway stormwater retention ponds. Sci. Total Environ. 671, 992–1000. doi:10.1016/j.scitotenv.2019.03.416
Lorentz, A., Düring, I., and Moldenhauer, H. (2014). Immissionssituation Hafen Rostock 2012. Luftschadstoffgutachten. Report of the engineering office Lohmeyer GmbH & Co. KG on behalf of the Landesamt fur Umwelt, Naturschutz und Geologie Mecklenburg-Vorpommern (LUNG). 48.
Michels, J., Stippkugel, A., Lenz, M., Wirtz, K., and Engel, A. (2018). Rapid aggregation of biofilm-covered microplastics with marine biogenic particles. Proc. Biol. Sci. 285, 20181203. doi:10.1098/rspb.2018.1203
Miller, A. W., Davidson, I. C., Minton, M. S., Steves, B., Moser, C. S., Drake, L. A., et al. (2018). Evaluation of wetted surface area of commercial ships as biofouling habitat flux to the United States. Biol. Invasions 20, 1977–1990. doi:10.1007/s10530-018-1672-9
Mintenig, S., Löder, M., and Gerdts, G. (2014). “(OOWV) in niedersachsen. Alfred-Wegener-Instituts (AWI),” in Mikroplastik in ausgewählten Kläranlagen des Oldenburgisch- Ostfriesischen Wasserverbandes. Int-Veen IFinal report for the Oldenburgisch- Ostfriesischer Wasserverband (OOWV) Niedersächsischer und des Niedersächsischer Landesbetrieb für Wasserwirtschaft, Küsten- und Naturschutz (NLWKN), 18.
Morris, A. W., and Hamilton, E. I. (1974). Polystyrene spherules in the bristol channel. Mar. Pollut. Bull. 5, 26–27. doi:10.1016/0025-326X(74)90311-7
Nizzetto, L., Bussi, G., Futter, M. N., Butterfield, D., and Whitehead, P. G. (2016). A theoretical assessment of microplastic transport in river catchments and their retention by soils and river sediments. Environ. Sci. Process. Impacts 18, 1050–1059. doi:10.1039/C6EM00206D
OECD (2005). Emission scenario document on antifouling productsSeries on emission scenario documents. Paris, France: OECD Environment Directorate, Environment, Health and Safety Division No. 13 www.oecd.org/ehs/, ENV/JM/MONO(2005)8.
OECD (2009). Emission scenario documents on coating industry (Paints, Laquers and Varnishes). Series on emission scenario documents, Paris, France: OECD Environment Directorate, Environment, Health and Safety Division No. 22. ENV/JM/MONO, 24 www.oecd.org/ehs/.
OpenDataHRO (2019). Hanse- und Universitätsstadt Rostock https://www.opendata-hro.de/ (Accessed on 01 23, 2019).
Pegelportal, M-V. (2020). Landesamt für Umwelt, Naturschutz und Geologie Mecklenburg-Vorpommern https://pegelportal-mv.de/pdf/pegelsteckbrief_04402.2.pdf (Accessed on 10 06, 2020).
PLANCO (2004). Standortkonzepte für Sportboothäfen an der Ostseeküste. Planco-Consultig GmbH Schwerin. Ministerium für Arbeit, Bau und Landesentwicklung Mecklenburg-Vorpommern (Hrsg). Schwerin, Germany, 238pp.
Prata, J. C. (2018). Microplastics in wastewater: state of the knowledge on sources, fate and solutions. Mar. Pollut. Bull. 129, 262–265. doi:10.1016/j.marpolbul.2018.02.046
Resolution, U. N. (2020). Transforming our world: the 2030 agenda for sustainable development. New York, NY, United States: United Nations.
Rezania, S., Park, J., Md Din, M. F., Mat Taib, S., Talaiekhozani, A., Kumar Yadav, K., et al. (2018). Microplastics pollution in different aquatic environments and biota: a review of recent studies. Mar. Pollut. Bull. 133, 191–208. doi:10.1016/j.marpolbul.2018.05.022
Rönspieß, L., Dellwig, O., Lange, X., Nausch, G., and Schulz-Bull, D. (2020). Spatial and seasonal phosphorus dynamics in a eutrophic estuary of the southern Baltic Sea. Estuarine, Coastal Shelf Sci. 233, 106532. doi:10.1016/j.ecss.2019.106532
Rossman, L. A. (2015). Storm water management model user’s manual. Cincinnati, OH, United States: U.S. Environmental Protection Agency.Version 5.1.
Rummel, C. D., Jahnke, A., Gorokhova, E., Kühnel, D., and Schmitt-Jansen, M. (2017). Impacts of biofilm formation on the fate and potential effects of microplastic in the aquatic environment. Environ. Sci. Technol. Lett. 4, 258–267. doi:10.1021/acs.estlett.7b00164
Schernewski, G., Paysen, P., Robbe, E., Inácio, M., Schumacher, J., and Lillebø, A. I. (2019). Ecosystem service assessments in water policy Implementation : an analysis in urban and rural estuaries. Front. Mar. Sci. 6, 1–17. doi:10.3389/fmars.2019.00183
Schmidt, C., Krauth, T., and Wagner, S. (2017). Export of plastic debris by rivers into the sea. Environ. Sci. Technol. 51, 12246–12253. doi:10.1021/acs.est.7b02368
Schöneich-Argent, R. I., Dau, K., and Freund, H. (2020). Wasting the North Sea?—a field-based assessment of anthropogenic macrolitter loads and emission rates of three German tributaries. Environ. Pollut. 263, 114367. doi:10.1016/j.envpol.2020.114367
Sharma, S., and Chatterjee, S. (2017). Microplastic pollution, a threat to marine ecosystem and human health: a short review. Environ. Sci. Pollut. Res. Int. 24, 21530–21547. doi:10.1007/s11356-017-9910-8
Sherman, P., and van Sebille, E. (2016). Modeling marine surface microplastic transport to assess optimal removal locations. Environ. Res. Lett. 11, 014006. doi:10.1088/1748-9326/11/1/014006
Siegfried, M., Koelmans, A. A., Besseling, E., and Kroeze, C. (2017). Export of microplastics from land to sea. A modelling approach. Water Res. 127, 249–257. doi:10.1016/j.watres.2017.10.011
Simon, M., van Alst, N., and Vollertsen, J. (2018). Quantification of microplastic mass and removal rates at wastewater treatment plants applying Focal Plane Array (FPA)-based Fourier Transform Infrared (FT-IR) imaging. Water Res. 142, 1–9. doi:10.1016/j.watres.2018.05.019
Soroldoni, S., Castro, Í. B., Abreu, F., Duarte, F. A., Choueri, R. B., Möller, O. O., et al. (2018). Antifouling paint particles: sources, occurrence, composition and dynamics. Water Res. 137, 47–56. doi:10.1016/j.watres.2018.02.064
Sun, J., Dai, X., Wang, Q., van Loosdrecht, M. C. M., and Ni, B. J. (2019). Microplastics in wastewater treatment plants: detection, occurrence and removal. Water Res. 152, 21–37. doi:10.1016/j.watres.2018.12.050
Sundt, P., Schulze, P. E., and Syversen, F. (2014). Sources of microplastics-pollution to the marine environment. Asker, Norway: Norwegian Environment AgencyMepex Consult. 86.
Szymczycha, B., Zaborska, A., Bełdowski, J., Kuliński, K., Beszczyńska-Möller, A., Kędra, M., et al. (2019). Chapter 4—the Baltic Sea. World seas: an environmental evaluation. Editor C. Sheppard 2nd ed. (Cambridge, MA, United States: Academic Press), 85–111.
Uddin, S., Fowler, S. W., and Behbehani, M. (2020). An assessment of microplastic inputs into the aquatic environment from wastewater streams. Mar. Pollut. Bull. 160, 111538. doi:10.1016/j.marpolbul.2020.111538
van Emmerik, T., Tramoy, R., van Calcar, C., Alligant, S., Treilles, R., Tassin, B., et al. (2019). Seine plastic debris transport tenfolded during increased river discharge. Front. Mar. Sci. 6, 1–7. doi:10.3389/fmars.2019.00642
van Wijnen, J., Ragas, A. M. J., and Kroeze, C. (2019). Modelling global river export of microplastics to the marine environment: sources and future trends. Sci. Total Environ. 673, 392–401. doi:10.1016/j.scitotenv.2019.04.078
Wagner, S., Klöckner, P., Stier, B., Römer, M., Seiwert, B., Reemtsma, T., et al. (2019). Relationship between discharge and river plastic concentrations in a rural and an urban catchment. Environ. Sci. Technol. 53, 10082–10091. doi:10.1021/acs.est.9b03048
Wang, W., Gao, H., Jin, S., Li, R., and Na, G. (2019). The ecotoxicological effects of microplastics on aquatic food web, from primary producer to human: a review. Ecotoxicol. Environ. Saf. 173, 110–117. doi:10.1016/j.ecoenv.2019.01.113
WASSER (2005). Länderarbeitsgemeinschaft Wasser. Richtlinie für die Gebiets- und Gewässerverschlüsselung. Berlin, Germany: Kulturbuch-Verl.
Wasserbuch, M-V. (2019). Landesamt für Umwelt, Naturschutz und Geologie Mecklenburg-Vorpommern (LUNG) https://www.geoportal-mv.de/portal/Geowebdienste/Fachthemen/Wasser (Accessed via GeoPortal.MV on 03 18, 2019).
Watermann, B., Daehne, D., Fürle, C., and Thomsen, A. (2014). Sicherung der Verlässlichkeit der Antifouling-Expositionsschätzung im Rahmen des EUBiozid-Zulassungsverfahrens auf Basis der aktuellen Situation in deutschen Binnengewässern für die Verwendungsphase im Bereich Sportboothäfen, Dessau-Roßlau, Germany: Umwelt Bundesamt, 160.
Watermann, B., and Eklund, B. (2019). Can the input of biocides and polymeric substances from antifouling paints into the sea be reduced by the use of non-toxic hard coatings?. Mar. Pollut. Bull. 144, 146–151. doi:10.1016/j.marpolbul.2019.04.059
WSV (2019). Planunterlagen—anpassung der seewärtigen Zufahrt zum Seehafen Rostock—baggergutverbringungskonzept.Stralsund, Germany: Waterways and Shipping Administration (WSV).
Wu, P., Huang, J., Zheng, Y., Yang, Y., Zhang, Y., He, F., et al. (2019). Environmental occurrences, fate, and impacts of microplastics. Ecotoxicol. Environ. Saf. 184, 109612. doi:10.1016/j.ecoenv.2019.109612
Zhao, S., Wang, T., Zhu, L., Xu, P., Wang, X., Gao, L., et al. (2019). Analysis of suspended microplastics in the Changjiang Estuary: implications for riverine plastic load to the ocean. Water Res. 161, 560–569. doi:10.1016/j.watres.2019.06.019
Keywords: microplastic, warnow estuary, baltic sea, sewer system, emission estimates, combined sewer overflow, anti-fouling paint particles
Citation: Piehl S, Hauk R, Robbe E, Richter B, Kachholz F, Schilling J, Lenz R, Fischer D, Fischer F, Labrenz M and Schernewski G (2021) Combined Approaches to Predict Microplastic Emissions Within an Urbanized Estuary (Warnow, Southwestern Baltic Sea). Front. Environ. Sci. 9:616765. doi: 10.3389/fenvs.2021.616765
Received: 13 October 2020; Accepted: 01 February 2021;
Published: 29 March 2021.
Edited by:
André Ricardo Araújo Lima, Center for Marine and Environmental Sciences (MARE), PortugalReviewed by:
Bruno Tassin, École des ponts ParisTech (ENPC), FranceLixin Zhu, East China Normal University, China
Copyright © 2021 Piehl, Hauk, Robbe, Richter, Kachholz, Schilling, Lenz, Fischer, Fischer, Labrenz and Schernewski. This is an open-access article distributed under the terms of the Creative Commons Attribution License (CC BY). The use, distribution or reproduction in other forums is permitted, provided the original author(s) and the copyright owner(s) are credited and that the original publication in this journal is cited, in accordance with accepted academic practice. No use, distribution or reproduction is permitted which does not comply with these terms.
*Correspondence: Sarah Piehl, sarah.piehl@io-warnemuende.de