Sustainable development efficiency and its influencing factors across BRICS and G7 countries: An empirical comparison
 Shixiong Cheng1,2†
  Amsalu K. Addis
- 1Business School, Hubei University, Wuhan, China
- 2Open Economy Research Center, Hubei University, Wuhan, China
- 3School of Economics and Management, Fuzhou University, Fuzhou, China
Sustainable development is the global overarching paradigm and essential for achieving economic, social, and environmental development. The primary goal of this study is to compare the efficiency of sustainable development and evaluate its influencing factors across the BRICS (Brazil, Russia, India, China, and South Africa) and G7 (Canada, France, Germany, Italy, Japan, the United Kingdom, and United States) countries by examining total factor productivity, efficiency change, and technological change. For this, we adopted the super-efficiency SBM-DEA model with undesirable output and Global Malmquist-Luenberger (GML) productivity index model to overcome inaccurate efficiency results while avoiding environmentally unwanted outputs and to resolve the shortcomings of the conventional Malmquist-Luenberger index. It is also necessary to explore relevant influencing factors on the environmental pollution thereby affects the sustainable development efficiency of the study countries, thus, this study employed STIRPAT approach. A panel data of BRICS and G7 countries from 2005 to 2015 is used. The findings reveal that sustainable total factor productivity (GML) in China (1.0165), the US (1.0150), and UK (1.0024) is on the rise. China is also one of the countries that experienced the highest positive efficiency change (GMLEC) (1.0147) and the US has the highest positive technical change (GMLTC) (1.0103). Contrarily, Russia experienced the highest decline in GMLTC (0.9316) as well as GML indexes (0.9337), whereas South Africa experienced the highest decline in GMLEC (0.9707). Additionally, GDP per capita (.0969) and population (.4178) have a positive influence on CO2 emissions in the BRICS countries, whereas in the G7 nations, GDP per capita (−.2180) and population (−.1249) have negative influences on CO2 emissions. The study also offers practical recommendations to address identified limitations and improve sustainable productivity and environmental efficiency. The inverse link between GDP and CO2 emissions might imply that the G7 nations have passed the turning point on an environmental Kuznets curve (EKC), but this finding does not support the EKC hypothesis in the BRICS nations.
1 Introduction
Sustainable development is the global overarching paradigm, and it is increasingly being portrayed as a road to a shared future that is desirable to all society without compromising future generations’ capabilities (Brundtland, 1985). It is required to achieve national and global economic, environmental, and social development. The concept of sustainable development can be traced back to the world nature conservation outline published by the World Commission on Environment and Development (Brundtland, 1985). Sustainable development comprises four interwoven dimensions, such as society, culture, environment, and economy (Parris and Kates, 2003). Sustainability is a method of looking forward to that balances environmental, societal, and economic issues in the pursuit of a greater quality of life. A prosperous society, for example, relies on a healthy environment to provide its citizens with food and resources, safe drinks, and clean air. In terms of the sustainable development goals, according to (Sachs et al., 2021), the majority of developed economic nations, notably the G7 [Canada, France, Germany, Italy, Japan, the United Kingdom (UK), and the United States (US)], are among the top 30 countries that meet the sustainable development objectives. On the contrary, the BRICS (Brazil, Russia, India, China, and South Africa) nations lag well behind the G7 in terms of achieving sustainable development targets. Is there, however, a global consensus on how to measure and characterize sustainable development? What are the internationally recognized sustainable development indicators for tracking economic progress toward sustainability goals and comparing country performance?
In reference to economy, the Group of Seven (G7) nations are the world’s seven largest and most developed industrial countries, commonly known as the wealthy country club, whereas the BRICS nations are a representative of emerging economies and a leader of developing countries with the largest development potential (Anand et al., 2020). These two nation alliances have a significant effect on the globe today and in the future. As a result, a comparative examination of their economic progress toward sustainability has substantial theoretical and empirical implications.
The term BRIC is derived from a research report undertaken in 2001 by British economist Jim O'Neill, head of global economic research at Goldman Sachs (O’Neill, 2001). Since then, the world community has paid close attention to the BRIC coalition’s collaboration. The BRIC idea was initially developed as part of an economic modeling method to anticipate global economic development (Armstrong, 2010). O'Neill perceived that the BRIC economies expanded quickly, and predicted their economic momentum will come to dominate the world economy by 2050 (Wilson and Purushothaman, 2006). He speculated that the global growth pattern would inevitably shift during the next few decades. Some inferred that the G7 countries’ representative composition as the largest economy would be supplanted by the BRICs, and the global economy’s pattern would change (Wilson and Purushothaman, 2006). Others say that the BRICS are still emerging economies with little in common, in addition to their inability and unwillingness to serve as key global actors (Carmody, 2019), and that are they still not formally organized, let alone institutionalized (Bratersky, 2020). There are still scholars that question the induction of South Africa into the BRIC member.
Incidentally, the third BRIC summit was held in Sanya, China’s Hainan Province, in 2011; the BRIC acronym was subsequently expanded to BRICS to include South Africa. These five nations have piqued the international community’s interest not just for their consistent economic development, but also for reforming existing international organizations and changing the global landscape (Wilson and Purushothaman, 2006; Gautam and Sharan, 2019). Despite their immense growth potential, the BRICS nations confront a significant challenge in developing a cohesive group strategy due to the political, economic, and social diversity of their members (Anand et al., 2020; Zondi, 2022). Nevertheless, the induction of South Africa as a new member broadens the BRICS’ impact over four continents and strengthens the group’s multi-polarity. However, whether by consensus or for other reasons, South Africa’s accession to the membership has remained a mystery for many. Furthermore, unlike Brazil, Russia, India, and China, South Africa’s economy (Carmody, 2019), technological gap (Chang and Hu, 2019), and national innovation systems (Cai, 2011) have continually lagged. For example, South Africa’s GDP in 2014 was over a quarter of Russia (Lowe, 2016), and according to World development indicators (WDI) 2022 report Brazil, Russia, India, and China’s GDP in 2018 was over 4, 4, 6, and 34-fold of South Africa, respectively. Regardless, South Africa has the African continent’s third-largest and most stable economy, and it serves as the BRIC nations’ geographical gateway to Africa (Carmody, 2019).
The concept of the G7 originally evolved in the early 1970s as an informal gathering to discuss the then-current recession and oil crises. The 1975 summit was first attended by a group of six (G6) countries. It was not until 1976, when Canada joined the alliance, that the name was changed to G7 and it became more institutionalized (Mostafa and Mahmood, 2015). The G7 summit initially focused on economic cooperation, which became the prevailing subject of the summit. Since the 1980 summit, the agenda has diversified from discussing the economies to addressing both the economies and politics. The summit’s subjects have increasingly grown over time, and topics such as environmental preservation have been covered. The G7’s principal goal is to discuss and, on occasion, act in unison to help resolve global concerns, with a particular emphasis on economic difficulties. Since its foundation, the group has examined significant worldwide issues such as economic recession, monetary systems, environmental crises, financial crises, and oil shortages.
The end of the Cold War was not only a huge turning moment in the course of world history, but it was also a turning point in the G7 summit. Furthermore, with the acceleration of globalization, the G7 conference was confronted with progressive challenges in global governance. Under such circumstances, the G7 summit was acutely aware of its own weakness and the urgent need to recruit new members in order to carry out economic reforms and restore the pride of a great power. The admission of Russia as a full member in 1998 established a formal group of eight (G8). However, the G8 was short-lived because Russia was suspended from membership in 2014 owing to political actions. Because the member nations’ national interests are objectively different, tension between the member countries is unavoidable, and it sometimes even intensifies. Discordant opinions have occasionally surfaced about the topic of supremacy; the United States has naturally assumed the leadership position due to its comprehensive strength but still seeks the support of European nations. In general, the G7 has gone through five stages, such as emergence, evolution, expansion, supremacy, and expulsion.
Incidentally, with the development of the global economy, people’s quality of life is increasingly improving. However, behind people’s increasing quality of life, there is an imbalance in ecology and the deterioration of the environment. Similarly, economic expansion is accompanied by excessive resource consumption, ecological damage, and environmental degradation under the conventional development model (Khan and Cui, 2022). The continuous exploitation of resources and environmental pollution not only affect the long-term economic development capacity of countries, but also threaten the survival of the entire human race. Consequently, economic development and environmental construction should be synchronized, and the economic benefits, ecological benefits and social benefits should be consolidated to ensure the implementation of the sustainable development strategy (See Figure 1 below). According to recent studies, research on sustainable development is at an all-time high, which helps in reducing the impact on the environment and achieving long-term low-carbon economic growth (Parris and Kates, 2003; Barykina et al., 2022; Camioto and Pulita, 2022). A sustainable development strategy must achieve at least two objectives, namely, zero growth in energy consumption and zero growth in ecological degradation. This study was commissioned to empirically identify the efficiency of sustainable development and evaluate its influencing factors across the BRICS and G7 countries.
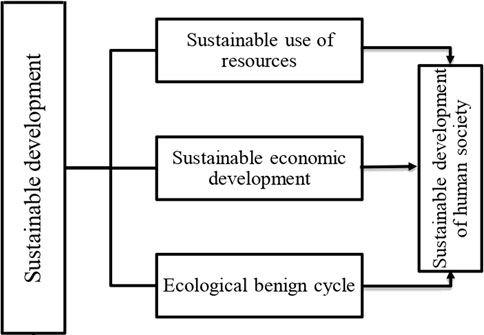
FIGURE 1. Overview of sustainable development theory.
The comparative instrumental technique is used in this study. It portrays a comparative track record of the BRICS and G7 sustainable development in the study period. The BRICS and G7 are chosen for three reasons in this analysis. First, in comparison to other nations, the BRICS have distinct advantages in terms of enormous arable land, rich resource endowment, large number of inexpensive labors, significant market demand, and thus attracted a considerable amount of FDI (Nistor, 2015); whereas the G7 countries have the world’s largest geopolitical power and most developed economies. Second, the BRICS are the most representative of developing and emerging nations, and their economic levels, development potential, and development models are comparable (Bratersky, 2020). The G7 countries, on the other hand, are the world’s most developed economies and have certain commonalities in terms of economic level, potential, and model. As a result, the economies of the BRICS have grown tremendously in recent years and over the coming decades, they are expected to develop substantially faster than the G7 (Hawksworth and Chan, 2013). Third, the BRICS are all undergoing significant economic restructuring and transition, which attracts much attention.
The aim of this study is to assess, analyze and provide fundamental evidence concerning sustainable development efficiency and its influencing factors across BRICS and G7 countries comparatively by employing three different methodologies. There are two primary reasons for studying this topic. First, there has been little work done using the methodology that this study follows to analyze and suggest ways to improve the productivity of the sample countries. Second, it provides a better understanding of the real contribution of technical efficiency and technological change to productivity growth, and evaluates the influencing factors.
2 Literature review
Since the end of World War II, all nations’ living standards have generally improved, although the degree of development is asymmetric. A country’s level of prosperity is determined not only by changes in the absolute amount of its per capita national income, but also by the ratio of its per capita national income to the global average. Furthermore, the economic gap between developed and developing countries has expanded. With few exceptions, impoverished countries throughout the world have either remained poor. Rich countries, on the other hand, grew affluent via industrialization and economic diversification. It is believed that industrialization in economically advanced countries has exacerbated conditions in certain developing countries (Reinert, 2008). Consequently, economic warnings, financial crises, energy shortages, and environmental catastrophes were almost exclusively issued by wealthier countries such as the G7 to the rest of the developing countries across the world. However, in recent years, rising powers such as the BRICS have grown increasingly strong in terms of energy intensity (Chiu et al., 2022), energy usage (Chang and Hu, 2019), global average efficiency (Camioto and Pulita, 2022), developing economic potential (Mostafa and Mahmood, 2015), natural resources (Nistor, 2015), innovation (Gautam and Sharan, 2019), and international affairs. They are gaining economic power and are substantially wealthier than previously.
As a result, for many Western multinational corporations focused on global growth, BRICS represents both the biggest challenge (Mostafa and Mahmood, 2015) and an opportunity (Gautam and Sharan, 2019). Some study reports theorized and/or speculated that the Western world is no longer the leader in the global energy business, but has been surpassed by the BRICS (Downie, 2015; Mostafa and Mahmood, 2015). The global energy industry is responsible for providing many essential necessities, such as power, heat, and fuel. The global era has raised the demand for a reliable, sustainable, and cost-effective energy supply across nations. The energy industry provides substantial challenges to governments and is at the heart of a fierce global power struggle. Energy is a crucial strategic, political, economic, national, and global tool having the potential to modify the long-term positions of enterprises and governments. The BRICS are often seen as having the potential to influence global energy policy reform (Downie, 2015). China, according to current studies, is a major player in the global economy. GDP growth in the BRICS is outpacing that of the G7 (Ratti and Vespignani, 2016). As a result, the BRICS are a more appealing destination for financial flows than the G7 as a whole (Gautam and Sharan, 2019; Pradhan et al., 2022). Accordingly, if investors and businesses are not fully aware of the BRICS’ expanding power, they may miss out on lucrative investment possibilities or competitive advantages (Gautam and Sharan, 2019).
Furthermore, in terms of oil pricing and economic activity, the BRICS shared 15% of world oil consumption in 1990, and the amount had raisn to 25% by 2016 (Rodionova et al., 2018; Kilic and Cankaya, 2020). Contrarily, during this period, the G7’s share of global oil consumption declined from 48% to 34%. When comparing countries, Kilic and Cankaya (2020) discovered that China saw the most significant expansion, increasing its oil consumption by 439%. They stated that, with the exception of the United States and Canada, all G7 countries saw negative growth from 1990 to 2016 (Kilic and Cankaya, 2020). Regarding market value, following the end of the first Gulf War in 1991, more than half of the world’s top 20 energy enterprises were United States enterprises, while 45% were European (Brown and Garten, 1994). In 2007, the BRICs accounted for 35% of the top 20 energy enterprises, another 35% were European enterprises, and the percentage of United States enterprises had declined to around 30% (Lowe, 2016). Similarly, in terms of energy consumption, the BRICS accounted for more than 35% of global energy consumption and 35% of primary energy output in 2018 (Barykina et al., 2022). The BRICS are expected to account for over 40% of global energy consumption and primary energy output, respectively, by 2040 (Barykina et al., 2022). Moreover, in terms of the world’s wind energy consumption and solar energy consumption, the BRICS accounted for 31% and 25%, respectively, in 2016 (Rodionova et al., 2018). The BRICS nations also account for more than 42% of the global population, whereas the G7 countries account for only 11% (Kilic and Cankaya, 2020). Furthermore, the BRICS have a large market demand and resource, a young and inexpensive labor force, and other incentives, which attracted 35% more FDI than the G7 nations in 2015 (Nistor, 2015; Pradhan et al., 2022).
Far less emphasis has been placed on the influence of sustainable development efficiency factors on economic progress and environmental degradation based on determinants such as social, environmental, and economic considerations. The notion of sustainable development can be traced back to the Brundtland Commission of the United Nations (Brundtland, 1985). So far, there is no commonly agreed definition of sustainable development (Parris and Kates, 2003); nevertheless, the UN Brundtland commission defines sustainable development as “meeting the requirements of the present without jeopardizing future generations’ ability to fulfill their own needs” (Brundtland, 1985). Moreover, the concept of sustainable development focuses on the basic needs of people across the world, and it should be given special consideration to contemplate the limitations, technological situation, and restrictions imposed by social organizations on the environment’s ability to meet immediate and future needs. This notion also necessitates the international community to achieve sustainable development by limiting population growth (society), safeguarding the resource base (environment), and generating renewable energy (economy). As a result, researchers must explore the fundamental links between society, environment, and economy in order to achieve global sustainable development.
Despite the fact that there are no standard sustainable development indicators for tracking economic progress toward sustainability goals (Parris and Kates, 2003), numerous experts assess and contrast sustainable development performances among countries (Tsai et al., 2016). Traditional comparison and prediction methods are based on absolute values, which have a substantial prediction error owing to the effects of the economic cycle, inflation, carbon emissions, and exchange rate fluctuation (McKenzie, 2011). Moreover, the traditional DEA, which many scholars employed to analyze and optimize the sustainable development efficiency, is a radial model that does not take into account the impact of slack variables on the evaluated result. Hence, (Tone, 2001) suggested a slack-based measurement DEA (SBM-DEA) model to address the slack issues of input and output. Consequently, a plethora of scholars followed the SBM-DEA model to evaluate energy efficiency (Zheng, 2021), explore the impact of the quality of FDI on energy efficiency (Pan et al., 2020), assess educational efficiency across the world (Chen and Liu, 2022), compute the effect of industrial agglomeration on green development efficiency (Guo et al., 2020), analyze social organization performance (Shao et al., 2021), etc.
However, although the SBM-DEA model offers several benefits, it has been discovered that in practice, this model’s evaluation findings are not accurate enough. Furthermore, undesirable outputs are frequently generated alongside desirable outputs, although this is generally overlooked in traditional metrics of productivity. In order to solve the slack issue of input-output variables and accurately measure the efficiency considering carbon emissions, which the SBM-DEA model could not propos, al alternatie SBM-DEA approach with undesirable output was needed. Moreover, the model can help in analyzing the redundancy of input-output variables. Following, a multitude of scholars employed the proposed approach to analyze the energy saving potential and energy structure of BRICS countries from 1989 to 2018 (Sun and Huang, 2020), evaluates the green development efficiency of seven urban agglomerations in China from 2003 to 2018 (T. Yang et al., 2022), compute the economy and CO2 emissions effect on energy structures optimization of 29 countries and regions across the world in 2017 and 2018 (Lin et al., 2020), assess the eco-efficiency in the Longkou coal mining area of China for sustainability development from 2008 to 2020 (Y. Chen and Liu, 2022, p.), see also Table 1. However, the extant literature lacks in analyzing undesirable output using SBM-DEA model, which often biased if measured without the environmental effect, and failed to resolve the shortcomings of the conventional SBM-DEA. They also lack in employing Global Malmquist-Luenberger (GML) productivity index model, which could overcome inaccurate efficiency results while avoiding environmentally unwanted outputs, and resolve the limitations of the traditional Malmquist-Luenberger index, where it faces a potential linear programming infeasibility problem in measuring cross-period directional distance functions and is also not circular (Oh, 2010). Contrarily, this study attempts to employ these models and aims to resolve the aforementioned research problems and fill the research gaps.
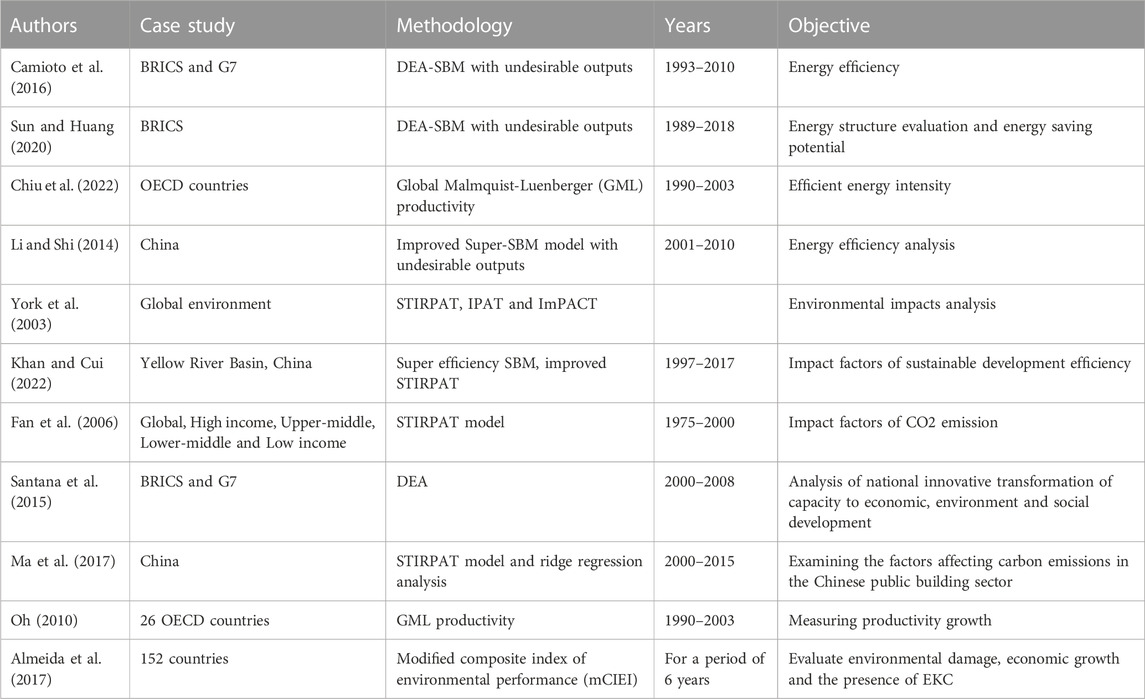
TABLE 1. List of references that analyzed various efficiencies.
Furthermore, to cope with unwanted outputs, there are two types of DEA techniques. The first is the directional distance function approach (Chung et al., 1997; Färe and Grosskopf, 2010). The second is a slack-base measure that involves unwanted outputs, known as the SBM-DEA model with undesirable output (Tone, 2004). Similarly, there are several approaches to address undesired outputs in DEA, which may be classified into two categories, such as weak disposability and strong disposability (Sahoo et al., 2011; H; Yang and Pollitt, 2010). Regarding the BRICS and G7 nations, scholars have also studied various efficiencies, but there are few relevant studies on the comparison of sustainable development efficiency of the BRICS and G7 countries using the SBM-DEA approach with undesirable output. Nonetheless, based on the benefits listed above, this study adopted the SBM-DEA model with undesirable output to investigate the sustainable development efficiency of the BRICS and G7 nations.
3 Materials and methods
Data Envelopment Analysis (DEA) methodology was initially presented by (Charnes et al., 1978), and is based on the research developed by (Farrell, 1957). It is a non-parametric approach for evaluating and benchmarking the performance of a set of decision-making units (DMUs). The DEA approach has several applications for evaluating sustainability and efficiency, and it has grown in significance in recent years as its development has been extensively adopted. Currently, studies are being conducted to assess the economic efficiency and sustainable development of countries and its implications utilizing DEA approaches. This technique can be applied in various sectors, including the environment (Manuel Jesús et al., 2020), economies (Kang and Song, 2020), education (Chen and Liu, 2022), agriculture (Koo and Mao, 1997), and innovation (Santana et al., 2015). One of the primary goals of DEA is to determine the benchmarks of a DMU. In DEA, the benchmarks of a DMU are determined by solving various linear programming models. The DMUs must be homogeneous units, such as companies, countries, banks, etc., that could convert one or various inputs into one or multiple outputs (Cook et al., 2013). Unlike this study, there are arguments that DMU can also be non-homogenous, for instance (Cook et al., 2013). In this study, the BRICS countries (Brazil, Russia, India, China and South Africa) and G7 countries (Canada, France, Germany, Italy, Japan, the United Kingdom, and the United States) are considered as DMUs, and their relative sustainability efficiencies were calculated.
Some literature has employed the traditional DEA model to estimate DMU inefficiency, assessing whether an operational unit can produce more outputs with the same inputs (output-oriented) or produce the same outputs with fewer inputs (input-oriented), which is referred to as model orientation (Farrell, 1957). However, when there is excessive input or insufficient output, when there is non-zero slack, the radial DEA efficiency measure overestimates the efficiency of the evaluation object, whereas the angular DEA efficiency measure ignores a specific aspect of input or output, resulting in an inaccurate efficiency result. This paper, on the other hand, employs a super-efficiency SBM model with undesirable output and a Global Malmquist-Luenberger (GML) productivity index model for overcoming aforementioned disadvantages, potential linear programming infeasibility problem, and more effective ranking of efficient DMUs, as well as to deal with multi-input and multi-output, and environmentally unwanted outputs while avoiding the shortcomings of the conventional Malmquist-Luenberger (ML) index.
3.1 The study model
This study incorporate three different models. These models are presented as follows.
3.1.1 Super-efficiency SBM model with undesirable output
(Tone, 2004) put forward the SBM model with undesirable output, which does not solve the problem that multiple decision units may be located in the production frontier in the traditional DEA model, so it is impossible to effectively evaluate and compare the effective DMUs with an efficiency value of 1. In order to achieve further analyses and determine the rank of each DMU efficiently, this study uses the research of (Li and Shi, 2014) as a reference to build a super-efficient SBM model containing undesirable outputs.
Suppose there are n decision-making units (DMUs), each of which contains three factors such as, α input factor X, β1 desirable output Yg, and β2 undesirable output Yb, and assume that X > 0, Yg > 0, Yb > 0, and λ ∈ Rn is the weight vector. Then the possible set of environmental technology production including undesirable outputs is defined as,
The SBM model with undesirable output can be expressed as follows,
In the above formula, the vector S = (S−, Sg, Sb) corresponds to the slacks variable of input factor X, desirable output Yg and undesirable output Yb, respectively. The optimization function ρ* represents the environmental efficiency value of DMU (x0, y0g, y0b) if and only if S-= 0, Sg = 0, Sb = 0, that is ρ* = 1. At this time, DMU (x0, y0g, y0b) with undesirable output is efficient.
However, the result calculated by Eq. 2 may lead to the situation where the environmental efficiency value of multiple DMUs is 1, thus requiring further construction of a super-efficient SBM model with undesirable output for ρ* = 1 DMU, which is processed as follows,
3.1.2 Global Malmquist-Luenberger productivity index model
The Malmquist productivity index has been widely used since it was proposed by (Caves et al., 1982) and adopted by (Färe et al., 1994). They extended the idea of (Malmquist, 1953). However, this index cannot directly consider undesirable outputs such as environmental pollution. Following (Luenberger, 1992), (Chung et al., 1997) introduced the concept of a directional distance function and proposed a productivity index with undesirable outputs to measure environmental total factor productivity, namely, the ML (Malmquist-Luenberger) productivity index, which integrates the concepts of a directional distance function and the Malmquist productivity index (Oh, 2009). However, ML indexes still have problems, such as no feasible solution for linear programming (LP) and no cross period comparison. Referring to the view of (Oh, 2009), the particular reason for the circumstance is that the traditional ML productivity index takes the geometric mean of two concurrent ML indexes. Consequently, (Oh, 2010) successfully solved the above problems by adopti`ng the GML (Global Malmquist-Luenberger) productivity index method, which was conceptualized by (Pastor and Lovell, 2005). Therefore, drawing on previous studies, the GML index is formulated as follows,
where,
In Eq. 5, if
3.1.3 STIRPAT model
In the above section, we construct two different models in order to measure the energy efficiency and better handle the environmentally undesirable outputs since they are unavoidable for production and living across the BRICS and G7 countries from 2005 to 2015. Therefore, it is necessary to take the undesirable outputs into account in the efficiency evaluation based on the super-efficiency SBM model and the Global Malmquist-Luenberger (GML) productivity index model. However, it is also necessary to explore relevant influencing factors on the environmental pollution thereby affects the sustainable efficiency of the study countries using STIRPAT approach.
In order to contrast the effects of population, affluence, and technology on CO2 emissions between the years 2005 and 2015, this study analyzes BRICS and G7 countries using the STIRPAT model. STIRPAT is an acronym with two meanings. One is Stochastic Impacts by Regression on Population, Affluence and Technology (STIRPAT) and the other is the strip of Impacts on the environment by Population, Affluence and Technology (IPAT) (Dietz and Rosa, 1997; York et al., 2003; Fan et al., 2006; Khan and Cui, 2022). The word STIRPAT refers to a statistical and conceptual model for assessing human population impacts on the environment. The basic argument of this study model is that GDP per capita and population size significantly influence CO2 emission levels. To investigate the influencing factors that place pressure on the environment (Ehrlich and Holdren, 1971), researchers initially explored the IPAT model, which can be concisely expressed as,
where, I indicates the environmental quality, P implies population size, A signifies affluence level (consumption per capita), and T denotes technological degree (impact per unit of consumption), See also Figure 2.
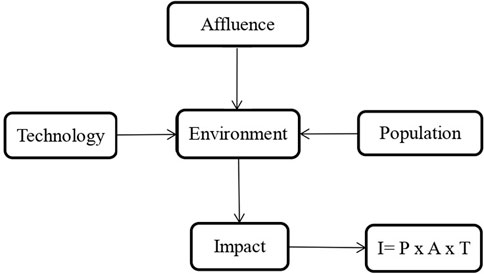
FIGURE 2. Human population impacts on the environment.
The IPAT model, on the other hand, simply provides a monotonic identity equation in proportion to changes. To overcome the limitations of the preceding equations in hypothesis testing and acquire the disproportional contribution of the environment, (Dietz and Rosa, 1994) studied and developed the STIRPAT model, which is a stochastic model that can be used to empirically test hypotheses. The STIRPAT model keeps the multiplication structure of the IPAT model and embeds the three primary determinant elements that impact the environment, such as population size (P), affluence level (A), and technical degree (T), which is intended to overcome some of the IPAT model’s flaws (York et al., 2003). The specification of the STIRPAT model is,
where, the constant
The study model considered CO2 emissions as a response variable, whereas predictor variables are GDP per capita, population, labor force, population aged 15–64, and technology. Note that affluence is measured by GDP per capita (constant 2017 US$), and this study treated technology as renewable energy consumption.
Furthermore, the STIRPAT approach allows other influencing components to be incorporated into the equation in order to explore their effects on CO2 emissions and, as a result, impede sustainable development efficiency (SDE) (York et al., 2003). Thus, we employed the improved STIRPAT approach by embodying the labor force and population aged 15–64 in this study, which is described as follows,
The variables used in the above equation are already stated in the table below (Table 1), and our study’s STIRPAT model is based on this equation.
3.2 Variable selection and data source
This study incorporates three different models. To reasonably evaluate the sustainable development efficiency of BRICS and G7 countries, the first two models are employed, and these models utilize labor force, capital investment, and energy consumption as inputs; GDP is taken as a desirable output, and CO2 emissions are regarded as undesirable outputs, which is one of the most important unwanted outputs. Subsequently, the STIRPAT model was also employed in order to analyze the influencing factors of sustainable development efficiency in both groups of countries. This particular model considered CO2 emissions as the response variable, whereas the predictor variables were GDP per capita, population, labor force, population aged 15–64, and technology. As per the availability, completeness, and accuracy of the data, the selected sample period for all models is from 2005 to 2015, and the selected sample countries are 12 countries, such as the BRICS and G7 countries.
3.2.1 Variable selection
3.2.1.1 Input variables
Labor force: Strictly speaking, due to the differences in the age, education, and professional skills of the labor force in the process of production activities, the selection of labor indicators should take into account both quantity and quality factors. However, under the existing database and statistical system, countries have different standards for measuring labor input (Jeong, 2002). Therefore, referring to several studies, the total number of employees in each country is used as the proxy variable for labor input.
Capital investment: Referring to the existing literature, the actual capital stock of each country is used as the proxy variable for capital investment. The existing statistical indicators do not directly provide capital stock data, thus, capital stock variables appearing in investment and other equations are most often constructed by the perpetual inventory method (PIM), which is used to estimate the actual capital stock (Berlemann and Wesselhöft, 2014; Zhao et al., 2020). The specific calculation equation is as follows,
Energy consumption: In the traditional efficiency and productivity analysis framework, energy, as an intermediate input indicator, is usually not included in the production function (Baptist and Hepburn, 2013). However, under the consideration of environmental constraints, energy consumption is the main source of CO2 and other greenhouse gases. A plethora of studies include energy and other resources in the measurement framework to more accurately measure efficiency and productivity after considering environmental constraints (Saidi and Hammami, 2015; Camioto et al., 2016; Sun and Huang, 2020). Therefore, this paper also takes the total energy consumption of each country as one of the input indicators, and uses the total primary energy consumption of each country as its proxy variable.
3.2.1.2 Output variables
Desirable output: Like most research literature, the desirable output is expressed by the real GDP of each country with constant prices (Camioto et al., 2016; Sun and Huang, 2020; Xin et al., 2022).
Undesirable output: Referring to most literature studies, CO2 emissions are used as proxy variables of environmental pollution (Camioto et al., 2016; Sun and Huang, 2020; Xin et al., 2022).
3.2.2 Sample selection and data source
The collected data for the super-efficiency SBM-DEA model with undesirable output and the global Malmquist-Luenberger productivity index model are all from the World Development Indicators (WDI) and Organization for Economic Co-operation and Development (OECD) databases, whereas for the STIRPAT model, the data sources are illustrated in the table (Table 2).
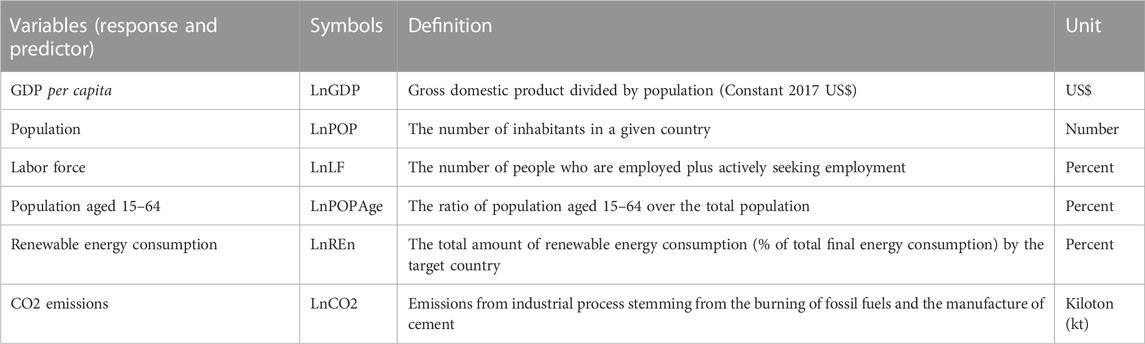
TABLE 2. Definitions of variables.
4 Analysis of measurement results
4.1 Sustainable development efficiency based on super-efficiency SBM with undesirable output
Efficiency analysis is mainly done to determine whether the overall technical efficiency, pure technical efficiency, and scale efficiency are effective. Whether a DMU is effective is determined by its overall efficiency value. The overall efficiency value may have either of the two results, equal to 1 (100%) or less than 1 (100%) (Charnes et al., 1978). If the overall efficiency score of the DMU is equal to 1, it indicates that the DMU is effective and on the efficiency frontier, might serve as a “reference-set” for other inefficient DMUs or itself, and the allocation and consumption levels of resources are optimal within the scope of the selected object. Contrarily, if the overall efficiency value of the DMU is less than 1, it indicates that the DMU is not effective, its allocation of resources and consumption level of resources have not yet reached their optimal size, and hence it has the potential to enhance future performance (Huguenin, 2012).
As can be seen in Table 3 below, Italy leads the sustainability efficiency score and is ranked first. It is clearly illustrated in the table that there is a significant gap between the sustainable development efficiency values of India and Italy. From 2005 to 2015, India’s annual average efficiency value was the lowest at 0.5630, and the largest was Italy’s at 0.9911, which is close to 1. The top five countries in terms of average efficiency value were Italy, Canada, France, the United Kingdom, and Brazil, while India, China, and South Africa were the last three, consecutively. Generally, low efficiency value does not mean the severity of economic inefficiency, but linked to best practices and represents a ratio of input variables and output variables.
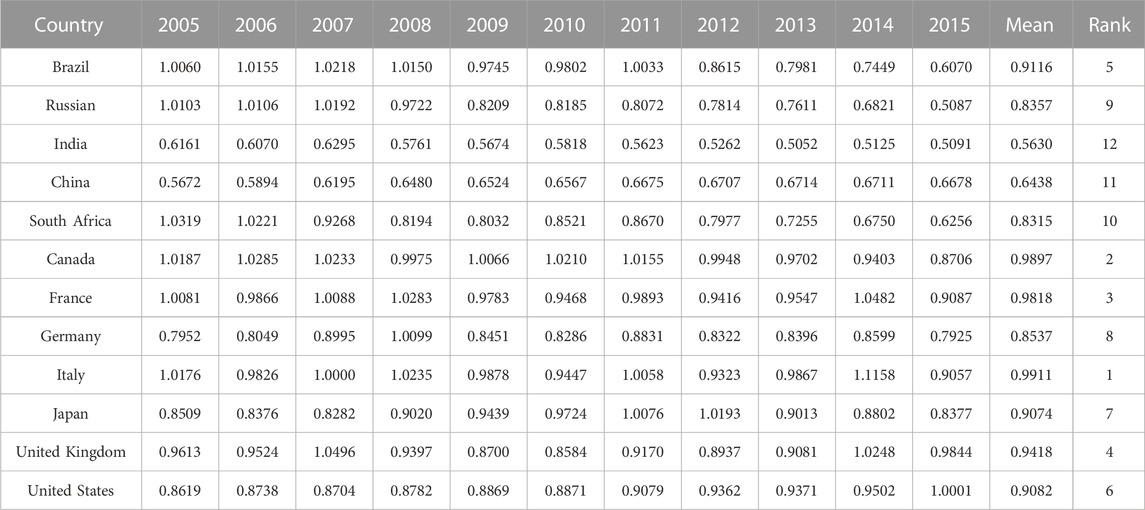
TABLE 3. Sustainable development efficiency of BRICS and G7 countries from 2005 to 2015.
It can be seen from Figure 3 that in the sample period, although China’s sustainable development efficiency is relatively behind that of other countries except India’s, it has a gradually improving trend, while most other countries’ except the United States have a gradually declining pace. Among the BRICS countries, Brazil has the highest average efficiency, which is consistent with the findings of (Sun and Huang, 2020), and India ranks last among the BRICS nations (Camioto et al., 2016).
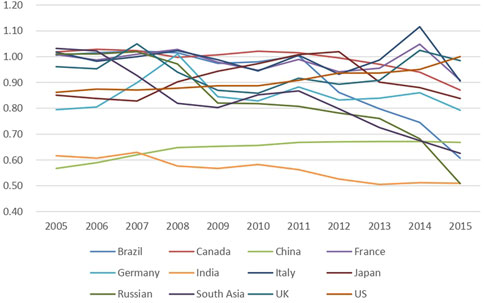
FIGURE 3. Change trend of BRICS and G7 sustainable development efficiency.
4.2 Total factor productivity decomposition based on GML index
The proposed approach, the total factor productivity decomposition based on the GML index, outlined in the second model, constructs a global best-practice frontier from the data set. The empirical results are summarized in Table 4 below, which presents the results of applying our methodology. In order to further evaluate the sustainable development efficiency of the studied countries and analyze the factors affecting it, this section discusses and interprets the results. We can not only get the efficiency changes in different periods, but also reflect the progress of technology, which is the movement of the production frontier, so as to realize the dynamic analysis of sustainable development efficiencies in the studied countries. Efficiency analysis is mainly done to determine whether technical efficiency changes and technological progress are effective.
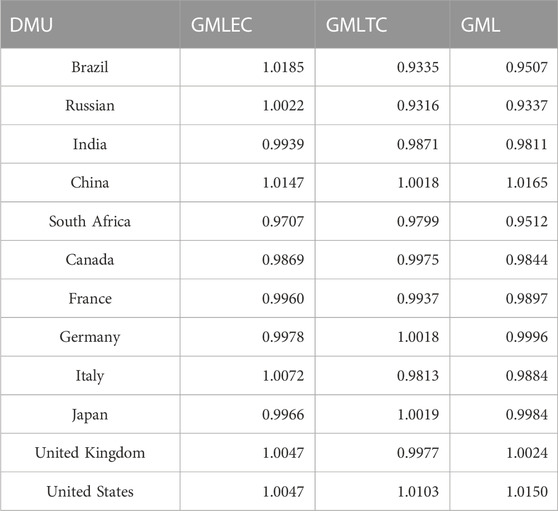
TABLE 4. Changes and decomposition of BRICS and G7 sustainable total factor productivity.
It should be noted that index values greater than 1 indicate positive productivity growth (improvements), whereas index values less than 1 imply a loss in productivity (deterioration) over time. Using this strategy, we can determine which component of the efficiency drop eventually leads to a decrease in operational efficiency and, hence, make targeted recommendations. As a result, the technical efficiency change increasing (GMLEC > 1) or decreasing (GMLEC < 1) is to indicate whether the DMU is close to or far from the production frontier, respectively. Similarly, technological progress change increasing (GMLTC > 1) or decreasing (GMLTC < 1) is to manifest the technological change in the production. Accordingly, country-specific sustainable total factor productivity growth (GML), technical change (GMLTC), and efficiency change (GMLEC) are presented in each row of the table.
It can be seen from Table 4 that only China, the United Kingdom, and the United States have sustainable total factor productivity indexes (TFP) greater than 1, indicating that these countries’ sustainable TFP is rising during the study period, while other countries’ TFP is less than 1, implying that the sustainable total factor productivity of these countries is declining during the study period. From the perspective of decomposition, the two wheels of technical efficiency (1.0147) and technological progress (1.0018) drive the rise of China’s sustainable total factor productivity. Similarly, the technical efficiency (1.0047) and technological progress (1.0103) of the United States are also greater than 1, indicating that the improvement of sustainable total factor productivity in the United States also comes from the technical efficiency and technological progress of dual wheel drive, but the difference is that the United States’s comes from the improvement of technological progress.
In our sample countries, China experienced the highest growth in sustainable TFP, and Russia experienced the highest decline in both technical change and sustainable TFP indexes. China is also one of the countries that experienced the highest positive efficiency change, and the United States has the highest positive technical change. China also ranks as one of the most productive countries with the highest growth in technical change. The United Kingdom and Germany, respectively, ranked third and fourth with positive productivity growth indexes, where the United Kingdom shows higher efficiency change and Germany is better in technical change. South Africa experienced the highest decline in efficiency change.
4.3 Regression analysis and multicollinearity test: STIRPAT model
The OLS regression estimation method is used in this study to create the STIRPAT model for response and predictor variables, thereby eliminating multicollinearity among predictor variables (Fan et al., 2006; Khan and Cui, 2022). Multicollinearity in regression analysis occurs when two or more explanatory variables are highly correlated, they do not provide unique or independent information in the regression model, resulting in unstable regression coefficients, a large standard error, statistically less significance, and problems fitting and interpreting the regression model (Daoud, 2017; Shrestha, 2020). As a result, the multicollinearity of predictor variables must be evaluated to ensure that the correlation between them is not too strong and to address the issues raised.
Fortunately, multicollinearity can be detected using the Variance Inflation Factor (VIF), a metric that evaluates the correlation and intensity of connection between predictor (independent) variables in a regression model (Khan and Cui, 2022). It measures the number of inflated variances caused by multicollinearity.
This study has utilized natural logarithm values of panel data series; therefore, the long-term elasticities of GDP, population, labor force, renewable energy consumption, and population aged 15–64 are econometrically equal to the estimates of CO2 emissions. This study originally expected that GDP per capita and population size would significantly influence CO2 emissions. A plethora of studies have examined the nexus between GDP and CO2 emissions. In a study of 33 countries between 1995 and 2007 (Andreoni and Galmarini, 2016), and 188 countries covering the period of 1993–2010 (P.-Y. Chen et al., 2016), found that the increase in GDP per capita is a significant predictor of increasing CO2 emissions.
According to our model results (summarized in Table 5), holding all other factors constant, with every unit increase in GDP per capita and population size, the CO2 emissions will increase at a .096927 and .4178275 rate in BRICS, respectively. The study result is consistent with the findings of (York et al., 2003; Fan et al., 2006; Dong et al., 2019). Considering 128 countries (Dong et al., 2019) examined the impact factors of CO2 emission in the world, they found that economic growth and population size significantly influence and increase CO2 emissions level. Moreover, several studies exhibit a statistically significant and cointegrating relationship between GDP and CO2 emissions; for instance, (Ameyaw and Yao, 2018) analyzed the links between GDP and CO2 emissions in the five Western African countries covering the period of 2007–2014, (Mitić et al., 2017) examined the nexus between real GDP and CO2 emissions for 17 transitional economies from 1997 to 2014. Similarly, (Lane, 2011) indicates the close relationship between CO2 emissions and GDP over time and across countries in the world. Population aged 15–64 significantly increase CO2 emission levels, which is somehow also consistent with some studies, for instance (Fan et al., 2006). However, when it comes to the G7 countries, with every unit increase in GDP per capita and population size, the CO2 emissions will decrease at a .2180387 and .1249874 rate, respectively. The inverse link between GDP and CO2 emissions might imply that the G7 nations have passed the turning point on an environmental Kuznets curve (EKC). Similarly, in several G7 nations, population functions as a scale factor for environmental degradation, implying that the higher the economic affluence, the cleaner the countries in terms of CO2 emissions, as IPAT proponents have argued. Research findings on this matter confirm that, in relation to the increase in population and GDP per capita, there is a negative impact on CO2 emissions (Weber and Sciubba, 2018; Alsarayreh et al., 2020).
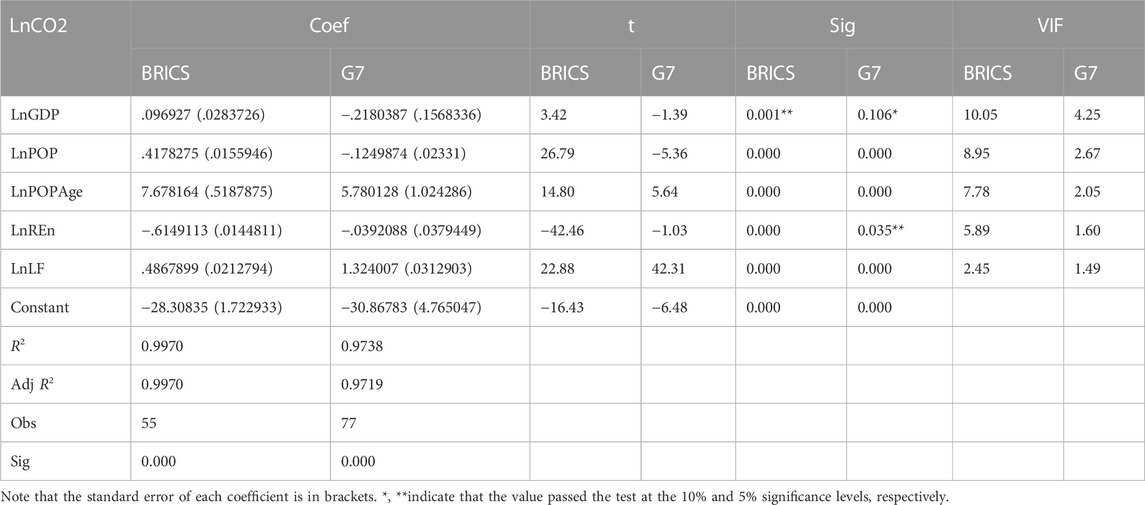
TABLE 5. OLS regression results of different impact factors on sustainable development efficiency.
Additionally, the negative sign of renewable energy consumption in both group of countries indicate that the relationship between this predictor variable and CO2 is diminishing, implying that for every unit increase in the renewable energy consumption while holding all other predictor variables constant, CO2 emission levels decrease by approximately .6149113 rate in BRICS and .0392088 rate in G7 countries. This result is consistent with (Camioto et al., 2016; Majewska and Gieratowska, 2022). Furthermore, the positive signs of population aged 15–64 and labor force in both groups of countries indicate that the relationship between these predictor variables and CO2 is rising, implying that for every unit increase in these two variables while holding all other predictor variables constant, CO2 emission levels increase in both BRICS and G7 countries.
This study’s findings regarding renewable energy consumption are consistent with those of other research. For instance, (Fan et al., 2006) examined the impact of renewable energy consumption on CO2 emissions in high income, upper-middle, lower-middle, and low income countries from 1975 to 2000, and discovered that renewable energy consumption increased CO2 emissions in the high income, lower-middle, and low income countries but reduced them in the upper-middle nations.
It is also worth noting that all the computed coefficients are statistically significant. This actively demonstrates that the p-value is small enough to reject the null hypothesis, which is that the change in GDP and population in the BRICS nations will not affect the world’s CO2 emissions. In the BRICS countries starting from GDP per capita, population, population aged 15–64 and labor force have a positive influence on CO2 emissions, whereas renewable energy consumption has a negative influence (See Figure 4). In the G7 nations, population aged 15–64 and labor force have positive influences on CO2 emissions, but other variables have negative influences (See Figure 5).
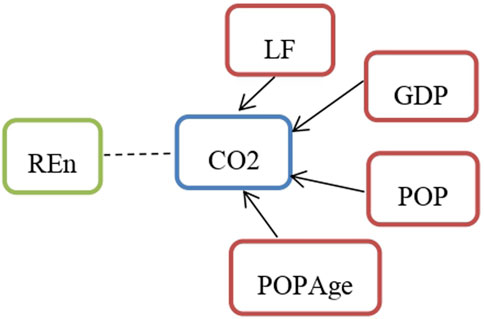
FIGURE 4. Key findings derived from STRIPAT model in BRICS. Note: Positive influence (Continues lines) and Negative influence (Dashed lines).
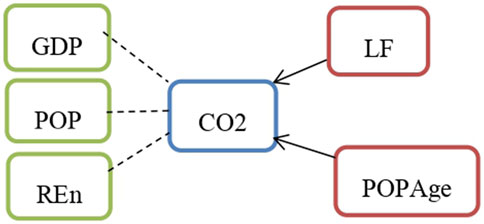
FIGURE 5. Key findings derived from STRIPAT model in G7 countries.
This finding supports the EKC hypothesis in these nations. The inverted U-shape in the G7 nations implies that increasing real income per capita contributes to CO2 emissions but that they begin to decline once the threshold level is reached (Grossman and Krueger, 1991; Panayotou, 1993). During the early phases of economic development, governments require energy consumption to stimulate economic growth and use outdated technology, which reduces energy efficiency and hence increases CO2 emissions.
Incidentally, a VIF value of 1–5 suggests significant correlation between a specific predictor variable and other predictor variables in the model, but this is frequently not severe enough to warrant attention. However, a value larger than 10 indicates a potentially severe correlation between a specific explanatory variable and other explanatory variables in the model (Marquaridt, 1970). All the VIF values in this study are less than 10, indicating that multicollinearity is no longer a concern in the model and that their coefficient estimates and p-values are statistically significant and reliable.
Furthermore, the R-squared value is the fraction of the variation in the response variable that can be explained by the model’s predictor variables, and it is used to measure the strength of the correlation between the predictors and the response variable (Colin Cameron and Windmeijer, 1997). However, when it comes to assessing the influence of predictor factors on the correlation, the R-squared has certain drawbacks. This is where adjusted R-squared, a modified form of R-squared, comes in handy for measuring correlation and providing more precise and reliable results (Miles, 2014). Generally, R-squared will usually find the best fit for a model (Miles, 2014). According to our study model, the predictor variables can explain almost all the response variables. As for the BRICS and G7 nations, the values of the R-squares are 0.9970 and 0.9738, respectively, which are large enough to demonstrate the observation is likely to lie on the regression line. As a result, because the R-squared value can vary from 0 to 1, the goodness of fit of this study model is statistically significant.
5 Conclusion
This paper takes the BRICS and G7 countries as DMUs, and uses the super-efficiency SBM model with undesirable outputs and the GML index to analyze and explore the changes in total factor productivity of economic development and environmental governance in each country from 2005 to 2015. This paper also employed the STIRPAT model to examine the influencing factors of sustainable development on the environment, which in turn affects the sustainable development efficiency of the study countries. According to our findings, in terms of average efficiency value, Italy, Canada, France, the United Kingdom, and Brazil ranked first through fifth, with India, China, and South Africa coming in successively last place. Low efficiency values, however, are linked to best practices and show a ratio of input to output variables, but do not indicate the severity of economic inefficiency. Among the BRICS countries, Brazil has the highest average efficiency, and our result is consistent with the findings of (Sun and Huang, 2020); similarly, India ranks last among the BRICS nations, and this result is coherent with (Camioto et al., 2016).
Furthermore, on the basis of trends in results obtained, the following conclusions are drawn:
1. The sustainable total factor productivity (GML) of three countries namely, China, the United States and United Kingdom hierarchically is on the rise. China is also one of the countries that experienced highest positive efficiency change, and the United States has the highest positive technical change. Contrarily, Russia experienced the highest decline in technical change as well as sustainable GML indexes, and South Africa experienced the highest decline in efficiency change.
2. The reasons for the decline of GML productivity indexes in different countries include inadequate management practices, failure to operate at maximum productive scale, poor input resource utilization, the single factor effect of poor performance or technological regression, and the combined effect of both. The reasons for poor performance include unreasonable industrial structures, imperfect systems and mechanisms, etc. The reasons for technological retrogression include low innovation-driven effectiveness, a lack of integration of green technologies, etc.
3. This study exhibits that GDP per capita and population size are the key influencing factors of CO2 emissions across the study period, with both having a positive influence in BRICS nations, resulting in a rise in global CO2 emissions, and a negative impact in the G7 nations, resulting in a decline in global CO2 emissions. The significant positive or negative link between GDP and CO2 emissions might indicate that nations are either below or over the turning point on an EKC. This result may suggest, among other things, that both the BRICS and G7 nations, especially the BRICS nations, should invest heavily in renewable energy resources and implement steps to increase energy efficiency, including more efficient technology (discussed below). Similarly, in certain nations, population functions as a scale factor for environmental degradation, implying that the higher the affluence, the cleaner the countries in terms of CO2 emissions, as IPAT proponents have argued. This actively demonstrates that population growth in the G7 nations does not affect CO2 emissions levels, but the opposite is true in the BRICS nations. Nonetheless, the p-values of all the study results are small enough to reject the null hypothesis, which is that changes in GDP and population in the BRICS nations have influenced global CO2 emissions but that the G7 nations have not affected global CO2 emissions.
Based on the study’s findings, this report suggests the following strategies for increasing long-term total factor productivity:
(1) Improve sustainable total factor productivity of the economic development, Initially, boost innovative development: The first driving factor for development is innovation. Both of the nations must focus on enhancing innovation’s strategic position in economic development, implementing the innovation-driven development strategy, and leading economic growth via scientific and technical innovation. Increase investment in scientific and technological R&D, expand government subsidies for energy efficiency improvements and energy infrastructure, support and cultivate enterprises to improve their independent technological innovation capabilities, and optimize the innovation development environment through the construction of high-tech industrial parks, patent and intellectual property protection systems, and public service innovation platforms are always to accomplish this. Similarly, encourage schools, research institutes, and productive firms to collaborate to develop talent-training bases, and recruit top individuals from overseas. Efforts should be made to improve the innovation environment and nurture inventive talent in order to achieve green and sustainable economic development through innovation. Second, optimize the industrial structure: The urban industrial structure has a substantial influence on the economic development’s sustainable total factor productivity. All nations should continue to encourage industrial structure upgrades, enhance the number of industries with high added value and relevance, and investigate the best resource allocation led by structural transformation. Countries with poor sustainable total factor productivity, in particular, should shift away from the broad development paradigm of high input and low utilization and aggressively adapt their industrial structure. Russia, for example, has a better geographical location than the other BRICS countries, but its productivity value exhibits a declining trend. Inadequate management techniques, the inability to function at optimal scale size for the result of efficient frontiers, poor input resource use, inadequate technology advances, and others, might be the major reasons. Simultaneously, it suggests that its resource allocation and consumption level have not yet achieved their ideal size, that clearly articulates it has not yet established a high-tech sector that matches the demands of the time, and that it therefore has the potential to improve future performance. The BRICS nations should aggressively explore and optimize their own industrial structure, establish industrial support with development potential, and then enhance the sustainable development efficiency and total factor productivity of the country.
(2) Improve sustainable total factor productivity of environmental governance, First, encourage technological integration: Inadequate technical progress is a major contributor to the loss of green and sustainable total factor productivity in environmental governance. Especially the BRICS countries should pay attention to the intersection of new technologies and environmental governance, increase the transition of green technology into productivity, and decrease the negative environmental effect of unit economic output. Except for China and the United States, other nations in the sample period had either insufficient efficiency change or technical improvement, resulting in a decline in sustainable total factor productivity. As a result, there is a need to actively explore green technology and technological R&D application, with the goal of promoting technical efficiency change, technological progress, ecological development of green industries, and accelerating the construction of a technology innovation system through the promotion of transformation and integration of science and technology in the field of environmental protection. Second, strengthen the environmental protection system and mechanisms: A mature sustainable development system and an assessment of the variables influencing it may offer a normative framework for the government and all sectors of society to engage in the economic development building. The study countries should play a full role in developing clean energy alternatives, fighting global warming, performing environmental governance functions, improving the construction of environmental-related legal systems, developing strict green development regulatory systems, implementing the responsibility system, committing public funds to increasing the size of local forests, and utilizing scientific mechanisms to promote sustainable total factor productivity and environmental protection. Countries with inefficient sustainable GML should compensate for the shortcomings of traditional technologies and technical efficiencies that ignore resource protection and pollution control, promote technological progress, support the construction of an ecological civilization, and encourage the improvement of green energy development. Similarly, increase expenditures on energy-saving measures in public buildings, as they contribute to CO2 emissions reductions, and set a particular aim to cut CO2 emissions.
Despite its important contributions, our study has limitations. The study time and sample sizes should be increased, and the index method should be improved. In this regard, further research with more data and alternative variables might help to improve our understanding of the phenomena under study.
Data availability statement
The original contributions presented in the study are included in the article/supplementary material, further inquiries can be directed to the corresponding authors.
Author contributions
SC: Reviewing, proofreading, validating, funding acquisition, and supervision. AA: Conceptualization, methodology, data gathering and analysis, software, reviewing and proofreading. LC: Methodology, data gathering, analysis, and software. All authors have read and agree to the published version of the manuscript. ZZ: Reviewing, proofreading, and validation.
Funding
This paper was supported by the National Natural Science Foundation Youth Fund under grant number: 71904045 and the National Social Science Fund of China under grant number: 19AGL017.
Conflict of interest
The authors declare that the research was conducted in the absence of any commercial or financial relationships that could be construed as a potential conflict of interest.
Publisher’s note
All claims expressed in this article are solely those of the authors and do not necessarily represent those of their affiliated organizations, or those of the publisher, the editors and the reviewers. Any product that may be evaluated in this article, or claim that may be made by its manufacturer, is not guaranteed or endorsed by the publisher.
References
Almeida, T. A., das, N., Cruz, L., Barata, E., and García-Sánchez, I-M. (2017). Economic growth and environmental impacts: An analysis based on a composite index of environmental damage. Ecol. Indic. 76, 119–130. doi:10.1016/j.ecolind.2016.12.028
Alsarayreh, M. M. M., AlSuwaidi, M. F., Al Sharif, R. A., and Kutty, A. A. (2020). “The factors affecting co2 emission in the European union countries: A statistical approach to sustainability across the food industry,” in 2020 IEEE 7th International Conference on Industrial Engineering and Applications (ICIEA), Bangkok, Thailand, 16-21 April 2020, 599–604. doi:10.1109/ICIEA49774.2020.9102066
Ameyaw, B., and Yao, L. (2018). Analyzing the impact of GDP on CO2 emissions and forecasting Africa’s total CO2 emissions with non-assumption driven bidirectional long short-term memory. Sustainability 10 (9), 3110. doi:10.3390/su10093110
Anand, P., Fennell, S., and Comim, F. (2020). Handbook of BRICS and emerging economies. Oxford: Oxford University Press. doi:10.1093/oso/9780198827535.001.0001
Andreoni, V., and Galmarini, S. (2016). Drivers in CO2 emissions variation: A decomposition analysis for 33 world countries. Energy 103, 27–37. doi:10.1016/j.energy.2016.02.096
Armstrong, S. (2010). The super-rich shall inherit the earth: The new global oligarachs and how they’re taking over our world. Paris: Hachette. Little, Brown Book Group.
Baptist, S., and Hepburn, C. (2013). Intermediate inputs and economic productivity. Philosophical Trans. Ser. A, Math. Phys. Eng. Sci. 371, 20110565. doi:10.1098/rsta.2011.0565
Barykina, Y. N., Chernykh, A. G., and Na, B. (2022). Energy production as a basis for sustainable development in the BRICS countries. IOP Conf. Ser. Earth Environ. Sci. 990 (1), 012016. doi:10.1088/1755-1315/990/1/012016
Berlemann, M., and Wesselhöft, J.-E. (2014). Estimating aggregate capital stocks using the perpetual inventory method: A survey of previous implementations and new empirical evidence for 103 countries. Rev. Econ. 65 (1), 1–34. doi:10.1515/roe-2014-0102
Bratersky, M. (2020). “Is BRICS capable of filling the vacuum in global governance?,” in Global governance in transformation: Challenges for international cooperation. Editors L. Grigoryev, and A. Pabst (New York City: Springer International Publishing), 129–143. doi:10.1007/978-3-030-23092-0_9
Brown, R. H., and Garten, J. E. (1994). U.S. Industrial outlook. Washington, DC: U.S. Department of Commerce, Bureau of Industrial Economics.
Brundtland, G. H. (1985). World Commission on environment and development. Environ. Policy Law 14 (1), 26–30. doi:10.1016/S0378-777X(85)80040-8
Cai, Y. (2011). Factors affecting the efficiency of the BRICSs’ national innovation systems: A comparative study based on DEA and panel data analysis. SSRN Electron. J. 52, 1–24. doi:10.2139/ssrn.1974368
Camioto, F. de C., Moralles, H. F., Mariano, E. B., and Rebelatto, D. A. (2016). Energy efficiency analysis of G7 and BRICS considering total-factor structure. J. Clean. Prod. 122, 67–77. doi:10.1016/j.jclepro.2016.02.061
Camioto, F. de C., and Pulita, A. C. (2022). Efficiency evaluation of sustainable development in BRICS and G7 countries: A data envelopment analysis approach. Gestão Produção 29 (3), 1–21. doi:10.1590/1806-9649-2022v29e022
Carmody, P. (2019). “South Africa in the global political economy: The BRICS connection,” in The geography of South Africa: Contemporary changes and new directions. Editors J. Knight, and C. M. Rogerson (New York City: Springer International Publishing), 223–227. doi:10.1007/978-3-319-94974-1_24
Caves, D. W., Christensen, L. R., and Diewert, W. E. (1982). The economic theory of index numbers and the measurement of input, output, and productivity. Econometrica 50 (6), 1393–1414. doi:10.2307/1913388
Chang, M.-C., and Hu, J.-L. (2019). A long-term meta-frontier analysis of energy and emission efficiencies between G7 and BRICS. Energy Effic. 12, 879–893. doi:10.1007/s12053-018-9696-7
Charnes, A., Cooper, W. W., and Rhodes, E. (1978). Measuring the efficiency of decision making units. Eur. J. Operational Res. 2 (6), 429–444. doi:10.1016/0377-2217(78)90138-8
Chen, P.-Y., Chen, S.-T., Hsu, C.-S., and Chen, C.-C. (2016). Modeling the global relationships among economic growth, energy consumption and CO 2 emissions. Renew. Sustain. Energy Rev. 65, 420–431. doi:10.1016/j.rser.2016.06.074
Chen, Y., and Liu, L. (2022). Improving eco-efficiency in coal mining area for sustainability development: An emergy and super-efficiency SBM-DEA with undesirable output. J. Clean. Prod. 339, 130701. doi:10.1016/j.jclepro.2022.130701
Chiu, C.-R., Chang, M.-C., and Hu, J.-L. (2022). Energy intensity improvement and energy productivity changes: An analysis of BRICS and G7 countries. J. Prod. Analysis 57 (3), 297–311. doi:10.1007/s11123-022-00630-7
Chung, Y. H., Färe, R., and Grosskopf, S. (1997). Productivity and undesirable outputs: A directional distance function approach. J. Environ. Manag. 51 (3), 229–240. doi:10.1006/jema.1997.0146
Colin Cameron, A., and Windmeijer, F. A. G. (1997). An R-squared measure of goodness of fit for some common nonlinear regression models. J. Econ. 77 (2), 329–342. doi:10.1016/S0304-4076(96)01818-0
Cook, W. D., Harrison, J., Imanirad, R., and Zhu, J. (2013). Data envelopment analysis with nonhomogeneous DMUs. Operations Res. 61 (3), 666–676. doi:10.1287/opre.2013.1173
Daoud, J. I. (2017). Multicollinearity and regression analysis. J. Phys. Conf. Ser. 949, 012009. doi:10.1088/1742-6596/949/1/012009
Dietz, T., and Rosa, E. A. (1997). Effects of population and affluence on CO2 emissions. Proc. Natl. Acad. Sci. U. S. A. 94 (1), 175–179. doi:10.1073/pnas.94.1.175
Dietz, T., and Rosa, E. A. (1994). Rethinking the environmental impacts of population, affluence and technology. Hum. Ecol. Rev. 1 (2), 277–300.
Dong, K., Dong, X., and Dong, C. (2019). Determinants of the global and regional CO2 emissions: What causes what and where? Appl. Econ. 51 (46), 5031–5044. doi:10.1080/00036846.2019.1606410
Downie, C. (2015). Global energy governance: Do the BRICs have the energy to drive reform? Int. Aff. 91 (4), 799–812. doi:10.1111/1468-2346.12338
Ehrlich, P. R., and Holdren, J. P. (1971). Impact of population growth. Sci. (New York, N.Y.) 171 (3977), 1212–1217. doi:10.1126/science.171.3977.1212
Fan, Y., Liu, L.-C., Wu, G., and Wei, Y.-M. (2006). Analyzing impact factors of CO2 emissions using the STIRPAT model. Environ. Impact Assess. Rev. 26 (4), 377–395. doi:10.1016/j.eiar.2005.11.007
Färe, R., and Grosskopf, S. (2010). Directional distance functions and slacks-based measures of efficiency. Eur. J. Operational Res. 200 (1), 320–322. doi:10.1016/j.ejor.2009.01.031
Färe, R., Grosskopf, S., Norris, M., and Zhang, Z. (1994). Productivity growth, technical progress, and efficiency change in industrialized countries. Am. Econ. Rev. 84 (1), 66–83.
Farrell, M. J. (1957). The measurement of productive efficiency. J. R. Stat. Soc. Ser. A General. 120 (3), 253–290. doi:10.2307/2343100
Gautam, V., and Sharan, V. (2019). “Financial architecture and financial flows: BRICS and the G7,” in Global governance in transformation. Editors L. Grigoryev, and A. Pabst (Berlin: Springer), 261–274. doi:10.1007/978-3-030-23092-0_16
Grossman, G. M., and Krueger, A. B. (1991). Environmental impacts of a north American free trade agreement. NBER Working Papers (No. 3914; NBER Working Papers). Cambridge: National Bureau of Economic Research, Inc.
Guo, Y., Tong, L., and Mei, L. (2020). The effect of industrial agglomeration on green development efficiency in Northeast China since the revitalization. J. Clean. Prod. 258, 120584. doi:10.1016/j.jclepro.2020.120584
Hawksworth, J., and Chan, D. (2013). World in 2050. The BRICs and beyond: Prospects, challenges and opportunities. London: PricewaterhouseCoopers.
Huguenin, J.-M. (2012). Data envelopment analysis (DEA): A pedagogical guide for decision makers in the public sector. Chavannes-pres-Renens, Switzerland: Swiss Graduate School of Public Administration.
Jeong, B. (2002). Measurement of human capital input across countries: A method based on the laborer’s income. J. Dev. Econ. 67 (2), 333–349. doi:10.1016/S0304-3878(01)00194-8
Jorgenson, A. K., and Clark, B. (2010). Assessing the temporal stability of the population/environment relationship in comparative perspective: A cross-national panel study of carbon dioxide emissions. Popul. Environ. 32 (1), 196027–200541. doi:10.1007/s11111-010-0117-x
Kang, L., and Song, Z. (2020). Input-output efficiency of economic growth: A multielement system perspective. Sustainability 12 (11), 4624. Article 11. doi:10.3390/su12114624
Khan, S. U., and Cui, Y. (2022). Identifying the impact factors of sustainable development efficiency: Integrating environmental degradation, population density, industrial structure, GDP per capita, urbanization, and technology. Environ. Sci. Pollut. Res. 29 (37), 56098–56113. doi:10.1007/s11356-022-19809-4
Kilic, E., and Cankaya, S. (2020). Oil prices and economic activity in BRICS and G7 countries. Central Eur. J. Operations Res. 28 (4), 1315–1342. doi:10.1007/s10100-019-00647-8
Koo, W. W., and Mao, W. (1997). Productivity growth, technological progress, and efficiency change in Chinese agriculture after rural economic reforms: A DEA approach. China Econ. Rev. 8 (2), 157–174. doi:10.1016/S1043-951X(97)90004-3
Lane, J. (2011). CO2 emissions and GDP. Int. J. Soc. Econ. 38 (11), 911–918. doi:10.1108/03068291111171414
Li, H., and Shi, J. (2014). Energy efficiency analysis on Chinese industrial sectors: An improved Super-SBM model with undesirable outputs. J. Clean. Prod. 65, 97–107. doi:10.1016/j.jclepro.2013.09.035
Lin, X., Zhu, X., Han, Y., Geng, Z., and Liu, L. (2020). Economy and carbon dioxide emissions effects of energy structures in the world: Evidence based on SBM-DEA model. Sci. Total Environ. 729, 138947. doi:10.1016/j.scitotenv.2020.138947
Luenberger, D. G. (1992). Benefit functions and duality. J. Math. Econ. 21 (5), 461–481. doi:10.1016/0304-4068(92)90035-6
Ma, M., Yan, R., and Cai, W. G. (2017). An extended STIRPAT model-based methodology for evaluating the driving forces affecting carbon emissions in existing public building sector: Evidence from China in 2000–2015. Nat. Hazards 89 (1), 741–756. doi:10.1007/s11069-017-2990-4
Majewska, A., and Gierałtowska, U. (2022). Impact of economic affluence on CO2 emissions in CEE countries. Energies 15 (322), 322. doi:10.3390/en15010322
Malmquist, S. (1953). Index numbers and indifference surfaces. Trab. Estad. 4 (2), 209–242. doi:10.1007/BF03006863
Manuel Jesús, H.-O., García-Alguacil, M., Terrados, J., and Brito, P. (2020). Measurement of environmental efficiency in the countries of the European Union with the enhanced data envelopment analysis method (DEA) during the period 2005–2012. Environ. Sci. Pollut. Res. 27 (6), 15691–15715. doi:10.1007/s11356-020-08029-3
Marquaridt, D. W. (1970). Generalized inverses, ridge regression, biased linear estimation, and nonlinear estimation. Technometrics 12 (3), 591–612. doi:10.1080/00401706.1970.10488699
McKenzie, J. (2011). Mean absolute percentage error and bias in economic forecasting. Econ. Lett. 113 (3), 259–262. doi:10.1016/j.econlet.2011.08.010
Miles, J. (2014). “R squared, adjusted R squared,” in Wiley StatsRef: Statistics reference online (Hoboken: John Wiley and Sons). doi:10.1002/9781118445112.stat06627
Mitić, P., Munitlak Ivanović, O., and Zdravković, A. (2017). A cointegration analysis of real GDP and CO2 emissions in transitional countries. Sustainability 9 (4), 568. doi:10.3390/su9040568
Mostafa, G., and Mahmood, M. (2015). The rise of the BRICS and their challenge to the G7. Int. J. Emerg. Mark. 10 (1), 156–170. doi:10.1108/IJOEM-07-2012-0063
Nistor, P. (2015). FDI implications on BRICS economy growth. Procedia Econ. Finance 32, 981–985. doi:10.1016/S2212-5671(15)01557-9
Oh, D. (2010). A global Malmquist-Luenberger productivity index. J. Prod. Analysis 34 (3), 183–197. doi:10.1007/s11123-010-0178-y
Oh, D. (2009). A global malmquist-luenberger productivity index—an application to OECD countries 1990-2004. Working Paper Series in Economics and Institutions of Innovation, Article 164.
Pan, X., Guo, S., Han, C., Wang, M., Song, J., and Liao, X. (2020). Influence of FDI quality on energy efficiency in China based on seemingly unrelated regression method. Energy 192, 116463. doi:10.1016/j.energy.2019.116463
Panayotou, T. (1993). “Empirical tests and policy analysis of environmental degradation at different stages of economic development,” in ILO working papers (working paper No. 228; technology and employement programme) (Geneva: International Labour Organization).
Parris, T. M., and Kates, R. W. (2003). Characterizing and measuring sustainable development. Annu. Rev. Environ. Resour. 28 (1), 559–586. doi:10.1146/annurev.energy.28.050302.105551
Pastor, J. T., and Lovell, C. (2005). A global Malmquist productivity index. Econ. Lett. 88, 266–271. doi:10.1016/j.econlet.2005.02.013
Pradhan, A. K., Sachan, A., Sahu, U. K., and Mohindra, V. (2022). Do foreign direct investment inflows affect environmental degradation in BRICS nations? Environ. Sci. Pollut. Res. 29 (1), 690–701. doi:10.1007/s11356-021-15678-5
Ratti, R. A., and Vespignani, J. L. (2016). Oil prices and global factor macroeconomic variables. Energy Econ. 59, 198–212. doi:10.1016/j.eneco.2016.06.002
Reinert, E. S. (2008). How rich countries got rich and why poor countries stay poor. London: Anthem Press.
Rodionova, I., Shuvalova, O., and Mareeva, M. (2018). “BRICS in the world energy sector development trends,” in The 31st International conference on efficiency, cost, optimization, simulation and environmental impact of energy systems, June 17 to 21 2018, Guimarães, Portugal.
Sachs, J. D., Kroll, C., Lafortune, G., Fuller, G., and Woelm, F. (2021). The Decade of Action for the sustainable development goals [sustainable development report]. Cambridge: Cambridge University Press.
Sahoo, B. K., Luptacik, M., and Mahlberg, B. (2011). Alternative measures of environmental technology structure in DEA: An application. Eur. J. Operational Res. 215 (3), 750–762. doi:10.1016/j.ejor.2011.07.017
Saidi, K., and Hammami, S. (2015). The impact of CO2 emissions and economic growth on energy consumption in 58 countries. Energy Rep. 1, 62–70. doi:10.1016/j.egyr.2015.01.003
Santana, N., Mariano, E., Camioto, F., and Rebelatto, D. (2015). National innovative capacity as determinant in sustainable development: A comparison between the BRICS and G7 countries. Int. J. Innovation Sustain. Dev. 9 (3/4), 384. doi:10.1504/IJISD.2015.071860
Shao, Q., Yuan, J., Lin, J., Huang, W., Ma, J., and Ding, H. (2021). A SBM-DEA based performance evaluation and optimization for social organizations participating in community and home-based elderly care services. PloS One 16 (3), e0248474. doi:10.1371/journal.pone.0248474
Shrestha, N. (2020). Detecting multicollinearity in regression analysis. Am. J. Appl. Math. Statistics 8 (2), 39–42. doi:10.12691/ajams-8-2-1
Sun, S., and Huang, C. (2020). Energy structure evaluation and optimization in BRICS: A dynamic analysis based on a slack based measurement DEA with undesirable outputs. Energy 216, 119251. doi:10.1016/j.energy.2020.119251
Tone, K. (2001). A slacks-based measure of efficiency in data envelopment analysis. Eur. J. Operational Res. 130 (3), 498–509. doi:10.1016/S0377-2217(99)00407-5
Tone, K. (2004). Dealing with undesirable outputs in DEA: A slacks-based measure (SBM) approach. Nippon Opereshonzu, Risachi Gakkai Shunki Kenkyu Happyokai Abusutorakutoshu, 44–45.
Tsai, W.-H., Lee, H.-L., Yang, C.-H., and Huang, C.-C. (2016). Input-output analysis for sustainability by using DEA method: A comparison study between European and asian countries. Sustainability 8 (1230), 1230. doi:10.3390/su8121230
Weber, H., and Sciubba, J. D. (2018). The effect of population growth on the environment: Evidence from European regions. Eur. J. Popul. = Revue Eur. de Démogr. 35 (2), 379–402. doi:10.1007/s10680-018-9486-0
Wilson, D., and Purushothaman, R. (2006). “Dreaming with BRICs: The path to 2050,” in Emerging economies and the transformation of international business: Brazil, Russia, India and China (BRICs). Editor S. C. Jain (Cheltenham: Edward Elgar Publishing).
Xin, Y., Zheng, K., Zhou, Y., Han, Y., Tadikamalla, P. R., and Fan, Q. (2022). Logistics efficiency under carbon constraints based on a super SBM model with undesirable output: Empirical evidence from China’s logistics industry. Sustainability 14 (9), 5142. doi:10.3390/su14095142
Yang, H., and Pollitt, M. (2010). The necessity of distinguishing weak and strong disposability among undesirable outputs in DEA: Environmental performance of Chinese coal-fired power plants. Energy Policy 38 (8), 4440–4444. doi:10.1016/j.enpol.2010.03.075
Yang, T., Zhou, K., and Zhang, C. (2022). Spatiotemporal patterns and influencing factors of green development efficiency in China’s urban agglomerations. Sustain. Cities Soc. 85, 104069. doi:10.1016/j.scs.2022.104069
York, R., Rosa, E., and Dietz, T. (2003). STIRPAT, IPAT and ImPACT: Analytic tools for unpacking the driving forces of environmental impacts. Ecol. Econ. 46, 351–365. doi:10.1016/S0921-8009(03)00188-5
Zhao, M., Liu, F., Song, Y., and Geng, J. (2020). Impact of air pollution regulation and technological investment on sustainable development of green economy in eastern China: Empirical analysis with panel data approach. Sustainability 12 (8), 3073. Article 8. doi:10.3390/su12083073
Zheng, Z. (2021). Energy efficiency evaluation model based on DEA-SBM-Malmquist index. Energy Rep. 7, 397–409. doi:10.1016/j.egyr.2021.10.020
Keywords: sustainable development, data envelopment analysis (DEA), BRICS and G7 countries, global Malmquist-Luenberger productivity index, SBM-DEA model with undesirable output, energy consumption
Citation: Cheng S, Addis AK, Chen L and Zhu Z (2023) Sustainable development efficiency and its influencing factors across BRICS and G7 countries: An empirical comparison. Front. Energy Res. 11:1115459. doi: 10.3389/fenrg.2023.1115459
Received: 04 December 2022; Accepted: 15 February 2023;
Published: 27 February 2023.
Edited by:
Alberto-Jesus Perea-Moreno, University of Cordoba, SpainReviewed by:
Ibrahim Cutcu, Hasan Kalyoncu University, TürkiyeRıdvan Karacan, Kocaeli University, Türkiye
Copyright © 2023 Cheng, Addis, Chen and Zhu. This is an open-access article distributed under the terms of the Creative Commons Attribution License (CC BY). The use, distribution or reproduction in other forums is permitted, provided the original author(s) and the copyright owner(s) are credited and that the original publication in this journal is cited, in accordance with accepted academic practice. No use, distribution or reproduction is permitted which does not comply with these terms.
*Correspondence: Amsalu K. Addis, amy.kid370@gmail.com
†These authors have contributed equally to this work