Improved unscented Kalman filter based interval dynamic state estimation of active distribution network considering uncertainty of photovoltaic and load
 Jiawei Wu
 Keman Lin
  Zizhao Wang
 Yang Li
- College of Energy and Electrical Engineering, Hohai University, Nanjing, China
State estimation of active distribution network (ADN) plays an important role in distribution energy management system. The increase penetration of distributed generations, especially the distributed photovoltaic (PV), in ADN leads to high uncertainty of ADN’s operation and the state of the ADN varies with the variation of the PV output power. For the uncertainty of PV power output, an interval dynamic state estimation (IDSE) method, which estimates the interval of ADN state variables is proposed in this paper. Firstly, considering the slow computation speed of the Unscented Kalman Filter (UKF), the square root UKF is used to predict the real-time operating level of the state variables. Secondly, since the power output of PV has features of the variation randomly, the neural network-based prediction intervals is employed to predict the power output interval of PV. Finally, the normal fluctuation range of ADN state is modelled as a bilevel non-linear programming problem to perform IDSE, which in turn monitors the operating state of ADN. The proposed method is evaluated on the IEEE 33-node and IEEE 123-node systems, respectively. The test results demonstrate that the dynamic status of the ADN can be tracked accurately using the proposed method.
1 Introduction
State estimation (SE) is the basis for operation and control of active distribution network (ADN), providing a reliable foundation for advanced applications such as voltage control, security assessment, reactive power optimization, etc. The weighted least squares (WLS) method is the most used algorithm for traditional static state estimation (SSE). However, the large number of distributed generators (DG) such as photovoltaics (PV) connected to ADN highlights the non-linearity problem in ADN. Traditional SSE cannot satisfy real-time requirements, especially in capturing dynamic characteristics, the dynamic state estimation (DSE) needs to be studied to support the efficient operation of ADN (Zhao et al., 2019).
The DSE could not only estimate the current state but also predict the state of the near future (Zhao et al., 2021), which is benefit for the timely problem detection and control of ADN, such as voltage exceeding limits. The traditional DSE method mainly includes Kalman Filter (KF) (Julier and Uhlmann, 2004, 2004; Valverde and Terzija, 2011; Karimipour and Dinavahi, 2015; Massignan et al., 2020). The Kalman-based DSE method, such as Extended Kalman Filter (EKF), is implemented on the assumption that the noise follows Gaussian distribution (Massignan et al., 2020). Unscented Kalman Filter (UKF) achieves higher accuracy than EKF due to unscented transformation, it propagates the mean and covariance through unscented transformation while capturing their nature to third order [6]. However, the accuracy of the UKF is dependent on the selection of initial values and the algorithm is too time consuming (Zhao et al., 2017), so it needs further improvement. Meanwhile, the large-scale grid integration of PV to ADN makes the results of SE need to consider more uncertainty factors, and how to consider the impact of uncertainty on SE is an urgent problem (Sihag and Tajer, 2018).
In general, the main methods of modelling uncertainty variables in ADN are probabilistic models (Valverde et al., 2013; Aien et al., 2014), fuzzy number models (AL-Othman, 2009) and interval number models (Rakpenthai et al., 2012). In (Valverde et al., 2013), the Gaussian mixture models are used to obtain the probability density function of DG and load, the result of Gaussian mixture models is introduced as input variables in state estimation of ADN. In (Aien et al., 2014), an analytical probabilistic-possibilistic tool based on the evidence theory and joint propagation of possibilistic and probabilistic uncertainties is proposed for the power flow uncertainty assessment. In (AL-Othman, 2009), the affiliation functions for loads and different DG outputs are established based on plausibility measures, and linear SE is performed by means of fuzzy analysis methods. The above methods can achieve good results, but the DSE methods based on probabilistic models and fuzzy number models need to obtain a priori probability density functions of uncertain variables in advance, which leads to an increase in the complexity of algorithm. In addition, the probability distribution of conventional electrical loads can be obtained from historical data in a real ADN, while the complete probability density function of PV power output is difficult to obtain. In most cases, only the upper and lower boundaries of its PV power fluctuations are known (Quan et al., 2014).
In contrast, the use of interval number model to describe uncertainty problems in SE is of greater application. Interval number model does not need to obtain specific distributions of variables, it only focuses on information about the upper and lower bounds of each uncertain variable (Khosravi et al., 2011). At present, interval state estimator (ISE) has been initially investigated in ADN. In (Al-Othman and Irving, 2005), an optimization model is proposed for the interval SE that the measurement function is linearized as constrained formulations to estimate the upper and lower bounds on the states. In (Wang et al., 2018), an optimal solution method for interval SE is proposed to detect abnormal measurements. In (Huang et al., 2019), an optimization model of interval SE is combined with bad data identification to enhance the robustness of interval SE. In (Ngo and Wu, 2021), nonlinear measurement equation is transformed into dual inequality linear equations by mean value theorem to ensure the reliability of estimated intervals. However, the current ISE methods focus on interval static SE and there is little research on interval dynamic state estimator (IDSE).
In addition to the influence of uncertainty factors, the lack of real-time measurements limits the effective application of SE. Establishing accurate pseudo-measurement models can improve data redundancy and make the SE results of ADN more accurate (Schlösser et al., 2014). The data-driven method can mine the features of high-dimensional complex data and is highly superior in improving the accuracy of pseudo-measurement models (Massaoudi et al., 2021). In (Manitsas et al., 2012; Abdel-Majeed et al., 2014), the artificial neural networks are used for pseudo-measurement modelling, but to determine the model weights, the error distribution needs to be obtained in advance. In (Zhang et al., 2019), a deep recurrent neural network based pseudo-measurement postulating module is used to learn complex nonlinear functions to improve the accuracy of measurements. However, the modelling of pseudo-measurements is also subject to uncertainty factors that leads to reduced accuracy. Inspired by (Khosravi et al., 2011; Quan et al., 2014), pseudo-measurements can be modelled using interval models.
To deal with the uncertainty factors and lack of real-time measurements in ADN, an IDSE method is proposed for ADN integrated with PVs in this paper.
(1) In order to increase the calculation speed of the UKF without reducing accuracy, the square root of the covariance matrix is used instead of the covariance matrix in UKF and the improved UKF is used to determine the operating median values of all state variables.
(2) Neural network based prediction interval method is used to model the uncertainty of both pseudo-measurement of node injected power and real-time measurement in the system.
(3) The normal fluctuation range of ADN state is modelled as a bilevel non-linear programming problem to obtain the upper and lower bounds.
The simulations are carried out on IEEE 33-node and IEEE 123-node systems to evaluate the effectiveness of the proposed DSE method.
2 Dynamic state estimation based on square root unscented Kalman filter
2.1 Dynamic state estimation model
The state and measurement model of the nonlinear ADN can be written as follows (Zhao, 2018):
where,
2.2 Square root unscented Kalman filter
2.2.1 Unscented Kalman filter
UKF is based on the basic steps of the Kalman filter, introducing the unscented transform as a sampling method to approximate the nonlinearity. The basic principle of UKF is to construct the Sigma point set with variance as the variance of the state variable around the mean point of the state variable, then perform a nonlinear transformation on each point in this point set, and finally weight the sum to obtain the state variable and variance after the nonlinear transformation, this method can achieve at least second order accuracy.
Unscented transform process: x is a random variable with mean
Perform a nonlinear transformation
UKF consists of two main steps: time update and measurement update.
Step 1: time update
Step 2: measurement update
The detailed steps and derivation process of UKF can be found in [6]. The traditional UKF algorithm needs to perform a non-linear transformation on each sampling point, which is a quite complex calculation and has obvious numerical errors. As a result, it will affect the non-negative characterization and symmetry of error covariance, which will affect convergence speed and stability. To improve the efficiency and accuracy of filtering algorithm, the square root of covariance matrix can be used instead of covariance matrix in traditional UKF algorithm during recursive operation process.
2.2.2 Steps of square root unscented Kalman filter
The basic idea of square root UKF (SR-UKF) is to perform a QR decomposition of state variance matrix Pk in the UKF process, so that it satisfies
Thus, Eq. 7 in time update step is modified as follows:
Eq. 10 in measurement update step is modified as follows:
Eq. 12 and Eq. 14 are modified as follows respectively:
where,
3 Interval dynamic state estimator
In this section, a new generalized interval state estimator is proposed for ADN. It consists of three parts: SR-UKF, neural network (NN) and state uncertainty evaluation. SR-UKF is applied to obtain the operating states
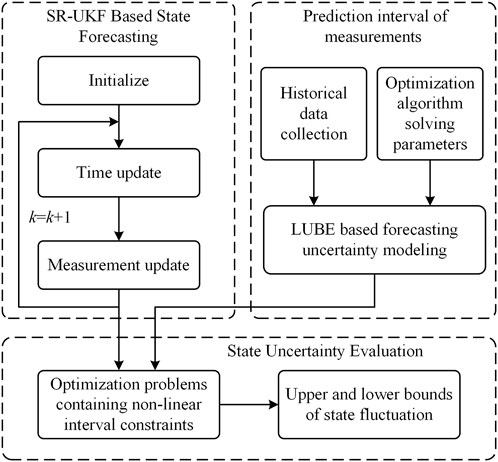
FIGURE 1. The overall structure of Interval dynamic state estimator.
3.1 Prediction interval of measurements
Commonly used indicators for prediction interval assessment are prediction interval coverage probability (PICP), prediction interval normalized average width (PINAW) and prediction interval normalized root-mean-square width (PINRW):
where, n is the number of samples,
where, R is the range of the underlying target (maximum minus minimum), which ensures that PINAW is normalized to the interval [0,1]. Too wide interval leads to increased uncertainty in prediction results, reducing the predictability of the results for system scheduling. PINRW gives greater weight to wider intervals than PINAW, and practical results show that PINRW is more beneficial than PINAW for obtaining high quality intervals predictions [13].
The lower and upper boundary estimation (LUBE) theory [14] is based on a multi-layer perceptron neural network structure, which tunes the single node structure of the output layer of the back propagation neural network into a dual output node structure with lower and upper boundary values of prediction interval. Compared with traditional prediction interval schemes, LUBE avoids the limitations of data distribution assumptions and complex calculations. The prediction interval model based on LUBE is shown in Figure 2, the number of layers and the number of nodes in each layer of neural network in LUBE can be adjusted according to actual situation.
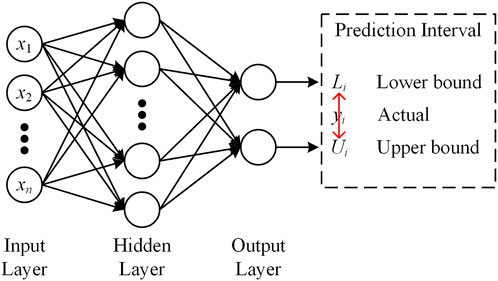
FIGURE 2. Prediction Interval model based on LUBE.
For PV, the factors affecting the PV power output include solar radiation S, temperature T and humidity H. The inputs to the model at time i is:
The output after forward propagation is:
where,
where,
3.2 Operating state uncertainty evaluation
To better reflect the influence of system uncertainties on ADN state estimation results, all bus measurements in the IDSE model established in this paper are objectively quantified and described as interval numbers, resulting in the solved system state variables are also interval numbers, which can provide effective system state boundary information for dispatchers.
The interval number [a] is defined as a non-empty real number set satisfying
where, n is the number of buses, active power P and reactive power Q are measurements, voltage magnitude U and phase angle
IDSE is to determine the state variable information of ADN based on the upper and lower bound information of measurement vector and non-linear mapping equation
where,
where,
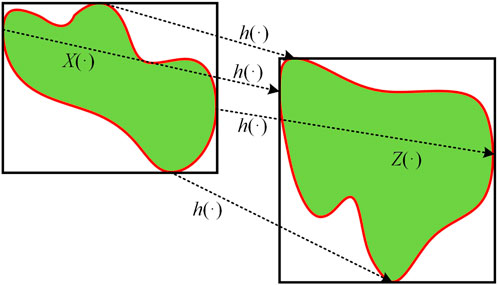
FIGURE 3. The relationship between the uncertainty sets X( ) and Z( ).
It is difficult to establish uniform analytical expressions and standard analytical methods (Wang et al., 2013). However, based on the theory of unknown-but-bounded error (UBBE), the original problem can be transformed into two optimization problems containing non-linear interval constraints, where the upper and lower bounds on the variables to be solved are obtained separately (Bargiela et al., 2003). Thus, the interval state estimation model developed in this paper is expressed as follows:
Objectives:
s.t.
where,
The estimation of individual state variable is independent of each other, as shown in Eq. 32, subject to the same equality and inequality constraints. The equality constraint contains active and reactive power balance constraints Eqs 33–35. Inequality constraints include PV forecasting uncertainty constraints Eq. 36 and load forecasting uncertainty constraints Eqs 37, 38. The upper and lower bounds of the forecasting uncertainty are updated in real time according to NN based LUBE.
4 Case study
In order to further verify the effectiveness and feasibility of the proposed IDSE method, a simulation study on IEEE 123-bus distribution system is carried out. The test system has a rated voltage of 4.16 kV and a total load of 3620 + j1324 kVA, with individual load capacities and network branch parameters detailed in (Chai et al., 2018). 12 PV units are installed at 12 nodes, whose capabilities and locations are listed in Table 1. In addition, some nodes are selected to arrange real-time measurement devices, whose real-time measured power value is obtained from the power flow calculation of IEEE 123-bus system, and measurement error of
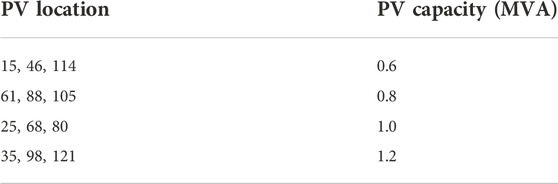
TABLE 1. Capacity and location of PV units.
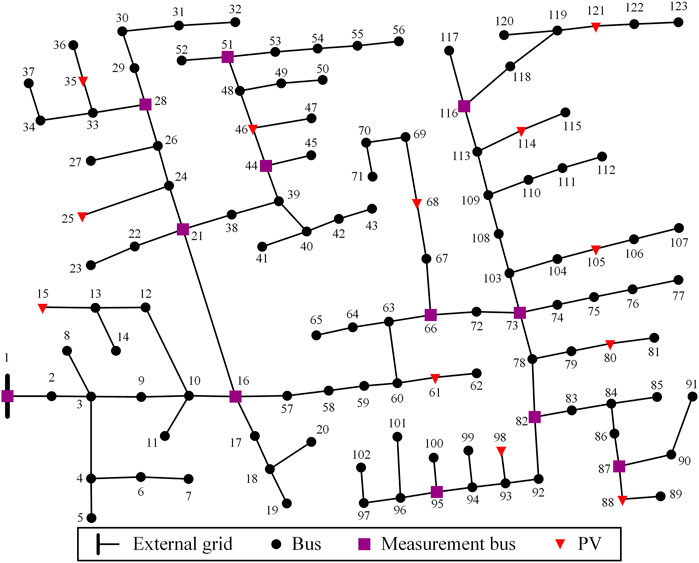
FIGURE 4. Topology of the extended IEEE-123 bus distribution system.
4.1 Prediction interval of measurements
(1) For PV power output, the ambient temperature, direct radiation, scattered radiation, and total radiation around the PV plant at various time sections during a week in a certain region are used as a source for PV power output prediction interval. The parameters of the LUBE are listed in Table 2. The resulting PV power output prediction interval based on LUBE estimates the PV power output curve at different time sections on a typical day is shown in Figure 5.
(2) For load, historical load data from AEMO (2006–2010) in New South Wales, Australia (Qiu et al., 2018) was used as a sample for load prediction interval. The resulting load prediction interval estimates the load curve at different times sections on a typical day is shown in Figure 6.
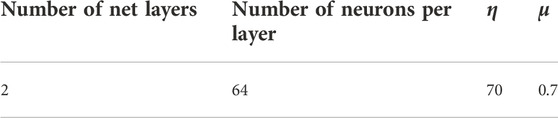
TABLE 2. LUBE parameters setting.
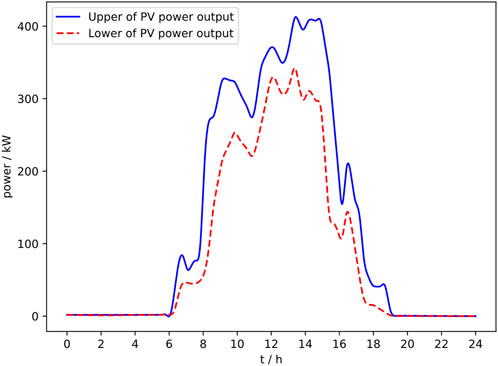
FIGURE 5. Prediction interval curve of PV power output on a typical day.
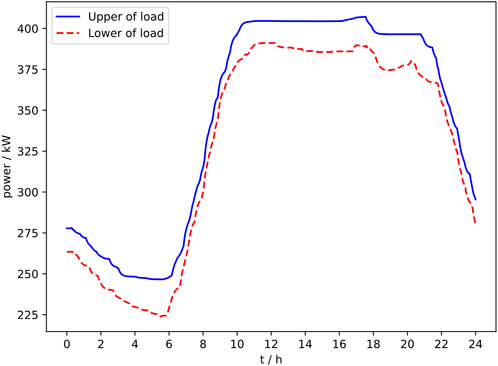
FIGURE 6. Prediction interval curve of load on a typical day.
4.2 Interval dynamic state estimation
In order to make comparison of the results of IDSE for ADN, the PV power output interval [0, 0.1] kW at 01:00 a.m. and [302, 345] kW at 13:00 p.m. are selected for the test, based on which the EKF and UKF are used for the IDSE analysis with SR-UKF proposed in this paper. Figures 7, 8 show the results of IDSE in ADN based on these three methods.
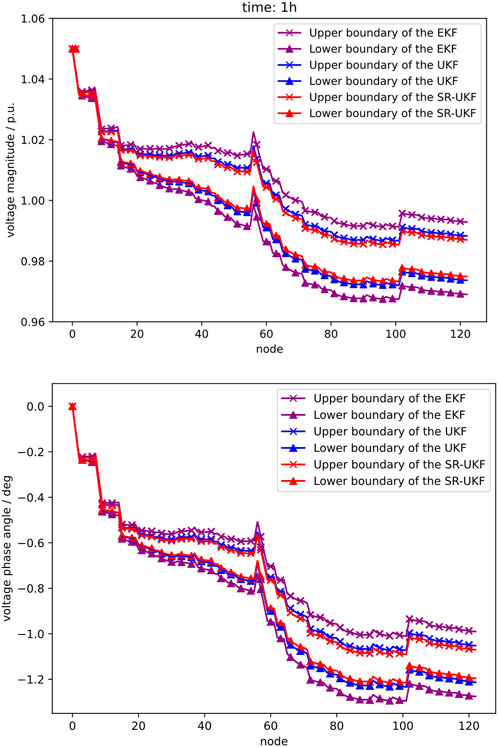
FIGURE 7. Estimation of node voltage amplitude and phase angle at t = 1 h.
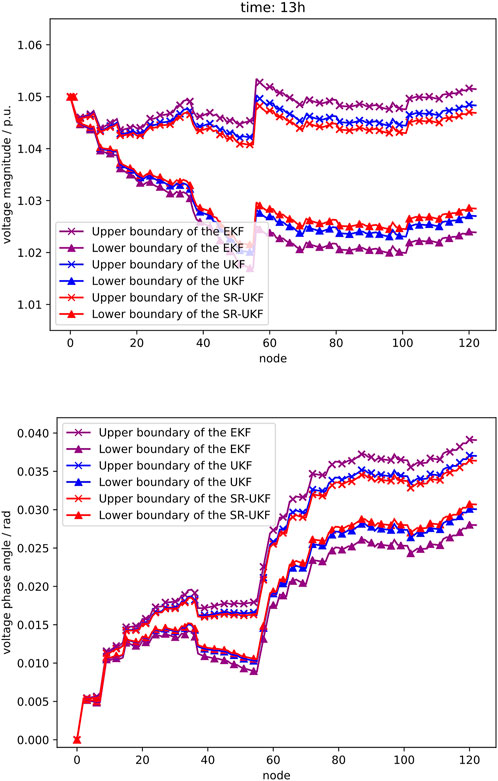
FIGURE 8. Estimation of node voltage amplitude and phase angle at t = 13 h.
As can be seen from the IDSE results shown in Figures 7, 8, the interval fluctuations in injected power of node cause the voltage magnitude and phase angle to fluctuate within a certain range, and the access to PV in ADN will increase the voltage level of the system. The comparison analysis shows that at any node of the ADN, the result interval of the IDSE method used in this paper is smaller than that of the EKF and closer to the result interval of the UKF, demonstrating that the conservativeness of the uncertain DSE solution can be effectively reduced by using the DSE algorithm with high accuracy. The EKF linearizes the system through Jacobian matrix calculation, which ignore higher order terms, making the state estimation of EKF less accurate and therefore the interval range obtained through the EKF is larger. The UKF approximates the non-linear system by unscented transformation, which can be approximated to at least second order for non-Gaussian inputs. Therefore, the UKF is more accurate than the EKF and has a smaller interval range than EKF. SR-UKF reduces computational errors and improves computational efficiency by propagating the SR of matrix instead of the matrix itself, its accuracy is slightly better than that of the UKF. SR-UKF has almost the same interval range as UKF.
In order to compare the conservativeness of the above three methods more intuitively, a comparative analysis of the interval width of IDSE for node voltage magnitude and phase angle is carried out, using two indicators to assess the conservativeness:
where,
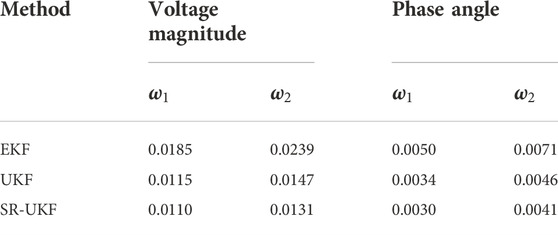
TABLE 3. Comparison bounds of node at t = 1 h

TABLE 4. Comparison bounds of node at t = 13 h
The above results show that the SR-UKF method used for IDSE in this paper has a narrower solution interval width compared to EKF and UKF, is less comparative and has a higher reliability of the estimation results. Meanwhile, comparing the results for t = 1 h and t = 13 h shows that the PV output increases as the light intensity becomes stronger, making the uncertainty also increasing, so that the interval width at t = 13 h is wider than that at t = 1 h.
Next, the computing efficiency of the three methods is compared and analyzed, are shown in Table 5. From the comparison results, it can be seen that the SR-UKF method used in this paper has much better computing efficiency than EKF and UKF, and it is suitable for large-scale networks, thus making it suitable for online applications.
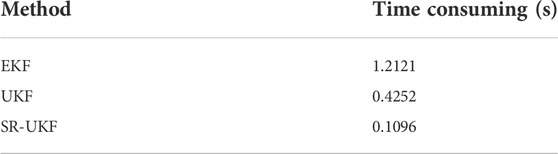
TABLE 5. Comparison results of computing efficiency between different algorithms.
5 Conclusion
An interval dynamic state estimation considering the uncertainty of PV and load has been proposed in this paper.
(1) SR-UKF is used to determine the operating median values of all state variables to improve computing efficiency.
(2) The interval is used to analyze the measurement uncertainty of ADN, the NN based LUBE theory is used to predict the PV power output interval and the active and reactive power interval of unmeasured load.
(3) The interval state estimation is modelled as a bilevel non-linear programming problem to obtain the upper and lower bounds. The modified test case demonstrates the feasibility and effectiveness of the proposed IDSE method.
The next step of the research will be to study the analysis of system measurement outliers (bad data), zero injection power node constraints and other factors to improve the online application of IDSE method for ADN.
Data availability statement
The original contributions presented in the study are included in the article/supplementary material, further inquiries can be directed to the corresponding author.
Author contributions
JW, KL, and FW contributed to the conception and design of the study. ZW are responsible for providing experimental design and data analysis. LS and YL are responsible for providing code implementation. All authors contributed to the manuscript writing revision, read, and approved the submitted version.
Funding
This work was supported in part by the Funds for International Cooperation and Exchanges of the National Natural Science Foundation of China under Grant 52061635102.
Conflict of interest
The authors declare that the research was conducted in the absence of any commercial or financial relationships that could be construed as a potential conflict of interest.
Publisher’s note
All claims expressed in this article are solely those of the authors and do not necessarily represent those of their affiliated organizations, or those of the publisher, the editors and the reviewers. Any product that may be evaluated in this article, or claim that may be made by its manufacturer, is not guaranteed or endorsed by the publisher.
References
Abdel-Majeed, A., Kattmann, C., Tenbohlen, S., and Saur, R. (2014). “Usage of Artificial Neural Networks for pseudo measurement modeling in low voltage distribution systems,” in Proceedings of the IEEE PES General Meeting|Conference Expo, National Harbor, MD, USA, 1–5. doi:10.1109/PESGM.2014.6938843
Aien, M., Rashidinejad, M., and Fotuhi-Firuzabad, M. (2014). On possibilistic and probabilistic uncertainty assessment of power flow problem: A review and a new approach. Renew. Sustain. Energy Rev 37, 883–895. doi:10.1016/j.rser.2014.05.063
AL-Othman, A. K. (2009). A fuzzy state estimator based on uncertain measurements. Measurement 42, 628–637. doi:10.1016/j.measurement.2008.10.007
Al-Othman, A. K., and Irving, M. R. (2005). A comparative study of two methods for uncertainty analysis in power system State estimation. IEEE Trans. Power Syst. 20, 1181–1182. doi:10.1109/TPWRS.2005.846163
Bargiela, A., Pedrycz, W., and Tanaka, M. (2003). A study of uncertain state estimation. IEEE Trans. Syst. Man. Cybern. A 33, 288–301. doi:10.1109/TSMCA.2002.806500
Chai, Y., Guo, L., Wang, C., Zhao, Z., Du, X., and Pan, J. (2018). Network partition and voltage coordination control for distribution networks with high penetration of distributed PV units. IEEE Trans. Power Syst. 33, 3396–3407. doi:10.1109/TPWRS.2018.2813400
Huang, M., Wei, Z., Pau, M., Ponci, F., and Sun, G. (2019). Interval state estimation for low-voltage distribution systems based on Smart meter data. IEEE Trans. Instrum. Meas. 68, 3090–3099. doi:10.1109/TIM.2018.2877549
Jafarzadeh, S., Lascu, C., and Fadali, M. S. (2011). “Square Root Unscented Kalman Filters for state estimation of induction motor drives,” in Proceedings of the IEEE Energy Convers. Congr. Expo, Phoenix, AZ, USA, 75–82. doi:10.1109/ECCE.2011.6063751
Julier, S. J., and Uhlmann, J. K. (2004). Unscented filtering and nonlinear estimation. Proc. IEEE 92, 401–422. doi:10.1109/JPROC.2003.823141
Karimipour, H., and Dinavahi, V. (2015). Extended kalman filter-based parallel dynamic state estimation. IEEE Trans. Smart Grid 6, 1539–1549. doi:10.1109/TSG.2014.2387169
Khosravi, A., Nahavandi, S., Creighton, D., and Atiya, A. F. (2011). Lower upper bound estimation method for construction of neural network-based prediction intervals. IEEE Trans. Neural Netw. 22, 337–346. doi:10.1109/TNN.2010.2096824
Manitsas, E., Singh, R., Pal, B. C., and Strbac, G. (2012). Distribution system state estimation using an artificial neural network approach for pseudo measurement modeling. IEEE Trans. Power Syst. 27, 1888–1896. doi:10.1109/TPWRS.2012.2187804
Massaoudi, M., Abu-Rub, H., Refaat, S. S., Chihi, I., and Oueslati, F. S. (2021). Deep learning in Smart grid Technology: A review of recent advancements and future prospects. IEEE Access 9, 54558–54578. doi:10.1109/ACCESS.2021.3071269
Massignan, J. A. D., London, J. B. A., and Miranda, V. (2020). Tracking power system state evolution with maximum-correntropy-based extended kalman filter. J. Mod. Power Syst. Clean. Energy 8, 616–626. doi:10.35833/MPCE.2020.000122
Ngo, V., and Wu, W. (2021). Linear programming contractor for interval distribution state estimation using RDM arithmetic. IEEE Trans. Power Syst. 36, 2114–2126. doi:10.1109/TPWRS.2020.3033065
Qiu, X., Suganthan, P. N., and Amaratunga, G. A. J. (2018). Ensemble incremental learning Random Vector Functional Link network for short-term electric load forecasting. Knowl. Based. Syst 145, 182–196. doi:10.1016/j.knosys.2018.01.015
Quan, H., Srinivasan, D., and Khosravi, A. (2014). Short-Term load and wind power forecasting using neural network-based prediction intervals. IEEE Trans. Neural Netw. Learn. Syst 25, 303–315. doi:10.1109/TNNLS.2013.2276053
Rakpenthai, C., Uatrongjit, S., and Premrudeepreechacharn, S. (2012). State estimation of power system considering network parameter uncertainty based on parametric interval linear systems. IEEE Trans. Power Syst 27, 305–313. doi:10.1109/TPWRS.2011.2162859
Schlösser, T., Angioni, A., Ponci, F., and Monti, A. (2014). “Impact of pseudo-measurements from new load profiles on state estimation in distribution grids,” in Proceedings of the IEEE Int. Instrum. Meas. Technol. Conf. (I2MTC), Montevideo, Uruguay, 625–630. doi:10.1109/I2MTC.2014.6860819
Sihag, S., and Tajer, A. (2018). Power system state estimation under model uncertainty. IEEE J. Sel. Top. Signal Process. 12, 593–606. doi:10.1109/JSTSP.2018.2827322
Valverde, G., Saric, A. T., and Terzija, V. (2013). Stochastic monitoring of distribution networks including correlated input variables. IEEE Trans. Power Syst. 28, 246–255. doi:10.1109/TPWRS.2012.2201178
Valverde, G., and Terzija, V. (2011). Unscented Kalman filter for power system dynamic state estimation. IET Gener. Transm. Distrib. 5, 29. doi:10.1049/iet-gtd.2010.0210
Wang, B., He, G., Liu, K., Lv, H., Yin, W., and Mei, S. (2013). Guaranteed state estimation of power system via interval constraints propagation. IET Gener. Transm. &. Distrib. 7, 138–144. doi:10.1049/iet-gtd.2012.0333
Wang, H., Ruan, J., Wang, G., Zhou, B., Liu, Y., and Fu, X. (2018). Deep learning-based interval state estimation of AC Smart grids against sparse cyber attacks. IEEE Trans. Ind. Inf. 14, 4766–4778. doi:10.1109/TII.2018.2804669
Zhang, L., Wang, G., and Giannakis, G. B. (2019). “Distribution system state estimation via data-driven and physics-aware deep neural networks,” in Proceedings of the IEEE Data Sci. Workshop (DSW), Minneapolis, MN, USA, 258–262. doi:10.1109/DSW.2019.8755581
Zhao, J. (2018). Dynamic state estimation with model uncertainties using $H_\infty$ extended kalman filter. IEEE Trans. Power Syst. 33, 1099–1100. doi:10.1109/TPWRS.2017.2688131
Zhao, J., Netto, M., Huang, Z., Yu, S. S., Gomez-Exposito, A., Wang, S., Kamwa, I., Akhlaghi, S., Mili, L., Terzija, V., and Meliopoulos, A.S. (2021). Roles of dynamic state estimation in power system modeling, monitoring and operation. IEEE Trans. Power Syst. 36, 2462–2472. doi:10.1109/TPWRS.2020.3028047
Zhao, J., Netto, M., and Mili, L. (2017). A robust iterated extended kalman filter for power system dynamic state estimation. IEEE Trans. Power Syst. 32, 3205–3216. doi:10.1109/TPWRS.2016.2628344
Zhao, J., Qi, J., Huang, Z., Meliopoulos, A. P. S., Gomez-Exposito, A., Netto, M., Mili, L., Abur, A., Terzija, V., Kamwa, I., Pal, B., and Singh, A.K. (2019). Power system dynamic state estimation: Motivations, definitions, methodologies, and future work. IEEE Trans. Power Syst. 34, 3188–3198. doi:10.1109/TPWRS.2019.2894769
Keywords: interval dynamic state estimation, unscented Kalman filter, active distribution network, uncertainty, prediction interval
Citation: Wu J, Lin K, Wu F, Wang Z, Shi L and Li Y (2023) Improved unscented Kalman filter based interval dynamic state estimation of active distribution network considering uncertainty of photovoltaic and load. Front. Energy Res. 10:1054162. doi: 10.3389/fenrg.2022.1054162
Received: 26 September 2022; Accepted: 24 October 2022;
Published: 12 January 2023.
Edited by:
Lipeng Zhu, Hunan University, ChinaReviewed by:
Fu Shen, Kunming University of Science and Technology, ChinaHongyu Li, The University of Tennessee, Knoxville, United States
Copyright © 2023 Wu, Lin, Wu, Wang, Shi and Li. This is an open-access article distributed under the terms of the Creative Commons Attribution License (CC BY). The use, distribution or reproduction in other forums is permitted, provided the original author(s) and the copyright owner(s) are credited and that the original publication in this journal is cited, in accordance with accepted academic practice. No use, distribution or reproduction is permitted which does not comply with these terms.
*Correspondence: Feng Wu, wufeng@hhu.edu.cn