Numerical Weather Prediction Correction Strategy for Short-Term Wind Power Forecasting Based on Bidirectional Gated Recurrent Unit and XGBoost
 Yu Li
Yu Li Fei Tang
 Xin Gao
 - School of Electrical Engineering and Automation, Wuhan University, Wuhan, China
Accurate short-term wind power forecasting (WPF) plays a crucial role in grid scheduling and wind power accommodation. Numerical weather prediction (NWP) wind speed is the fundamental data for short-term WPF. At present, reducing NWP wind speed forecast errors contributes to improving the accuracy of WPF from the perspective of data quality. In this article, a variational mode decomposition combined with bidirectional gated recurrent unit (VMD-BGRU) method for NWP wind speed correction and XGBoost forecasting model are proposed. First, several NWP wind speed sub-series are divided by VMD to obtain more abundant multidimensional timing features. BGRU is applied to establish the potential relation between decomposed NWP wind speed sub-series and measured wind speed and get the proposed wind speed correction model. Then, a more clear regression forecasting model is trained based on XGBoost using historical measured wind speed and power. The corrected NWP wind speed is used to forecast wind power by XGBoost. Finally, the superiority of the proposed method is validated on a wind farm located in China. The results show that the proposed correction model and forecasting model outperform other compared models.
Introduction
Low-carbon economy is a worldwide problem of facilitating sustainable development (Li et al., 2021). In the past, coal, oil, and natural gas were the main primary energy, resulting in the rapid rise of carbon emissions, and global warming posed a threat to humans, directly or indirectly (Wang et al., 2019). Electrical energy is a vital form of energy. Constructing a new power system with a high penetration rate of new energy in the direction of low carbon is an effective way to reduce carbon emissions. In recent years, new energy power generation based on wind and solar energy has developed rapidly. According to the data released by Global Wind Report 2021, the global wind power installed capacity has reached 743 GW in 2020, of which 93 GW is newly installed (Global Wind Energy Council, 2021). It is widely recognized that wind power generation is one of the most potential and environmental energy resources (Okumus and Dinler, 2016). However, large-scale integration of wind power disrupts the balance of supply and demand in the power grid and brings huge challenges to safe and economic operation of the power grid (Zhang et al., 2021). Therefore, accurate and reliable wind power forecasting (WPF) is an important segment for improving energy efficiency and ensuring safe operation of future power systems (Zhang et al., 2020; Zheng et al., 2017).
There are many kinds of classification methods. According to the timescales, very-short-term (Zhao et al., 2019), short-term (Yang et al., 2019), medium, and long-term prediction (Liu and Chen, 2019) are included. In general, there is no strict timescale. Ultrashort-term (from minutes to hours) prediction is used to balance load and control wind turbine in real-time; short-term (from hours to days) forecasting is utilized to formulate power generation plans and arrange reserve capacity; medium- and long-term prediction (from weeks to years) is vital for planning of windmills and site selection (Chen et al., 2017). Four types of modeling theory are grouped: physical method, traditional statistical method, artificial intelligence (AI) method, and hybrid method. The physical method requires detailed wind farm background data and numerical weather prediction (NWP), which shows better performance in medium- and long-term prediction with high-quality NWP (Hu et al., 2020). The traditional statistical method is represented by autoregressive integrated moving average (ARIMA) (Singh et al., 2021), seasonal autoregressive integrated moving average (SARIMA) (Liu et al., 2021), multilayer perceptron (MLP) (Deo et al., 2018; Shen et al., 2021b), and extreme learning machine (ELM) (Li et al., 2016), showing great accuracy in very-short-term prediction. And, many clustering methods are used (Shen et al., 2020). The AI method is popular for WPF under high-dimensional and big data conditions. (Shen and Raksincharoensak., 2021b). For example, an artificial neural network (ANN) (Song et al., 2018) such as back propagation neural network (BPNN), wavelet neural network WNN, and deep neural network (DNN) (Shen et al., 2021a), such as long short-term memory (LSTM) (Liu et al., 2018), gated recurrent unit (GRU) (Niu et al., 2020), and deep belief network (DBN) (Wang et al., 2018). The hybrid method can integrate the advantages of multiple methods, including a combination of the hyperparameter optimization algorithm and forecasting model (Khalid and Javaid, 2020; Zhu et al., 2020; Shen et al., 2017; Shen and Raksincharoensak., 2021a), weighted combination of prediction results of multiple models (Wu and Xiao, 2019; Yang et al., 2018), and stacked combination of multiple models (Liu et al., 2021, Yan et al., 2018). In recent years, cutting-edge AI technologies represented by ensemble methods have emerged, among which extreme gradient boosting (XGBoost) (Chen and Guestrin, 2016; Yang et al., 2021a) is the most typical. There are many applications in forecasting. Zheng and Wu, (2019) use the XGBoost model with weather similarity analysis and feature engineering to predict wind power. Liao et al., 2019 use XGBoost to evaluate similarity between the forecasting and historical days for load forecasting. Choi and Hur, (2020) use random forest (RF), XGBoost, and LightGBMs as ensemble models to forecast photovoltaic power. Besides, the forecasting objective can be grouped to wind turbine, single wind farm, and regional wind farm. This article concentrates on the short-term WPF for a single wind farm.
At present, lots of studies focus on optimization and refinement of the prediction model. However, the improvement of WPF accuracy depends more on data quality. NWP data, measured wind data and power data, are used for WPF. In general, measured data are more consistent with physical phenomena than historical forecast data, and it is important for very-short-term WPF to make full use of its time-series autocorrelation. NWP is the indispensable data source for short-term WPF since the time series recursion method causes error accumulation based on measured data. However, the resolution and accuracy of NWP are limited, and technical breakthroughs cannot occur in the short term. How to improve the power prediction accuracy under the current NWP accuracy level is a problem that needs to be studied. NWP wind speed correction is an effective way to improve the WPF accuracy from the perspective of the data, not the prediction model. Dong et al. (2013) use a linear correction model based on wavelet transform to correct the low-frequency stationary component of NWP wind speed, but it ignores the information on other frequencies. Zhang et al. (2019) propose a bias-correction method using an average, variance trend to correct the simulated wind speed based on historical data. Hu et al. (2021) propose a hybrid NWP wind speed correction model based on principal component analysis and improved deep belief network. Wang et al. (2019) propose a sequence transfer correction algorithm to correct the NWP wind speed and to obtain the correction results under different time steps, which is suitable for very-short-term WPF. Zhao et al. (2017) divide wind speed forecasting series into segments and combine the Cuckoo search optimized fuzzy clustering and a priori algorithm to correct weather research and forecasting (WRF) wind speed. Yang et al. (2021b) propose an expanded sequence-to-sequence (E-Seq2Seq)–based data-driven SCUC expert system for dynamic multiple-sequence mapping samples, which can accommodate the mapping samples of SCUC and consider the various input factors that affect SCUC decision-making as the first study about SCUC problems (Yang et al., 2021c; Yang et al., 2019). It has strong generality, high solution accuracy, and efficiency over traditional methods. Therefore, how to make full use of the potential relationship between NWP wind speed and historical measured wind speed and propose a method for short-term forecasting of wind speed correction are still worth studying.
This article proposes a variational mode decomposition and bidirectional GRU (VMD-BGRU) correction strategy for NWP wind speed and applies the optimized NWP wind speed to forecast wind power using the ensemble learning method XGBoost. First, in order to enrich the features of the input data, the VMD algorithm is used to decompose the NWP wind speed. The BGRU is used to correct the NWP wind speed based on the potential correlation between the multiple decomposed NWP wind speed sub-series and the measured wind speed. Then, the XGBoost algorithm is utilized to build the forecasting model according to the regression relationship between the measured wind speed and power, and the corrected NWP wind speed is input into the prediction model to obtain the short-term prediction results of wind power. Finally, the evaluation metrics is used to assess the performance of NWP wind speed correction and wind power forecasting.
The remainder of this article is organized as follows. In Section 2, the whole flowchart is simply generalized, and the basic theory of VMD, BGRU, and XGBoost is explained. Case study and discussion about the proposed method are shown in Case Study. Conclusion concludes this article.
Methods
The framework of the proposed NWP wind speed correction strategy for short-term wind power forecasting is shown in Figure 1. First, the original NWP wind speed series is enriched by the VMD algorithm. The NWP wind speed is corrected with the measured wind speed as the target by the BGRU correction model. Then, the forecasting model based on XGBoost is trained with measured wind speed and power. Finally, improved forecasted wind power is obtained using corrected NWP wind speed as input.
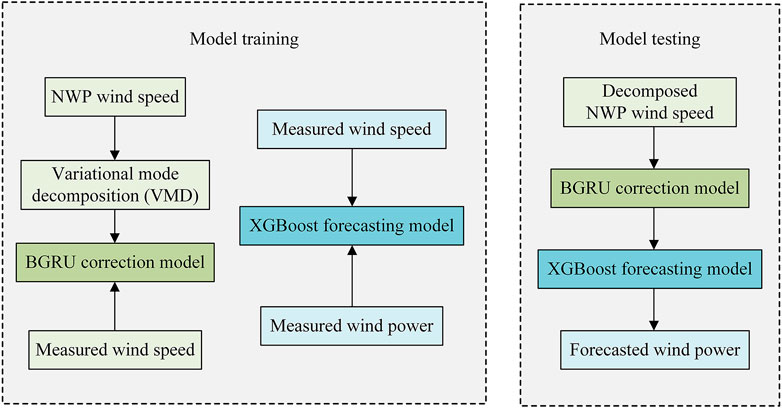
FIGURE 1. Frame of short-term wind power forecasting.
The NWP Wind Speed Correction Strategy
In the wind farm operation, the measured data mainly include wind speed, wind direction, air pressure, humidity, and temperature from the wind tower and the active output power of the wind farm from the SCADA. NWP is a method used to predict the state of atmospheric movement and weather phenomena by solving the operating equations of atmospheric movement by means of large computers under given initial and boundary conditions of the atmosphere (Al-Yahyai et al., 2011). However, the NWP applied to wind power forecasting is provided by meteorological products purchased by third-party forecasting platforms, which contain meteorological information, such as wind speed and direction, at different heights in a specific area (Heppelmann et al., 2017; Shen et al., 2020). In this article, only the measured wind speed at the hub and the NWP wind speed at 70 m are considered.
As we all know, the atmosphere is full of chaos, and there is no absolutely accurate forecast of wind speed. The difficulty of wind power forecasting caused by the inaccuracy of wind speed forecast is mainly reflected in the regression characteristics of wind speed and power. Generally speaking, the power of wind turbines is proportional to the third power of wind speed (Xu et al., 2021). The power curve of the wind farm is slightly fuzzy compared with that of the wind turbine, as shown in Figure 2. However, if the measured wind speed is replaced by NWP wind speed, as shown in Figure 3, the regression characteristics will be seriously lost. Moreover, NWP wind speed is generally less than the measured wind speed. For example, the range of NWP wind speed is concentrated in 0–8 m/s, while the measured wind speed is concentrated in 3–12 m/s. Obviously, the measured wind speed cannot be predicted in advance, which will bring difficulties to the WPF. Therefore, it is necessary to correct NWP wind speed.
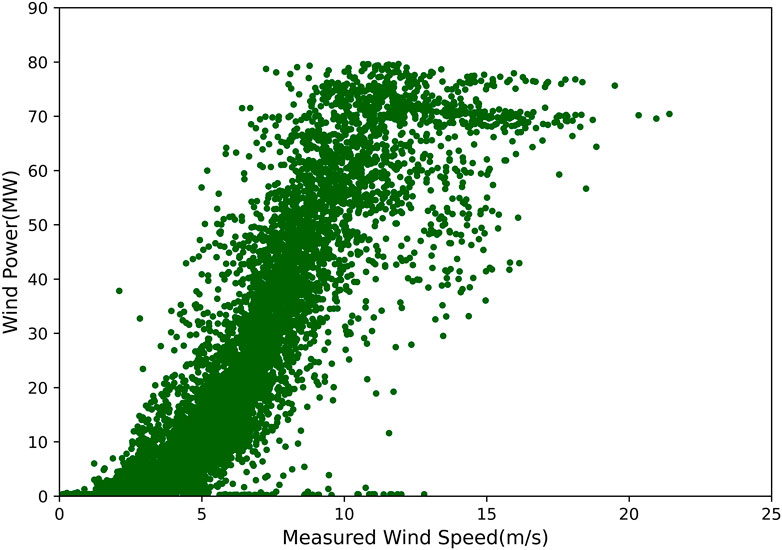
FIGURE 2. Relation between measured wind speed and wind power.
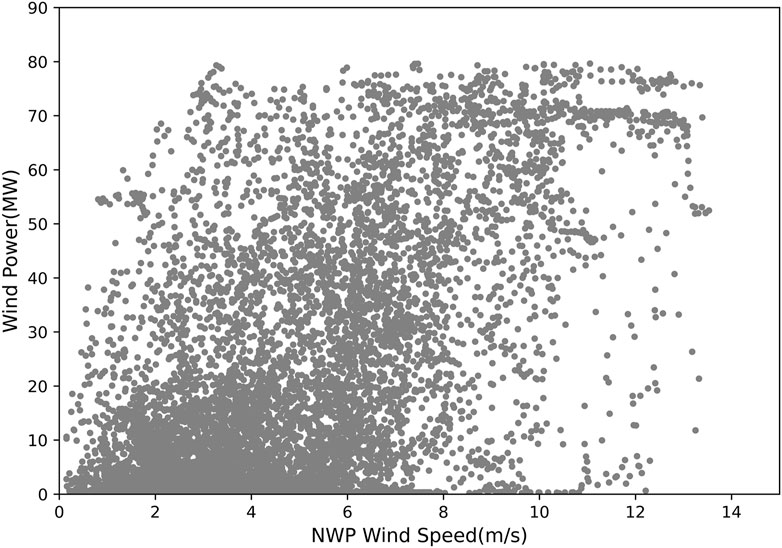
FIGURE 3. Relation between NWP wind speed and wind power.
First, the VMD algorithm is used to enrich the original NWP wind speed series by decomposing it to several sub-series. Then, the correction model is established by BGRU based on decomposed NWP wind speed and measured wind speed. The VMD algorithm and BGRU are explained as 2.2.1 and 2.2.2, respectively.
The VMD Algorithm
VMD is a new signal decomposition estimation method proposed in 2014 (Konstantin and Dominique, 2014) which aims to decompose the original complex signal into K sub-series with different central frequencies. The VMD method uses non-recursive and variational modal decomposition to process the original signal, which has better robustness to the measurement noise.
It is assumed that
where
In brief, the steps of the VMD algorithm are summarized as follows.
Step 1: Initializing
Step 2: Updating
Step 3: Stopping the iteration if given error
Take the NWP wind speed series at 2000 sampling points for example. As Figure 4 shows, IMF 1 to IMF 9 are the decomposed sub-series. There is no mode aliasing existed in all the IMFs. Therefore, VMD shows perfect performance in decomposing the non-stationary NWP wind speed signal. The selection of parameters, such as K and α, is discussed in the case study.
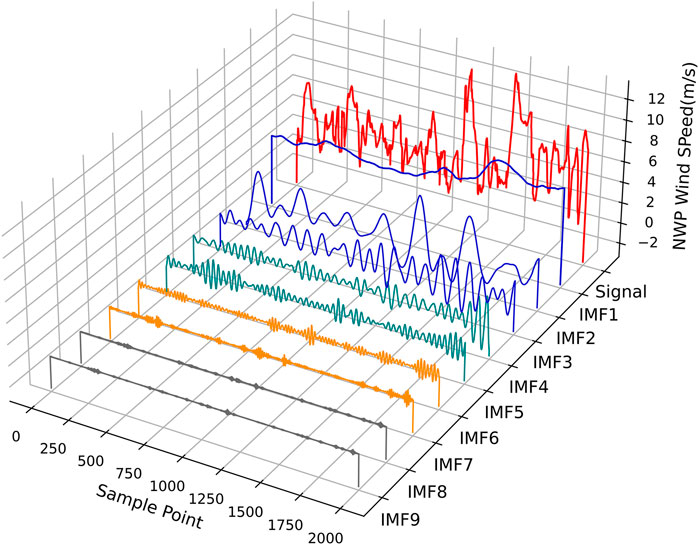
FIGURE 4. Results of VMD.
The BGRU Network
In this section, the correction model comprising BGRU is proposed. The basic building block GRU cell and its working scheme are presented at first. Then, BGRU is obtained by connecting two unidirectional GRUs.
The structure of a GRU cell and unidirectional GRU’s working scheme are shown in Figure 5. An update gate
where
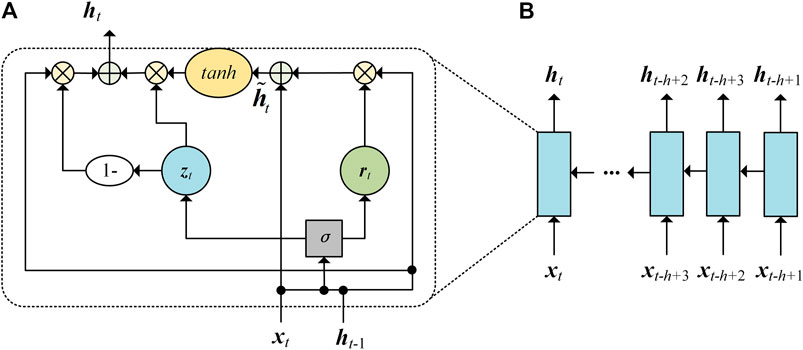
FIGURE 5. (A) Structure of the GRU cell. (B) Structure of GRU.
For the abovementioned GRU, variables are updated from the past to the future, so there is monodirectional dependence between the hidden states. Specifically, as shown in Figure 5,
where
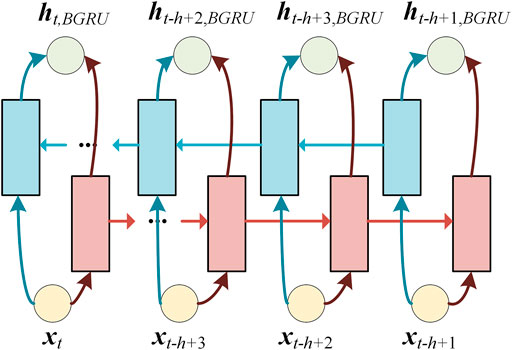
FIGURE 6. Structure of BGRU.
The Ensemble Forecasting Method
The forecasting model is described in this section. XGBoost is a boosting ensemble learning algorithm which iteratively generates new trees by continuously fitting the residuals of the previous tree and constructs the tree model into a classifier with higher accuracy and stronger generalization ability (Chen and Guestrin, 2016), which is widely used in lots of Kaggle competitions and has achieved good results in recent years. Compared with GBDT, the XGBoost has the following advantages. The XGBoost algorithm uses Hessian matrix to expand the loss function Taylor to the second order, transforms the original optimization problem into convex function to obtain the optimal solution, and solves the distributed computing problem which is difficult to implement in the GBDT algorithm. In addition to this, XGBoost regularizes the complexity of the tree and reduces the possibility of overfitting the model. Therefore, wind and power data can be better fitted by the XGBoost algorithm, and forecasting error is reduced, and higher prediction accuracy is achieved.
For the dataset
where
where
where
The iterative function based on additive training can be written as Eq. 13. Then, the second-order Taylor approximation of the original objective function is written as Eq. 14.
where
where j is the traversal on the leaf node;
Here,
Case Study
In this section, the actual wind farm data are utilized to support two experiments which are designed to verify the proposed NWP wind speed correction strategy and wind power forecasting method. The wind farm data include measured wind speed, measured wind direction, output wind power, and NWP from January to December 2019, which are sampled at a period of 15 min. However, only wind speed and power are used in this study since the relation between wind speed and wind power is mainly focused. This wind farm is located in eastern China, whose installed capacity is 85 MW.
The following experiments are implemented on a Windows 10 PC with AMD Ryzen 5 3550H, 2.1 GHz CPU, 16 GB of RAM and Python 3.8 with PyTorch 1.8.1.
The case study is divided into two parts, NWP wind speed correction and power forecasting. First, the NWP wind speed is corrected according to the measured wind speed by the VMD-BGRU correction strategy, which is to validate the effectiveness of the proposed wind speed correction strategy. And then, the forecasting model is trained by measured wind speed and wind power using the XGBoost algorithm since the measured data have clearer mapping. Finally, the corrected NWP wind speed is input to forecast wind power.
Performance Criterion
For the purpose of evaluating the correction and forecasting performance of the proposed strategy, the root mean square error (RMSE) and mean absolute error (MAE) are used as the performance criterions. In addition, the evaluation metrics of wind speed correction and WPF are a little bit different. Obviously, the smaller the value, the better the performance of the proposed model. These equations are defined as follows:
where
Data Processing
For one thing, the wind farm data have some abnormal data caused by wind curtailment, power cuts, failure of measuring device, and so on, which should be deleted. For another, normalization is required to eliminate the different data ranges between wind speed and wind power to better meet the requirement of model training, which is expressed as follows:
where
The Results of NWP Wind Speed Correction
In this section, the accuracy of NWP wind speed is improved through the VMD-BGRU correction strategy. To verify the superiority of the proposed correction strategy, the original NWP wind speed and corrected wind speed by BGRU is compared with VMD-BGRU. The result of the first week (a total of 672 sample points) in March and June is taken as a test dataset. Accordingly, the training dataset is the previous 3 months (a total of 8640 sample points). Besides, RMSEv and MAEv are used as evaluation metrics, whose units are m/s.
The number of IMF K is determined by observing central frequency. If the IMFs with close center frequency appear, it is considered to be over-decomposed. There are 8640 NWP wind speed samples that need to be decomposed in the testing set. The K is chosen as 6 by the traversal method. α is the default value 2000. τ is 1e-6 to ensure the fidelity of the actual signal decomposition. The number of BGRU layers is set to 2. The sub-series decomposed from NWP wind speed is fed into the BGRU network which extracts complex relation between multi-frequency domain signal and measured wind speed. Besides, a fully connected layer is used to transform the flattened vector to one dimension. The learning rate and epochs are set to 5e-3 and 300, respectively. Adam optimizer and MSELoss are used for model training.
The discussion about the experiment is described below. Figure 7 shows the performance of the proposed correction strategy in the first 7 days in March and June. Obviously, the measured wind speed is higher than NWP wind speed most of the time. The average NWP wind speed and measured wind speed were 5.271 and 6.532 m/s in 2019, respectively. In addition, the fluctuation of measured wind speed is more severe than that of NWP wind speed. The 7 days’ evaluation result is summarized in Table 1. Here are some findings summed from these statistical data.
(1) The proposed correction method performs better than NWP wind speed forecasting. Take these data for example. In March, the RMSEv and MAEv of VMD-BGRU corrected wind speed are smaller than that of NWP wind speed in test days except day 1. The NWP wind speed forecasting is not always inaccurate, and the correction model tends to raise it. Thus, a small amount of negative correction is inevitable, but it is beneficial to improve the accuracy of the forecast wind speed on the whole. The average RMSEv and MAEv of the VMD-BGRU model are 1.200 and 0.955 m/s in March, respectively, which reduced to 0.324 and 0.294 m/s compared with NWP wind speed, respectively. Moreover, the average RMSEv and MAEv of the proposed model are 0.967 and 0.780 m/s in June, respectively, which reduced to 0.693 and 0.612 m/s compared with NWP wind speed, respectively. Overall, the result confirms the efficiency of the proposed strategy.
(2) The VMD-BGRU also show a little advantage than BGRU. For instance, the average RMSEv and MAEv of the BGRU correction model are 1.302 and 1.042 m/s, respectively, while the average RMSEv and MAEv of the proposed model are 0.101 and 0.086 m/s less, respectively, in March. And, in June, the average RMSEv and MAEv of the BGRU correction model are 1.275 and 1.026 m/s, respectively, while the average RMSEv and MAEv of the proposed model are 0.308 and 0.246 m/s less, respectively. The result indicates that VMD can enrich the information of NWP wind speed signal by decomposing it to several sub-series in different frequencies. From this result, it is clear that the VMD-BGRU correction strategy shows better performance than compared strategies.
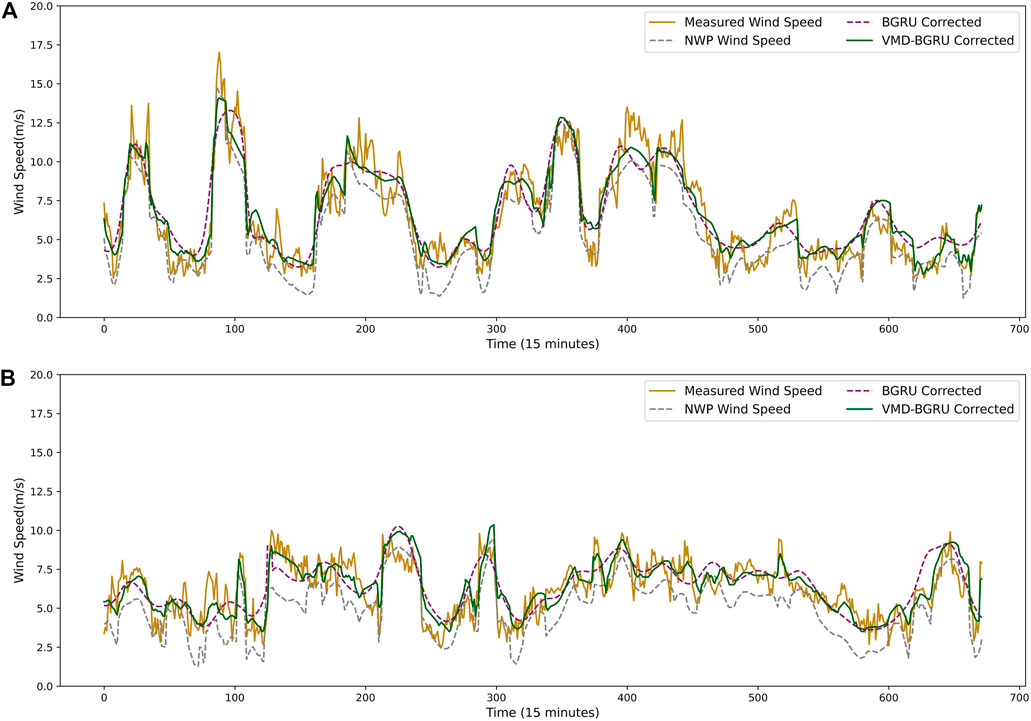
FIGURE 7. Results of NWP wind speed correction. (A) Result for the first week of March. (B) Result for the first week of June.
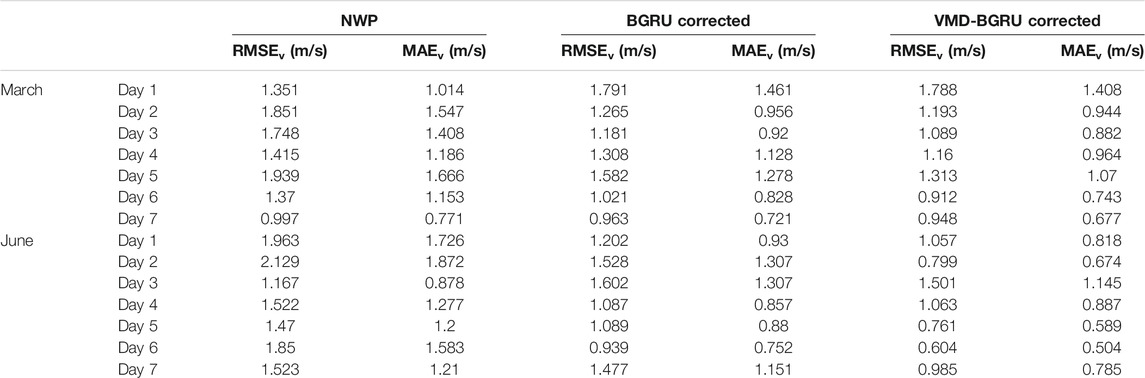
TABLE 1. Evaluation results of corrected wind speed.
However, some limitations are found in this case. First, NWP wind speed is difficult to capture the abundant small-scale fluctuation information of measured wind speed, which is widely accepted. Even after the proposed wind speed correction, the measured wind speed fluctuation information is still hard to be described perfectly. In addition to this, the proposed wind speed correction does not always correct NWP wind speed positively. The complicated topography brings many uncertain factors to wind speed prediction, but there are always a few periods of accurate NWP forecasting. Inevitably, there will be negative corrections, for example, NWP wind speed in day 3 of June and day 1 of March is incorrected. Despite the very low probability of negative correction, NWP wind speed can be effectively corrected most of the time.
The Results of WPF
In this section, the abovementioned NWP wind speed correction strategy is applied to WPF to further validate its advantage. First of all, the power forecasting model is established according to the measured wind speed and power. Then, the different forecasting wind speed corrected by BGRU and VMD-BGU is utilized to forecast power. Also, the original NWP wind speed is used as a benchmark. Therefore, results are obtained to compare the differences between these forecasting power and analyze the reason. The design of the training set and testing set is the same as The Results of NWP Wind Speed Correction. More data are validated to enhance the wide availability in WPF. To be specific, the first 7 days of September and December are added for testing. Besides, RMSEp and MAEp are used as the evaluation metrics. Additionally, the proposed XGBoost method is compared with the traditional machine learning methods, such as support vector regression (SVR) and MLP.
The hyper-parameter of XGBoost is important to the performance of the forecasting model. Therefore, selecting the appropriate hyper-parameters is the key to optimize the mode. There are three types of hyper-parameters, including general parameters, booster parameters, and task parameters. In this task, some key hyper-parameters are tuned by grid searching, whose detail is shown in Table 2.
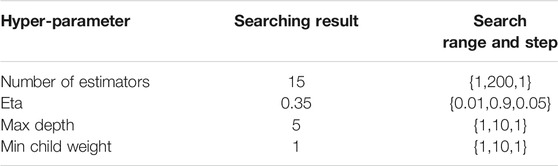
TABLE 2. Hyper-parameter selection of XGBoost.
The experiment is discussed below. There are four pictures in different periods which are shown in Figure 8. For the sake of description, prediction result under NWP wind speed, BGRU corrected wind speed, and VMD-BGRU corrected wind speed are renamed as Method 1, Method 2, and Method 3, respectively. The daily forecast statistical results are shown inTable 3 and Table 4. Here is the detailed discussion about these statistical data.
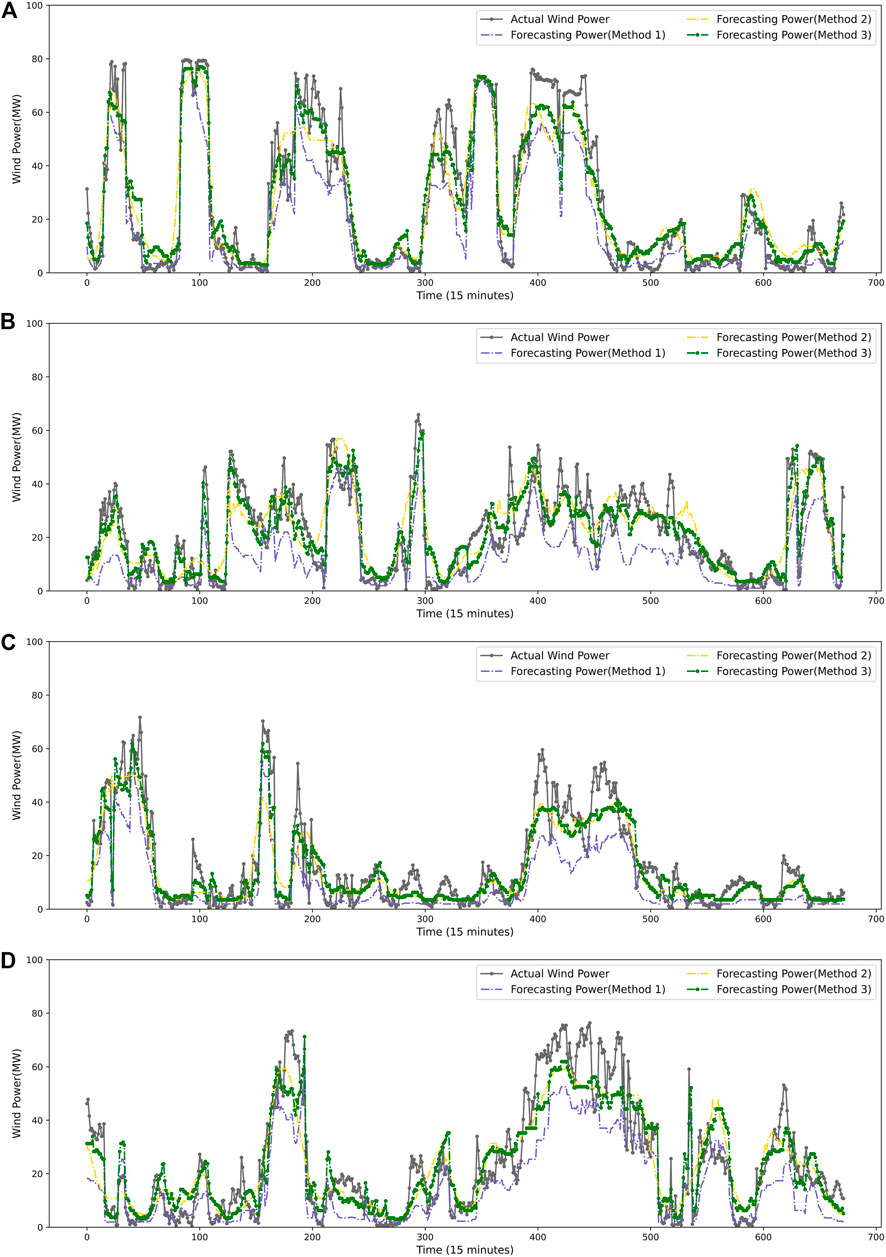
FIGURE 8. Results of WPF. (A) Result for the first week of March. (B) Result for the first week of June. (C) Result for the first week of September. (D) Result for the first week of December.
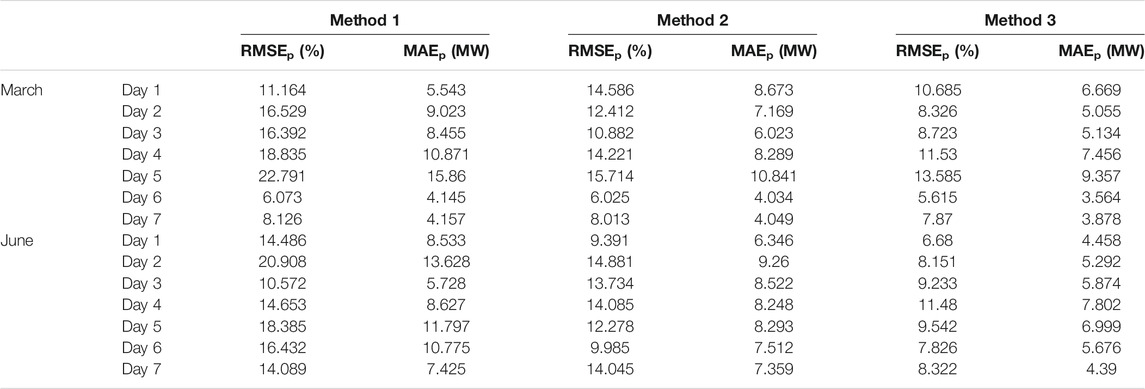
TABLE 3. Evaluation results of the corrected wind speed in March and June.

TABLE 4. Evaluation results of the corrected wind speed in September and December.
Method 3 outperforms well than other methods. For example, in the first week of March, the average RMSEp and MAEp of Method 3 are 9.476% and 5.873 MW, respectively, which reduced to 4.797% and 2.420 MW than Method 1, respectively, and reduced to 2.217% and 1.138 MW than Method 2, respectively. In the first week of June, the average RMSEp and MAEp of Method 3 are 8.748% and 5.784 MW, respectively, which reduced to 6.899% and 3.712 MW than Method 1, respectively, and reduced to 3.880% and 2.150 MW than Method 2, respectively. Also, the similar result can be obtained from September and December. It is worth noting that the forecasting performance is less effective than Method 1 in day 3 of June and day 1 of March, which corresponds to the negative wind speed correction. But, on the whole, the experiment indicates that the proposed NWP wind speed correction method is effective in improving the accuracy of WPF.
In order to verify the XGBoost forecasting method, MLP and SVR models, as the traditional machine learning methods, are compared with it. Figure 9 shows the forecasted result. The RMSEp of the XGBoost is 7.532%, while that of SVR and MLP are 8.522 and 10.95%, respectively, which shows the superiority of the proposed prediction model.
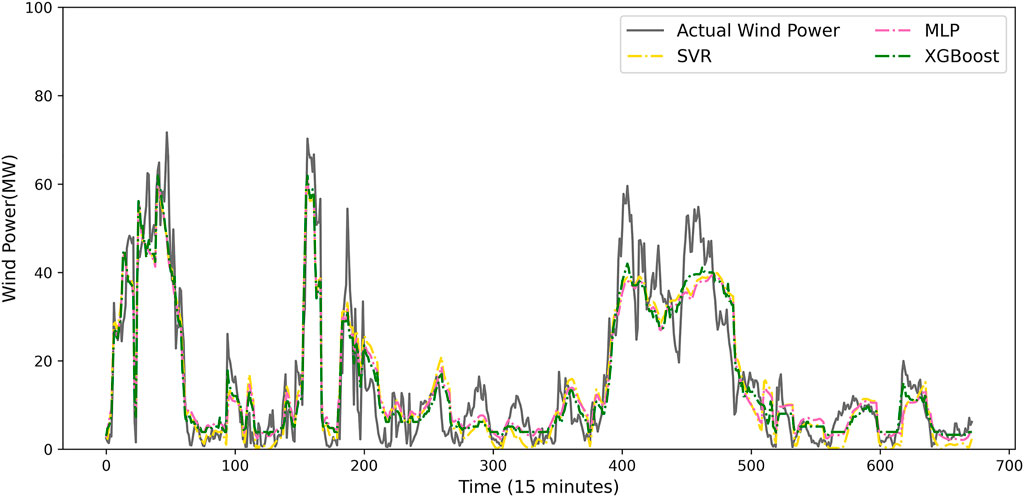
FIGURE 9. Comparison of XGBoost, SVR, and MLP.
Conclusion
This article proposes the VMD-BGRU method for the NWP wind speed correction and XGBoost forecasting model. First, the VMD algorithm is used to decompose the NWP wind speed to get abundant input features. The BGRU is used to correct the NWP wind speed based on decomposed NWP wind speed sub-series and the measured wind speed. Then, the XGBoost algorithm is utilized to establish the forecasting model using measured wind speed and power. Finally, the corrected NWP wind speed is input into the forecasting model to obtain the short-term prediction results of wind power. From the experimental results, some conclusions are drawn as follows. For NWP wind speed correction, the proposed method decreases the RMSEv and MAEv by 0.324 and 0.294 m/s in the first week of March, respectively, and 0.639 and 0.612 m/s in the first week of June, respectively, compared with NWP. For WPF, using corrected NWP wind speed as input decreases the RMSEp and MAEp by 3.54–6.89% and 2.29–3.71 MW on testing data, compared with NWP as input, respectively. Moreover, the XGBoost forecasting model outperforms than MLP and SVR. The results verify the effectiveness of the proposed wind speed correction method and WPF model.
Data Availability Statement
The original contributions presented in the study are included in the article/Supplementary Material; further inquiries can be directed to the corresponding author.
Author Contributions
YL: methodology, writing—original draft preparation, and software. FT: Writing—reviewing and editing, methodology, and supervision. XG: data processing, writing—reviewing and revising grammar and correct expression. TZ: conceptualization and software. FQ: validation and investigation. JX: visualization and data processing. XL: investigation and data processing. YG: investigation and visualization.
Funding
This study received funding from the National Natural Science Foundation of China under Grant 51977157. All authors declare no other competing interests.
Conflict of Interest
The authors declare that the research was conducted in the absence of any commercial or financial relationships that could be construed as a potential conflict of interest.
Publisher’s Note
All claims expressed in this article are solely those of the authors and do not necessarily represent those of their affiliated organizations, or those of the publisher, the editors, and the reviewers. Any product that may be evaluated in this article, or claim that may be made by its manufacturer, is not guaranteed or endorsed by the publisher.
References
Al-Yahyai, S., Charabi, Y., Al-Badi, A., and Gastli, A. (2012). Nested ensemble NWP approach for wind energy assessment. Renewable Energy 37 (1), 150–160. doi:10.1016/j.renene.2011.06.014
Chen, T., and Guestrin, C. (2016). XGBoost. 22nd ACM SIGKDD International Conference on Knowledge Discovery and Data Mining (KDD). 785–794. doi:10.1145/2939672.2939785
Cheng, W. Y. Y., Liu, Y., Bourgeois, A. J., Wu, Y., and Haupt, S. E. (2017). Short-term wind forecast of a data assimilation/weather forecasting system with wind turbine anemometer measurement assimilation. Renewable Energy 107, 340–351. doi:10.1016/j.renene.2017.02.014
Choi, S., and Hur, J. (2020). An Ensemble Learner-Based Bagging Model Using Past Output Data for Photovoltaic Forecasting. Energies 13 (6), 1438. doi:10.3390/en13061438
Deo, R. C., Ghorbani, M. A., Samadianfard, S., Maraseni, T., Bilgili, M., and Biazar, M. (2018). Multi-layer perceptron hybrid model integrated with the firefly optimizer algorithm for windspeed prediction of target site using a limited set of neighboring reference station data. Renewable Energy 116 (A), 309–323. doi:10.1016/j.renene.2017.09.078
Dong, L., Ren, L., Gao, S., Gao, Y., and Liao, X. (2013). Studies on Wind Farms Ultra-short Term NWP Wind Speed Correction Methods. 25th Chinese Control and Decision Conference (CCDC). 25-27 May 2013. Guiyang, China, 1576–1579. doi:10.1109/ccdc.2013.6561180
Global Wind Energy Council (2021). Global Wind Report 2021. Available at: http://www.eqmagpro.com/gwec-global-wind-report-2021/.
Heppelmann, T., Steiner, A., and Vogt, S. (2017). Application of numerical weather prediction in wind power forecasting: Assessment of the diurnal cycle. metz 26 (3), 319–331. doi:10.1127/metz/2017/0820
Hu, J., Heng, J., Wen, J., and Zhao, W. (2020). Deterministic and probabilistic wind speed forecasting with de-noising-reconstruction strategy and quantile regression based algorithm. Renewable Energy 162, 1208–1226. doi:10.1016/j.renene.2020.08.077
Hu, S., Xiang, Y., Huo, D., Jawad, S., and Liu, J. (2021). An improved deep belief network based hybrid forecasting method for wind power. Energy 224, 120185. doi:10.1016/j.energy.2021.120185
Khalid, R., and Javaid, N. (2020). A survey on hyperparameters optimization algorithms of forecasting models in smart grid. Sustainable Cities and Society 61, 102275. doi:10.1016/j.scs.2020.102275
Dragomiretskiy, K., and Zosso, D. (2014). Variational Mode Decomposition. IEEE Trans. Signal Process. 62 (3), 531–544. doi:10.1109/TSP.2013.2288675
Li, Z., Ye, L., Zhao, Y., Song, X., Teng, J., and Jin, J. (2016). Short-term wind power prediction based on extreme learning machine with error correction. Prot Control Mod Power Syst 1 (1), 1–8. doi:10.1186/s41601-016-0016-y
Li, Z., Jiang, W., Abu-Siada, A., Li, Z., Xu, Y., and Liu, S. (2021). Research on a composite voltage and current measurement device for HVDC networks. IEEE Trans. Ind. Electron. 68 (9), 8930–8941. doi:10.1109/TIE.2020.3013772
Liao, X., Cao, N., Li, M., and Kang, X. (2019). Research on Short-term Load Forecasting Using XGBoost Based on Similar Days. International Conference on Intelligent Transportation, Big Data & Smart City (ICITBS). 12-13 Jan. 2019. Changsha, China. 675–778. doi:10.1109/ICITBS.2019.00167
Liu, H., and Chen, C. (2019). Data processing strategies in wind energy forecasting models and applications: A comprehensive review. Applied Energy 249, 392–408. doi:10.1016/j.apenergy.2019.04.188
Liu, H., Mi, X., and Li, Y. (2018). Smart multi-step deep learning model for wind speed forecasting based on variational mode decomposition, singular spectrum analysis, LSTM network and ELM. Energy Conversion and Management 159, 54–64. doi:10.1016/j.enconman.2018.01.010
Liu, X., Lin, Z., and Feng, Z. (2021). Short-term offshore wind speed forecast by seasonal ARIMA - A comparison against GRU and LSTM. Energy 227, 120492. doi:10.1016/j.energy.2021.120492
Liu, X., Zhou, J., and Qian, H. (2021). Short-term wind power forecasting by stacked recurrent neural networks with parametric sine activation function. Electric Power Systems Research 192, 107011. doi:10.1016/j.epsr.2020.107011
Niu, Z., Yu, Z., Tang, W., Wu, Q., and Reformat, M. (2020). Wind power forecasting using attention-based gated recurrent unit network. Energy 196, 117081. doi:10.1016/j.energy.2020.117081
Okumus, I., and Dinler, A. (2016). Current status of wind energy forecasting and a hybrid method for hourly predictions. Energy Conversion and Management 123, 362–371. doi:10.1016/j.enconman.2016.06.053
Shen, X., and Raksincharoensak, P. (2021a). Pedestrian-aware Statistical Risk Assessment. IEEE Trans. Intell. Transport. Syst. 1. 1–9. doi:10.1109/TITS.2021.3074522
Shen, X., and Raksincharoensak, P. (2021b). Statistical Models of Near-Accident Event and Pedestrian Behavior at Non-signalized Intersections. Journal of Applied Statistics 1, 1–21. doi:10.1080/02664763.2021.1962263
Shen, X., Zhang, Y., Shen, T., and Khajorntraidet, C. (2017). Spark advance self-optimization with knock probability threshold for lean-burn operation mode of SI engine. Energy 122, 1–10. doi:10.1016/j.energy.2017.01.065
Shen, X., Zhang, X., Ouyang, T., Li, Y., and Raksincharoensak, P. (2020). Cooperative Comfortable-Driving at Signalized Intersections for Connected and Automated Vehicles. IEEE Robot. Autom. Lett. 5 (4), 6247–6254. doi:10.1109/LRA.2020.3014010
Shen, X., Zhang, Y., Sata, K., and Shen, T. (2020). Gaussian mixture model clustering-based knock threshold learning in automotive engines. IEEE/ASME Trans. Mechatron. 25 (6), 2981–2991. doi:10.1109/TMECH.2020.3000732
Shen, X., Ouyang, T., Khajorntraidet, C., Li, Y., Li, S., and Zhuang, J. (2021a). Mixture Density Networks-Based Knock Simulator. Ieee/asme Trans. Mechatron. 1, 1. doi:10.1109/TMECH.2021.3059775
Shen, X., Ouyang, T., Yang, N., and Zhuang, J. (2021b). Sample-based Neural Approximation Approach for Probabilistic Constrained Programs. IEEE Trans. Neural Netw. Learning Syst. 1, 1–8. doi:10.1109/TNNLS.2021.3102323
Singh, P. K., Singh, N., and Negi, R. (2021). Short-Term Wind Power Prediction Using Hybrid Auto Regressive Integrated Moving Average Model and Dynamic Particle Swarm Optimization. International Journal of Cognitive Informatics and Natural Intelligence (IJCINI) 15 (2), 111–138. doi:10.4018/IJCINI.20210401.oa9
Song, J., Wang, J., and Lu, H. (2018). A novel combined model based on advanced optimization algorithm for short-term wind speed forecasting. Applied Energy 215, 643–658. doi:10.1016/j.apenergy.2018.02.070
Wang, K., Qi, X., Liu, H., and Song, J. (2018). Deep belief network based k-means cluster approach for short-term wind power forecasting. Energy 165 (A), 840–852. doi:10.1016/j.energy.2018.09.118
Wang, H., Han, S., Liu, Y., Yan, J., and Li, L. (2019). Sequence transfer correction algorithm for numerical weather prediction wind speed and its application in a wind power forecasting system. Applied Energy 237, 1–10. doi:10.1016/j.apenergy.2018.12.076
Wang, Y., Hu, Q., Li, L., Foley, A. M., and Srinivasan, D. (2019). Approaches to wind power curve modeling: A review and discussion. Renewable and Sustainable Energy Reviews 116, 109422. doi:10.1016/j.rser.2019.109422
Wu, Z., and Xiao, L. (2019). A structure with density-weighted active learning-based model selection strategy and meteorological analysis for wind speed vector deterministic and probabilistic forecasting. Energy 183, 1178–1194. doi:10.1016/j.energy.2019.07.025
Xu, K., Yan, J., Zhang, H., Zhang, H., Han, S., and Liu, Y. (2021). Quantile based probabilistic wind turbine power curve model. Applied Energy 296, 116913. doi:10.1016/j.apenergy.2021.116913
Yan, J., Zhang, H., Liu, Y., Han, S., Li, L., and Lu, Z. (2018). Forecasting the High Penetration of Wind Power on Multiple Scales Using Multi-to-Multi Mapping. IEEE Trans. Power Syst. 33 (3), 3276–3284. doi:10.1109/tpwrs.2017.2787667
Nan, Y., Di, Y., Zheng, Z., Jiazhan, C., Daojun, C., and Xiaoming, W. (2018). Research on modelling and solution of stochastic SCUC under AC power flow constraints. IET Generation, Transmission & Distribution 12 (15), 3618–3625. doi:10.1049/iet-gtd.2017.1845
Yang, N., Huang, Y., Hou, D., Liu, S., Ye, D., Dong, B., and Fan, Y. (2019). Adaptive Nonparametric Kernel Density Estimation Approach for Joint Probability Density Function Modeling of Multiple Wind Farms. Energies 12 (7), 1356. doi:10.3390/en12071356
Yang, N., Liu, S., Deng, Y., and Xing, C. (2021a). An Improved Robust SCUC Approach Considering Multiple Uncertainty and Correlation. IEEJ Trans. Elec Electron. Eng. 16 (1), 21–34. doi:10.1002/tee.23265
Yang, N., Yang, C., Wu, L., Shen, X., Jia, J., Li, Z., Chen, D., Zhu, B., and Liu, S. (2021b). Intelligent Data-Driven Decision-Making Method for Dynamic Multi-Sequence: An E-Seq2Seq Based SCUC Expert System. IEEE Trans. Ind. Inf. 1, 1. doi:10.1109/TII.2021.3107406
Yang, N., Yang, C., Xing, C., Ye, D., Jia, J., Chen, D., Shen, X., Huang, Y., Zhang, L., and Zhu, B. (2021c). Deep learning‐based SCUC decision‐making: An intelligent data‐driven approach with self‐learning capabilities. IET Gener. Transm. Distrib. 1. 1. doi:10.1049/gtd2.12315
Yang, J. (2019). A novel short-term multi-input-multi-output prediction model of wind speed and wind power with LSSVM based on improved ant colony algorithm optimization. Cluster Comput 22 (2), 3293–3300. doi:10.1007/s10586-018-2107-1
Zhang, T., Yan, P., Li, Z., Wang, Y., and Li, Y. (2019). Bias-correction method for wind-speed forecasting. metz 28 (4), 293–304. doi:10.1127/metz/2019/0950
Zhang, Y., Li, Y., and Zhang, G. (2020). Short-term wind power forecasting approach based on Seq2Seq model using NWP data. Energy 213, 118371. doi:10.1016/j.energy.2020.118371
Zhang, L., Xie, Y., Ye, J., Xue, T., Cheng, J., Li, Z., and Zhang, T. (2021). Intelligent frequency control strategy based on reinforcement learning of multi-objective collaborative reward function. Front. Energy Res. 9. doi:10.3389/fenrg.2021.760525
Zhao, J., Guo, Y., Xiao, X., Wang, J., Chi, D., and Guo, Z. (2017). Multi-step wind speed and power forecasts based on a WRF simulation and an optimized association method. Applied Energy 197, 183–202. doi:10.1016/j.apenergy.2017.04.017
Zhao, Y., Ye, L., Wang, Z., Wu, L., Zhai, B., Lan, H., and Yang, S. (2019). Spatio‐temporal Markov chain model for very‐short‐term wind power forecasting. J. eng. 2019, 5018–5022. doi:10.1049/joe.2018.9294
Zheng, H., and Wu, Y. (2019). A XGBoost Model with Weather Similarity Analysis and Feature Engineering for Short-Term Wind Power Forecasting. Applied Sciences 9 (15), 3019. doi:10.3390/app9153019
Zheng, D., Eseye, A. T., Zhang, J., and Li, H. (2017). Short-term wind power forecasting using a double-stage hierarchical ANFIS approach for energy management in microgrids. Prot Control Mod Power Syst 2 (1), 1–10. doi:10.1186/s41601-017-0041-5
Keywords: short-term wind power forecasting, wind speed correction, bidirectional gated recurrent unit, variational mode decomposition, ensemble learning
Citation: Li Y, Tang F, Gao X, Zhang T, Qi J, Xie J, Li X and Guo Y (2022) Numerical Weather Prediction Correction Strategy for Short-Term Wind Power Forecasting Based on Bidirectional Gated Recurrent Unit and XGBoost. Front. Energy Res. 9:836144. doi: 10.3389/fenrg.2021.836144
Received: 15 December 2021; Accepted: 24 December 2021;
Published: 17 January 2022.
Edited by:
Xun Shen, Tokyo Institute of Technology, JapanReviewed by:
Yunyun Xie, Nanjing University of Science and Technology, ChinaLei Zhang, China Three Gorges University, China
Copyright © 2022 Li, Tang, Gao, Zhang, Qi, Xie, Li and Guo. This is an open-access article distributed under the terms of the Creative Commons Attribution License (CC BY). The use, distribution or reproduction in other forums is permitted, provided the original author(s) and the copyright owner(s) are credited and that the original publication in this journal is cited, in accordance with accepted academic practice. No use, distribution or reproduction is permitted which does not comply with these terms.
*Correspondence: Fei Tang, tangfei@whu.edu.cn