A Framework for Monitoring and Fault Diagnosis in Nuclear Power Plants Based on Signed Directed Graph Methods
 Wu Guohua
 Yuan Diping2
 - 1Harbin Institute of Technology, Shenzhen, China
- 2Shenzhen Urban Public Safety and Technology Institute, Shenzhen, China
- 3School of Science and Engineering Chinese University of Hong Kong, Shenzhen, China
When nuclear power plants (NPPs) are in a state of failure, they may release radioactive material into the environment. The safety of NPPs must thus be maintained at a high standard. Online monitoring and fault detection and diagnosis (FDD) are important in helping NPP operators understand the state of the system and provide online guidance in a timely manner. Here, to mitigate the shortcomings of process monitoring in NPPs, five-level threshold, qualitative trend analysis (QTA), and signed directed graph (SDG) inference are combined to improve the veracity and sensitivity of process monitoring and FDD. First, a three-level threshold is used for process monitoring to ensure the accuracy of an alarm signal, and candidate faults are determined based on SDG backward inference from the alarm parameters. According to the candidate faults, SDG forward inference is applied to obtain candidate parameters. Second, a five-level threshold and QTA are combined to determine the qualitative trend of candidate parameters to be utilized for FDD. Finally, real faults are identified by SDG forward inference on the basis of alarm parameters and the qualitative trend of candidate parameters. To verify the validity of the method, we have conducted simulation experiments, which comprise loss of coolant accident, steam generator tube rupture, loss of feed water, main steam line break, and station black-out. This case study shows that the proposed method is superior to the conventional SDG method and can diagnose faults more quickly and accurately.
Introduction
Nuclear power plants (NPPs) are large and complex systems. To ensure the reliability and safety of NPPs, process monitoring and fault detection and diagnosis (FDD) are implemented to provide online guidance for operators diagnosing the abnormal functioning of NPPs in an accurate and timely manner (Liu et al., 2013; Liu et al., 2014).
FDD techniques can be divided into data-driven, signal-based, and model-based methods in NPP (Ma and Jiang, 2011; Ma and Jiang, 2015). Data-driven FDD mainly relies on large datasets to establish relationships among various parameters and faults. It does this through multiple approaches, such as neural networks (Mo et al., 2007; Amal et al., 2011), principal component analysis (Gajjar et al., 2017), qualitative trend analysis (Maurya et al., 2005), and others (Žarković and Stojković, 2017). Signal-based methods operate in the time domain and employ techniques such as wavelet analysis, time-frequency analysis, and spectral analysis (Ma and Jiang, 2011). There are two main approaches for model-based FDD. The first is based on the use of expert knowledge, such as expert systems (Kramer and Palowitch, 1987). The second is based on graph theory, that is, the model graphically displays relationships among the various parameters and faults as in a Bayesian network (Kang and Golay, 1999), a signed directed graph (Liu et al., 2016), and a dynamic uncertain causality graph (Zhou and Zhang, 2017).
FDD is difficult to achieve for NPPs using data-driven and signal-based methods. On the one hand, an NPP is a complex system and it is difficult to obtain real-time data. On the other hand, data-driven methods of diagnosis are “black box” in nature, which makes it difficult for operators to determine the cause of faults. Therefore, graph methods are currently widely used for FDD in NPPs.
As a type of qualitative FDD technique, a Signed Directed Graph (SDG) model, which does not require a precise mathematical model to establish, can contain a large amount of information about faults. SDG was applied in the chemical industry by Lapp and Powers (1977), and the concept of SDG was proposed by Iri et al. (1979). Compared with other data-driven methods, SDG has the significant advantage that SDG-based FDD can reveal fault propagation paths and comprehensively explain causes of failure (Chen et al., 2015; Maurya et al., 2004), which has led to it becoming widely implemented in industry. To improve the accuracy and sensitivity of SDG-based FDD, other methods are combined with SDG, which has resulted in variants such as the SDG-expert system (Kramer and Palowitch, 1987), SDG-principal component analysis (Hiranmayee and Venkatasubramanian, 1999), SDG-qualitative trend analysis (Gao and Wu, 2010), SDG-hazard and operability (Wang and Chen, 2009), SDG-fuzzy logic (Tarifa and Scenna, 2003; He et al., 2014), and SDG-Bayesian network (Peng et al., 2014).
Based on the above studies, we found that almost all research into SDG-based FDD technology has focused on inference, diagnosis, and modeling. However, because process monitoring is the first step of FDD in NPPs, process monitoring itself should be more closely studied. Furthermore, the safety threshold in NPPs is very conservative, which not only increases the difficulty of applying FDD but also makes incipient fault diagnosis difficult (Chung and Bien, 1994). To solve these problems, SDG combined with principal component analysis was proposed for FDD, and principal component analysis was applied to solve the threshold problem in process monitoring. SDG combined with qualitative trend analysis (QTA) is used to determine the qualitative trends of parameters in early failure and to conduct incipient fault diagnosis. However, SDG combined with other methods requires more in-depth research. Principal component analysis reduces the parameters, so it is difficult to guarantee the accuracy of FDD. QTA obtains the trend of parameters. When the parameters fluctuate within the normal range, misdiagnosis may occur.
This study combines five-level threshold, QTA, and SDG inference to solve these problems. Signed Directed Graph Method Section introduces the SDG method; Process Monitoring for Nuclear Power Plants Section presents the method of process monitoring; and Monitoring and Fault Diagnosis Framework for Nuclear Power Plants Section proposes a combination of five-level threshold, QTA, and SDG inference. In Application Case Study Section, we discuss a case study, and finally, present conclusions in Conclusion Section.
Signed Directed Graph Method
Concepts and Principles
SDG models are described by nodes and directed edges which can express relationships among the parameters. An SDG model is defined as
A fault’s propagation path can be located by SDG inference. A “moment sample” includes all the values of the monitored parameters at the same time. According to the “moment sample”, if
then A–B–C is a consistent path. In Figure 1, if a symbol is “+”, the model means: A increases (+) → B increases (+) → C decreases (−), then nodes A, B, C constitute a consistent path. A consistent path can not only describe the fault’s propagation path but also can explain the reason why failure occurs. Thus, the role of SDG-based FDD is to find all consistent paths in instantaneous samples of the system.

FIGURE 1. Sketch map of an SDG model.
Signed Directed Graph-Based Fault Detection and Diagnosis
SDG inference is divided into forward inference and backward inference. Forward inference generally starts from the selected candidate fault node to find all consistent paths; its purpose is mainly to verify the correctness of FDD. Backward inference generally starts from the sign nodes back to the fault nodes based on a consistent path and is used for FDD (Mano et al., 2006). Forward inference and backward inference are usually combined for FDD. First, candidate faults are identified based on backward inference and forward inference is adopted from these candidate faults to remove false faults (Liu et al., 2014). The flow chart is shown in Figure 2.
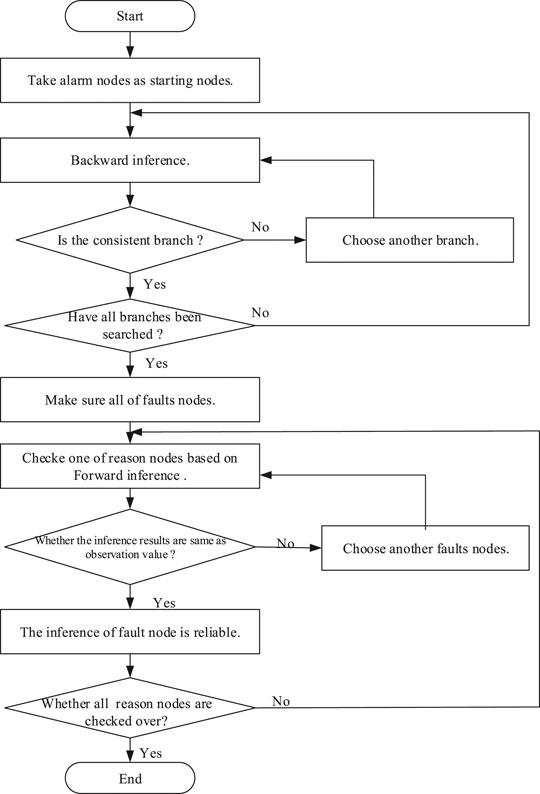
FIGURE 2. Flow chart of SDG inference.
An SDG model is shown in Figure 3. According to the alarm parameters h, d, f, candidate faults are identified based on backward inference and identifying a consistent path. Taking d as a starting node, d–h is a consistent path, which means nodes A and B are candidate faults. In the same way, taking h, f as starting nodes, then nodes A and B are again candidate faults. When candidate parameters {d, e, f, h} are identified based on forward inference, then the status of these candidate parameters is obtained by process monitoring. According to forward inference, A–e is not a consistent path, but all paths of node B have occurred; therefore, A is a false fault and B is a true fault.
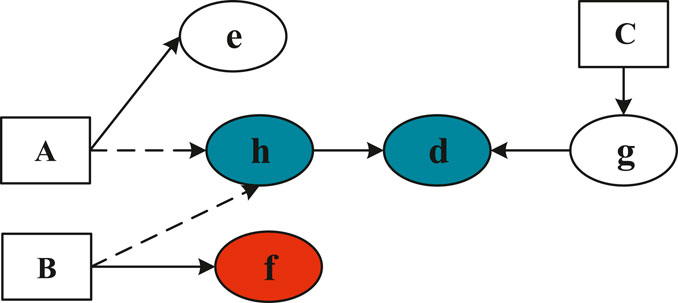
FIGURE 3. Example of an SDG model.
Process Monitoring for Nuclear Power Plants
The purpose of process monitoring is to assess the states of parameters that are utilized for FDD. Here, the method of process monitoring is based on threshold and QTA methods.
Threshold Method
The threshold method assesses a parameter’s status above the upper limit or below the lower limit. The method is easy to operate with software and easily understood by the operator, but it has some disadvantages: the thresholds in NPPs are more conservative, so alarm signals occur too late, and incipient fault diagnosis is difficult to achieve (Daneshvar and Rad, 2010). Therefore, the threshold method is not enough to achieve the goal of process monitoring and other methods should be added to improve the sensitivity of process monitoring.
Qualitative Trend Analysis
The purpose of QTA for process monitoring is to obtain a best-fit trend of parameters to assess the state of NPPs. Trend fitting is primarily based on linear least-squares (Frank, 1996). The main algorithm is as follows.
Parameters x, y are sampled with n sets of data
The main disadvantage of QTA for process monitoring is that it may lead to misdiagnosis. When the system is in a state of disturbance, the parameters may remain high or low over a certain period, which leads to a misdiagnosis.
Monitoring and Fault Diagnosis Framework for Nuclear Power Plants
Five-Level Threshold and Qualitative Trend Analysis
To mitigate the shortcomings of QTA and threshold methods in process monitoring, we propose a five-level threshold combined with QTA to improve the sensitivity of process monitoring.
1) Thresholds in nuclear power plants
Nodes are divided into two categories: parameter nodes and fault nodes. The statuses of parameter nodes are determined by the upper and lower limits (three-level threshold) of each parameter. A parameter’s status may be in three states: “0”, “1”, or “−1”. “1” indicates that the value of a parameter exceeds the upper limit, “0” indicates that values of a parameter are normal, and “−1” indicates that values of a parameter are below the lower limit (He et al., 2014). The calculation method is shown in Eq. 4:
2) Concept of a five-level threshold
The concept of a five-level threshold is shown in Figure 4. “±”, “±?” stand for certain states and uncertain states of parameters respectively (Chung and Bien, 1994). A three-level threshold is currently used in NPPs. The five-level threshold, which is very sensitive to a parameter’s variability, includes the three-level threshold. When parameters are within the three-level threshold, the status of a parameter is considered certain. When the parameters are between the five-level threshold and three-level threshold, the parameter’s state is uncertain and the status of the parameter is identified using QTA.
3) U test
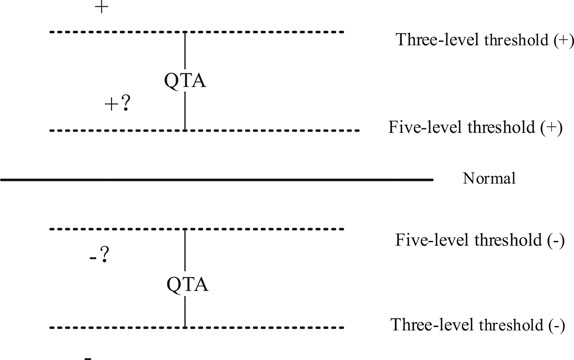
FIGURE 4. Five-level threshold.
It is difficult to obtain the fault data of NPPs, but normal data are easy to acquire. Most parameters may appear as random variability in normal data, in which the values of parameters follow a normal distribution, but parameters may not always do so. The U-test is applied to determine whether the values of parameters follow a normal distribution. Calculating coefficients of skewness and kurtosis is the first step of the U test (Hao et al., 2009). For the time sequence
where
If Eqs. 6, 7 are satisfied, then parameters obey a normal distribution with time.
4) U test-based five-level threshold acquisition
Because it is difficult to obtain fault data from NPPs, the five-level threshold is obtained by handling the normal data of NPPs. The flow chart is shown in Figure 5.
5) Five-level threshold and qualitative trend analysis
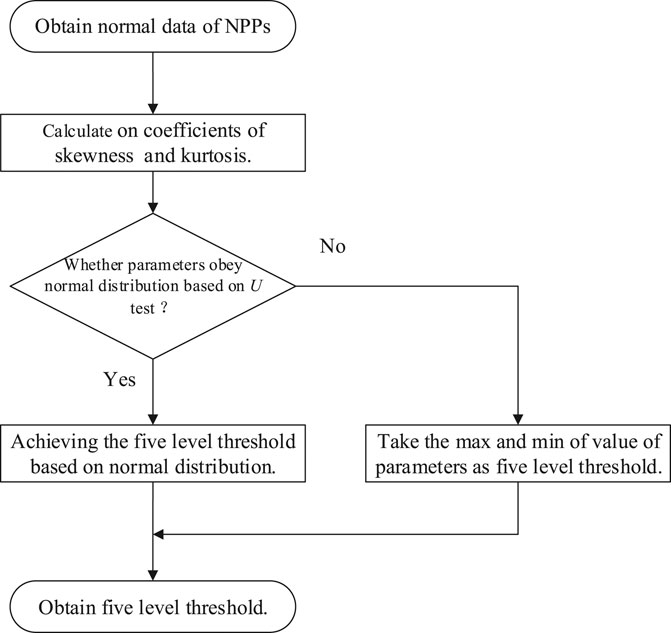
FIGURE 5. Flow chart for calculation of five-level threshold.
When monitored parameters obey a normal distribution, the probability of parameters exceeding the five-level threshold is
The probability of parameters exceeding a five-level threshold over three continuous seconds is 0.0026533 = 1.76 × 10⁻⁸, as can be seen above. If an outside range based on the five-level threshold over three continuous seconds is considered as an abnormal process, then QTA based on least-square fitting can be used to obtain qualitative trends. The parameter c is defined in Eq. 10 and can extract qualitative trends for FDD.
where
We propose the use of a five-level threshold in combination with QTA for incipient fault diagnosis. However, when the system is in a state of disturbance, the parameters may remain high or low over a certain time, which leads to misdiagnosis. To ensure the accuracy of FDD, SDG inference is proposed in combination with QTA and the five-level threshold.
Framework of Combining Process Monitoring and Signed Directed Graph-Based Inference for Fault Detection and Diagnosis
Five-level threshold, QTA, and SDG inference are combined to improve the veracity and sensitivity of process monitoring and FDD. Here, we assume that when the system is perturbed and parameters exceed the three-level threshold, failure occurs.
The steps of process monitoring and FDD are as follows:
Step 1: The SDG model is set up based on the flow chart and knowledge of systems in NPPs; although, at the same time, the SDG model should be modified and verified by simulation.
Step 2: The five-level threshold is achieved by data handling. The three-level threshold is initially applied for process monitoring, and when alarm signals appear as defined by the three-level threshold, candidate faults are identified by SDG backward inference.
Step 3: According to the identification of candidate faults, each fault is separately assessed by forward inference to determine candidate parameters.
Step 4: If the state of a candidate parameter is considered certain by the three-level threshold, this parameter state is used for FDD. If a candidate parameter’s state is uncertain based on the three-level threshold, then five-level threshold and QTA are combined to determine the state of that parameter.
Step 5: According to the parameter’s state, forward inference is used for FDD to reject false candidate faults.
Step 6: If a fault exists, then the result is shown in the NPP interface. If there is no fault, Steps 2–5 are repeated. The flow chart is shown in Figure 6.
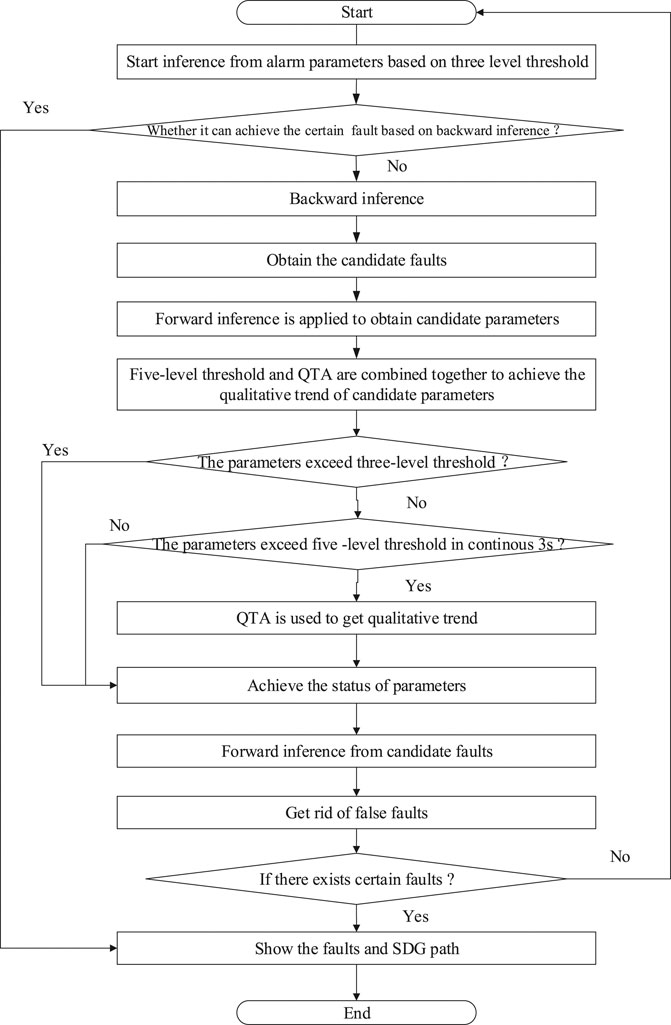
FIGURE 6. Flow chart of process monitoring and FDD.
Application Case Study
1) Method of SDG modeling
According to the basic steps and principles of SDG modeling, the SDG model of a loss of coolant accident (LOCA), steam generator tube rupture, loss of feed water, main steam line break, and station black-out over three loops of the pressurized water reactor are created. The SDG model of an NPP is established by combining fundamental principles and existing knowledge. The steps for SDG modeling in NPPs are shown in Figure 7.
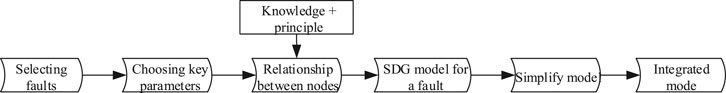
FIGURE 7. Flow chart of SDG modeling.
Analysis of the LOCA model: When a small LOCA occurs, the primary loop flow leaks, and with the containment of pressure, the temperature will rise. With the constant flow of leaking coolant, the pit water level will rise. The system pressure will have a short increase, but after a period of time, the loop pressure will continue to decrease, which reduces the system pressure and lowers the pressurizer water level and pressure. At the same time, the loop coolant flow will continue to decline. The LOCA of SDG can be built based on LOCA. As with SGTR and loss of feed water, the SDG model is built as shown in Figure 8 (abbreviations are listed in Table 1).
2) Five-level threshold
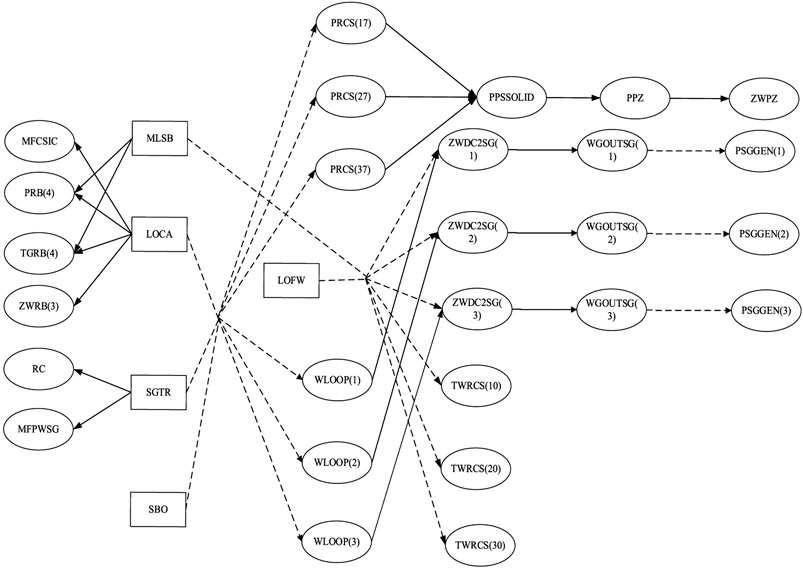
FIGURE 8. SDG model for the pressurized water reactor.
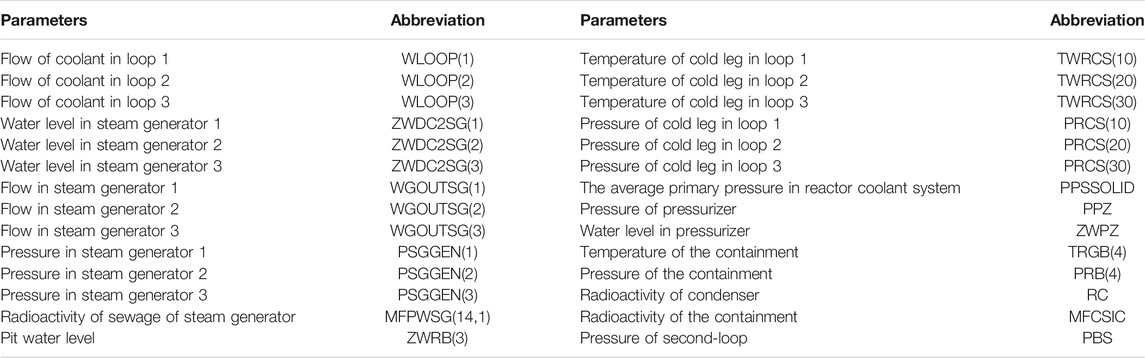
TABLE 1. Abbreviation of parameters.
First, three-level thresholds are achieved by NPPs according to the steps shown in Figure 5; then the five-level threshold is calculated and stored in a database.
3) Process monitoring and FDD
Figure 9 shows the interface for process monitoring and FDD when the NPP is in a normal state (parameters in black are in a normal state; red indicates that the parameter is abnormal and the parameter status is “1”; green indicates that the parameter is abnormal and the parameter status is “−1”). When the NPP is in a normal state, there are no alarm signals and the values of parameters are displayed in real-time.
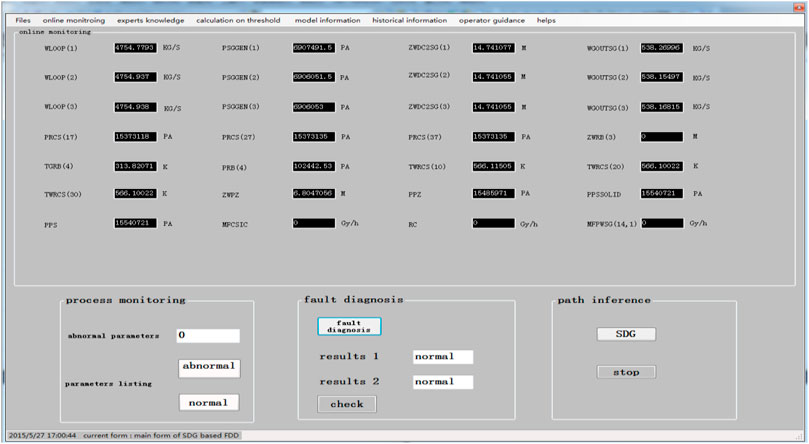
FIGURE 9. FDD interface in the normal state.
When LOCA occurs in 1000 s, the interface changed, as shown in Figure 10. The parameters that are monitored according to the flowchart shown in Figure 6 are shown in Figure 10. Figure 10 shows that FDD results in 2 based on a five-level threshold, QTA. SDG inference for LOCA and results 1 are based on an unknown threshold method. The results show that the speed of diagnosis based on a five-level threshold is faster than that for a single-threshold method.
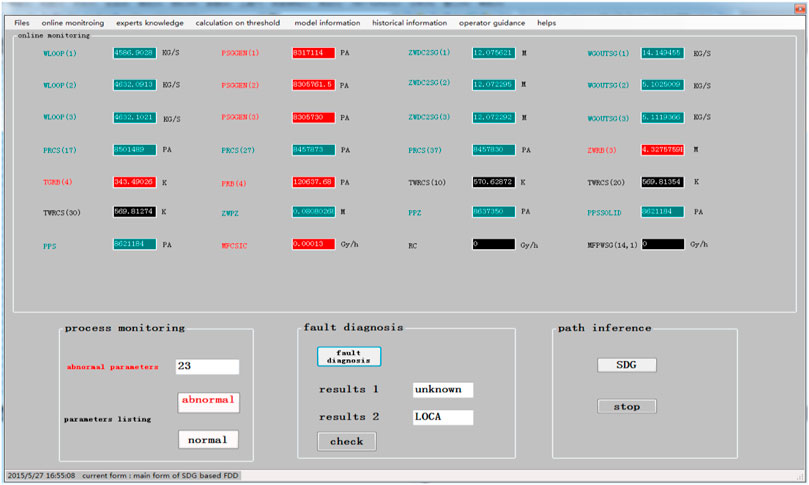
FIGURE 10. Interface of FDD when LOCA occurred.
When LOCA occurred, the PRB (4) first exceeded the three-level threshold; the corresponding process monitoring on PRB (4) is shown in Figure 11. On this basis, SDG backward inference was used to identify LOCA candidate faults. TGRB (4) was one of the candidate parameters based on candidate faults and SDG forward inference.
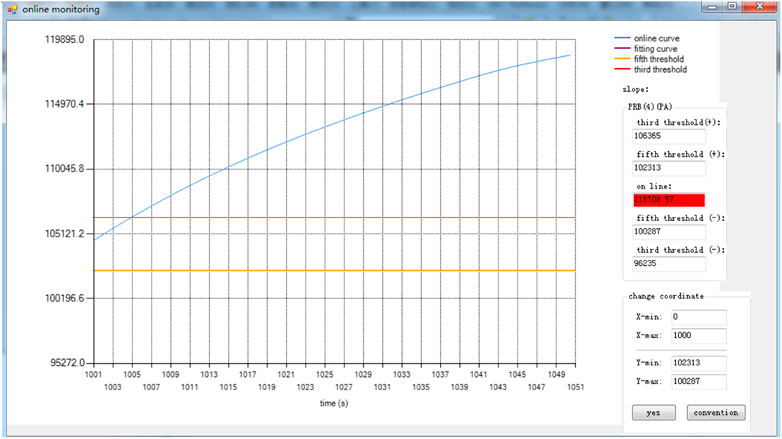
FIGURE 11. Process monitoring on TGRB (4) when LOCA occurred.
Process monitoring on TGRB (4) based on a five-level threshold, QTA, and SDG is shown in Figure 12. Figure 12 shows that fitting of the curve improves the speed of process monitoring and ensures the accuracy of FDD.
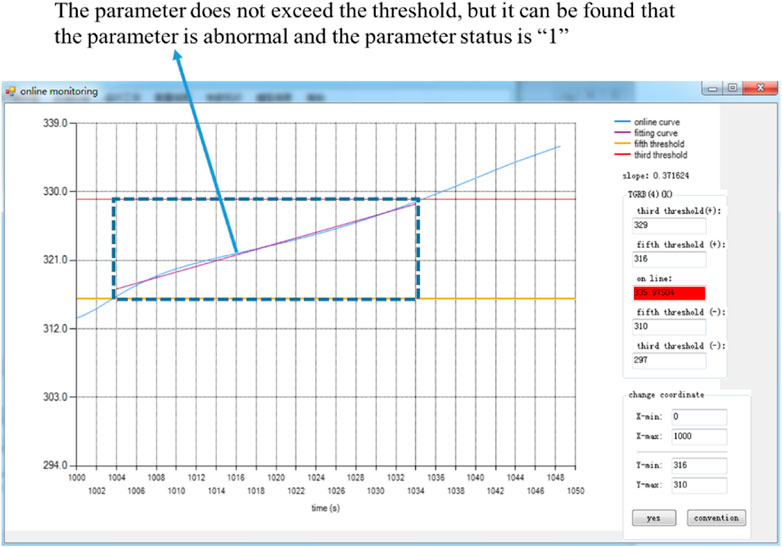
FIGURE 12. Process monitoring on TGRB (4) when LOCA occurred.
When the simulator inserts a fault in 1000 s, the TGRB (4) starts to exceed the five-level threshold at 1004 s. At 1009 s, continuous 5 s exceeds the five-level threshold, QTA can identify abnormal parameters. When using the normal threshold method (three-level threshold), it is difficult to find parameters abnormalities. QTA can detect parameter abnormalities early, that is, within 1009–1034 s. It can recognize that the parameters are abnormal, and the common method can only find the parameters of abnormality after 1034 s.
QTA and threshold method realize parameter monitoring in the SDG model. The abnormality of TGRB (4) is first detected, and then the path (LOCA—TGRB (4)) is inferred based on the SDG model; according to the state of ZWPZ, PPZ, PPSSOLID, PRCS (17), the path is obtained: LOCA—PRCS (17) decreases—PPSSOLID decreases—PPZ decreases—ZWPZ decreases. The path is shown below. SDG inference to verify the accuracy of FDD results is shown in Figure 13 for a LOCA accident. According to the obtained path, the possible failure is LOCA.
1) LOCA—pressure of the containment (PRB (4)) increases;
2) LOCA—radioactivity of the containment (MFCSIC) increases;
3) LOCA—temperature of the containment (TRGB (4)) increases;
4) LOCA—pit water level (ZWRB(3)) increases;
5) LOCA—pressure of cold leg in loop 1(PRCS(17)) decreases—the average primary pressure in the reactor coolant system (PPSSOLID) decreases—pressure of pressurizer (PPZ) decreases—water level in pressurizer (ZWPZ) decreases.
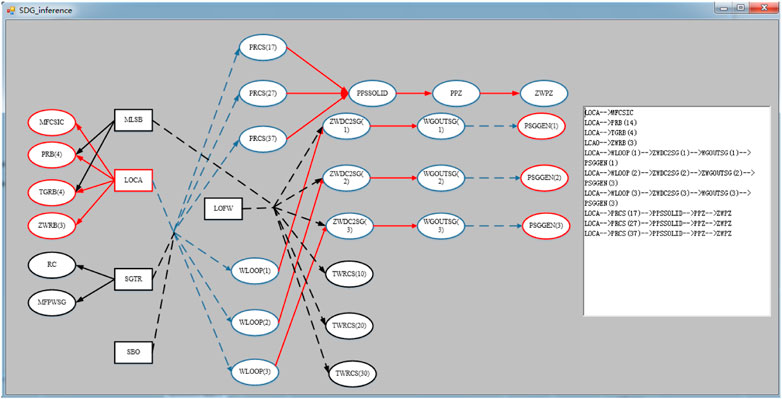
FIGURE 13. Interface of SDG inference at the time the LOCA occurred.
Conclusion
Based on the characteristics of NPPs, this study proposes a method of process monitoring and FDD based on SDG. This method can increase the path of SDG, which is needed to guarantee the accuracy of FDD. The study has provided simulation-based examples that show the advantages of process monitoring and FDD by use of five-level threshold, QTA, and SDG methods:
1) It improves the sensitivity of process monitoring;
2) Incipient fault diagnosis is achieved and accuracy is improved;
3) Fault propagation paths are shown by SDG, which can explain the causes of faults.
Because of the complex structure of NPPs, the SDG model as established in this paper needs further refinement and will require different methods of establishment for different types of reactors. An SDG-based method combined with other quantitative methods is the subject of future research.
Data Availability Statement
The raw data supporting the conclusion of this article will be made available by the authors, without undue reservation.
Author Contributions
All authors listed have made a substantial, direct, and intellectual contribution to the work and approved it for publication.
Funding
This work is supported by National key research and development program (2019YFC0810705), National key research and development program (2018YFC0810601), R & D projects in key areas of Guangdong Province (2019B111102002).
Conflict of Interest
The authors declare that the research was conducted in the absence of any commercial or financial relationships that could be construed as a potential conflict of interest.
Acknowledgments
Thanks China Postdoctoral Science Foundation funded project.
References
Amal, H., Pourahmadi, M., and Majidi-Maraghi, H. (2011). Fault diagnosis and classification based on wavelet transform and neural network. Prog. Nucl. Energ. 53, 41–47. doi:10.1016/j.pnucene.2010.12.001
Chen, J., Li, H., and Sheng, D. (2015). A hybrid data-driven modeling method on sensor condition monitoring and fault diagnosis powers plants. Int. J. Electr. Power Energ. Syst. 71, 274–284. doi:10.1016/j.ijepes.2015.03.012
Chung, H. Y., and Bien, Z. G. (1994). Incipient multiple fault diagnosis in real time with application to large-scale systems. IEEE Trans. Nucl. Sci. 41 (4), 1692–1703. doi:10.1109/23.322777
Daneshvar, M., and Rad, B. F. (2010). Data driven approach for fault detection and diagnosis of boiler system in coal fired power plant using principal component analysis. Int. Rev. Autom. Control. 3 (2), 198–208.
Frank, P. M. (1996). Analytical and qualitative model-based fault diagnosis-a survey and some new results. Eur. J. Control 2 (1), 6–28. doi:10.1016/s0947-3580(96)70024-9
Gajjar, S., Kulahci, M., and Palazoglu, A. (2017). Real-time fault detection and diagnosis using sparse principal component analysis. J. Process Control 64, 112–128. doi:10.1016/j.jprocont.2017.03.005
Gao, D., and Wu, C. G. (2010). Signed directed graph and qualitative trend analysis based fault diagnosis in chemical industry. Chin. J. Chem. Eng. 18 (2), 265–276. doi:10.1016/s1004-9541(08)60352-3
Hao, J. P., Xu, L. Q., and Gang, L. I. (2009). Skewness and kurtosis test of normal distribution for target detection precision. J. North Univ. China 30 (5), 472–476.
He, B., Chen, T., and Yang, X. H. (2014). Root cause analysis in multivariate statistical process monitoring: integrating reconstruction-based multivariate contribution analysis with fuzzy-signed directed graphs. Comput. Chem. Eng. 64, 167–177. doi:10.1016/j.compchemeng.2014.02.014
Hiranmayee, V., and Venkatasubramanian, V. (1999). PCA-SDG based process monitoring and fault diagnosis. Control. Eng. Pract. 7, 903–917. doi:10.1016/S0967-0661(99)00040-4
Iri, M., Aoki, K., and O'Shima, E. E. (1979). An algorithm for diagnosis of system failures in the chemical process. Comput. Chem. Eng. 3, 489–493. doi:10.1016/0098-1354(79)80079-4
Kang, C. W., and Golay, M. W. (1999). A Bayesian belief network-based advisory system for operational availability focused diagnosis of complex nuclear power systems. Expert Syst. Appl. 17 (1), 21–32. doi:10.1016/s0957-4174(99)00018-4
Kramer, M. A., and Palowitch, B. L. (1987). A rule-based approach to fault diagnosis using the signed directed graph. AIChE J. 33 (7), 1607–1078. doi:10.1002/aic.690330703
Lapp, S. A., and Powers, G. J. (1977). Computer-aided synthesis of fault-trees. IEEE Trans. Rel. 26 (2), 2–12. doi:10.1109/tr.1977.5215060
Liu, Y. K., Wu, G. H., Xie, C. L., and Duan, Z. Y., (2016). A fault diagnosis method based on signed directed graph and matrix for nuclear power plants. Nucl. Eng. Des., 297, 166–174. doi:10.1016/j.nucengdes.2015.11.016
Liu, Y. K., Liu, Z., and Wu, X. T. (2014). Research on fault diagnosis with SDG method for nuclear power plant. Atom. Energy Sci. Technol. 48 (9), 1646–1653. doi:10.7538/yzk.2014.48.09.1646
Liu, Y. K., Peng, M. J., Xie, C. L., and Dang, Y. X.(2013). Research and design of distributed fault diagnosis system in nuclear power plant. Prog. Nucl. Energ. 68, 97–110. doi:10.1016/j.pnucene.2013.06.002
Ma, J., and Jiang, J. (2011). Applications of fault detection and diagnosis methods in nuclear power plants: a review. Prog. Nucl. Energ 53, 255–266. doi:10.1016/j.pnucene.2010.12.001
Ma, J., and Jiang, J. (2015). Semi supervised classification for fault diagnosis in nuclear power plants. Nucl. Eng. Tech 47 (2), 176–186. doi:10.1016/j.net.2014.12.005
Mano, R. M., Rengaswamy, R., and Venkatasubramanian, V. (2006). A signed directed graph-based systematic framework for steady-state malfunction diagnosis inside control loops. Chem. Eng. Sci. 61, 1790–1810. doi:10.1016/j.ces.2005.10.023
Maurya, M. R., Rengaswamy, R., and Venkatasubramanian, V. (2004). Application of signed digraphs-based analysis for fault diagnosis of chemical process flowsheets. Eng. Appl. Artif. Intell. 17, 501–518. doi:10.1016/j.engappai.2004.03.007
Maurya, M. R., Rengaswamy, R., and Venkatasubramanian, V. (2007). A signed directed graph and qualitative trend analysis-based framework for incipient fault diagnosis. Chem. Eng. Res. Des. 85 (10), 1407–1422. doi:10.1016/s0263-8762(07)73181-7
Maurya, M. R., Rengaswamy, R., and Venkatasubramanian, V. (2005). Fault diagnosis by qualitative trend analysis of the principal components. Chem. Eng. Res. Des. 83 (9), 1122–1132. doi:10.1205/cherd.04280
Mo, K., Lee, S. J., and Seong, P. H. (2007). A dynamic neural network aggregation model for transient diagnosis in nuclear power plants. Prog. Nucl. Energy 49, 262–272. doi:10.1016/j.pnucene.2007.01.002
Peng, Di., Geng, Z. Q., and Zhu, Q. X. (2014). A multilogic probabilistic signed directed graph fault diagnosis approach based on Bayesian inference. Ind. Eng. Chem. Res. 53, 9797–9804. doi:10.1021/ie403608a
Tarifa, E. E., and Scenna, N. J. (1998). A methodology for fault diagnosis in large chemical process and an application to a multistage flash desalination process: part I. Rel. Eng. Syst. Saf. 60 (1), 29–40. doi:10.1016/s0951-8320(97)00125-7
Tarifa, E. E., and Scenna, N. J. (2003). Fault diagnosis for a MSF using a SDG and fuzzy logic. Desalination 152, 207–214. doi:10.1016/s0011-9164(02)01065-2
Wang, H. Z., and Chen, B. Z. (2009). SDG-based HAZOP analysis of operating mistakes for PVC process. Process Saf. Environ. Prot. 87, 40–46. doi:10.1016/j.psep.2008.06.004
Žarković, M., and Stojković, Z. (2017). Analysis of artificial intelligence expert systems for power transformer condition monitoring and diagnostics. Electr. Power Syst. Res. 149, 125–136. doi:10.1016/j.epsr.2017.04.025
Keywords: nuclear power plants, process monitoring, fault detection and diagnosis, signed directed graph, qualitative trend analysis
Citation: Guohua W, Diping Y, Jiyao Y, Yiqing X and Dongxu J (2021) A Framework for Monitoring and Fault Diagnosis in Nuclear Power Plants Based on Signed Directed Graph Methods. Front. Energy Res. 9:641545. doi: 10.3389/fenrg.2021.641545
Received: 14 December 2020; Accepted: 01 February 2021;
Published: 17 March 2021.
Edited by:
Xianping Zhong, University of Pittsburgh, United StatesReviewed by:
Cenxi Yuan, Sun Yat-Sen University, ChinaJiankai Yu, Massachusetts Institute of Technology, United States
Copyright © 2021 Guohua, Diping, Jiyao, Yiqing and Dongxu. This is an open-access article distributed under the terms of the Creative Commons Attribution License (CC BY). The use, distribution or reproduction in other forums is permitted, provided the original author(s) and the copyright owner(s) are credited and that the original publication in this journal is cited, in accordance with accepted academic practice. No use, distribution or reproduction is permitted which does not comply with these terms.
*Correspondence: Ji Dongxu, jidongxu@cuhk.edu.cn