Analyzing Energy Transition Patterns in Asia: Evidence From Countries With Different Income Levels
 Farhad Taghizadeh-Hesary
 Ehsan Rasoulinezhad
- 1Associate Professor of Economics, Tokai University, Shibuya City, Japan
- 2Assistant Professor of Economics, Faculty of World Studies, University of Tehran, Tehran, Iran
Energy transition as the issue of striving to use more environmentally friendly energy sources instead of fossil fuels is a crucial debate for scholars. A key point is how macroeconomic variables can accelerate the energy transition movement in different regions, which may lead to similarities in energy transition patterns among various regions. The main purpose of this study is to determine how energy transition patterns depend on economic variables in Asian economies, classifying based on their income level. To this end, we collected the related variables for 45 economies in Asia over the period 1993–2018 and conducted estimation using the generalized method of moments (GMM) approach. The major results revealed that economic growth has a positive relationship with the energy transition, while CO2 emissions negatively influence energy transition. Furthermore, in both sub-sample groups (i.e., high and upper-middle-income and low and lower-middle-income groups) an increase in population lows the energy transition process. As an important recommendation, Asian economies with different income levels need different policies to improve and accelerate the energy transition movements. Especially in the developing and emerging economies that have higher economic growth rate and more energy demand, the governments need to implement various supportive policies for easing the access to electricity from green resources in line with the sustainable development goals (SDGs). This is more essential in the current low oil price era.
Introduction
The issue of striving to use more environmentally friendly energy sources instead of fossil fuels (energy transition) is a crucial debate for scholars. Kaberger (2018) and Rasoulinezhad and Jabalameli (2019) argued that replacing fossil fuels with renewable energy for electricity generation and other economic purposes may be a crucial topic for the future of the world economy. Based on IEA (2019a) report on the importance of clean energy transition, there are not any other alternative scenarios of the energy transition for mankind to combat with the current and future global environmental pollution.
Countries in the form of the global community are trying to reach efficient agreements to transform fossil fuels to cleaner fuels and increase energy efficiency to achieve a carbon zero economy target (Wiseman, 2018), however, this transition is not simple. Shell Energy Transition Report 2019 expresses that demand for fossil fuels would higher in 2030 than today, but the contribution of fossil fuels in the total energy system falls. Moreover, Regarding World Economic Forum (2018), the world needs an “effective energy transition” meaning a timely shift to address global energy-related challenges with creating value for firms and societies. Therefore, reaching an effective energy transformation is not an easy way for countries and needs in-depth studies to clarify different aspects of it.
Due to the complexity of energy transition process, different regions in the world experience different levels of energy transition based on their local energy consumption basket, geographical position, local economic ties with fossil energy, and so on. Singh et al. (2019) showed this fact by conducting the World Economic Forum’s Energy Transition Index (ETI). They concluded that based on energy system performance and transition readiness of countries, there are different level of the energy transition in the world. The energy transition movement (renewable energy consumption divide on fossil fuels energy consumption) throughout 1990–2018 is illustrated in Figure 1. It can be seen that most regions have not experienced significant energy transformation progress in the last decades. Besides, the South Asian region has a reduction movement to 2010 and then it has experienced a smooth decrease till 2018.
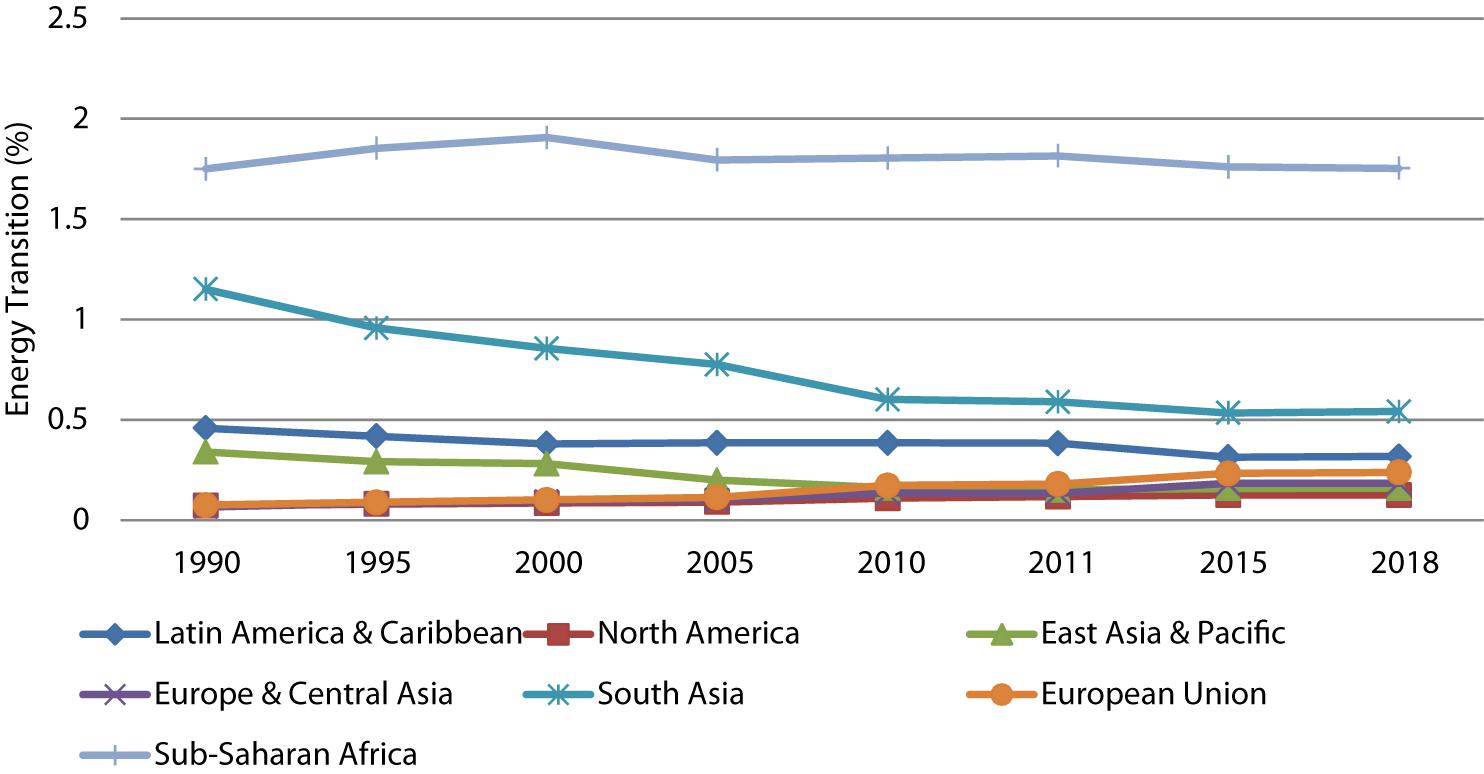
Figure 1. Energy Transition in the different regions, 1990–2018%. Source: Authors’ compilation based on data from the World Bank and BP’s 2019 statistical report.
Asia-Pacific is one of the most important regions in the world requiring a faster pace of energy transition. Mohammad (2019) believed that Asia’s energy transition can contribute to cleaner earth in the future due to the large share of industrial production and population size in this region. Furthermore, Qiao (2019) expressed that due to the cost reduction of clean energy and improvement of the green energy efficiencies, Asian countries, particularly the South East ones have big opportunity to carry out their energy transition plans. The importance of energy transition in Asia has been also declared by United Nations: Economic and Social Council (2018) due to the increased trend of fossil fuel consumption and their high potential of industrial production. Among Asian countries, China and India drive the global renewable energy generation, which is undergoing a period of energy transition and economic transformation (Mamat et al., 2019). Many studies such as Jairaj and Kumar (2019) and Al-Shamma’s et al. (2020) showed the importance of studying energy transition matters in regions and countries of Asia-Pacific. Figure 2 presents the consumption of various energy resources for different regions over the period 1965–2018.
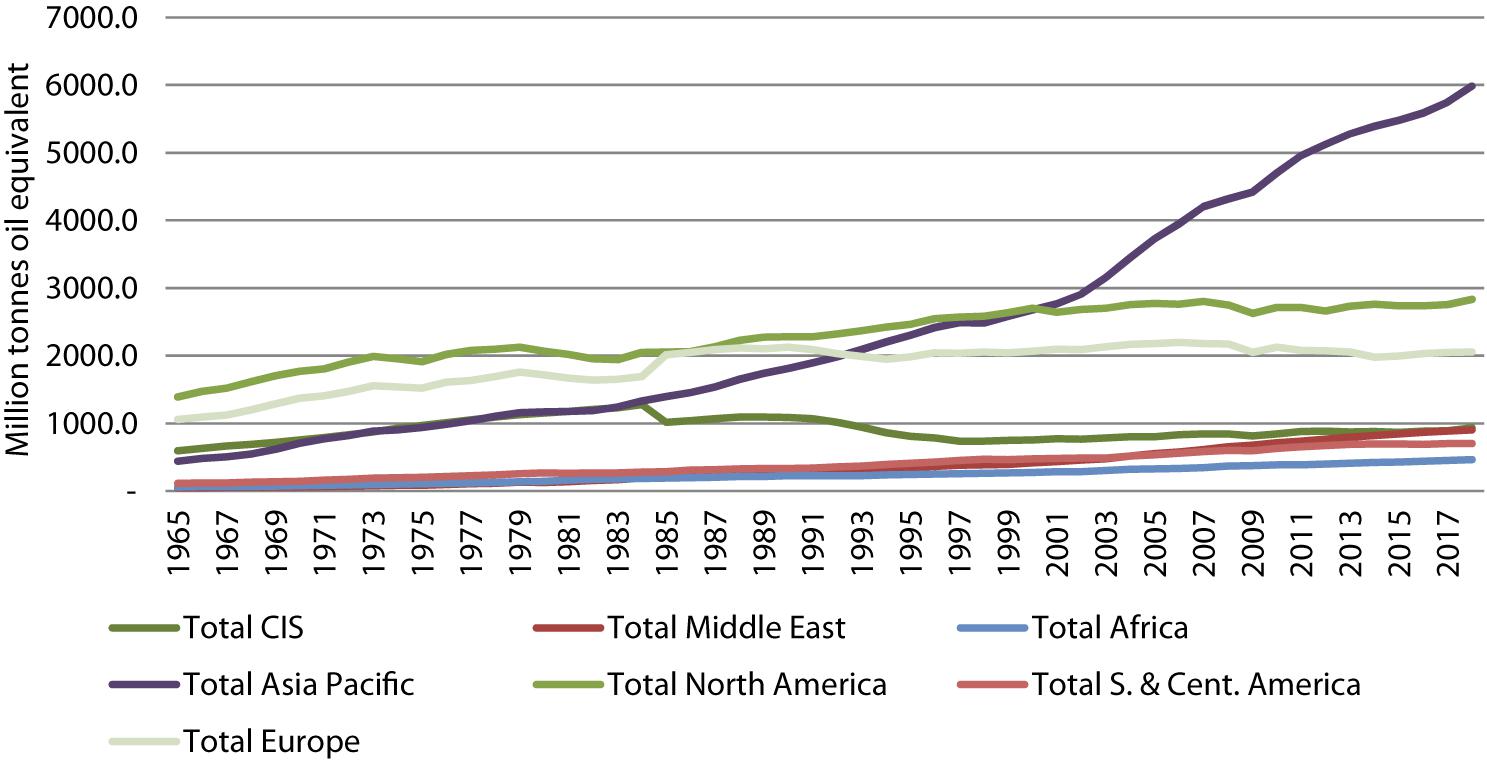
Figure 2. Primary energy consumption in different regions, 1965–2018. CIS stands for Commonwealth of Independent States, Source: Compiled by the authors using BP’s 2019 statistical report.
It can be seen that the Asia-Pacific is a pioneer in having a growth rate of energy consumption among different regions. Furthermore, the Middle East has an increased movement over the last decades. Jia et al. (2011) predict that, as a leader of Asian energy consumers, China will maintain sustained and rapid growth by 2020 and then gradually slow down, reaching 6.6 and 6.2 billion toe in 2050. In line with China, India, South Korea, and Malaysia (Sharvini et al., 2018) have been experiencing high rates of economic growth, leading to increased energy consumption in recent decades. This high level of using non-renewable energy resources has made Asian economies as significant emitters of CO2. However, Asian economies are geographically located in areas with different climatic conditions such as tropical, humid, and so on, which provides easy access to a variety of renewable energy sources (Shukla et al., 2017).
In terms of increased energy demand, the issue of global warming, and the potential for developing green energy resources in Asia, there is a question of how macroeconomic variables can accelerate or decelerate energy transition movement in different regions in Asia. Despite numerous studies such as Fattouh et al. (2019); Yuan et al. (2018), Sharvini et al. (2018); Aung et al. (2017), Saboori et al. (2017); Taghizadeh-Hesary et al. (2016)Taghizadeh-Hesary et al. (2017); Reddy (2016), and Hess and Mai (2014) focusing on energy consumption and energy transition in Asian countries, we did not find any serious academic research considering energy transition patterns among such countries. Hence, this point covers the major novelty of our research and the gap in the literature our findings may fill.
The rest of our paper is organized as follows. Section 2 represents a brief literature review. The theoretical background is discussed in section 3. Section 4 describes the data and model specifications. Section 5 reports empirical results and Finally, section 6 provides concluding remarks and policy recommendations.
Literature Review
The related literature can be divided into two different strands. First focuses on energy transition issues and the second investigates energy transition in Asia.
The first strand concentrates on energy transition in different countries. Verbong and Geels (2007) analyzed energy transition trends in the Dutch electricity system for the period 1960–2004. The authors revealed that an energy transition, with roots in the 1960s and 1970s, is occurring in the Dutch electricity system but is mainly driven by liberalization and Europeanization. Al-Mulali et al. (2015) studied the relationship between economic growth and renewable energy consumption with the environmental pollution in 23 European countries with the data for the period 1990–2013. The major results proved that there is a positive relationship between economic growth with CO2 emissions, while renewable electricity generation from solar and wind has not statistically significant effect on CO2 emissions. Sovacool (2016) discussed the speed of energy transition in different countries. He concluded that such speed is not similar among countries and depends on different factors, policies, geographical location, and energy flows in the region. Al-Mulali et al. (2016) tested the Environmental Kuznets Curve (EKC) (the U-Shape linkage between CO2 emissions and income level) hypothesis in seven different regions throughout 1980–2010. Dogan and Ozturk (2017) investigated the impacts of fossil fuel energy consumption and non-renewable energy consumption on CO2 emissions in the United States throughout 1980–2014. They found out the positive and significant impact of fossil fuel energy consumption on environmental pollution in the United States, while there is a negative relationship between green energy consumption and CO2 emissions there. Leeuwen et al. (2017) reviewed urban energy transition in the Netherlands with a focus on smart energy management. They concluded that the role of smart energy management as part of the integration of renewable energy into existing infrastructure is vital and can lead to the integration of state policies and the use of cleaner energy sources. Solarin et al. (2017) tried to analyze the existence of the EKC hypothesis in two emerging economies, i.e., India and China. The major results proved that GDP positively impacts on CO2 emissions in these two countries. Stokes and Breetz (2018) analyzed politics in United States energy transition, particularly in the case of wind, solar, and biofuels. The findings depicted similar patterns across the electricity and transportation sectors. Osti (2018) considered different problems of transition to renewable energy sources on the small island of Sardinia in Italy. He concluded that in this region, three myths of fossil fuels vs. renewables, competition regarding smart grid and storage system technologies, and energy sovereignty vs. energy interdependency should be solved to enhance the energy transition level of Sardinia in the future. Vainio et al. (2019) investigated achieving a sustainable energy transition in Finland with a focus on the importance of citizen’s images. The major findings revealed that the sustainable energy transition was strongly supported in Finland, but different socio-economic groups preferred somewhat different images. Szabo et al. (2019) studied types of long-term pathways that exist for electricity sector development in Southeast Europe. They found that to avoid lock-in to carbon-intensive technologies, stranded costs should be carefully considered in decision-making on new fossil fuel generation and gas network investment. Ozcan and Ozturk (2019) focused on the relationship between renewable energy consumption and economic growth in different emerging economies for the period of 1990–2016. The major findings showed evidence of the existence of the neutrality hypothesis due to the non-presence of the relationship between economic growth and renewable energy consumption. Vaillancourt et al. (2019) investigated the role of bioenergy in the low-carbon energy transition in Canada. Their results indicated a larger share of bioenergy in 2030 (up to a threefold increase in the most stringent greenhouse gas reduction scenario), with up to a fourfold increase in the total amount of feedstock used for bioenergy production. Sharif et al. (2019) conducted panel estimations to find out the relationship between fossil fuel and green energy consumption with carbon dioxide emissions for 74 countries from 1990 to 2015. The findings showed the direct and significant impact of fossil fuel energy consumption on CO2 emissions, while the consumption of non-renewable energy resources can help the countries to lower CO2 emissions.
The second strand of literature contains earlier studies focused on energy transition issues in different Asian countries. Pachauri and Jiang (2008) attempted to examine the household energy transition patterns in both India and China. They found that trends in energy use and the factors influencing a transition to modern energy are similar in both countries. Ngar-yin Mah et al. (2013) investigated the Japanese model of large smart grids for sustainable energy transitions. They argued that the Japanese model is characterized by a government-led, community-oriented, and business-driven approach with the launch of four large-scale smart-community demonstration projects. The Japanese government has demonstrated its high governing capacity in terms of leadership, and recombinative, institutional, enabling, and inducement capacities. Yildirim et al. (2014) studied the relationship between GDP per capita and energy consumption in the Association of Southeast Asian Nations (ASEAN) member states throughout 1971–2009. The paper concluded that the relationship is dissimilar among ASEAN member states. For instance, the conservation hypothesis is proved for Indonesia, while a bi-directional linkage was found out for the case of Thailand. Apergis and Ozturk (2015) tested the existence of the EKC for 14 Asian nations using the GMM approach. Their results proved the hypothesis for all Asian countries. Reddy (2016) used a bottom-up approach to investigate India’s energy system transition. The main results revealed that significant resource savings can be achieved by 2030 through the introduction of energy-efficient and green technologies. In other studies, Ahmed et al. (2017) investigated the factors influencing on long-run CO2 emissions in South Asia. Analyzing data throughout 1971–2013, the major results revealed that there is a uni-directional linkage from fossil fuel energy consumption and population growth to long-run CO2 in this region. Gulagi et al. (2017) stimulated a 100% renewable energy transition model for India until 2030. They concluded that technology improvement can be an efficient instrument to reach a 100% energy transition in India. Chapman and Itoaka (2018) attempted to analyze the energy transition in Japan’s liberalizing electricity market. They found that future energy transition pathway projections will need to incorporate policy approaches and mechanisms as well as being cognizant of Japan’s geographic and cost-competitive renewable energy resource deployment limitations. Kucharski and Unesaki (2018) investigated the role of Japan’s energy institutions in the post-Fukushima period. The major results revealed that policy reforms can affect energy sector structure and performance and proved that significant structural and institutional changes are underway in Japan’s energy transition.
Considering both strands of literature discussed above, to the best of our knowledge, there has not been any serious academic attempt to investigate energy transition-macroeconomic variables linkages in Asia-Pacific economies and compare them among different groups based on the income levels. Hence, our study aims to fill the literature gap.
Theoretical Background
Energy sources, that is, renewables and non-renewables are mainly used for electricity generation. For instance, many Asian nations such as Malaysia is highly dependent on fossil fuels as oil, coal and natural gas are major contributors to its power generation (Sharvini et al., 2018). Furthermore, in China and India, the electricity sector is the major consumer of fossil fuels, particularly coal (Zou et al., 2016; Zhang et al., 2019). We can assume that only two economic sectors (industrial and household/residential sectors) consume electricity generated by energy sources. In other words, the demand for renewable and non-renewable energy comes from these two sectors only.
We start with the industry’s energy demand. Eq. 1 represents the production function of industry, which is assumed to be in Cobb-Douglas form as in Rasoulinezhad et al. (2020):
Here, YI is the total output of industry, K is the capital input, L denotes the labor input, ET1 represents energy inputs of industrial production, which is considered as energy transition (share of renewables to non-renewables) in the industrial sector as written in Eq. 2. By considering constant returns to scale, α is the elasticity of production of capital, β is the elasticity of production of labor, and the elasticity of production of energy resources is equal to 1−α−β.
Where RECI and NRECI represent renewable energy consumption and non-renewable energy consumption in the industrial sector, respectively. It should be mentioned that we did not address energy resources as primary (contains original fuels such as oil, coal, natural gas, water, solar and wind) and secondary (like electricity) energies. Because these classifications can not represent an energy transition movement.
According to Hansen et al. (1995), firms are maximizing their profit as follows:
where π is the sector’s profit, PY is the price of the final products, r denotes the interest rate of capital, w denotes the wage rate, e denotes the exchange rate, PE denotes energy price and T denotes the transportation cost of energy resources.
By inserting YI from Eq. 1 into Eq. 3 and getting the first-order condition of profit (π) with respect to EI, Eq. 4 will result:
The energy transition demand is represented in Eq. 5:
As shown, industry’s energy transition demand is a function of the elasticities of production of labor and capital, the real output of industry sector, the price of energy, the exchange rate, and the transportation cost of energy.
Next, we consider household energy demand using the following utility function:
As in Taghizadeh-Hesary and Yoshino (2018) Ct donates the consumption of non-energy goods and denotes the consumption of energy goods (representing the energy transition demand of households). Following Cymrot and Seiver (1982), households maximize their utility with respect to their budget, which is the constraint, as shown in Eq. 7:
Where PC denotes the price of non-energy goods, PE denotes the energy goods, which depends on energy prices denominated in US dollars, and T denotes the transportation costs, YH is the total income of the households.
To maximize the utility of households for defining the factors that determine energy demand, we develop the Lagrange function, as in Eq. 8:
Obtaining the first-order conditions with respect to the ETH, C , and λ results in Eqs. 9–11:
Substituting λ from Eq. 10 in Eq. 9 and solving it for , we find that the household’s energy transition demand is a function of the exchange rate, electricity tariff, transportation costs of energy, and the income level of the household (in macro-level, the income level of the energy importer), as in Eq. 12:
The total energy transition demand is equal to the combined energy demand of households and industry (Eq. 13).
Therefore, the total energy demand (ETt) is a function of different factors, as shown in Eq. 14:
where PE is the electricity tariff, and T denotes the transportation costs of energy, e is the exchange rate, and Yt is the total GDP of the energy importer, which depends on the income level of households () and the total output of the industry ().
Data and Model Specifications
The empirical part of this study is based on balanced panel data of variables throughout 1993–2018 (the reason of choosing this period is the availability of data for the variables of the model) for high- and middle- and low-income countries in Asia-Pacific. Our samples are gathered based on the UN regional groups for the Asia-Pacific (un.org) including 55 different nations (see Appendix 1). However, due to the lack of data, we had to omit some countries and our finalized samples contained 45 countries. Based on the World Bank Atlas method (worldbank.org), the finalized samples were also divided into two different groups according to income level (to have a sufficient samples size for panel data estimation, we could not consider four income groups of high, upper-middle, lower-middle and low-income groups), that is, a high and upper-middle-income group (24 countries), a and low and lower-middle-income group (21 countries) (see Appendix 2).
Furthermore, based on the theoretical model, we employed energy transition (Renewable energy consumption/non-renewable energy consumption) as a dependent variable, and official exchange rate, GDP, population growth (due to the lack of data for energy prices in many countries for our samples, we choose population growth as a proxy for energy price, as the higher population growth rate will increase the energy demand and increase the energy prices), and CO2 emissions as independent variables. Most of the data were extracted from the BP statistical review of BP, 2019 and the World Bank database. The primary descriptive statistics for 45 Asian countries are presented in Table 1.
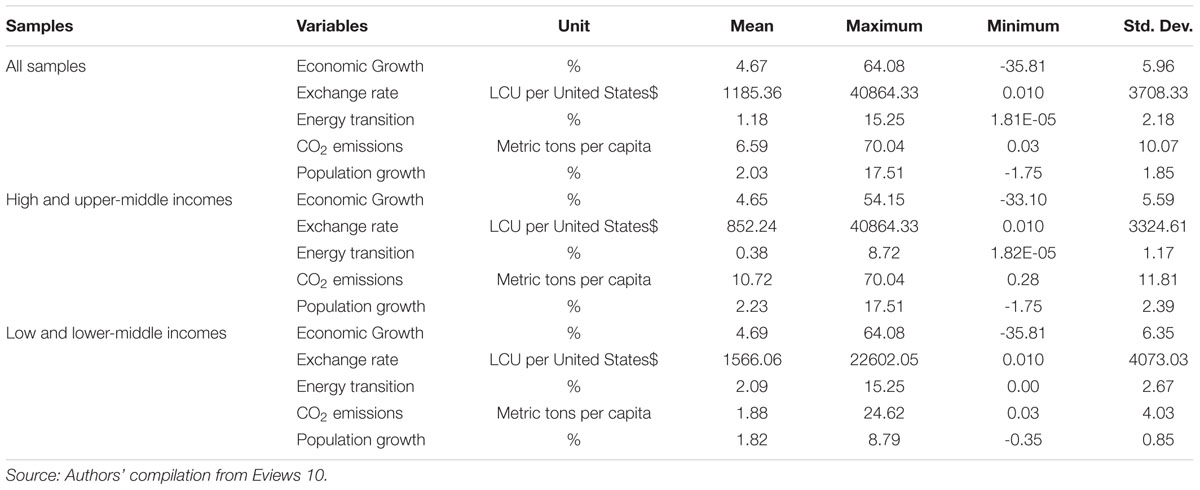
Table 1. Descriptive statistics.
As shown in Table 1, the average annual economic growth of all 45 countries is 4.6% over 1993–2018. Moreover, the maximum is 64.08% (Timor-Leste in 2004) and the minimum is -35.81% (Cambodia in 1993). It is interesting to note that countries with low and lower-middle incomes have the highest average economic growth over 1993–2018 (4.69% compared with 4.65% and 4.67% for countries with high and upper-middle incomes and all samples, respectively). Regarding energy transition, the average for countries with low and lower-middle incomes is 2.09%, which is higher than the means of this variable in counties with high and upper-middle incomes (0.38%).
Besides, Tables 2–4 represent Pearson correlations between variables based on all samples, the high and upper-middle-income group, and the low and lower-middle-income group. According to Table 2, for 45 Asian countries, there is a negative relationship between energy transition and exchange rate, and CO2 emissions and population growth, while economic growth and energy transition have positive linkage over the period.
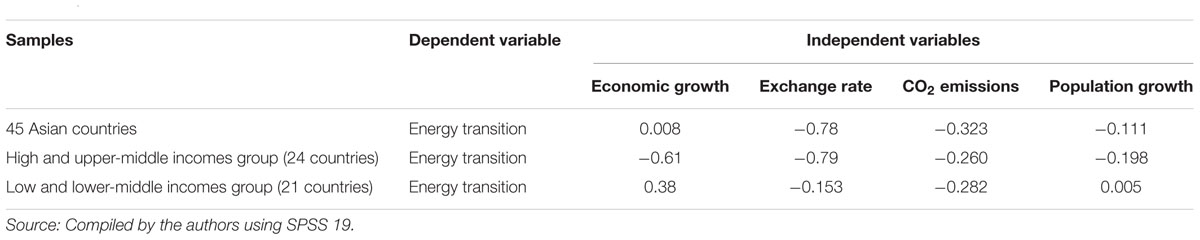
Table 2. Pearson correlation results.
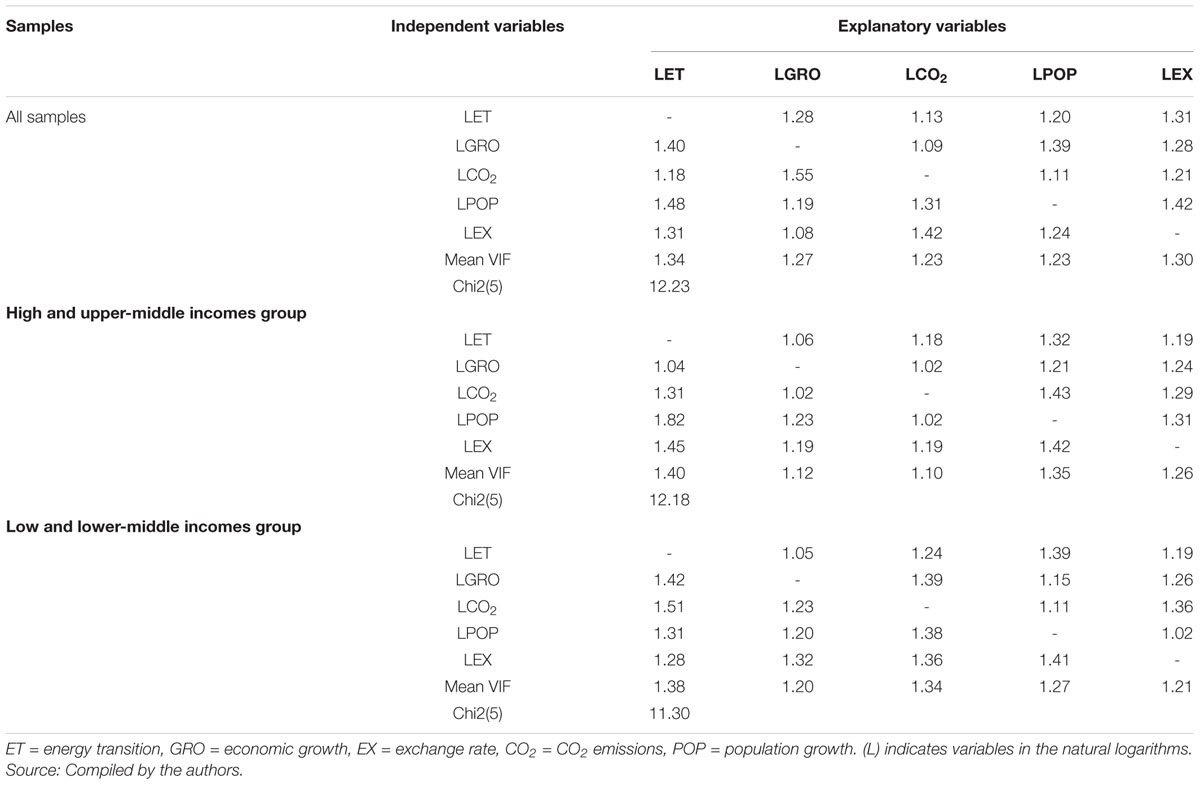
Table 3. Results of VIF and Hausman tests.
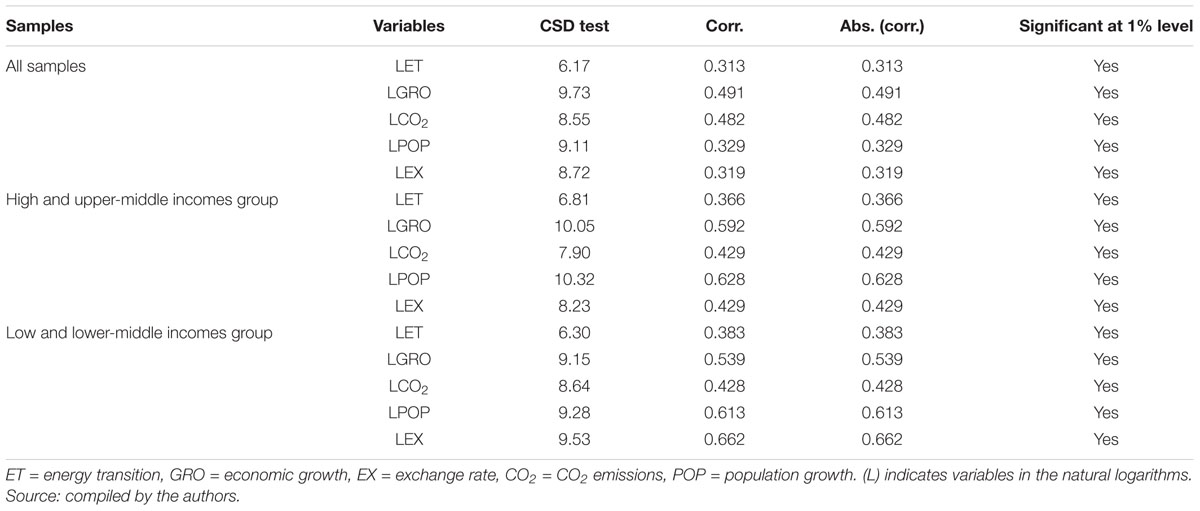
Table 4. Cross-sectional dependence test results.
For the case of the high and upper-middle-income group, it is clear that there is a negative relationship between energy transition and all regressors, while economic growth and population growth are positively linked with energy transition and exchange rate, and CO2 emissions have a negative relationship with energy transition for the low and lower-middle-income group.
Based on our variables, our econometric equation with a generalized method of moments (GMM) panel approach can be written as in Eq. 15:
where ET indicates energy transition (dependent variable) and X denotes all explanatory variables ηit represents the country-specific effects, and εit is the error term.
For running the regressions, due to the limitations of data we are assuming that the electricity prices and transportations costs are constant. Instead, we are entering two control variables and can also represent these two omitted variables. The entered variables are population growth rate and CO2 emission. According to Alimi and Mesagan (2018), growth in the population will increase energy consumption (energy demand) leading to an increase in energy prices and vice versa). Besides, longer distances between the origin of fossil fuels (energy exporters) and the importers’ countries will result in higher transportation costs and higher CO2 emissions. Next, some preliminary tests should be conducted to derive reliable empirical estimations. As the first pre-estimation test, the variance inflation factor (VIF) is performed to ascertain whether there is any multicollinearity among the series. The second preliminary test is the Hausman test to check for the existence of heterogeneity, which clarifies the presence of random or fixed effects in our panel. Given that the economies of the Russian Federation and the selected sample have experienced various exogenous and endogenous shocks, the next pre-estimation test checks for cross-sectional dependency among the series. The second-generation unit root test is the last preliminary test and is used to ascertain whether the series are I(1) stationary or I(0) non-stationary. Furthermore, after running the GMM estimations, we conduct two different diagnostic tests. The first is the Arellano-Bond test for zero autocorrelation in the first-differenced errors, and the second is the Sargan test to verify the overidentifying restrictions.
Results
Preliminary Tests
Before presenting empirical findings of GMM estimations, as previously mentioned, some preliminary tests should be conducted. Table 3 reports the results of the VIF (checking multicollinearity among series) and Hausman (checking the nature of the panel data series) tests.
Based on the results in Table 3, we can conclude that there is low multicollinearity between the cross-sections. Besides, the findings of the Hausman test (Chi2) depict the panel data with random effects. Next, we test for the existence of cross-sectional dependence (CSD) in the series; the results are presented in Table 4.
The results of the CSD test indicate that cross-sections are present in all series among all samples, the high and upper-middle-income group, and the low and lower-middle-income group. This means that our samples, both in aggregated and disaggregated groups, share the same characteristics. Generally, in situations in which there are low multicollinearity and CSD in the series, it is necessary to check the stationarity of variables. Here, we conducted the second-generation panel unit root test (Pesaran’s 2007 CIPS test) with the null hypothesis of all series being I(1). The findings are reported in Table 5.
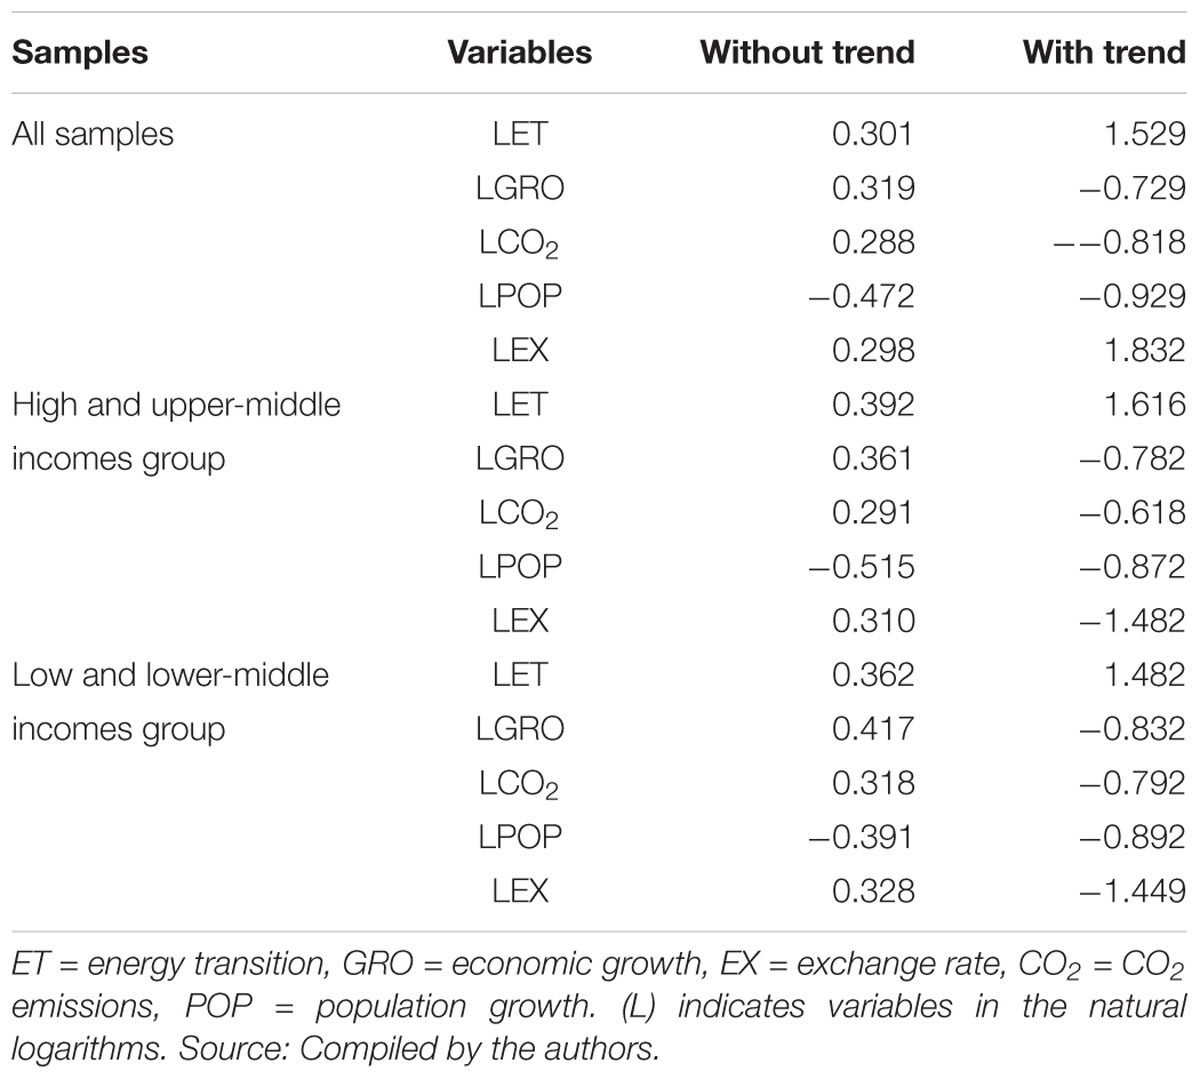
Table 5. Pesaran (2007) panel unit root test results.
The findings of the aforementioned test reveal that all series considering all samples, the high and upper-middle-income group, and the low and lower-middle-income group are I(0).
GMM Findings
After performing all the necessary preliminary tests, the Arellano-Bond dynamic GMM estimation is conducted for the three groups (all samples, high and upper-middle-income group, and low and lower-middle incomes group). The results of the GMM estimation for all 45 Asian countries (all samples) are reported in Table 6.
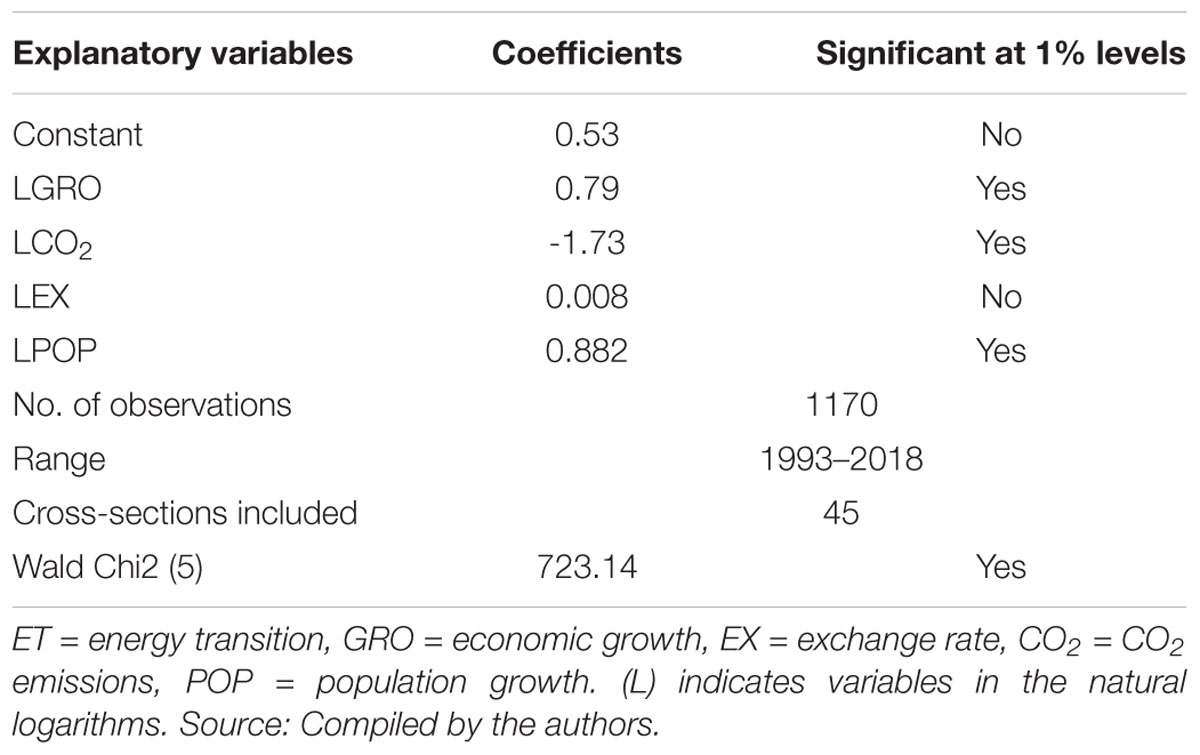
Table 6. Estimation results for 45 Asian countries.
According to the results in Table 6, the economic growth of Asia-Pacific economies has a positive effect on the energy transition movement in this region. A 1% increase in economic growth level leads to an approximately 0.79% increase in the energy transition process. This finding is in line with Saidi and Hammam (2015); Adams et al. (2018), Hoon Kang et al. (2019), and Diaz et al. (2019) who found a positive linkage between economic growth and moving from fossil fuels to renewables. Our result is in contrast to Maji (2015) and Chen et al. (2019), who proved a mixture of negative and positive relationships between green energy usage and economic growth. Regarding CO2 emissions, the estimation proves that this variable negatively affects the energy transition process. A 1% increase in CO2 emissions may decrease the energy transition process in Asia by nearly 1.7%. Our finding is in line with Ito (2015) and Bilgili et al. (2016), who found a negative linkage between these two variables. Besides, the effect of the exchange rate was found to be statistically insignificant, while population growth has a positive sign, meaning it has a positive effect on energy transition in Asia.
Table 7 reports the estimated coefficients of variables for the high and upper-middle-income group. The results prove the positive effect of economic growth on the energy transition process for this group. A 1% increase in the economic growth of these 24 nations leads to an almost 0.8% increase in renewable energy consumption. This finding is in line with Teulon (2014) who argued that due to the developed economic structure in these kinds of countries, a higher economic growth accelerates financing green projects leading to more consumption of renewable energy sources. Furthermore, the rest of the variables were found to harm the energy transition. The estimation reveals that a 1% increase in CO2 emissions, exchange rate, and population growth, may reduce the energy transition process in this group by approximately 2.1%, 0.03%, and 1.9%, respectively.
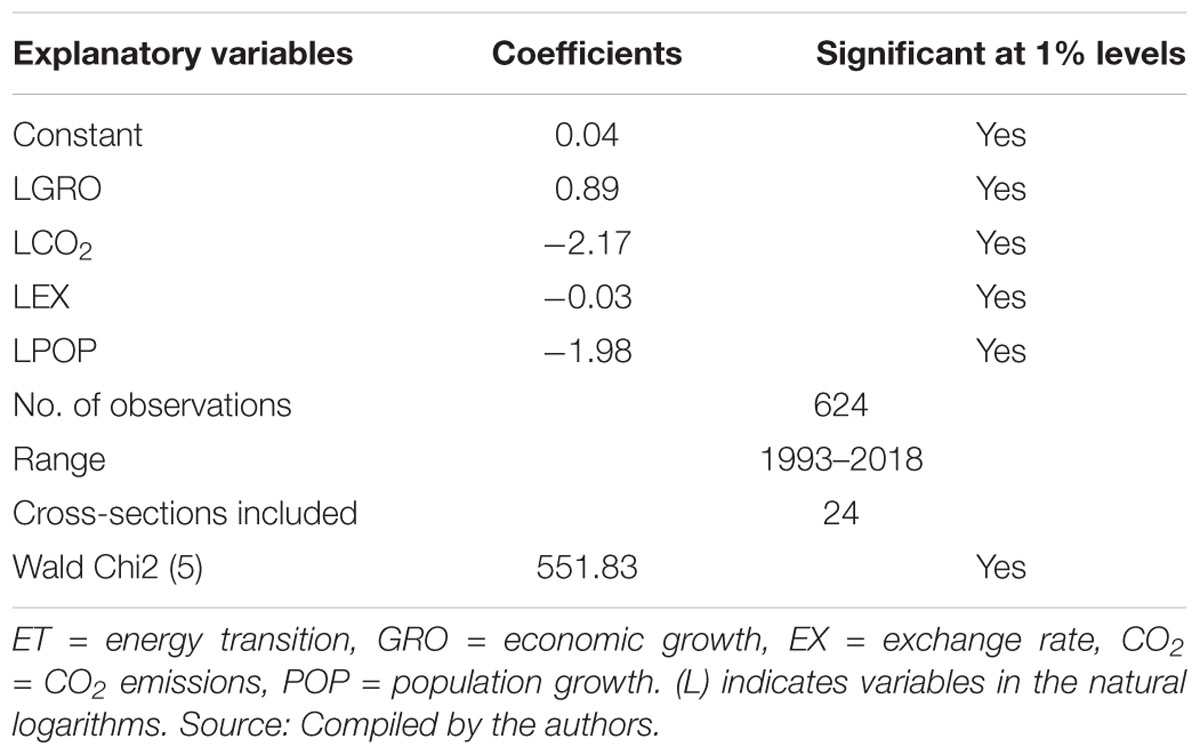
Table 7. Estimation results for the high and upper-middle income group.
The GMM estimation for the low and lower-middle incomes group proves the positive effect of economic growth and exchange rate, while population growth and CO2 emissions are found to have a negative effect on the energy transition process of this group. According to the results in Table 8, a 1% increase in economic growth and exchange rate leads to an increase of the energy transition of this group by approximately 0.9% and 0.07%, respectively, whereas a 1% increase in CO2 emissions and population growth led energy transition to decelerate by nearly 1.5% and 2.8%, respectively. The magnitudes of impacts from CO2 emissions and population growth are stronger than the impacts of economic growth and exchange rate. This finding is in line with Spencer and Mathur (2019) who expressed that emerging and developing nations with a lower income level need to link decarbonization policies (manage and lower CO2 emissions) with their energy transition process.
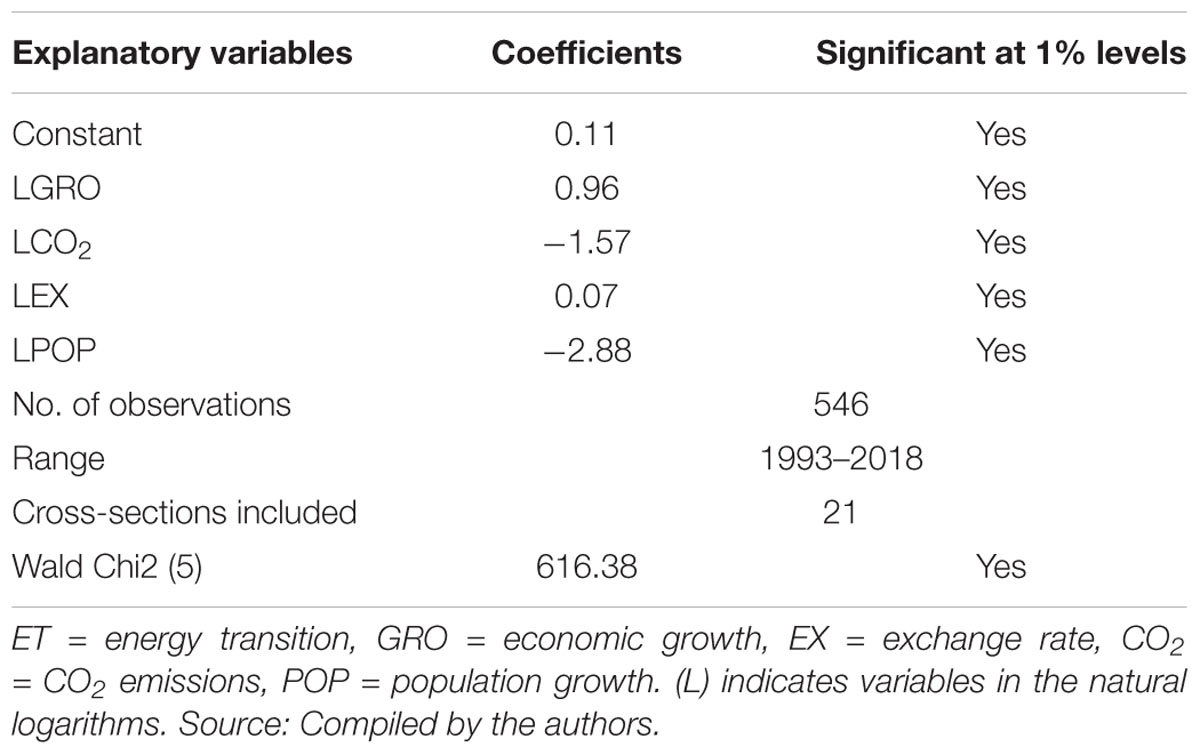
Table 8. Estimation results for the low and lower-middle income group.
As the final stage in the empirical estimations, we conducted diagnostic tests to verify the characteristics of the model. As shown in Table 9, the Arellano and Bond diagnostic test and Sargan test yield the following results.
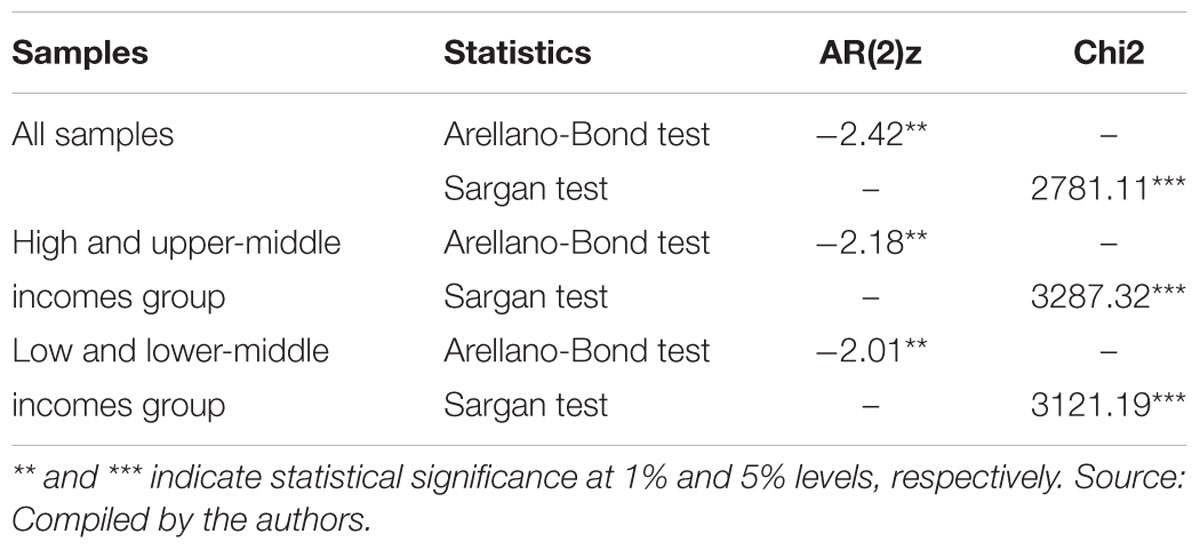
Table 9. Diagnostic test results for GMM estimation.
The findings strongly reject non-autocorrelation, and the Arellano-Bond model assumptions are therefore satisfied. Besides, the Sargan test results prove that there are not any overidentifying restrictions, meaning that we can conclude that our three models are suitable.
Robustness Analysis
To check the GMM estimation results, reported in Tables 6–8, we used alternative panel data techniques, namely fully modified ordinary least squares (FMOLS), to check the robustness of our major findings. As shown in Table 10, estimation results do not significantly differ, which suggests our results are robust.
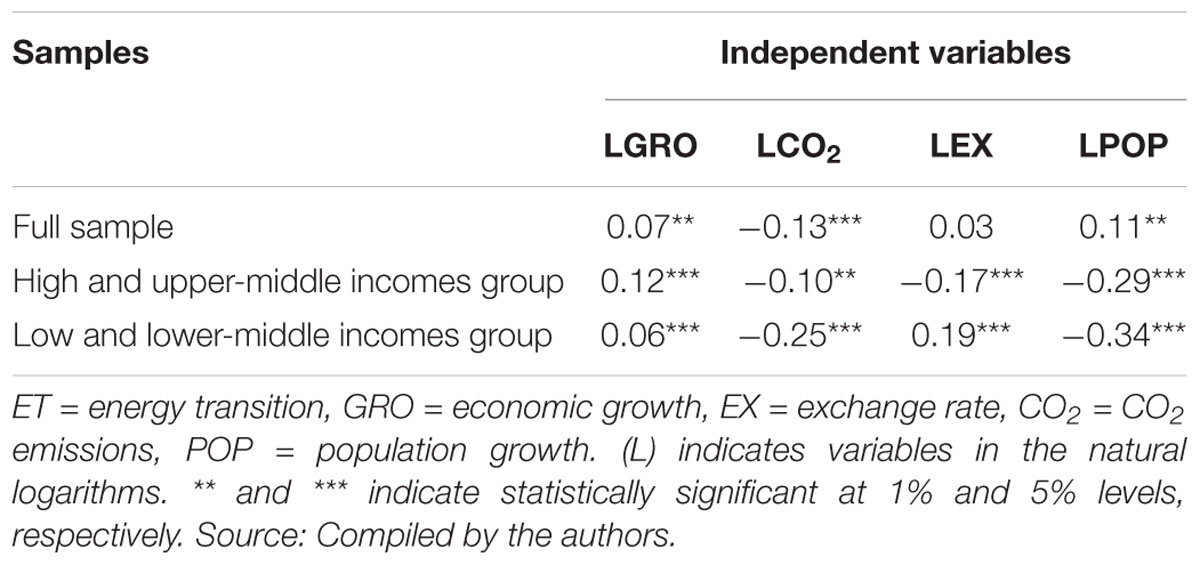
Table 10. Robustness check using FMOLS.
Concluding Remarks and Policy Recommendations
Based on annual data over the period 1993–2018, this study attempts to model energy transition in Asia-Pacific economies. To this end, we selected a sample of 45 countries and divided the sample based on the level of income to achieve better results. The high and upper-middle-income group included 24 countries and the low and lower-middle-income group included 21 countries.
Based on the empirical analysis using a GMM model, we determined similarities and dissimilarities in energy transition models among the sample groups. As for the similarities, economic growth has a positive relationship with the energy transition, while CO2 emissions negatively influence energy transition in all sample groups. The results, regarding the economic growth-energy transition linkage, is in line with Saidi and Hammam (2015); Saad and Taleb (2017), Adams et al. (2018); Hoon Kang et al. (2019), Diaz et al. (2019) and Kouton (2020), who found a positive correlation between economic growth and moving from fossil fuels to renewables (energy transition). Our result is in contrast to Maji (2015) and Chen et al. (2019), who proved a mixture of negative and positive relationships between green energy usage and economic growth. Regarding the negative linkage between CO2 emissions and energy transition, our finding is in line with Ito (2015), Bilgili et al. (2016) and Bilan et al. (2019), who found a negative linkage between these two variables and that the negative impact of air pollution in terms of CO2 emissions on green sources consumption does not depend on country income level. Reduction in air pollution can be an indicator of a reduction in fossil fuel consumption and an increase in using renewable energy sources. Moreover, a major motivation for transitioning to renewable energy is to reduce CO2 emissions. Although the energy transition is not the only way for reducing CO2 emissions. According to the United States Environmental Protection Agency (EPA), agricultural, forestry, and land use including crops, livestock and deforestation are responsible for 24% of the global carbon emissions (EPA, 2018). Regenerative agriculture sequesters carbon in the soil (the best indicator of healthy soil is its carbon content). This means in addition to shifting to renewable energy, for reducing CO2 emissions transitioning from industrial agriculture to regenerative agriculture and preventing the deforestation are required.
The existence of differences among energy transition patterns of countries is in line with Chen et al. (2019) and Chen et al. (2020) who found out the dissimilar relationship between carbon dioxide emissions and renewable energy consumption across different regions.
Furthermore, in both sub-sample groups (i.e., high and upper-middle-income and low and lower-middle-income groups), increase the population leads to a decrease in the energy transition process. This result is in contrast with Salim and Shafiei (2014), who found a negative effect of population density on non-renewable energy consumption. The main reason for the negative effect is that the main energy source in Asia-Pacific is still fossil fuels. As dissimilarities, the results revealed that depreciation of the national currency in the high and upper-middle-income group may lead to an increase in renewable energy consumption in these countries, while this decreases energy transition movement in the low and lower-middle-income group. This happened because in the former group there are several exporters of renewable energy technologies such as China, Japan, Malaysia and while most countries in the latter group are the importer of green technologies and depreciation of the local currency makes the price of the imported renewable technology more expensive in the local currency as a result making the energy transition costlier and more difficult.
Based on IEA (2019b), the energy transition is a complexed process which needs interactions and cooperation among countries with different levels of development. Therefore, solving the complexity of energy transition requires global or regional cooperation and integration. According to Elshurafa et al. (2019), energy transition may take longer and has a heavy cost, so countries should make global or regional cooperation to facilitate these challenges in the way of energy transformation. This policy is in line with Kern and Smith (2008) who argued the necessity of energy transition management model to make integration in policies and plans to go to reach a higher level of energy transition which is a sign of economic development (Zahid et al., 2020). Another current challenge for energy transition development in Asia-Pacific is the Coronavirus (Covid-19) pandemic that hits demand for all fossil fuel resources and reduced the oil prices dramatically. According to the International Energy Agency (IEA, 2020) as a consequence of global lockdown measures due to the Covid-19 crisis, 57% of global oil demand declined at an unprecedented scale in early 2020. Renewable energy projects will lose their competitiveness in low fossil fuel prices that will endanger the Paris agreement on climate change and the climate and clean energy-related SDGs.
Therefore in the post-Covid era proactive and efficient support and plans of government can keep the renewable energy sector and the energy transitions alive. Supportive plans such as the green credit guarantee scheme (Taghizadeh-Hesary and Yoshino, 2019) and policy and financial de-risking (Taghizadeh-Hesary and Yoshino, 2020) are necessary as renewable energy projects in the current timing find more difficulties in accessing to finance and investments.
Overall, we suggest that countries with different income levels have quite dissimilar energy transition patterns. Hence, they need different policies to improve energy transition movement. However, the inter-connected approach among countries in the field of energy transformation is a vital factor in success. Moreover, we recommend that Asia-Pacific countries need to alter their present energy policies [in line with Gulagi et al. (2020)] to enhance various policies for easing the access to electricity from green resources.
Notwithstanding its limitations, we believe that this study contributes to the existing literature on energy transition patterns. We recommend future research employs different control variables such as trade openness, interest rate, and inflation rate in econometric models, considering direct and indirect effects (following Taghizadeh-Hesary et al., 2013, 2019) and conducts causality tests to distinguish short- and long-run linkages between energy transition and independent variables.
Data Availability Statement
The datasets analyzed in this manuscript are not publicly available. Requests to access the datasets should be directed to ER, e.rasoulinezhad@ut.ac.ir.
Author Contributions
Both authors contributed equally to the manuscript and reviewed the final manuscript.
Funding
FT-H acknowledges the financial supports of the JSPS Kakenhi (2019–2020) Grant-in-Aid for Young Scientists No. 19K13742 and Grant-in-Aid for Excellent Young Researcher of the Ministry of Education of Japan (MEXT).
Conflict of Interest
The authors declare that the research was conducted in the absence of any commercial or financial relationships that could be construed as a potential conflict of interest.
Acknowledgments
The authors are grateful to the editor and reviewers of the Frontiers in Energy Research that their precious comments helped to improve the paper and preparing the current version.
References
Adams, S., Klobodu, E., and Apio, A. (2018). Renewable and non-renewable energy, regime type and economic growth. Renew. Energy 125, 755–767. doi: 10.1016/j.renene.2018.02.135
Ahmed, K., Rehman, M. U., and Ozturk, I. (2017). What drives carbon dioxide emissions in the long-run? Evidence from selected South Asian Countries. Renew. Sustain. Energy Rev. 70, 1142–1153. doi: 10.1016/j.rser.2016.12.018
Alimi, O. Y., and Mesagan, E. (2018). Population growth, energy use, crude oil price, and the nigerian economy. Ikonomicheski Izsledvania 27, 115–133.
Al-Mulali, U., Ozturk, I., and Lean, H. H. (2015). The influence of economic growth, urbanization, trade openness, financial development, and renewable energy on pollution in Europe. Nat. Hazards 79, 621–644. doi: 10.1007/s11069-015-1865-9
Al-Mulali, U., Ozturk, I., and Solarin, S. A. (2016). Investigating the environmental Kuznets curve hypothesis in seven regions: the role of renewable energy. Ecol. Indic. 67, 267–282. doi: 10.1016/j.ecolind.2016.02.059
Al-Shamma’s, A., Alturki, F., and Farh, H. (2020). Techno-economic assessment for energy transition from diesel-based to hybrid energy system-based off-grids in Saudi Arabia. Energy Trans. 4, 31–43. doi: 10.1007/s41825-020-00021-2
Apergis, N., and Ozturk, I. (2015). Testing environmental Kuznets curve hypothesis in Asian countries. Ecol. Indic. 52, 16–22. doi: 10.1016/j.ecolind.2014.11.026
Aung, T. S., Saboori, B., and Rasoulinezhad, E. (2017). Economic growth and environmental pollution in Myanmar: an analysis of environmental Kuznets curve. Environ. Sci. Pollut. Res. 24, 20487–20501. doi: 10.1007/s11356-017-9567-3
Bilan, Y., Streimkiene, D., Vasylieva, T., Lyulyov, O., Pimonenko, T., and Pavlyk, A. (2019). Linking between renewable energy, CO2 emissions, and economic growth: challenges for candidates and potential candidates for the EU membership. Sustainability 11:1528. doi: 10.3390/su11061528
Bilgili, F., Kocak, E., and Bulut, U. (2016). The dynamic impact of renewable energy consumption on CO2 emissions: a revisited Environmental Kuznets Curve approach. Renew. Sustain. Energy Rev. 54, 838–845. doi: 10.1016/j.rser.2015.10.080
BP, (2019). BP Statistical Reivew of World Energy 2019. Available online at: https://www.bp.com/en/global/corporate/news-and-insights/press-releases/bp-statistical-review-of-world-energy-2019.html (accessed September 7, 2019).
Chapman, A. J., and Itoaka, K. (2018). Energy transition to a future low-carbon energy society in Japan’s liberalizing electricity market: precedents, policies and factors of successful transition. Renew. Sustain. Energy Rev. 81, 2019–2027. doi: 10.1016/j.rser.2017.06.011
Chen, C., Pinar, M., and Stengos, T. (2020). Renewable energy consumption and economic growth nexus: evidence from a threshold model. Energy Policy 139:111295. doi: 10.1016/j.enpol.2020.111295
Chen, Y., Zhao, J., Lai, Z. H., Wang, Z. H., and Xia, H. (2019). Exploring the effects of economic growth, and renewable and non-renewable energy consumption on China’s CO2 emissions: evidence from a regional panel analysis. Renew. Energy 140, 341–353. doi: 10.1016/j.renene.2019.03.058
Cymrot, D., and Seiver, D. (1982). A note on individual utility maximization in a household context. Eastern Econ. J. 8, 211–214.
Diaz, A., Marrero, G. A., Puch, L. A., and Rodriguez, J. (2019). Economic growth, energy intensity and the energy mix. Energy Econ. 81, 1056–1077. doi: 10.1016/j.eneco.2019.05.022
Dogan, E., and Ozturk, I. (2017). The influence of renewable and non-renewable energy consumption and real income on CO2 emissions in the USA: evidence from structural break tests. Environ. Sci. Pollut. Res. 24, 10846–10854. doi: 10.1007/s11356-017-8786-y
Elshurafa, A., Farag, H. M., and Hobbs, D. A. (2019). Blind spots in energy transition policy: case studies from Germany and USA. Energy Rep. 5, 20–28. doi: 10.1016/j.egyr.2018.11.001
EPA (2018). Available online at: https://www.epa.gov/ghgemissions/global-greenhouse-gas-emissions-data (accessed June 14, 2020).
Fattouh, B., Poudineh, R., and West, R. (2019). The rise of renewables and energy transition: what adaptation strategy exists for oil companies and oil-exporting countries? Energy Trans. 3, 45–58. doi: 10.1007/s41825-019-00013-x
Gulagi, A., Bogdanov, D., and Breyer, C. H. (2017). The demand for storage technologies in energy transition pathways towards 100% renewable energy For India. Energy Proc. 135, 37–50. doi: 10.1016/j.egypro.2017.09.485
Gulagi, A., Ram, M., Solomon, A., Khan, M., and Breyer, C. H. (2020). Current energy policies and possible transition scenarios adopting renewable energy: a case study for Bangladesh. Renew. Energy 155, 899–920. doi: 10.1016/j.renene.2020.03.119
Hansen, P., Peeters, D., and Thisse, J. (1995). The profit-maximizing weber problem. Location Sci. 3, 67–85. doi: 10.1016/0966-8349(95)00011-6
Hess, D. J., and Mai, Q. D. (2014). Renewable electricity policy in Asia: a qualitative comparative analysis of factors affecting sustainability transitions. Environ. Innovat. Soc. Trans. 12, 31–46. doi: 10.1016/j.eist.2014.04.001
Hoon Kang, S., Islam, F., and Kumar Tiwari, A. (2019). The dynamic relationships among CO2 emissions, renewable and non-renewable energy sources, and economic growth in India: evidence from time-varying Bayesian VAR model. Struct. Change Econ. Dyn. 50, 90–101. doi: 10.1016/j.strueco.2019.05.006
IEA (2019b). The Critical Role of Buildings: Perspectives for the Clean Energy Transition. Available online at: https://www.iea.org/reports/the-critical-role-of-buildings (accessed June 13, 2020).
IEA (2020). COVID-19. Available online at: https://www.iea.org/topics/covid-19 (accessed June 13, 2020).
Jairaj, B., and Kumar, P. (2019). An assessment of India’s energy transition: Paris and beyond. Jindal Glob. Law Rev. 10, 35–47. doi: 10.1007/s41020-019-00085-2
Jia, L., Wenying, C. H., and Deshun, L. (2011). Scenario analysis of China’s future energy demand based on TIMES model system. Energy Proc. 5, 1803–1808. doi: 10.1016/j.egypro.2011.03.307
Kaberger, T. (2018). Progress of renewable electricity replacing fossil fuels. Glob. Energy Interconnect. 1, 48–52.
Kern, F., and Smith, A. (2008). Restructuring energy systems for sustainability? Energy transition policy in the Netherlands. Energy Policy 36, 4093–4104.
Kouton, J. (2020). The impact of renewable energy consumption on inclusive growth: panel data analysis in 44 African countries. Econ. Change Restruct. doi: 10.1007/s10644-020-09270-z
Kucharski, J., and Unesaki, H. (2018). An institutional analysis of the Japanese energy transition. Environ. Innovat. Soc. Trans. 29, 126–143. doi: 10.1016/j.eist.2018.07.004
Leeuwen, R., Wit, J., and Smit, G. (2017). Review of urban energy transition in the Netherlands and the role of smart energy management. Energy Convers. Manag. 150, 941–948. doi: 10.1016/j.enconman.2017.05.081
Maji, I. K. (2015). Does clean energy contribute to economic growth? Evidence from Nigeria. Energy Rep. 1, 145–150. doi: 10.1016/j.egyr.2015.06.001
Mamat, E. R., Sani, M. S., and Sudhakar, K. (2019). Renewable energy in Southeast Asia: policies and recommendations. Sci. Total Environ. 670, 1095–1102. doi: 10.1016/j.scitotenv.2019.03.273
Mohammad, A. (2019). Asian’s Energy Transition. McKinsey & Company. Available online at: https://www.mckinsey.com/featured-insights/asia-pacific/asias-energy-transition# (accessed June 10, 2020).
Ngar-yin Mah, D., Wu, Y., Jasper, I. P., and Hills, P. (2013). The role of the state in sustainable energy transitions: a case study of large smart grid demonstration projects in Japan. Energy Policy 63, 726–737. doi: 10.1016/j.enpol.2013.07.106
Osti, G. (2018). The uncertain games of energy transition in the island of Sardinia (Italy). J. Clean. Prod. 205, 681–689. doi: 10.1016/j.jclepro.2018.08.346
Ozcan, B., and Ozturk, I. (2019). Renewable energy consumption-economic growth nexus in emerging countries: a bootstrap panel causality test. Renew. Sustain. Energy Rev. 104, 30–37. doi: 10.1016/j.rser.2019.01.020
Pachauri, S. H., and Jiang, L. (2008). The household energy transition in India and China. Energy Policy 36, 4022–4035. doi: 10.1016/j.enpol.2008.06.016
Pesaran, H. (2007). A simple panel unit root test in the presence of cross-section dependence. J. Appl. Econ. 22, 265–312. doi: 10.1002/jae.951
Qiao, L. (2019). Why the Ti,e is Now for an Energy Transition in South East Asia. GWEC. Available online at: https://gwec.net/why-the-time-is-now-for-an-energy-transition-in-south-east-asia/ (accessed June 10, 2020).
Rasoulinezhad, E., and Jabalameli, F. (2019). Russia-EU gas game analysis: evidence from a new proposed trade model. Environ. Sci. Pollut. Res. 6, 24482–24488. doi: 10.1007/s11356-019-05681-2
Rasoulinezhad, E., Taghizadeh-Hesary, F., Sung, J., and Panthamit, N. (2020). Geopolitical risk and energy transition in russia: evidence from ARDL bounds testing method. Sustainability. 12:2689. doi: 10.3390/su12072689
Reddy, B. S. (2016). India’s energy system transition—Survival of the greenest. Renew. Energy 92, 293–302. doi: 10.1016/j.renene.2016.02.027
Saad, W., and Taleb, A. (2017). The causal relationship between renewable energy consumption and economic growth: evidence from Europe. Clean Technol. Environ. Policy 20, 127–136. doi: 10.1007/s10098-017-1463-5
Saboori, B., Rasoulinezhad, E., and Sung, J. (2017). The nexus of oil consumption, CO2 emissions and economic growth in China, Japan and South Korea. Environ. Sci. Pollut. Res. 24, 7436–7455. doi: 10.1007/s11356-017-8428-4
Saidi, K., and Hammam, S. (2015). The impact of CO2 emissions and economic growth on energy consumption in 58 countries. Energy Rep. 1, 62–70. doi: 10.1016/j.egyr.2015.01.003
Salim, R. A., and Shafiei, S. (2014). Urbanization and renewable and non-renewable energy consumption in OECD countries: an empirical analysis. Econ. Model. 38, 581–591. doi: 10.1016/j.econmod.2014.02.008
Sharif, A., Raza, S. A., Ozturk, I., and Afshan, S. (2019). The dynamic relationship of renewable and nonrenewable energy consumption with carbon emission: a global study with the application of heterogeneous panel estimations. Renew. Energy 133, 685–691. doi: 10.1016/j.renene.2018.10.052
Sharvini, S. R., Noor, Z., Chong, C. H., Stringer, L., and Yusuf, R. (2018). Energy consumption trends and their linkages with renewable energy policies in East and Southeast Asian countries: challenges and opportunities. Sustain. Environ. Res. 28, 257–266. doi: 10.1016/j.serj.2018.08.006
Shell Energy Transition Report, (2019). Shell Energy Transition Report. Available online at: https://www.shell.com/energy-and-innovation/the-energy-future/shell-energy-transition-report/_jcr_content/par/toptasks.stream/1524757699226/3f2ad7f01e2181c302cdc453c5642c77acb48ca3/web-shell-energy-transition-report.pdf (accessed June 10, 2020).
Shukla, A., Sudhakar, K., and Baredar, P. (2017). Renewable energy resources in South Asian countries: challenges, policy and recommendations. Resour. Efficient Technol. 3, 342–346. doi: 10.1016/j.reffit.2016.12.003
Singh, H. V., Bocca, R., Gomez, P., Dahlke, S., and Bazilian, M. (2019). The energy transitions index: an analytic framework for understanding the evolving global energy system. Energy Strategy Rev. 26:100382. doi: 10.1016/j.esr.2019.100382
Solarin, S. A., Al-Mulali, U., and Ozturk, I. (2017). Validating the environmental Kuznets curve hypothesis in India and China: the role of hydroelectricity consumption. Renew. Sustain. Energy Rev. 80, 1578–1587. doi: 10.1016/j.rser.2017.07.028
Sovacool, B. K. (2016). How long will it take? Conceptualizing the temporal dynamics of energy transitions. Energy Res. Soc. Sci. 13, 202–215. doi: 10.1016/j.erss.2015.12.020
Spencer, T., and Mathur, A. (2019). Energy Transition in Emerging and Developing Countries: Promoting the New Paradigm. G20 2019 Japan. Available online at: https://www.g20-insights.org/wp-content/uploads/2019/05/t20-japan-tf3-6-energy-transition-emerging-developing-countries-1.pdf (accessed June 11, 2020).
Stokes, L., and Breetz, H. (2018). Politics in the U.S. energy transition: case studies of solar, wind, biofuels and electric vehicles policy. Energy Policy 113, 76–86. doi: 10.1016/j.enpol.2017.10.057
Szabo, L., Kelemen, A., Mezosi, A., Pato, Z., Kacsor, E., Resch, G., et al. (2019). South East Europe electricity roadmap – modelling energy transition in the electricity sectors. Clim. Policy 19, 495–510. doi: 10.1080/14693062.2018.1532390
Taghizadeh-Hesary, F., Rasoulinezhad, E., and Kobayashi, Y. (2017). Oil price fluctuations and oil consuming sectors: an empirical analysis of Japan. Econ. Policy Energy Environ. 2, 33–51. doi: 10.3280/efe2016-002003
Taghizadeh-Hesary, F., and Yoshino, N. (2018). Assessment of the channels of transmission of oil price fluctuations to the economy. Argumenta Oeconomica 41, 5–34. doi: 10.15611/aoe.2018.2.01
Taghizadeh-Hesary, F., and Yoshino, N. (2019). The way to induce private participation in green finance and investment. Finance Res. Lett. 31, 98–103. doi: 10.1016/j.frl.2019.04.016
Taghizadeh-Hesary, F., and Yoshino, N. (2020). Sustainable solutions for green financing and investment in renewable energy projects. Energies 13:788. doi: 10.3390/en13040788
Taghizadeh-Hesary, F., Yoshino, N., Abadi, M. M. H., and Farboudmanesh, R. (2016). The response of macro variables of emerging and developed oil importers to oil price movements. J. Asia Pac. Econ. 21, 91–102. doi: 10.1080/13547860.2015.1057955
Taghizadeh-Hesary, F., Yoshino, N., Abdoli, G., and Farzinvash, A. (2013). An estimation of the impact of oil shocks on crude oil exporting economies and their trade partners. Front. Econ. China 8, 571–591. doi: 10.3868/s060-002-013-0029-3
Taghizadeh-Hesary, F., Yoshino, N., Rasoulinezhad, E., and Chang, Y. (2019). Trade linkages and transmission of oil price fluctuations. Energy Policy 133:110872. doi: 10.1016/j.enpol.2019.07.008
Teulon, F. (2014). Economic growth and energy transition: overview and review of the literature. J. Energy Dev. 40, 247–262.
United Nations Economic and Social Council, (2018). Energy Transition in Asia and the Pacific: Pathways to Ensure Access to Affordable, Reliable, Sustainable and Modern Energy for All. Available online at: https://www.unescap.org/sites/default/files/APEF2018_2.PDF (accessed June 10, 2020).
Vaillancourt, K., Bahn, O., and Levasseur, A. (2019). The role of bioenergy in low-carbon energy transition scenarios: a case study for Quebec (Canada). Renew. Sustain. Energy Rev. 102, 24–34. doi: 10.1016/j.rser.2018.11.025
Vainio, A., Varho, V., Tapio, P., Pulkka, A., and Paloniemi, R. (2019). Citizen’s images of a sustainable energy transition. Energy 183, 606–616. doi: 10.1016/j.energy.2019.06.134
Verbong, G., and Geels, F. (2007). The ongoing energy transition: lessons from a socio-technical, multi-level analysis of the Dutch electricity system (1960–2004). Energy Policy 35, 1025–1037. doi: 10.1016/j.enpol.2006.02.010
Wiseman, J. (2018). The great energy transition of the 21st century: the 2050 Zero-Carbon World Oration. Energy Res. Soc. Sci. 35, 227–232. doi: 10.1016/j.erss.2017.10.011
World Economic Forum, (2018). Fostering Effective Energy Transition. Available online at: https://www.mckinsey.com/~/media/mckinsey/industries/oil%20and%20gas/our%20insights/a%20framework%20for%20fostering%20effective%20energy%20transitions/fostering-effective-energy-transition.ashx (accessed June 10, 2020).
Yildirim, E., Aslan, A., and Ozturk, I. (2014). Energy consumption and GDP in ASEAN countries: bootstrap-corrected panel and time-series causality tests. Singapore Econ. Rev. 59:1450010. doi: 10.1142/s0217590814500106
Yuan, X., Lyu, Y., Wang, B., Liu, Q., and Wu, Q. (2018). China’s energy transition strategy at the city level: the role of renewable energy. J. Clean. Prod. 205, 980–986. doi: 10.1016/j.jclepro.2018.09.162
Zahid, T., Arshed, N., Munir, M., and Hameed, K. (2020). Role of energy consumption preferences on human development: a study of SAARC region. Econ. Change Restruct. doi: 10.1007/s10644-020-09279-4
Zhang, X., Zhang, H., Zhao, C. H., and Yuan, J. (2019). Carbon emission intensity of electricity generation in Belt and Road Initiative countries: a benchmarking analysis. Environ. Sci. Pollut. Res. 26, 15057–15068. doi: 10.1007/s11356-019-04860-5
Zou, C., Zhao, Q., Zhang, G., and Xiong, B. (2016). Energy revolution: from a fossil energy era to a new energy era. Nat. Gas Ind. B 3, 1–11. doi: 10.1016/j.ngib.2016.02.001
Appendix 1
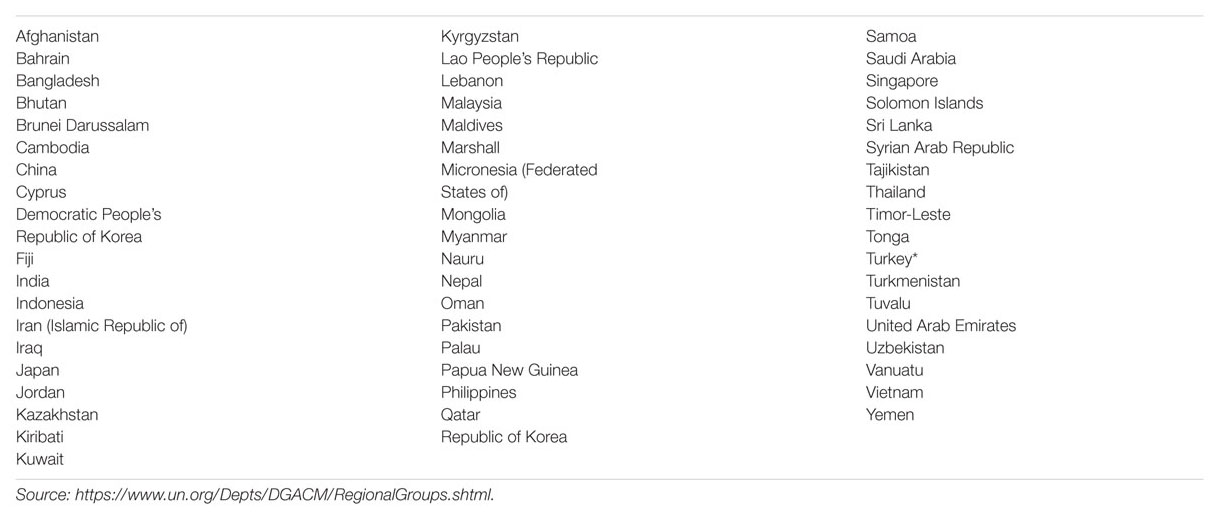
TABLE A1. Asia-Pacific group of the UN regional groups.
Appendix 2
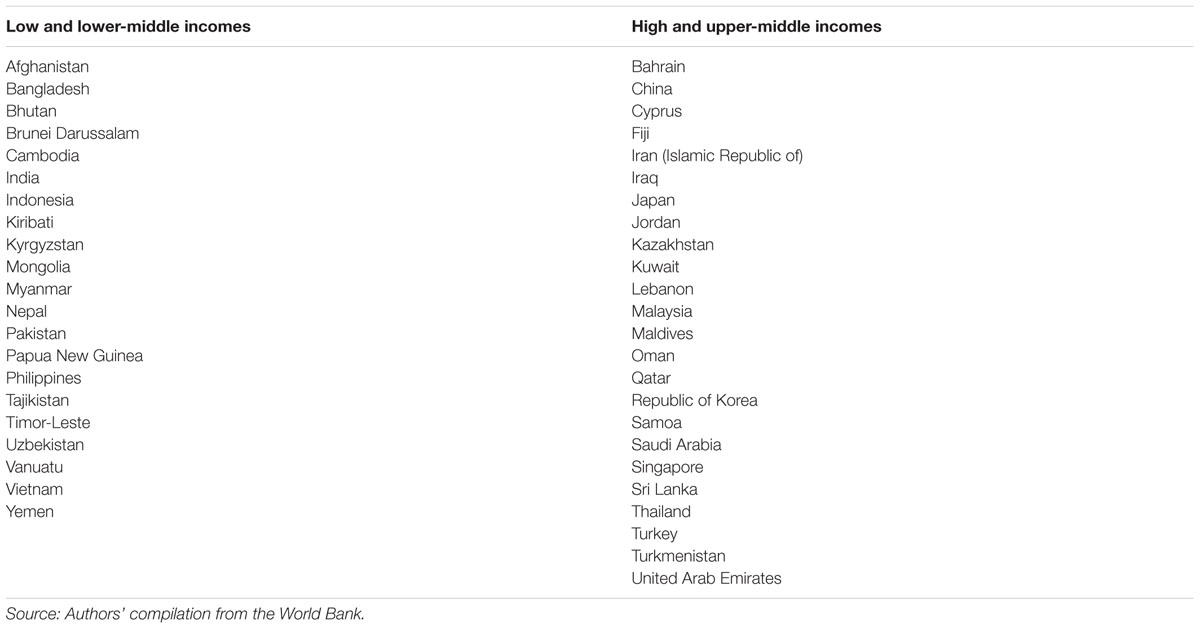
TABLE A2. Classification of samples based on income.
Keywords: energy transition, fossil fuel consumption, renewable energy consumption, asian regions, GMM estimator
Citation: Taghizadeh-Hesary F and Rasoulinezhad E (2020) Analyzing Energy Transition Patterns in Asia: Evidence From Countries With Different Income Levels. Front. Energy Res. 8:162. doi: 10.3389/fenrg.2020.00162
Received: 08 December 2019; Accepted: 25 June 2020;
Published: 16 July 2020.
Edited by:
Ian Edmund William Schindler, Université Toulouse 1 Capitole, FranceReviewed by:
Ilhan Ozturk, Ça ð University, TurkeyPeter Burgherr, Paul Scherrer Institut (PSI), Switzerland
Copyright © 2020 Taghizadeh-Hesary and Rasoulinezhad. This is an open-access article distributed under the terms of the Creative Commons Attribution License (CC BY). The use, distribution or reproduction in other forums is permitted, provided the original author(s) and the copyright owner(s) are credited and that the original publication in this journal is cited, in accordance with accepted academic practice. No use, distribution or reproduction is permitted which does not comply with these terms.
*Correspondence: Ehsan Rasoulinezhad, e.rasoulinezhad@ut.ac.ir