The Role of Solvent Polarity on Low-Temperature Methanol Synthesis Catalyzed by Cu Nanoparticles
 Christian Ahoba-Sam
 Unni Olsbye
 Klaus-Joachim Jens
- 1Department of Process, Energy and Environmental Technology, University College of Southeast Norway, Porsgrunn, Norway
- 2Department of Chemistry, University of Oslo, Oslo, Norway
Methanol syntheses at low temperature in a liquid medium present an opportunity for full syngas conversion per pass. The aim of this work was to study the role of solvents polarity on low-temperature methanol synthesis reaction using eight different aprotic polar solvents. A “once through” catalytic system, which is composed of Cu nanoparticles and sodium methoxide, was used for methanol synthesis at 100°C and 20 bar syngas pressure. Solvent polarity rather than the 7–10 nm Cu (and 30 nm Cu on SiO2) catalyst used dictated trend of syngas conversion. Diglyme with a dielectric constant (ɛ) = 7.2 gave the highest syngas conversion among the eight different solvents used. Methanol formation decreased with either increasing or decreasing solvent ɛ value of diglyme (ɛ = 7.2). To probe the observed trend, possible side reactions of methyl formate (MF), the main intermediate in the process, were studied. MF was observed to undergo two main reactions; (i) decarbonylation to form CO and MeOH and (ii) a nucleophilic substitution to form dimethyl ether and sodium formate. Decreasing polarity favored the decarbonylation side reaction while increasing polarity favored the nucleophilic substitution reaction. In conclusion, our results show that moderate polarity solvents, e.g., diglyme, favor MF hydrogenolysis and, hence, methanol formation, by retarding the other two possible side reactions.
Introduction
Methanol (MeOH) is a multipurpose molecule, which has a high potential as a C1 building block for both energy and CO2 storage (Olah, 2005). It stores both carbon and hydrogen in liquid form at ambient temperature and is readily transportable as it is liquid at ambient temperature. Methanol can be directly converted to valuable hydrocarbons, such as light olefins and gasoline, over acidic microporous materials (Olsbye et al., 2012), thereby providing an alternative to the main fossil energy sources and petrochemical feedstocks used today.
The current technology for MeOH synthesis is based on conversion of syngas (made up of CO/CO2/H2) over a Cu/ZnO/Al2O3 catalyst, operating around 250°C and 100 bar (Hansen and Højlund Nielsen, 2008; Ali et al., 2015). Although this technology is highly optimized including recycling of unreacted syngas, its thermodynamic restriction limits syngas conversion per pass coupled with operating conditions, such as temperature and pressure, to make the process capital intensive. Since syngas conversion to methanol is an exothermic reaction (Eq. 1), lower temperature is required to achieve full conversion per pass. Moreover, syngas production accounts for more than half of the total capital cost in current methanol processes (Marchionna et al., 1998). The lowest cost of syngas production is by the use of air rather than pure O2-blown autothermal reformer (Hansen and Højlund Nielsen, 2008). Full conversion per pass will allow the use of N2 diluted syngas for methanol production since recycling will not be necessary. Hence, there is a need for the development of a low-temperature approach to MeOH synthesis.
A low-temperature methanol synthesis (LTMS) reaction presents the possibility for full syngas conversion per pass around 100–120°C at relatively low pressure, for example below 50 bar (Christiansen, 1919). The LTMS reaction is known to occur in two major steps shown in Eqs 2 and 3. CO carbonylation of MeOH to methyl formate (MF) is catalyzed by alkali metal alkoxide (Eq. 2) (Christiansen, 1919; Tonner et al., 1983); hydrogenolysis of MF to MeOH, which is usually the rate-limiting step, is catalyzed by transition metal-based compounds (Turek et al., 1994; Ohyama, 1999).
Several different Cu-based catalysts have been reported to be active for LTMS reaction between 80 and 120°C. Examples of Cu-based materials reported for the hydrogenolysis reaction include CuO/Cr2O3, Raney Cu, Cu on SiO2, CuCl2, and Cu alkoxide (Ohyama and Kishida, 1998; Xing-Quan et al., 1999a; Li and Jens, 2013a,b). Prolonged milling of a physical mixture of CuO and Cr2O3, for example, correlated well with the surface area of Cu, which enhanced methanol synthesis activity (Ohyama and Kishida, 1998, 1999). Hence, the particle size of Cu plays an important role in the LTMS reaction, such that syngas conversion increases with decreasing Cu particle sizes.
The LTMS reaction is normally conducted in a “once through” approach, where the two steps are performed simultaneously. A kinetic study by Liu et al. (1988) has shown that when the two steps are performed together, the rate of MeOH formation is higher than when the two steps are separated. The reaction rates of MeOH carbonylation and its reverse rates were observed to occur at about five orders of magnitude faster than the rate of MF hydrogenolysis. A synergistic relationship between the two steps has been proposed (Li and Jens, 2013b) but the actual relationship involved is yet to be understood.
Traditionally, the LTMS reaction is performed in liquid phase in a solvent. The liquid solvent plays an important role as MeOH synthesis is exothermic and the solvent can help to dissipate excess heat generated during the process. However, aside energy dissipation, could there be other roles for the solvent to play? While most attention has been on finding the right LTMS catalyst system, little attention has been placed on the influence of solvent on the LTMS process. Quan et al. (Xing-Quan et al., 1999b) reported on the influence of solvent polarity in a Cu–Cl and Cu–Cr catalyzed LTMS reaction. They observed that as solvent polarity increased MeOH formation decreased; however, an adequate explanation was not given.
We focus on a Cu nanoparticle/alkoxide catalyst system for the LTMS reaction (Li and Jens, 2013a,b). We have recently reported that Cu nanoparticles are responsible for MeOH synthesis, including that particle aggregation led to decrease in activity. Furthermore, when Cu nanoparticles size were varied from 7 ± 2 to 21 ± 1 nm, MeOH yield were observed to decrease linearly with Cu nanoparticles sizes (Ahoba-Sam et al., 2017). In this work, we will revisit the effect of solvent on the reaction. Particularly, we have studied the influence of solvent polarity in a “once through” MeOH reaction as well as the effect on MF intermediate side reactions. Furthermore, the influence of the solvent on Cu nanoparticle synthesis will be discussed. To the best of our knowledge, this influence of solvents with different hydrocarbon chain length and polarity on Cu nanoparticles size has not been reported. In order to eliminate any influence of the different Cu particles sizes on the effect of solvent polarity, a heterogeneous Cu/SiO2 catalyst containing 30 nm Cu nanoparticles was used as a reference.
Materials and Methods
Materials and Experimental Setup
Copper (II) acetate (Cu[OAc]2, 98%), dry sodium hydride (NaH = 95%), methanol (MeOH, anhydrous 99.8%), MF (99%), sodium methoxide (NaOCH3, 95%), Cu(NO3)2⋅3H2O, Ludox HS-40 colloidal silica (40 wt% SiO2 dispersed in water), l-ascorbic acid, and the various solvents used in this work, listed in Table 1, were all purchased from Sigma Aldrich. The syngas contained 1CO: 2H2 (± 2%) and was purchased from Yara Praxair AS. All chemicals were used as received unless otherwise stated.
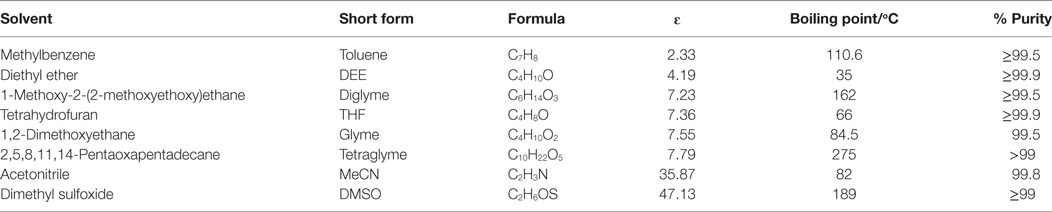
Table 1. List of Solvents used and their properties, adopted from CRC (2003–2004) and Wohlfarth (2008) (ɛ = dielectric constant).
Methanol synthesis and some of the catalyst components were prepared in a 200 ml (60 mm diameter) stainless steel high pressure type hpm-020 autoclave batch reactor (Premex Reactor AG). The reactor was equipped with a dip tube for sampling, a pressure sensor, and a thermocouple inserted into the reactor to measure internal pressure and temperature, respectively. A Nupro security valve attached to the reactor was set at 100 bar for safety. A magnetic stirrer head was attached to a stirrer equipped with oblique impeller blades (approximately 30° angle) and reaching near to the bottom of the reactor for adequate mixing. The magnetic stirrer head was externally attached to an electric BCH Servo Motor paired with a lexium 23 drive to give up to 3,000 rpm, with a high degree of precision. The reactor was heated in an oil block controlled by a Huber Ministat 230 thermostat. The internal temperature and pressure in the reactor was independently logged by a PC.
“Once Through” System
Generally, about 3.6 mmol of Cu(OAc)2,18 mmol of dry NaH, and 50 ml solvent were placed in the reactor. This was set under 1 bar N2 blanket and the mixture stirred at 3,000 rpm and heated to 100°C for 2 h. The resulting reaction mixture was cooled to ambient temperature (<30°C). After degassing the gaseous phase, 52 mmol MeOH was added and stirred at ambient temperature for 30 min to ensure that all NaH had reacted to sodium methoxide co-catalyst.
The reactor was purged with syngas and charged to about 20 bar, then stirred at 3,000 rmp and heated to 100°C. After 2 h, the reactor was cooled to about 25°C. Syngas conversion was determined by the difference in pressure between the start of reaction and after reactor cooling to room temperature (~25°C) at the end of reaction (Figure 1). The reactor was then degassed, and the liquid portion analyzed. Typically, the amount of carbon products in liquid reaction mixture after cooling as compared to the syngas pressure drop represented about 85% of the syngas consumed, assuming CO/2H2 were proportionally consumed.
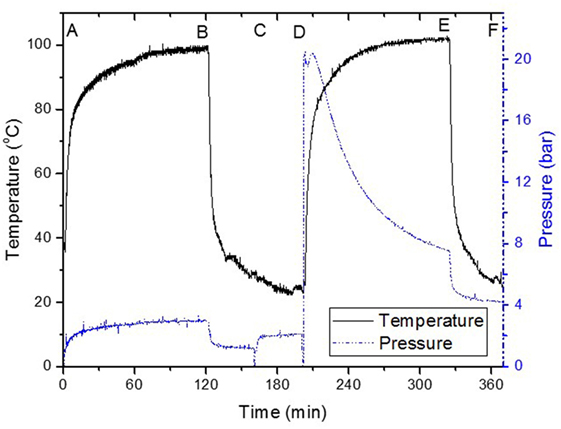
Figure 1. Typical “once through” low-temperature methanol synthesis reaction, (A) 3.6 mmol Cu(OAc)2 + 18 mmol NaH in solvent, (B) rapid cooling in 50 ml solvent, (C) addition of 52 mmol MeOH, (D) 20 bar CO/2H2 charging, (E) rapid cooling, (F) sampled for further analysis.
The liquid portion of the sample as well as the gas phase were analyzed by a gas chromatograph equipped with both liquid and gas injection valves (Agilent 7890 A). The liquid injection port was connected to a CARBOWAX 007 series 20 M column with dimensions 60 m × 320 µm × 1.2 µm and was programmed as follows; the temperature was ramped at 15°C/min from 40°C initial temperature to 250°C and held at 250°C for 3 min, at 0.47 bar (6.8 psi) constant pressure. The liquid sample was injected via an Agilent 7683B autosampler. The products were identified and quantified by an Agilent 5975 mass spectrometer detector (MSD). 0.54 mg heptane was added to each sample vial as internal standard. The gas injection valve was connected to 2.7 m Porapak Q and 1.8 m Molecular Sieve 5 Å packed columns connected to a thermal conductivity detector for analysis of permanent gases including up to C2 hydrocarbons. This set-up was connected to a 0.9 m Hayesep Q back flush column.
CuO/SiO2 Catalyst Preparation
CuO/SiO2 catalyst was prepared by similar steps as reported in Huang et al. (2008) and Xiong et al. (2011) albeit with some modifications. 100 ml of 0.5 M Cu(NO3)2⋅3H2O was prepared in a three-necked round bottomed flask. 100 ml of 1 M l-ascorbic acid was added dropwise while stirring. 49 g of 40 wt% SiO2 dispersed in water was added to the mixture. This was stirred at 100°C for 3 h. The cooled resulting mixture was then centrifuged and washed three times with distilled water and dried at 70°C in an oven. The dried particles were then calcined at 550°C for 3 h. The calcined CuO/SiO2 catalyst was used for LTMS reaction in a similar way as was done for the “once through” experiment.
MF Side Reaction Study
11 mmol sodium methoxide dissolved in 97 mmol methanol and 33 mmol MF were added to 20 ml of each solvent. The mixture was stirred under 1 bar N2 and heated to 100°C for 1 h. The cooled resulting liquid mixture was analyzed using Perkin-Elmer Spectrum One FT-IR spectrometer and Agilent GC.
Catalyst Characterization
The Cu and CuO/SiO2 catalysts were analyzed by XRD and TEM. A Bruker D8 A25 powder diffractometer using Mo Kα radiation with a wavelength, λ = 0.71076 Å and a Lynxeye detector with “hardened” chip for Mo radiation was used. Total Pattern Analysis Solution (TOPAS) software was employed for quantitative Rietveld analysis of the diffractogram. This software operates by fitting theoretical diffraction pattern to a measured diffraction pattern using non-linear least square algorithms. The samples were analyzed as slurry which was pipetted into a capillary tube with 0.5 mm internal diameter. The tube was centrifuged at 2,000 rmp for 10 min to settle the solid portion at the bottom. The capillary was mounted on the capillary spinner such that the X-ray beam measured around the capillary bottom where the particles were concentrated. The X-ray diffractogram was determined at 0.023° step/s for an interval of 15–35° 2 theta.
The TEM imaging was performed with a Joel 2100F instrument. Samples were diluted in methanol, and particles were dispersed in an ultrasound bath for 30 min. The solution was then deposited onto a carbon film on a copper grid. Cu particles were ascertained to be present using EDS and electron diffraction. Generally, particle size distributions were determined by measuring the diameters of the TEM images as the particles sizes using MATLAB assuming that the Cu particles were circular droplets. Typically, an average of 30-particle diameters ± SD from the TEM images for each sample was used for particle size determination.
Results and Discussion
Typical “Once Through” LTMS
Figure 1 shows the steps involved in the LTMS reaction using diglyme as solvent. Typically, Cu nanoparticles were made by hydride reduction of Cu2+ (Cu(AOc)2) in steps A and B with NaH at 100°C (Glavee et al., 1994). Addition of MeOH at step C led to the formation of NaOCH3 (sodium methoxide) and H2 (g) which resulted in an increase in pressure. Syngas was added at step D, where after an induction period due to increase in temperature, pressure declined rapidly with time. After 2 h (E), the reaction was stopped by cooling to about 25°C at F. We deliberately stopped the reaction after 2 h and so the activity of the catalyst was not optimized for determining TOF or TON. Moreover, our batch reactor system did not allow for time on steam analysis of individual products except the changes in pressure and temperature, which were continuously monitored during the reaction. The pressure drop represented 89% syngas conversion. The liquid products composition after 2 h showed 96 and 4% C selectivity to MeOH and MF, respectively.
The slurry was further analyzed by XRD to determine oxidation state and crystallite size of the Cu catalyst involved in the LTMS reaction. Figure 2 shows the X-ray diffractogram of the slurry at steps B, C and E as illustrated in Figure 1. The XRD samples were taken right after steps B, C, and D were completed, respectively. The diffractogram after step B showed mainly Cu2O and NaH phases, while that after step C showed Cu2O and Cu0 phases [X-ray powder diffraction files referenced from Neuburger (1930), Wyckoff (1963), Smura et al. (2011)]. The diffractogram after E showed predominantly Cu0 oxidation state.
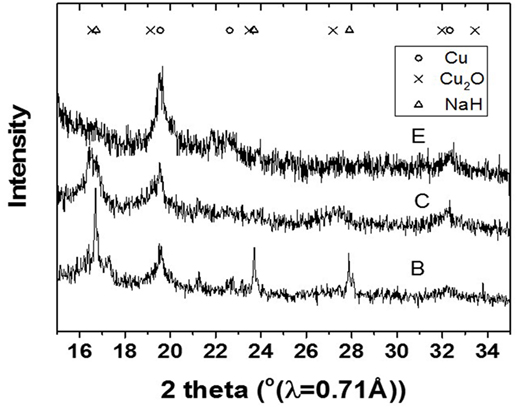
Figure 2. X-ray diffractogram of the slurry after the steps B, C, and D in Figure 1.
This indicated that reduction of the Cu2+ precursor took place during the process by hydride reduction during step B. Moreover, all NaH was reacted upon the addition of methanol since no NaH pattern was observed in the diffraction at step C. The steps C to D resulted in the pressure rise illustrated in Figure 1, as H2 was released in the process. Furthermore, the LTMS reaction under highly reducing environment of CO and H2 led to Cu0 oxidation state at E. The average Cu crystallite sizes were estimated by Reitveldt analysis. The slurry at step C was composed of about 50/50% Cu0/Cu2O with average crystallite sizes of about 7.5 ± 0.7 nm. After the LTMS reaction, the Cu0 crystallite sizes at step E was 9.5 ± 0.9 nm. This showed about 2 nm increase in the average crystallite size of the Cu after methanol synthesis occurred. Figure 3 shows TEM image of the Cu particles. The Cu particle size was about 10 ± 3 nm. Electron diffraction also confirmed [111] and [311] Cu0 planes present.
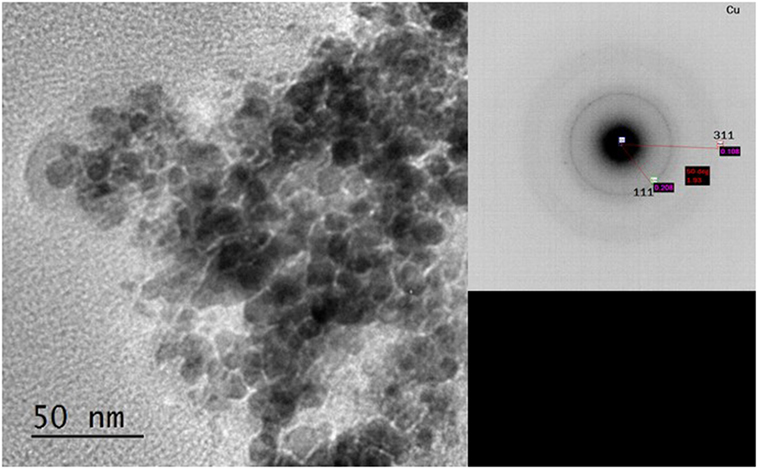
Figure 3. TEM image and electron diffraction of Cu from step F with 10 ± 2 nm particles sizes and [111] and [311] Cu0 planes.
Solvent Variation in “Once Through” Synthesis
As indicated in Table 1, different aprotic solvents were employed to study the influence of solvent polarity on the LTMS reaction. Aprotic solvents were used because of the presence of NaH, which can react easily with protons. Moreover, the NaOCH3 co-catalyst may be consumed in the presence of protic solvent. Five out of the chosen solvents were ethers with different chain lengths and polarity.
Figure 4 shows the activity of the catalyst system in the “once through” reaction plotted versus dielectric constant (ɛ) of the solvents. 51% syngas conversion was observed when diethyl ether (DEE) was used as solvent with the least ɛ = 4.19. In diglyme with ɛ = 7.23, 89% syngas conversion was observed. Then after, syngas conversion decreased to 85, 80, and 74% in tetrahydrofuran (THF), glyme, and tetraglyme, respectively, following the order of slight decreasing in ɛ. Thereafter, syngas conversion sharply declined to 30 and 14% in acetonitrile (MeCN) (ɛ = 36) and dimethyl sulfoxide (DMSO) (ɛ = 47), respectively. Despite the more noticeable changes in the syngas conversion in the various solvents, selectivity to MeOH was always >90% indicating that selectivity was barely affected by the solvents’ dielectric constant or polarity.
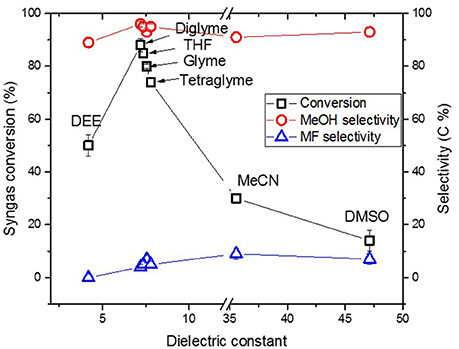
Figure 4. Syngas conversion and selectivity versus dielectric constant of solvent in the “once through” Cu nanoparticles catalyzed reaction.
The chosen ether solvents differ in polarity (represented by their ɛ), boiling point, and chain length (or molar mass) which is shown in Table 1 [from CRC (2003–2004), Wohlfarth (2008)]. The dielectric constant is known to be proportional to the solvents polarity (Rabaron et al., 1993). Among these properties, the observed syngas conversion pattern followed the ɛ of the solvents with the optimum around ɛ = 7.2 for diglyme. Notably, slight differences in the ɛ with regards to diglyme, THF, glyme, and tetraglyme depicting the slight differences in their polarity, such that syngas conversion followed the order diglyme > THF > glyme > tetraglyme. On the other hand, the order of increasing solvent chain length as well as boiling point is THF < glyme < dilgyme < tetraglyme. Clearly, the syngas conversion did neither follow solvent’s chain length nor their boiling point, but preferred less polar solvents among these ether solvents.
The solvent polarity range was extended beyond the ethers, such as MeCN and DMSO with ɛ = 36 and 47, respectively. These two, which are more polar than diglyme showed a very sharp decline in syngas conversion. Solvents with higher polarity than that of diglyme led to even lower MeOH formation. On the contrary, DEE with lower ɛ (ɛ = 4.2) than diglyme also showed lower syngas conversion, suggesting that lower polar solvents than diglyme may also lead to lower amount MeOH formation in LTMS reactions. This, therefore, suggest that solvent polarity plays an important role in the “once through” LTMS reaction such that solvents with similar polarity with diglyme showed higher MeOH formation.
Solvent Effect on Cu Nanoparticles in the “Once Through” Reaction
Copper nanoparticles were synthesized as described in Section “Typical “Once Through” Low Temperature Methanol Synthesis” for the “once through” catalyst. However, since different solvents were involved, there is a possibility that nucleation and crystallite growth of Cu nanoparticles will differ in the different reaction media. It is also important to note that Cu nanoparticles size plays an important role in MF hydrogenolysis (Ohyama and Kishida, 1998). This section, therefore, focuses on the effect of the different chosen solvents on Cu nanoparticles size.
Figure 5 shows the slurry X-ray diffractogram of the different solvents after LTMS reaction. Generally, a Cu0 phase was predominately observed but with varying reflex intensity. The broadness of the reflexes confirm formation of nanoparticles in all employed solvents. Figure 6 shows the Cu nanoparticle TEM images of the different solvents. Figure 7 shows a summary of Figures 5 and 6 in relation to the ɛ value of the solvents. Generally, the Cu crystallites and particles sizes in each particular solvent were about the same, considering the fact that the XRD measures the bulk average while the TEM images only show a few particles. On average, Cu particles in all ether solvents were within 9–10 nm, while in MeCN and DMSO solvents approximately 7 nm particle size was observed.
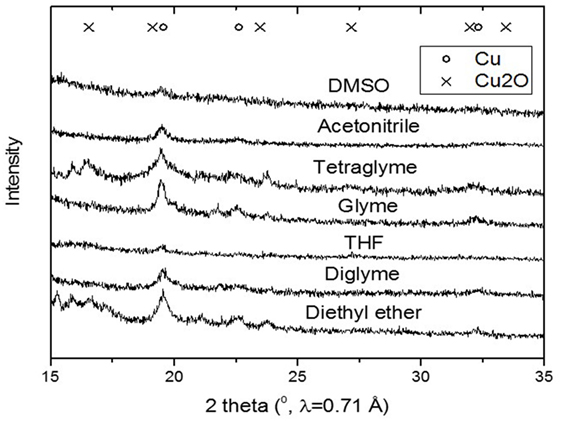
Figure 5. X-ray diffractogram of the slurry after low-temperature methanol synthesis reaction for the different polar solvents.
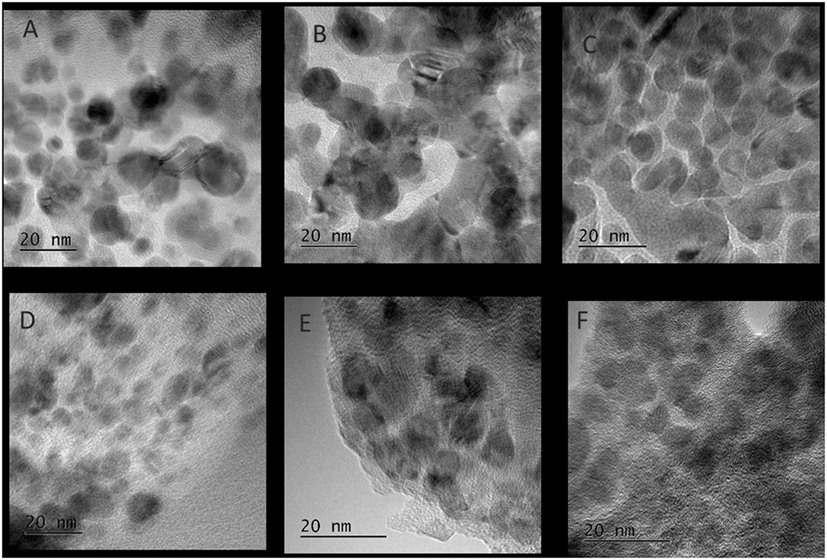
Figure 6. TEM images of Cu nanoparticles after low-temperature methanol synthesis reaction in the different solvents, (A) diethyl ether, (B) glyme, (C) tetraglyme, (D) tetrahydrofuran, (E) acetonitrile, (F) dimethyl sulfoxide.
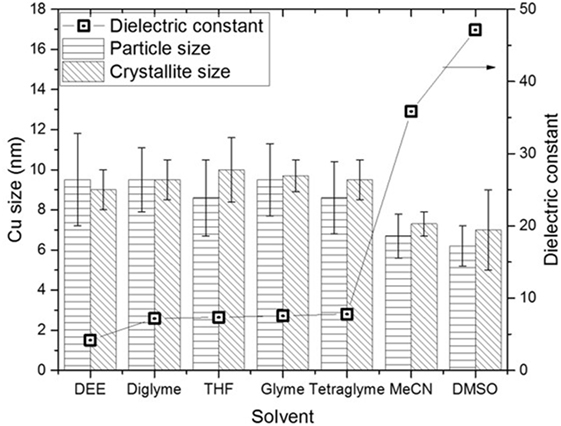
Figure 7. Comparison of the Cu particles sizes and dielectric constants in the different solvents after low-temperature methanol synthesis reaction.
Cu particles sizes do not seem to have been influenced by the different ether solvents. Considering that, the ethers have different chain lengths as well as different amounts of oxygen per mole capable of forming chelates around a Cu atom, one could expect the particle size to vary with chain length. However, this was not observed which could be due to the fact that, the excess amount of solvents used might have provided enough oxygen for dative bonding if chelate formation was necessary in tuning the particles sizes.
Cu nanoparticles sizes prepared in the non-ether solvents were smaller as compared to those made in ether solvents. DMSO with higher polarity (ɛ = 47) showed smaller Cu particles sizes than was observed for MeCN (ɛ = 36). The difference of the ether solvents ɛ values were relatively small (ɛ = 4.2–7.8) as compared to DMSO and MeCN. There is a possibility that the polarity difference in the solvents played a subtle role in the formation of Cu nanoparticles size, particularly when the polarity difference is larger. It has been reported that nucleation slows down with solvents polarity (Zhao et al., 2004; Wei et al., 2008). The consequence of slower rate of nucleation is that, larger crystals may be formed if longer growth time (>24 h) is allowed. However, we observed the opposite, which might be due to an inadequate aging time of 2 h in our system.
The use of solvents with higher polarity in the LTMS reaction, despite generating smaller Cu nanoparticles, led to the least amount of MeOH formation. However, it is expected that the smaller the Cu nanoparticles the faster the hydrogenolysis of MF which is usually the limiting step in the LTMS reaction. Smaller Cu nanoparticles should, therefore, lead to higher MeOH formation. This on the contrary was not the case when solvents polarity was varied, suggesting that the solvent polarity was the bottleneck in our case rather than just the Cu particles sizes.
Solvent Variation using CuO/SiO2 Catalyst
In Sections “Solvent Variation in “Once Through” Synthesis” and “Solvent Effect on Cu Nanoparticles in the “Once Through” Reaction,” the lowest methanol formation was observed in the more polar solvents despite the fact that the smallest Cu nanoparticles were made in these solvents. The two main components that varied before LTMS reaction were the type of solvent used and slight changes in Cu NP sizes. A dry CuO/SiO2 catalyst with larger particle size as compared to the 7–10 nm Cu NP slurry used above was prepared and used for the LTMS reaction as a control. This will help to differentiate between the influence of Cu nanoparticles size as against that of the solvents, as solvent polarity will be varied but with the same CuO/SiO2 catalyst size.
Figure 8 shows the XRD diffractogram of the calcined CuO/SiO2 catalyst. Crystalline CuO and amorphous SiO2 were observed [powder diffraction files referenced from Barth (1932), Tunell et al. (1935)]. The line broadening analysis indicated that, the CuO crystallite size was 30 ± 5 nm. Figure 9 shows the TEM image and an inserted electron diffraction diagram of the CuO/SiO2 catalyst. The TEM showed a good dispersion of the crystalline CuO on the SiO2 support. The electron diffraction showed mainly [110], [002], [11-2], and [112] planes of CuO.
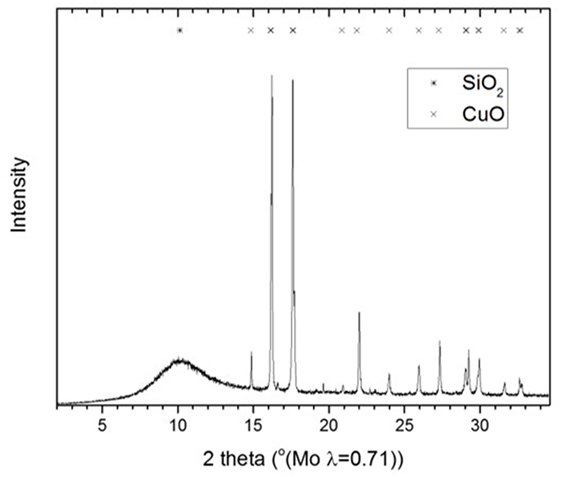
Figure 8. X-ray diffractogram of calcined CuO/SiO2 catalyst.
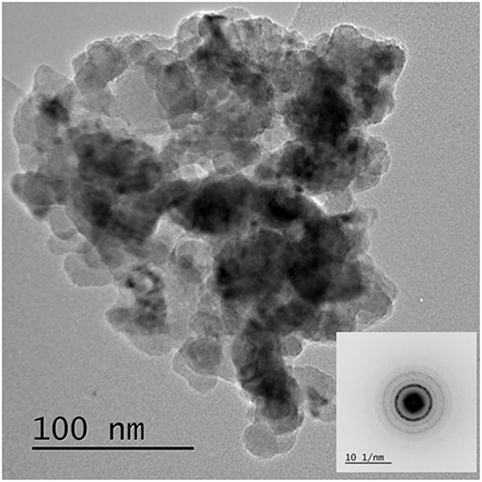
Figure 9. TEM image and an inserted electron diffraction of the calcined CuO/SiO2 catalyst.
The CuO/SiO2 catalyst was used for methanol synthesis, in a similar way to Section “Typical “Once Through” Low Temperature Methanol Synthesis,” except that, the very first step for making Cu nanoparticles (Figures 1A,B) was omitted since the synthesized CuO/SiO2 catalyst was used. Figure 10 shows catalyst activity versus ɛ value for solvents of various polarity. Syngas conversion increased from 28 and 39%, respectively, in toluene and DEE, to 76% in diglyme but slightly decreased to 74% in THF and then sharply to 20 and 12% in MeCN and DMSO, respectively. Despite the large differences in syngas conversion, selectivity to methanol remained ≥90% and MF ≤10% in the different solvent.
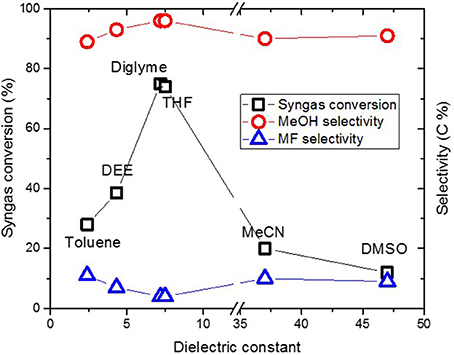
Figure 10. Syngas conversion and selectivity versus dielectric constant of solvent in the CuO/SiO2 catalyzed reaction.
Generally, syngas conversions were higher in the “once through” system for the Cu nanoparticles slurry as compared to the CuO/SiO2 catalyst system. This is not surprising since the Cu catalysts involved in the two scenarios were different in support material and particles sizes. The CuO in the CuO/SiO2 catalyst was about 30 nm compared with the ≤10 nm Cu particles made in the “once through” system. Moreover, our earlier report showed that within 7–21 nm sizes, methanol formation decreased with Cu particle size (Ahoba-Sam et al., 2017). Therefore, the observed lower syngas conversion can be related to the larger Cu particle size. Despite this, selectivity to MeOH and MF as well as the trend in syngas conversion followed the same path as was observed in the Figure 4 for the “once through” system. A similar trend has been reported for a CuO/Cr2O3 system with varying solvent polarity (Xing-Quan et al., 1999b). Therefore, solvent polarity plays an important role in LTMS reaction, such that solvents with ɛ values around 7.2 appear to give improved MeOH synthesis results.
The observed effect of solvent polarity on the LTMS reaction needs an explanation. What is the exact role of polarity in the LTMS reaction? Syngas is known to be less soluble in polar solvent compared to apolar solvents (Vogelpohl et al., 2014). This is so because strong interaction exists between polar molecules, which makes it difficult for relatively non-polar H2 and CO to enter. However, while solubility cannot be totally ruled out in gas–liquid systems, the solubility explanation may only hold for solvents with ɛ values >7. Syngas conversion decreased with decreasing solvents’ polarity in ɛ = 4.2 and 2.3 in DEE and toluene systems, respectively. Our recent results showed that increasing Cu nanoparticles sizes from 7 to 21 nm led to decrease in both conversion and selectivity to MeOH in diglyme. This coupled with similar trends observed for the different Cu sources suggests that hydrogenation was not the main step responsible for the above observation. The Section “Influence of Solvent Polarity on Side Reactions of the LTMS Reaction,”therefore, seeks to address the possible side reactions, which could limit the LTMS reaction in the different solvents.
Influence of Solvent Polarity on Side Reactions of the LTMS Reaction
The LTMS reaction involves two major steps, carbonylation and hydrogenolysis of MF (illustrated in Eqs 2 and 3, respectively). However, the main intermediate product, MF can also undergo possible side reactions as shown in Eqs 4 and 5. It has been reported that the formation of MF from MeOH and CO (Eq. 2) is highly reversible (Christiansen, 1926; Liu et al., 1988). Moreover, it has also been observed that MF can react with NaOCH3, to form dimethyl ether (DME) and NaOOCH (sodium formate) (Christiansen, 1926; Jogunola et al., 2012). Therefore, during the LTMS reaction, if MF hydrogenolysis is not fast enough, MF can either decarboxylate back to CO and MeOH and/or react with NaOCH3 to give DME and NaOOCH.
The influence of solvents’ polarity on the possible side reactions involved in the LTMS reaction was then studied. This was done by heating MF in the presence of NaOCH3 in a predetermined solvent under 1 bar N2 gas. The IR spectrum of the resulting liquid mixture is shown in Figure 11. The gray lines in Figure 11 (B–G) represent the pure solvent while the black lines represent the reaction mixture. These were compared with MeOH, MF, and NaOOCH shown in Figure 11A. Typically, bands observed at 2,830, 2,770, 1,650, 1,570, 1,360, and 770 cm−1 were not observed in pure solvent or in methanol and MF. These bands were typical NaOOCH bands when compared with standard spectra from NIST data base (Stein, 2016). The NaOOCH bands appeared in all the spectra of the different solvents, which indicated that formate was formed in all the different solvents.
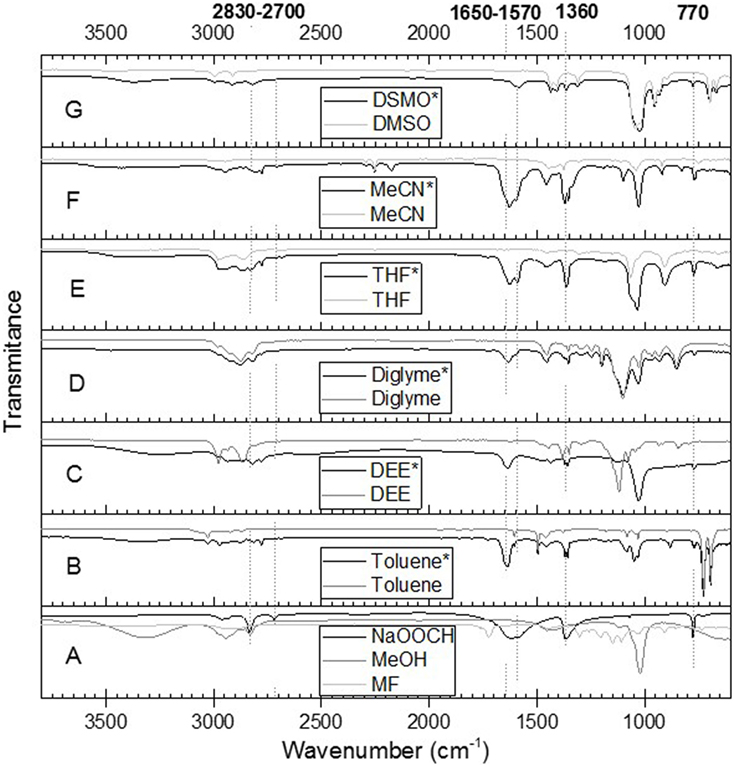
Figure 11. ATR-IR spectra of solvent (B–G in gray), and reaction mixture (B–G, black with *). The spectra A is for MeOH, methyl formate, and NaOOCH. The NaOOCH (in black) was adopted from NIST data base (Stein, 2016).
Table 2 shows the rise in pressure and relative amount of CO released for the different solvents tested. Although DME and methanol were present in the gas phase, it was difficult to separate them on the Porapak Q column as their peaks superimposed on each other leading to a shoulder peak. Therefore, only N2 and CO, which were well separated on the mol sieve column, were quantified for this analysis. The CO equivalence in these chromatograms should be regarded as a relative measure to N2 and not as an absolute measure. The amount of CO released generally decreased with increasing solvent polarity.
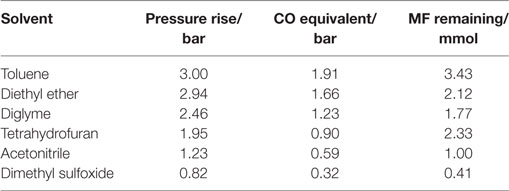
Table 2. Solvent effect on side reaction, CO equivalent = CO/(CO + N2) × Pressure rise, CO and N2 was determined from gas analysis while the MF was determined from liquid analysis.
The amount of MF drastically decreased from 33 mmol initial amount to less than 4 mmol in the side reaction test for all solvents. Trace amounts of DME were observed in the liquid sample analysis (using the MSD) of all solvents. MF was, therefore, involved for all solvents in the two reactions; (i) decarbonylation into CO and MeOH and (ii) nucleophilic substitution to form DME and NaOOCH, as illustrated in Eqs 4 and 5. Although DME and NaOOCH were observed, we were not able to quantify them. However, assuming that decarbonylation and nucleophilic substitution are the main MF side reactions occurring and considering the high MF reactivity in the solvent tests, the relative amount of CO released in these reactions can be used to determine which of the two pathways is predominant for the different solvents.
The released CO amount decreased with increasing polarity of the solvent. This suggested that decarboxylation was enhanced in less polar solvents. The decreasing amount of CO released with increased solvent polarity suggested that the nucleophilic substitution pathway is enhanced with increased solvent polarity which appears logical since this reaction pathway involves ionic salt formation which is expected to be stabilized by polar rather than non-polar solvents (Parker, 1969).
Maximum syngas conversion was observed for a solvent ɛ value around 7.2 (see Solvent Variation in “Once Through” Synthesis and Solvent Variation using CuO/SiO2 Catalyst). Considering the nucleophilic substitution pathway to be favored by polar solvents and the decarbonylation pathway to be favored by low polarity solvents, a relatively moderate polar solvent is a good compromise to supress unwanted side reactions, maximizing the MF hydrogenolysis pathway. The above results indicate that the different MF reaction pathways in the LTMS reaction, i.e., hydrogenolysis, decarboxylation, and nucleophilic substitution, may have comparable activation barriers. Changing the polarity might influence the path which intermediates are better favored by the polarity of the solvent. Hence, MF is a transient intermediate, which will always be present at relatively low concentration in the reaction mixture.
NaOOCH formation is detrimental to the overall catalytic cycle because NaOCH3, the co-catalyst, is consumed by this reaction. Previously, we observed Cu catalyst agglomeration to be a major source of LTMS reaction deactivation as Cu particles growth corresponded to a lower activity. Our current study indicates that the nucleophilic substitution side reaction is also a potential source of LTMS reaction deactivation which will increase in importance especially in more polar solvents.
Conclusion
The liquid-phase LTMS reaction is influenced by solvent polarity. Solvents with moderate polarity similar to diglyme with ɛ = 7.2 give highest syngas conversion among eight different selected solvents covering a wide range of polarity. MeOH formation increased with increasing ɛ value until that of diglyme (7.2) and decreased thereafter with further increase of the ɛ value. This trend was independent of Cu catalyst nanoparticle size. Our results indicated that MF, the main intermediate LTMS reaction product undergoes two side reactions (i) decarbonylation to form CO and MeOH and (ii) a nucleophilic substitution reaction to form DME and sodium formate. Solvent polarity distinguishes between these side reactions such that decarbonylation is favored as solvent polarity decreases while nucleophilic substitution is favored as solvent polarity increases. Our results show that moderate polarity solvents, e.g., diglyme favor MF hydrogenolysis by retarding the other two possible side reactions.
Safety Warning
Large amount of compressed CO and H2 gas were used, with potential poisoning and flammable hazards, respectively, and hence, the appropriate equipment and detectors must be used to avoid unwanted releases. The solvents used especially diglyme and glyme are toxic and must be handled with care.
Author Contributions
CA-S was involved in conception and design of experiment, acquisition of data, and analysis and interpretation of data for this work. He drafted the work, approved the final version of the work to be submitted and agreed to be accountable for all aspects of the work in ensuring that questions related to accuracy or integrity of any part of the work are appropriately investigated and solved. UO was involved in conception of experiment and interpretation of data for this work. She approved the final version of the work to be submitted and agreed to be accountable for all aspects of the work in ensuring that questions related to accuracy or integrity of any part of the work are appropriately investigated and solved. K-JJ was involved in conception and design of experiment and analysis and interpretation of data for this work. He was involved in revising the draft of the work and approved the final version of the work to be submitted and agreed to be accountable for all aspects of the work in ensuring that questions related to accuracy or integrity of any part of the work are appropriately investigated and solved.
Conflict of Interest Statement
The authors declare that the research was conducted in the absence of any commercial or financial relationships that could be construed as a potential conflict of interest.
Acknowledgments
This work is funded by the Research Council of Norway, NFR project number 228157/O70. The authors acknowledge the use of RECX (the Norwegian national resource center for X-ray diffraction and scattering) and NorTEM (the Norwegian Center for Transmission Electron Microscopy) both in Oslo.
References
Ahoba-Sam, C., Olsbye, U., and Jens, K.-J. (2017). Low temperature methanol synthesis catalyzed by copper nanoparticles. Catal. Today. doi:10.1016/j.cattod.2017.06.038
Ali, K. A., Abdullah, A. Z., and Mohamed, A. R. (2015). Recent development in catalytic technologies for methanol synthesis from renewable sources: a critical review. Renew. Sustain. Energ. Rev. 44, 508–518. doi:10.1016/j.rser.2015.01.010
Barth, T. F. W. (1932). The cristobalite structures. I. High-cristobalite. Am. J. Sci. 23, 350–356. doi:10.2475/ajs.s5-23.136.350
Christiansen, J. A. (1926). LIV.-The equilibrium between methyl formate and methyl alcohol, and some related equilibria. J. Chem. Soc. 129, 413–421. doi:10.1039/JR9262900413
CRC. (2003–2004). “Physical constants of organic compounds,” in CRC Handbook of Chemistry and Physics, 84th edn, ed. D. R. Lide (Boca Raton, FL: CRC Press), 3p, 4–547. Available at: http://www.znu.ac.ir/data/members/rasoulifard_mohammad/crc.pdf
Glavee, G. N., Klabunde, K. J., Sorensen, C. M., and Hadjipanayis, G. C. (1994). Borohydride reduction of nickel and copper ions in aqueous and nonaqueous media. Controllable chemistry leading to nanoscale metal and metal boride particles. Langmuir 10, 4726–4730. doi:10.1021/la00024a055
Hansen, J. B., and Højlund Nielsen, P. E. (2008). “Methanol synthesis,” in Handbook of Heterogeneous Catalysis, eds G. Ertl, H. Knozinger, F. Schuth, and J. Weitkamp (Wiley-VCH Verlag GmbH & Co. KGaA, Haldor Topsoe: Kgs. Lyngby), 2920–2949.
Huang, Z., Cui, F., Kang, H., Chen, J., Zhang, X., and Xia, C. (2008). Highly dispersed silica-supported copper nanoparticles prepared by precipitation−gel method: a simple but efficient and stable catalyst for glycerol hydrogenolysis. Chem. Mater. 20, 5090–5099. doi:10.1021/cm8006233
Jogunola, O., Salmi, T., Kangas, M., and Mikkola, J. P. (2012). Determination of the kinetics and mechanism of methyl formate synthesis in the presence of a homogeneous catalyst. Chem. Eng. J. 203, 469–479. doi:10.1016/j.cej.2012.06.085
Li, B., and Jens, K.-J. (2013a). Liquid-phase low-temperature and low-pressure methanol synthesis catalyzed by a Raney copper-alkoxide system. Top. Catal. 56, 725–729. doi:10.1007/s11244-013-0031-4
Li, B., and Jens, K.-J. (2013b). Low-temperature and low-pressure methanol synthesis in the liquid phase catalyzed by copper alkoxide systems. Ind. Eng. Chem. Res. 53, 1735–1740. doi:10.1021/ie401966w
Liu, Z., Tierney, J. W., Shah, Y. T., and Wender, I. (1988). Kinetics of two-step methanol synthesis in the slurry phase. Fuel Process. Technol. 18, 185–199. doi:10.1016/0378-3820(88)90095-1
Marchionna, M., Di Girolamo, M., Tagliabue, L., Spangler, M. J., and Fleisch, T. H. (1998). “A review of low temperature methanol synthesis,” in Studies in Surface Science and Catalysis, eds A. Parmaliana and F. Arena (Amsterdam: Elsevier), 539–544.
Neuburger, M. C. (1930). Praezisionsmessung der Gitterkonstante von Cuprooxyd Cu2O. Zeitschrift fuer Physik 67, 845–850. doi:10.1007/BF01390765
Ohyama, S. (1999). Low-temperature methanol synthesis in catalytic systems composed of nickel compounds and alkali alkoxides in liquid phases. Appl. Catal. A Gen. 180, 217–225. doi:10.1016/S0926-860X(98)00338-X
Ohyama, S., and Kishida, H. (1998). Physical mixture of CuO and Cr2O3 as an active catalyst component for low-temperature methanol synthesis via methyl formate. Appl. Catal. A Gen. 172, 241–247. doi:10.1016/S0926-860X(98)00135-5
Ohyama, S., and Kishida, H. (1999). XRD, HRTEM and XAFS studies on structural transformation by milling in a mixture of CuO and Cr2O3 as an active catalyst component for low-temperature methanol synthesis. Appl. Catal. A Gen. 184, 239–248. doi:10.1016/S0926-860X(99)00111-8
Olah, G. A. (2005). Beyond oil and gas: the methanol economy. Angew. Chem. Int. Ed. 44, 2636–2639. doi:10.1002/anie.200462121
Olsbye, U., Svelle, S., Bjørgen, M., Beato, P., Janssens, T. V. W., Joensen, F., et al. (2012). Conversion of methanol to hydrocarbons: how zeolite cavity and pore size controls product selectivity. Angew. Chem. Int. Ed. 51, 5810–5831. doi:10.1002/anie.201103657
Parker, A. J. (1969). Protic-dipolar aprotic solvent effects on rates of bimolecular reactions. Chem. Rev. 69, 1–32. doi:10.1021/cr60257a001
Rabaron, A., Cavé, G., Puisieux, F., and Seiller, M. (1993). Physical methods for measurement of the HLB of ether and ester non-ionic surface-active agents: H-NMR and dielectric constant. Int. J. Pharm. 99, 29–36. doi:10.1016/0378-5173(93)90319-B
Smura, C. F., Parker, D. R., Zbiri, M., Johnson, M. R., Gál, Z. A., and Clarke, S. J. (2011). High-spin cobalt(II) ions in square planar coordination: structures and magnetism of the oxysulfides Sr2CoO2Cu2S2 and Ba2CoO2Cu2S2 and their solid solution. J. Am. Chem. Soc. 133, 2691–2705. doi:10.1021/ja109553u
Stein, S. E. (2016). “Infrared spectra by NIST mass spec data center,” in NIST Chemistry WebBook, NIST Standard Reference Database Number 69, eds P. J. Linstrom and W. G. Mallard (Gaithersburg, MD: National Institute of Standards and Technology), 20899. Available at: http://webbook.nist.gov
Tonner, S. P., Trimm, D. L., Wainwright, M. S., and Cant, N. W. (1983). The base-catalysed carbonylation of higher alcohols. J. Mol. Catal. 18, 215–222. doi:10.1016/0304-5102(83)80122-9
Tunell, G., Posnjak, E., and Ksanda, C. J. (1935). Geometrical and optical properties, and crystal structure of tenorite. Zeitschrift fuer Kristallographie, Kristallgeometrie, Kristallphysik, Kristallchemie 90, 120–142.
Turek, T., Trimm, D. L., and Cant, N. W. (1994). The catalytic hydrogenolysis of esters to alcohols. Catal. Rev. 36, 645–683. doi:10.1080/01614949408013931
Vogelpohl, C., Brandenbusch, C., and Sadowski, G. (2014). High-pressure gas solubility in multicomponent solvent systems for hydroformylation. Part II: syngas solubility. J. Supercrit. Fluids 88, 74–84. doi:10.1016/j.supflu.2014.01.017
Wei, X., Xu, G., Ren, Z., Shen, G., and Han, G. (2008). Room-temperature synthesis of BaTiO3 nanoparticles in large batches. J. Am. Ceram. Soc. 91, 3774–3780. doi:10.1111/j.1551-2916.2008.02695.x
Wohlfarth, C. (2008). “Static dielectric constants of pure liquids and binary liquid mixtures,” in Supplement to IV/6, ed. M. D. Lechner (Berlin, Heidelberg: Springer).
Xing-Quan, L., Yu-Tang, W., Shi-Zhong, L., Zing-Chun, Y., Zhao-Xia, L., Shun-Fen, L., et al. (1999a). Concurrent synthesis of methanol and methyl formate catalysed by copper-based catalysts I. Influences of temperature and pressure. J. Nat. Gas Chem. 8, 115–200.
Xing-Quan, L., Yu-Tang, W., Shi-Zhong, L., Zing-Chun, Y., Zhao-Xia, L., Shun-Fen, L., et al. (1999b). Concurrent synthesis of methanol and methyl formate catalysed by copper-based catalysts II. Influences of solvents and H2/CO mole ratios. J. Nat. Gas Chem. 8, 203–210.
Xiong, J., Wang, Y., Xue, Q., and Wu, X. (2011). Synthesis of highly stable dispersions of nanosized copper particles using l-ascorbic acid. Green Chem. 13, 900–904. doi:10.1039/c0gc00772b
Keywords: methanol synthesis, low temperature, solvent polarity, “once through” reaction, Cu, nanoparticle size, syngas conversion
Citation: Ahoba-Sam C, Olsbye U and Jens K-J (2017) The Role of Solvent Polarity on Low-Temperature Methanol Synthesis Catalyzed by Cu Nanoparticles. Front. Energy Res. 5:15. doi: 10.3389/fenrg.2017.00015
Received: 31 January 2017; Accepted: 19 June 2017;
Published: 14 July 2017
Edited by:
Peter Styring, University of Sheffield, United KingdomReviewed by:
Antoine Buchard, University of Bath, United KingdomPeter P. Edwards, University of Oxford, United Kingdom
Joan Ramón Morante, Institut de Recerca de l’Energia de Catalunya, Spain
Copyright: © 2017 Ahoba-Sam, Olsbye and Jens. This is an open-access article distributed under the terms of the Creative Commons Attribution License (CC BY). The use, distribution or reproduction in other forums is permitted, provided the original author(s) or licensor are credited and that the original publication in this journal is cited, in accordance with accepted academic practice. No use, distribution or reproduction is permitted which does not comply with these terms.
*Correspondence: Klaus-Joachim Jens, Klaus.J.Jens@usn.no