 Xuyan Zou1†
 Suna Ye
 Yao Tan
- 1Changsha Aier Eye Hospital, Aier Eye Hospital Group, Changsha, China
- 2Senzhen Aier Eye Hospital, Jinan University, Shenzhen, China
- 3Department of Ophthalmology, The Third Xiangya Hospital, Central South University, Changsha, China
- 4Postdoctoral Station of Clinical Medicine, The Third Xiangya Hospital, Central South University, Changsha, China
Background: Diabetic retinopathy (DR), a leading cause of vision loss, has limited options for effective prevention and treatment. This study aims to utilize genomics and proteomics data to identify potential drug targets for DR.
Methods: We utilized plasma protein quantitative trait loci data from the Atherosclerosis Risk in Communities Study and the Icelandic Decoding Genetics Study for discovery and replication, respectively. Genetic associations with DR, including its subtypes, were derived from the FinnGen study. Mendelian Randomization (MR) analysis estimated associations between protein levels and DR risk, complemented by colocalization analysis to examine shared causal variants.
Results: Our MR analysis identified significant associations of specific plasma proteins with DR and proliferative DR (PDR). Elevated genetically predicted levels of WARS (OR = 1.16; 95% CI = 0.095-0.208, FDR = 1.31×10⁻⁴) and SIRPG (OR = 1.15; 95% CI = 0.071-0.201, FDR = 1.46×10⁻²) were associated with higher DR risk, while increased levels of ALDOC (OR = 1.56; 95% CI = 0.246-0.637, FDR = 5.48×10⁻³) and SIRPG (OR = 1.15; 95% CI = 0.068-0.208, FDR = 4.73×10⁻²) were associated with higher PDR risk. These findings were corroborated by strong colocalization evidence.
Conclusions: Our study highlights WARS, SIRPG, and ALDOC as significant proteins associated with DR and PDR, providing a basis for further exploration in drug development. Additional studies are needed to validate these proteins as disease biomarkers across diverse populations.
1 Introduction
Diabetic retinopathy (DR) is a leading cause of vision loss worldwide, significantly impacting both individual health and public healthcare systems (1). Approximately one-third of people with diabetes develop severe visual impairments due to DR, leading to a substantial proportion suffering from irreversible blindness (2). The progression of DR is primarily driven by prolonged hyperglycemia, oxidative stress, and inflammation, resulting in microvascular damage in the retina (3). Current treatments, particularly anti-vascular endothelial growth factor (anti-VEGF) therapies, have marked a significant advancement in managing DR, effectively slowing its progression in many patients. However, about 40% of patients either resist or respond inadequately to these treatments, underscoring the need for more diverse and effective therapeutic strategies (4). Alongside anti-VEGF, other treatments, including steroid therapies and combination protocols, have been explored (5, 6). While these have shown limited efficacy, they represent important attempts in the ongoing effort to combat DR.
Circulatory proteins have become key targets for therapeutic research in DR, playing critical roles in various molecular processes (7). Previous studies have highlighted several proteins associated with the development of DR, including C-C motif chemokine 5 (CCL5), α-2-antiplasmin (SERPINF2), various adhesion molecules, and C-reactive protein (CRP) (8–10). These findings are significant in understanding the pathogenesis of DR and offer potential avenues for treatment. Advancements in high-throughput proteomics have further enriched our understanding of DR at the molecular level. For example, research by Lu et al. compared plasma proteomes of DR patients and identified key biomarkers like afamin and protein arginine N-methyltransferase 5, which are linked to the progression and development of diabetes (11). Similarly, Gopalakrishnan et al. discovered distinct protein expression profiles between DR and proliferative DR (PDR), with neuroglobin (NGB) standing out as a notable marker for DR development (12). However, these associations, primarily derived from observational studies, necessitate rigorous validation. This is crucial to ensure that the identified protein associations with DR are not confounded by external variables or biased by reverse causality. The pursuit of this validation represents a critical step in translating these proteomic discoveries into practical therapeutic interventions for DR.
Mendelian randomization (MR) utilizes single nucleotide polymorphisms (SNPs) from genome-wide association studies (GWAS) to uncover causal links between genetic factors and health outcomes (13). This method capitalizes on the random distribution of genes at birth, which helps overcome biases and confounding factors often encountered in observational studies (13). MR’s integration of advanced genomic and proteomic data has been instrumental in identifying potential disease biomarkers for various diseases (14, 15). Despite its proven utility, the application of MR in DR research remains limited. There is a significant opportunity to expand this approach in DR, particularly by combining insights from GWAS and protein quantitative trait loci (pQTL) datasets. This integration could offer new perspectives and solutions in understanding and treating DR, an area where there is still much to explore and discover.
Our study embarks on a comprehensive proteome-wide MR analysis, augmented by colocalization analysis, to explore potential disease biomarkers for DR and PDR. By integrating genomic and proteomic data, we aim to uncover new pathways and targets, potentially paving the way for innovative treatments for these visually debilitating conditions.
2 Materials and methods
2.1 Study design and ethics
Our research methodology is outlined in Figure 1. We utilized data from three key sources: the large-scale genome-wide blood proteome study (available at https://www.decode.com/summarydata/) (16), the Atherosclerosis Risk in Communities (ARIC) study (http://nilanjanchatterjeelab.org/pwas/) (17), and the FinnGen study (https://www.finngen.fi/en) (18). All the data were sourced from established studies that had already obtained ethical clearance from their respective institutions, eliminating the need for a separate ethical review for our research.
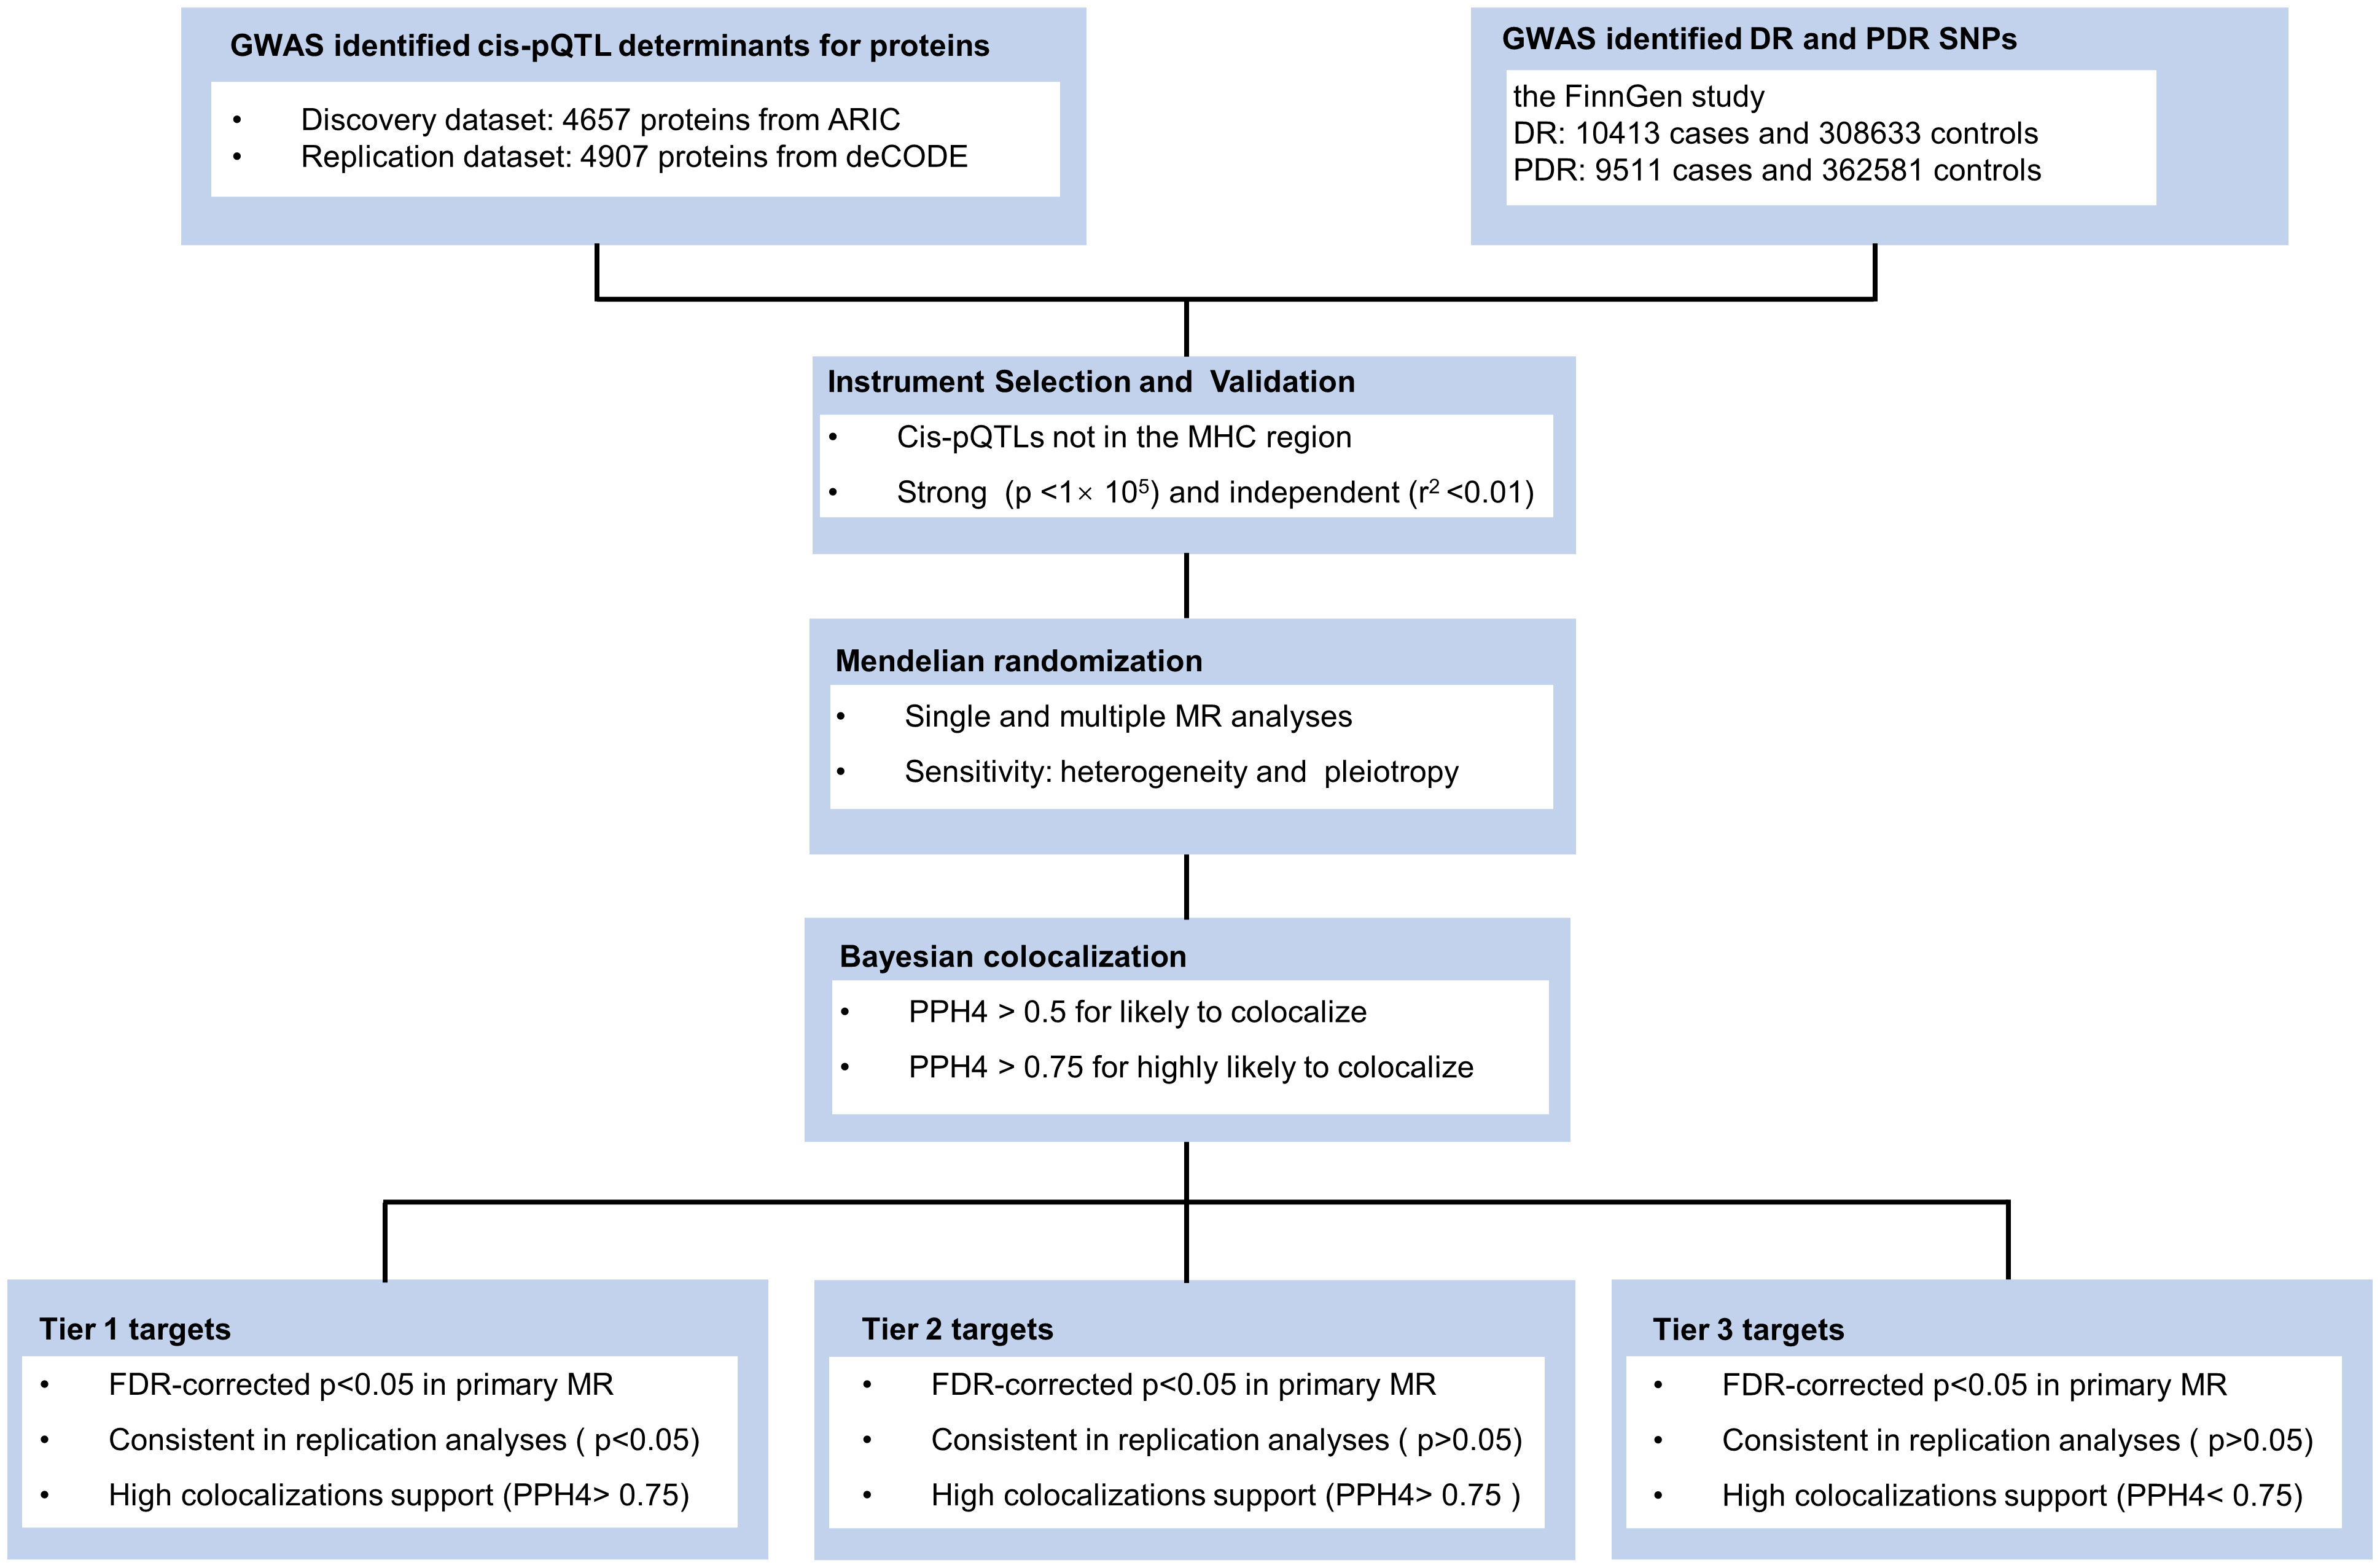
Figure 1 Study design. ARIC, the Atherosclerosis Risk in Communities study; deCODE, the Icelandic Decoding Genetics Study; DR, diabetic retinopathy; PDR, proliferative diabetic retinopathy; FDR, false discovery rate; MR, Mendelian Randomization.
2.2 Data sources
In the discovery stage, plasma protein pQTL data were obtained from the ARIC study, which included a total of 4657 plasma proteins collected from 7213 European Americans (EA) (17). For the replication stage, plasma protein pQTL data were obtained from the Icelandic deCODE genetics study by Ferkingstad et al, which analyzed 4907 plasma proteins from 35,559 Icelanders and reported more than 272 million genetic variants (16). The use of both datasets allowed us to balance the discovery and validation phases of our study effectively. The ARIC dataset provided a detailed platform for initial protein association findings, while the Icelandic dataset enabled us to replicate and validate these findings across a different population, thereby enhancing the generalizability of our study. Proteomics analyses for both studies were performed using the advanced SomaScan technology on the v.4.1 platform, ensuring consistent and high-quality data for our analyses.
We obtained DR and PDR data from the FinnGen study (18). This included 10,413 DR cases and 308,633 controls, and 9,511 PDR cases and 362,581 controls. The participants were all of European descent. We adjusted genetic associations for factors like age, sex, and genetic correlation, along with genotyping batch and the top 10 principal components. We identified cases of DR and PDR using International Classification of Diseases codes, specifically ICD-9 (3620) and ICD-10 (H360) for DR, and ICD-10 (H3603) for PDR (18).
2.3 Instrument selection and validation
In conducting our MR analysis, we rigorously derived genetic instrumental variables (IVs) from plasma protein pQTL data, as referenced in our prior research (16, 17). To ensure a substantial association between these IVs and the exposure variable, which in our study is protein abundance, we meticulously selected cis-SNPs positioned within 1 megabase (Mb) of the gene encoding the relevant protein. This selection was based on a stringent p-value threshold of less than 1 × 10⁻⁵, a criterion chosen to balance statistical significance with the likelihood of a genuine biological impact on protein levels. To secure the independence of these SNPs and preclude confounding due to linkage disequilibrium, we employed linkage disequilibrium (LD) clumping using PLINK software. This process involved evaluating SNPs within a 10 Mb window, considering them as independent if their LD values (r2) was less than 0.01. Our choice of reference panel for this analysis was the genotype data of Europeans from the 1000 Genomes Project, which aligns with the ancestry of the study’s participant population. This methodological approach was adopted to ensure the reliability and relevance of the instrumental variables used in our MR analysis.
2.4 Mendelian randomization
All MR analyses were undertaken with the TwoSampleMR package in R. The primary MR analysis was conducted using the inverse-variance weighted (IVW) method to determine the causal effects of plasma proteins on DR. FDR correction was performed using the BH method, and FDR < 0.05 was considered for statistical significance. The MR results were presented as odds ratio (OR) and 95% confidence interval (95% CI) for risk of DR per genetically predicted 1-standard deviation (SD) increase in plasma protein level.
To further identify the associations identified by the primary analyses, we performed multiple MR analyses of the preliminarily identified proteins as replications using an independent blood pQTL database (The Icelandic deCODE genetics study). Multiple MR analytical approaches, including IVW, Egger, weighted median, and weighted mode, were applied for validation, of which IVW was chosen as the primary approach according to the recommendation (19).
To further assess the robustness of the causal relationships identified by the multiple MR analyses, we also conducted sensitivity analyses, including heterogeneity and horizontal pleiotropy tests. Heterogeneity was assessed using Cochran’s Q statistic (20). The Cochran’s Q test followed a chi-square distribution with IV number minus one degree of freedom. MR-Egger regression intercept was employed as a measure of directional pleiotropy (20). Proteins with only one IV are not suitable for the above sensitivity analyses. Heterogeneity tests require at least two IVs to be analyzed and MR-Egger regression requires at least three IVs to be analyzed. For the multiple MR and sensitivity analyses, p-value < 0.05 was considered significant.
2.5 Bayesian colocalization
Colocalization analysis serves as an indispensable complement to cis-MR, crucial for assessing the validity of IV assumptions (21). This analysis is pivotal in differentiating whether the same genetic variants are influencing both the exposure (plasma protein levels) and the outcome (DR risk). By conducting colocalization analysis using the coloc.abf function in the R package coloc, we aimed to determine if the identified proteins and DR share causal genetic variants within the same genomic regions. This step is crucial for eliminating potential interference due to LD. We tested the posterior probability of hypothesis 4 (PPH4), which examines the likelihood of both the protein and DR sharing variants in the same region. Interpretation of PPH4 values is critical; a PPH4 greater than 0.5 suggests a likely colocalization, while a value exceeding 0.75 indicates a high probability of sharing causal variants.
The results of the colocalization analysis were instrumental in categorizing the identified proteins into tiers based on the strength of their causal evidence with DR. Proteins that showed consistent results in replication analyses and had strong supporting evidence of colocalization (PPH4 greater than 0.75) were classified as Tier 1 targets. This classification underscores a robust association with DR, suggesting a higher likelihood of being genuine disease biomarkers. Proteins with only high support evidence of colocalization (PPH4 greater than 0.75) were categorized as Tier 2 targets. These proteins, while showing potential association with DR, may require further validation. The remaining proteins, which did not meet these stringent criteria, were classified as Tier 3 targets. This tier-based system allows for a nuanced interpretation of the data, guiding future research and development efforts towards the most promising disease biomarkers for DR.
3 Results
3.1 MR analysis
In our MR analysis, we assessed 4657 plasma proteins to explore their potential link with DR, employing a methodology previously explicated. After applying an adjustment for the FDR, we identified five proteins with significant associations with DR (Figure 2A). Specifically, we found that higher genetically predicted levels of the proteins WARS (OR = 1.16; 95% CI = 0.095-0.208, FDR = 1.31×10⁻⁴), KLK8 (OR = 1.22; 95% CI = 0.105-0.288, FDR = 1.10×10⁻²), SIRPG (OR = 1.15; 95% CI = 0.071-0.201, FDR = 1.46×10⁻²), and KLK11 (OR = 1.58; 95% CI = 0.222-0.696, FDR = 4.35×10⁻²) were associated with an increased risk of DR. In contrast, an increase in HSPA1A levels (OR = 0.466; 95% CI = -1.067 to -0.46, FDR = 4.96×10⁻⁴) was linked to a decreased risk of DR (Supplementary Table 1).
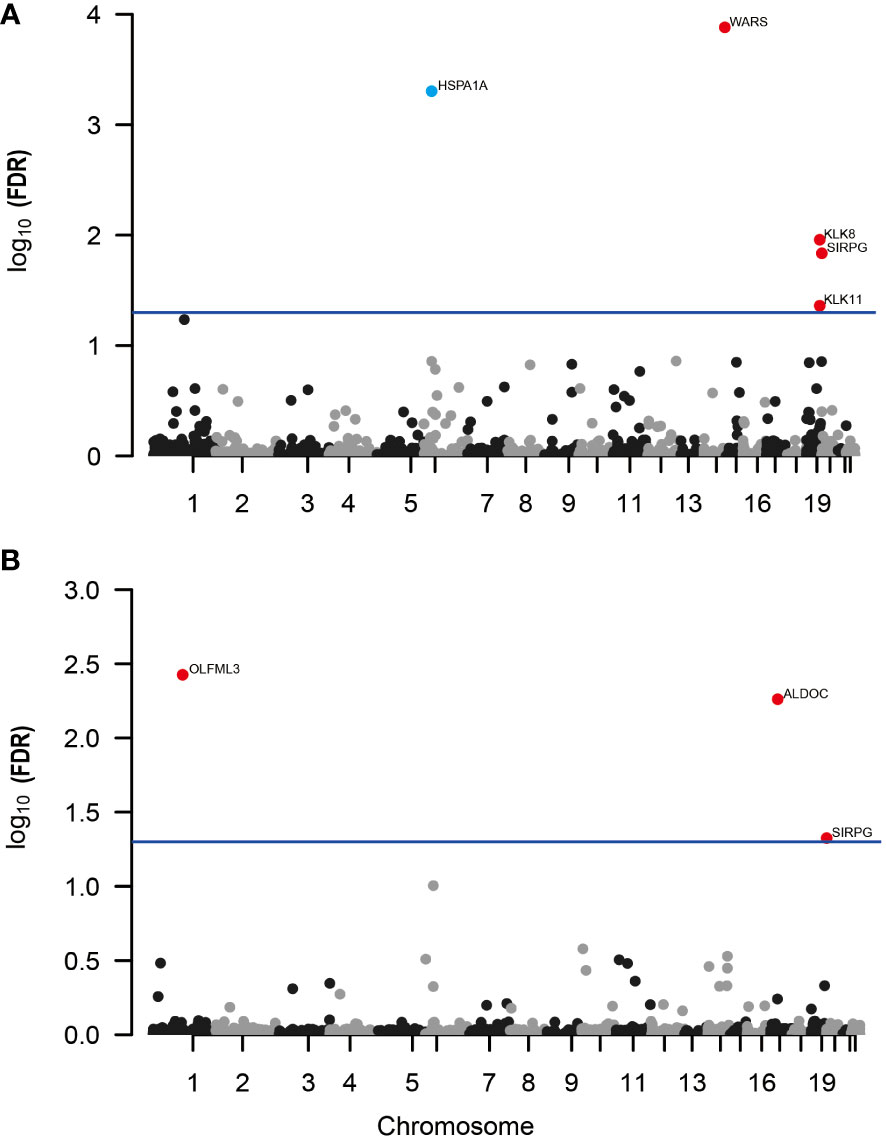
Figure 2 Manhattan plots for associations of genetically predicted 4657 plasma proteins levels with DR and PDR in MR analysis. (A) Associations of genetically predicted plasma protein levels with DR; (B) associations of genetically predicted plasma protein levels with PDR. Labelled and color genes refer to MR findings with FDR-corrected p < 0.05. Red genes indicate the positive effect of the plasma proteins on outcomes; blue genes indicate the negative effect of the plasma proteins on outcomes.
Further, when investigating PDR, our analysis revealed three proteins associated with a higher risk of developing PDR (Figure 2B; Supplementary Table 2). These include OLFML3 (OR = 1.51; 95% CI = 0.238-0.591, FDR = 3.75×10⁻³), ALDOC (OR = 1.56; 95% CI = 0.246-0.637, FDR = 5.48×10⁻³), and SIRPG (OR = 1.15; 95% CI = 0.068-0.208, FDR = 4.73×10⁻²). Notably, SIRPG showed a consistent association with both DR and PDR.
3.2 Replication analyses
In the replication phase of our study, we re-examined five proteins initially identified as associated with DR. Out of these, two proteins, WARS and SIRPG, showed consistent results in the Icelandic deCODE genetics study. The analysis indicated an increased risk of DR with higher levels of WARS (OR = 1.39; 95% CI = 0.21-0.45; p-value = 5.50 × 10⁻⁸) and SIRPG (OR = 1.39; 95% CI = 0.18-0.62; p-value = 3.32 × 10⁻⁴), as shown in Supplementary Table 3. Our sensitivity analysis, which included tests for heterogeneity (p-value for Cochran’s Q = 0.442) and pleiotropy (p-value for MR-Egger intercept = 0.479), found no significant discrepancies in the association between WARS and DR. It’s important to note that for SIRPG, due to the availability of only one IV (rs6043409), we couldn’t perform heterogeneity and pleiotropy tests (Supplementary Table 4).
For PDR, our analysis replicated the associations for all three identified proteins: OLFML3, ALDOC, and SIRPG. Specifically, increased levels of OLFML3 (OR = 1.82; 95% CI = 0.09-1.12; p-value = 2.19 × 10⁻²), ALDOC (OR = 1.83; 95% CI = 0.34-0.87; p-value = 9.28 × 10⁻⁶), and SIRPG (OR = 1.58; 95% CI = 0.23-0.68; p-value = 6.65 × 10⁻⁵) were associated with a higher risk of developing PDR. These results are detailed in Supplementary Table 5. Based on Cochran’s Q statistics, there was little evidence of heterogeneity between OLFML3 and PDR (p-value for Cochran’s Q = 0.108). Similar to SIRPG in DR analysis, due to the presence of only one IV for both SIRPG (rs6043409) and ALDOC (rs141921160), heterogeneity and pleiotropy analyses were not conducted.
3.3 Colocalization analyses
In our study, we conducted detailed colocalization analyses to further understand the relationship between certain plasma proteins and both DR and PDR. Our findings showed significant colocalization for three of the five analyzed proteins (KLK8, SIRPG, and WARS) with DR. The evidence for colocalization was strong, as indicated by the PPH4, which were 78.3%, 80.7%, 94.3%, and 87.6% respectively for these proteins (Supplementary Table 6). Similarly, for PDR, two proteins, ALDOC and SIRPG, also showed high evidence of colocalization with PPH4 values of 99.1% and 93.4%, respectively.
To classify the identified proteins based on the strength of evidence supporting their role in DR and PDR, we organized them into tiers. We considered several factors for this classification, including the consistency of results in replication analyses, the presence of heterogeneity or horizontal pleiotropy, and the strength of colocalization evidence. Based on this approach, WARS and SIRPG were categorized as Tier 1 evidence proteins for DR, indicating a strong link. For PDR, ALDOC and SIRPG were also classified as Tier 1 evidence proteins, underscoring their potential significance in the disease’s development. These categorizations and the detailed evidence supporting them are presented in Table 1.
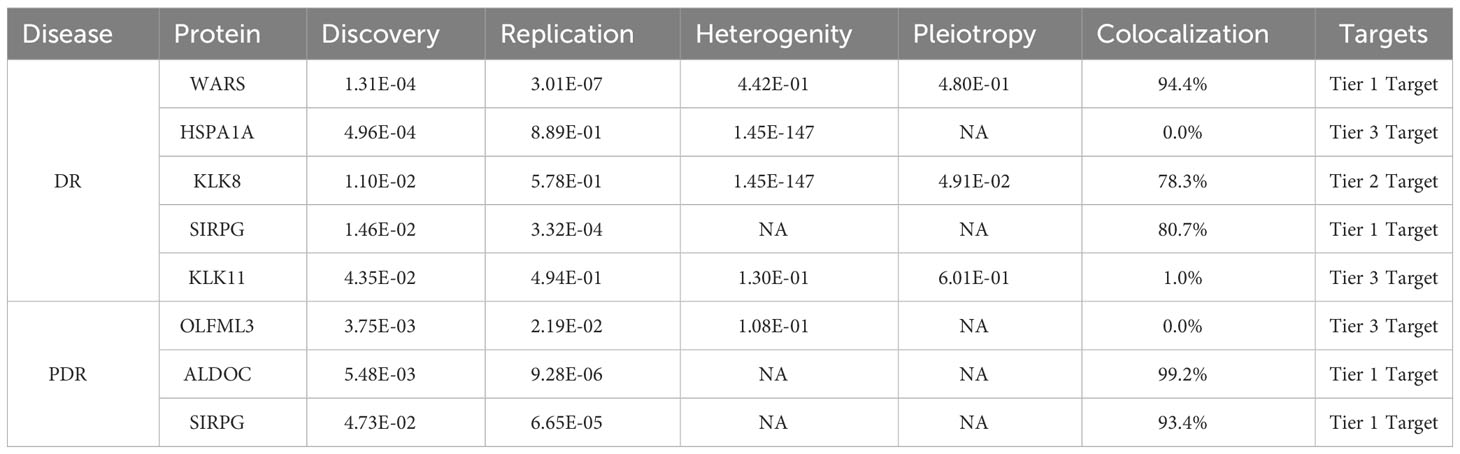
Table 1 Summary of levels of evidence for target proteins for DR and PDR.
4 Discussion
In human genetics research, the focus on identifying disease biomarkers, especially for conditions like DR, is crucial. A large portion of FDA-approved drugs in recent years are supported by genetic research, highlighting the role of genetics in medical advancements (22). Our study, employing MR and colocalization analysis, identified four plasma proteins (WARS, KLK8, SIRPG, ALDOC) as potential markers for DR and PDR. Three of these proteins, WARS, SIRPG, and ALDOC, were validated in multiple MR analyses against an independent pQTL database. This validation strengthens our findings. Our study paves the way for further research to explore the direct histological links of these proteins to DR. It highlights the potential of these proteins as targets for future therapeutic interventions, given their relative ease of detection.
Our study highlights SIRPG as a significant marker for DR and its advanced form, PDR, supported by strong evidence. SIRPG, a member of the SIRP protein family, is primarily found on T cells and a subset of B cells (23). Genomic studies have linked two specific genetic variations of SIRPG, rs2281808 (C > T; intronic) and rs6043409 (G > A; A263 V), to type 1 diabetes (24, 25). The association of the T allele of rs2281808 with an increased risk of type 1 diabetes suggests a genetic predisposition (26). Further analysis using two-sample MR indicates a correlation between higher levels of SIRPG and an increased risk of type 1 diabetes (27). These findings suggest a potential link between elevated SIRPG levels and diabetes susceptibility. However, the direct role of SIRPG in the development and progression of DR and PDR needs further investigation. This research opens avenues for exploring SIRPG as a biomarker in diabetic eye diseases and understanding its underlying mechanisms in DR pathogenesis.
In our research, we identified WARS as another potential risk factor for DR. WARS, a fundamental enzyme in protein synthesis, links tryptophan to its corresponding transfer RNA (28). Previous studies have shown increased levels of WARS in the tears of patients with PDR, suggesting its involvement in the disease (29). Our findings support this link, establishing a causal relationship between WARS and DR. Interestingly, PDR is characterized by abnormal blood vessel growth, yet WARS is known to have anti-angiogenic effects. This includes its influence in ocular angiogenesis (30) and tumor growth (31). When WARS is broken down, it produces several smaller molecules, such as mini-WARS and T2-WARS, known to inhibit blood vessel growth (30–34). Specifically, T2-WARS interacts with VEGF pathways, reducing endothelial cell movement and angiogenesis (33, 35). Additionally, WARS acts as a natural trigger for Toll-like receptors (TLR) 2 and 4, known to play a role in inflammatory responses. The engagement of WARS with these receptors leads to the production of various inflammatory substances (36). Considering the known role of inflammation in DR, exploring the pathological implications of WARS in this context is of great importance (37). This further establishes WARS not only as a marker for DR but also as a potential target for understanding and managing the disease.
Our study highlighted ALDOC, a member of the class I fructose-bisphosphate aldolase gene family, as a key protein associated specifically with proliferative diabetic retinopathy (PDR). ALDOC’s primary function involves critical steps in glycolysis, where it aids in breaking down sugars (38). We observed that increased levels of ALDOC align with elevated plasma free fatty acid concentrations. This correlation could influence insulin secretion and potentially lead to type 2 diabetes mellitus, a known risk factor for PDR (39, 40).
Furthermore, research by Michal et al. has uncovered the significant role of aldolase proteins, including ALDOC, in enhancing Wnt signaling (41). This signaling pathway, implicated in various cellular processes, is critical in the development of diabetic retinopathy. Specifically, ALDOC and its family members can modify Wnt signaling by interacting with key molecular components, thereby influencing cell behavior related to PDR (42). Although these findings position ALDOC as a potential risk marker for PDR, its direct role in the disease’s pathogenesis is yet to be fully understood. More detailed studies are necessary to clarify the exact relationship between ALDOC levels and PDR, which could open new avenues for therapeutic interventions.
Our study has limitations, particularly in using blood-derived proteins, which may not completely reflect changes in DR-specific tissues like the retina. Future research should explore proteins from these ocular tissues for deeper insights into DR. Additionally, our use of SOMAmers technology, while advanced, may not capture the full range of proteins involved in DR. Exploring diverse proteomic methods and sample types could uncover more relevant proteins. Importantly, our focus on European ancestry limits the study’s broader applicability. Future research must include diverse populations to understand how genetic differences affect DR across ethnicities. This is crucial for developing treatments and prevention strategies effective for a global population.
In summary, our study identifies strong causal connections between three plasma proteins (SIRPG, WARS, ALDOC) and DR. This finding opens new avenues for therapeutic research in DR. Future studies are essential to confirm these links and explore their underlying mechanisms. This work sets the stage for developing targeted treatments for DR, addressing a significant health challenge.
Data availability statement
The original contributions presented in the study are included in the article/Supplementary Material. Further inquiries can be directed to the corresponding author.
Author contributions
XZ: Conceptualization, Data curation, Formal analysis, Writing – original draft. SY: Writing – original draft, Writing – review & editing, Formal analysis, Resources. YT: Project administration, Resources, Writing – review & editing.
Funding
The author(s) declare financial support was received for the research, authorship, and/or publication of this article. This study was supported by the National Funded Postdoctoral Researcher Program of China (GZC20233180).
Acknowledgments
The authors would like to acknowledge the participants and investigators of the FinnGen study, as well as the valuable data provided by the deCODE genetics and Atherosclerosis Risk in Communities study.
Conflict of interest
The authors declare that the research was conducted in the absence of any commercial or financial relationships that could be construed as a potential conflict of interest.
Publisher’s note
All claims expressed in this article are solely those of the authors and do not necessarily represent those of their affiliated organizations, or those of the publisher, the editors and the reviewers. Any product that may be evaluated in this article, or claim that may be made by its manufacturer, is not guaranteed or endorsed by the publisher.
Supplementary material
The Supplementary Material for this article can be found online at: https://www.frontiersin.org/articles/10.3389/fendo.2023.1339374/full#supplementary-material
References
1. Tan TE, Wong TY. Diabetic retinopathy: Looking forward to 2030. Front Endocrinol (2022) 13:1077669. doi: 10.3389/fendo.2022.1077669
2. Yau JW, Rogers SL, Kawasaki R, Lamoureux EL, Kowalski JW, Bek T, et al. Global prevalence and major risk factors of diabetic retinopathy. Diabetes Care (2012) 35(3):556–64. doi: 10.2337/dc11-1909
3. Duh EJ, Sun JK, Stitt AW. Diabetic retinopathy: current understanding, mechanisms, and treatment strategies. JCI Insight (2017) 2(14). doi: 10.1172/jci.insight.93751
4. Zhao Y, Singh RP. The role of anti-vascular endothelial growth factor (anti-VEGF) in the management of proliferative diabetic retinopathy. Drugs Context (2018) 7:212532. doi: 10.7573/dic.212532
5. Simo R, Hernandez C. Novel approaches for treating diabetic retinopathy based on recent pathogenic evidence. Prog Retinal Eye Res (2015) 48:160–80. doi: 10.1016/j.preteyeres.2015.04.003
6. Furino C, Boscia F, Reibaldi M, Alessio G. Intravitreal therapy for diabetic macular edema: an update. J Ophthalmol (2021) 2021:1–23. doi: 10.1155/2021/6654168
7. Zheng J, Haberland V, Baird D, Walker V, Haycock PC, Hurle MR, et al. Phenome-wide Mendelian randomization mapping the influence of the plasma proteome on complex diseases. Nat Genet (2020) 52(10):1122–31. doi: 10.1038/s41588-020-0682-6
8. Meleth AD, Agrón E, Chan CC, Reed GF, Arora K, Byrnes G, et al. Serum inflammatory markers in diabetic retinopathy. Invest Ophthalmol Vis Sci (2005) 46(11):4295–301. doi: 10.1167/iovs.04-1057
9. Polat SB, Ugurlu N, Yulek F, Simavli H, Ersoy R, Cakir B, et al. Evaluation of serum fibrinogen, plasminogen, α2-anti-plasmin, and plasminogen activator inhibitor levels (PAI) and their correlation with presence of retinopathy in patients with type 1 DM. J Diabetes Res (2014) 2014:317292. doi: 10.1155/2014/317292
10. Sasongko MB, Wong TY, Jenkins AJ, Nguyen TT, Shaw JE, Wang JJ. Circulating markers of inflammation and endothelial function, and their relationship to diabetic retinopathy. Diabetic Med J Br Diabetic Assoc (2015) 32(5):686–91. doi: 10.1111/dme.12640
11. Lu CH, Lin ST, Chou HC, Lee YR, Chan HL. Proteomic analysis of retinopathy-related plasma biomarkers in diabetic patients. Arch Biochem Biophys (2013) 529(2):146–56. doi: 10.1016/j.abb.2012.11.004
12. Gopalakrishnan V, Purushothaman P, Bhaskar A. Proteomic analysis of plasma proteins in diabetic retinopathy patients by two dimensional electrophoresis and MALDI-Tof-MS. J Diabetes Its Complications (2015) 29(7):928–36. doi: 10.1016/j.jdiacomp.2015.05.021
13. Smith GD, Ebrahim S. 'Mendelian randomization': can genetic epidemiology contribute to understanding environmental determinants of disease? Int J Epidemiol (2003) 32(1):1–22. doi: 10.1093/ije/dyg070
14. Chen J, Xu F, Ruan X, Sun J, Zhang Y, Zhang H, et al. Therapeutic targets for inflammatory bowel disease: proteome-wide Mendelian randomization and colocalization analyses. EBioMedicine (2023) 89:104494. doi: 10.1016/j.ebiom.2023.104494
15. Ou YN, Yang YX, Deng YT, Zhang C, Hu H, Wu BS, et al. Identification of novel drug targets for Alzheimer's disease by integrating genetics and proteomes from brain and blood. Mol Psychiatry (2021) 26(10):6065–73. doi: 10.1038/s41380-021-01251-6
16. Ferkingstad E, Sulem P, Atlason BA, Sveinbjornsson G, Magnusson MI, Styrmisdottir EL, et al. Large-scale integration of the plasma proteome with genetics and disease. Nat Genet (2021) 53(12):1712–21. doi: 10.1038/s41588-021-00978-w
17. Zhang J, Dutta D, Köttgen A, Tin A, Schlosser P, Grams ME, et al. Plasma proteome analyses in individuals of European and African ancestry identify cis-pQTLs and models for proteome-wide association studies. Nat Genet (2022) 54(5):593–602. doi: 10.1038/s41588-022-01051-w
18. Kurki MI, Karjalainen J, Palta P, Sipilä TP, Kristiansson K, Donner KM, et al. FinnGen provides genetic insights from a well-phenotyped isolated population. Nature (2023) 613(7944):508–18. doi: 10.1038/s41586-022-05473-8
19. Burgess S, Davey Smith G, Davies NM, Dudbridge F, Gill D, Glymour MM, et al. Guidelines for performing Mendelian randomization investigations: update for summer 2023. Wellcome Open Res (2019) 4:186. doi: 10.12688/wellcomeopenres.15555.1
20. Bowden J, Hemani G, Davey Smith G. Invited commentary: detecting individual and global horizontal pleiotropy in Mendelian randomization-A job for the humble heterogeneity statistic? Am J Epidemiol (2018) 187(12):2681–5. doi: 10.1093/aje/kwy185
21. Giambartolomei C, Vukcevic D, SChadt EE, Franke L, Hingorani AD, Wallace C, et al. Bayesian test for colocalisation between pairs of genetic association studies using summary statistics. PloS Genet (2014) 10(5):e1004383. doi: 10.1371/journal.pgen.1004383
22. Ochoa D, Karim M, Ghoussaini M, Hulcoop DG, McDonagh EM, Dunham I. Human genetics evidence supports two-thirds of the 2021 FDA-approved drugs. Nat Rev Drug Discov (2022) 21(8):551. doi: 10.1038/d41573-022-00120-3
23. Sinha S, Renavikar PS, Crawford MP, Steward-Tharp SM, Brate A, Tsalikian E, et al. Altered expression of SIRPγ on the T-cells of relapsing remitting multiple sclerosis and type 1 diabetes patients could potentiate effector responses from T-cells. PloS One (2020) 15(8):e0238070. doi: 10.1371/journal.pone.0238070
24. Sinha S, Borcherding N, Renavikar PS, Crawford MP, Tsalikian E, Tansey M, et al. An autoimmune disease risk SNP, rs2281808, in SIRPG is associated with reduced expression of SIRPγ and heightened effector state in human CD8 T-cells. Sci Rep (2018) 8(1):15440. doi: 10.1038/s41598-018-33901-1
25. Brooke G, Holbrook JD, Brown MH, Barclay AN. Human lymphocytes interact directly with CD47 through a novel member of the signal regulatory protein (SIRP) family. J Immunol (Baltimore Md 1950) (2004) 173(4):2562–70. doi: 10.4049/jimmunol.173.4.2562
26. Barrett JC, Clayton DG, Concannon P, Akolkar B, Cooper JD, Erlich HA, et al. Genome-wide association study and meta-analysis find that over 40 loci affect risk of type 1 diabetes. Nat Genet (2009) 41(6):703–7. doi: 10.1038/ng.381
27. Yazdanpanah N, Yazdanpanah M, Wang Y, Forgetta V, Pollak M, Polychronakos C, et al. Clinically relevant circulating protein biomarkers for type 1 diabetes: evidence from a two-sample Mendelian randomization study. Diabetes Care (2022) 45(1):169–77. doi: 10.2337/dc21-1049
28. Kwon NH, Fox PL, Kim S. Aminoacyl-tRNA synthetases as therapeutic targets. Nat Rev Drug Discov (2019) 18(8):629–50. doi: 10.1038/s41573-019-0026-3
29. Amorim M, Martins B, Caramelo F, Gonçalves C, Trindade G, Simão J, et al. Putative biomarkers in tears for diabetic retinopathy diagnosis. Front Med (2022) 9:873483. doi: 10.3389/fmed.2022.873483
30. Otani A, Slike BM, Dorrell MI, Hood J, Kinder K, Ewalt KL, et al. A fragment of human TrpRS as a potent antagonist of ocular angiogenesis. Proc Natl Acad Sci U States A (2002) 99(1):178–83. doi: 10.1073/pnas.012601899
31. Tzima E, Schimmel P. Inhibition of tumor angiogenesis by a natural fragment of a tRNA synthetase. Trends Biochem Sci (2006) 31(1):7–10. doi: 10.1016/j.tibs.2005.11.002
32. Wakasugi K, Slike BM, Hood J, Otani A, Ewalt KL, Friedlander M, et al. A human aminoacyl-tRNA synthetase as a regulator of angiogenesis. Proc Natl Acad Sci USA (2002) 99(1):173–7. doi: 10.1073/pnas.012602099
33. Tzima E, Reader JS, Irani-Tehrani M, Ewalt KL, Schwartz MA, Schimmel P. VE-cadherin links tRNA synthetase cytokine to anti-angiogenic function. J Biol Chem (2005) 280(4):2405–8. doi: 10.1074/jbc.C400431200
34. Kise Y, Lee SW, Park SG, Fukai S, Sengoku T, Ishii R, et al. A short peptide insertion crucial for angiostatic activity of human tryptophanyl-tRNA synthetase. Nat Struct Mol Biol (2004) 11(2):149–56. doi: 10.1038/nsmb722
35. Tzima E, Reader JS, Irani-Tehrani M, Ewalt KL, Schwartz MA, Schimmel P. Biologically active fragment of a human tRNA synthetase inhibits fluid shear stress-activated responses of endothelial cells. Proc Natl Acad Sci USA (2003) 100(25):14903–7. doi: 10.1073/pnas.2436330100
36. Nguyen TTT, Yoon HK, Kim YT, Choi YH, Lee WK, Jin M. Tryptophanyl-tRNA synthetase 1 signals activate TREM-1 via TLR2 and TLR4. Biomolecules (2020) 10(9):1283. doi: 10.3390/biom10091283
37. Bayan N, Yazdanpanah N, Rezaei N. Role of toll-like receptor 4 in diabetic retinopathy. Pharmacol Res (2022) 175:105960. doi: 10.1016/j.phrs.2021.105960
38. Wang CF, Yuan CZ, Wang SH, Zhang H, Hu XX, Zhang L, et al. Differential gene expression of aldolase C (ALDOC) and hypoxic adaptation in chickens. Anim Genet (2007) 38(3):203–10. doi: 10.1111/j.1365-2052.2007.01605.x
39. Camps SG, Verhoef SP, Roumans N, Bouwman FG, Mariman EC, Westerterp KR. Weight loss-induced changes in adipose tissue proteins associated with fatty acid and glucose metabolism correlate with adaptations in energy expenditure. Nutr Metab (2015) 12:37. doi: 10.1186/s12986-015-0034-1
40. Kashyap S, Belfort R, Gastaldelli A, Pratipanawatr T, Berria R, Pratipanawatr W, et al. A sustained increase in plasma free fatty acids impairs insulin secretion in nondiabetic subjects genetically predisposed to develop type 2 diabetes. Diabetes (2003) 52(10):2461–74. doi: 10.2337/diabetes.52.10.2461
41. Caspi M, Perry G, Skalka N, Meisel S, Firsow A, Amit M, et al. Aldolase positively regulates of the canonical Wnt signaling pathway. Mol Cancer (2014) 13:164. doi: 10.1186/1476-4598-13-164
Keywords: diabetic retinopathy, Mendelian randomization, genomics, proteomics, disease biomarkers
Citation: Zou X, Ye S and Tan Y (2024) Potential disease biomarkers for diabetic retinopathy identified through Mendelian randomization analysis. Front. Endocrinol. 14:1339374. doi: 10.3389/fendo.2023.1339374
Received: 16 November 2023; Accepted: 13 December 2023;
Published: 11 January 2024.
Edited by:
Kai Jin, Zhejiang University, ChinaReviewed by:
Lin Chen, Independent Researcher, Fuzhou, ChinaDimitrios Ntentakis, Massachusetts Eye & Ear Infirmary and Harvard Medical School, United States
Copyright © 2024 Zou, Ye and Tan. This is an open-access article distributed under the terms of the Creative Commons Attribution License (CC BY). The use, distribution or reproduction in other forums is permitted, provided the original author(s) and the copyright owner(s) are credited and that the original publication in this journal is cited, in accordance with accepted academic practice. No use, distribution or reproduction is permitted which does not comply with these terms.
*Correspondence: Yao Tan, tanyao2000@qq.com
†These authors have contributed equally to this work and share first authorship