 Arwa A. Alageel
 Amal F. Alshammary
 Imran Ali Khan
- Department of Clinical Laboratory Sciences, College of Applied Medical Sciences, King Saud University, Riyadh, Saudi Arabia
Introduction: Non-diabetic women with polycystic ovarian syndrome (PCOS) often have abnormal insulin regulation. Calpain 10 (CALP10) is a biomarker of type 2 diabetes mellitus, with some of its single-nucleotide polymorphisms (SNPs) influencing PCOS development.
Methods: In this case-control study on 90 women each with and without PCOS, we explored the molecular role of five CALP10 SNPs using biochemical parameters and Sanger sequencing analyses.
Results: Different genetic models, genotypes, and allele frequencies were significantly associated with UCSNP-19 (rs3842570; p=0.01), UCSNP-44 (rs2975760; p=0.009), UCSNP-56 (rs2975762; p<0.0001), and UCSNP-63 (rs5030952; p=0.0003) in women with PCOS. The multiple logistic regression model showed a strong association of CALP10 SNPs with fasting blood glucose (p<0.001). ANOVA showed significant associations with various biochemical parameters such as FSH (p=0.0001) in UCSNP-19 (rs3842570), FI (p=0.002), TG (p=0.01) in UCSNP-56 (rs2975762) and FBG (p=0.001), FI (p=0.004), FSH (p=0.02) & LDLc (p=0.04) in UCSNP-63 (rs5030952) SNPs. Haplotype analysis also revealed significant associations between different combinations of alleles in the studied 5 SNPs in women with PCOS (p<0.05). Generalized multifactor dimensionality reduction analysis showed the best gene–gene interactions among the five SNPs in CALP10I (p<0.05). However, dendrogram and graphical depletion models found no strong association in women with PCOS.
Conclusion: In conclusion, this study confirms rs3842570, rs2975760, rs2975767, and rs5030952 SNPs in CALP10 gene is associated in diagnosed PCOS women in the Saudi Arabia.
1 Introduction
Polycystic ovarian syndrome (PCOS) is a heterogeneous condition characterized by hyperandrogenism (HA), polycystic ovaries, and dysfunctional ovulation, and it is associated with metabolic problems such as insulin resistance (IR) and obesity (1). According to the World Health Organization, PCOS affected approximately 116 million women worldwide in 2012 (2). PCOS also contributed to a 56% increase in female infertility (3). Women diagnosed with PCOS have various reproductive, metabolic, cardiovascular, and psychological comorbidities (4). A combination of genetic and environmental factors can predict the development of PCOS in women (5), e.g., type 2 diabetes mellitus (T2DM), IR, obstructive sleep apnea, and elevated blood pressure (6).
The global prevalence of PCOS in the female population is 5–21% depending on the diagnostic criteria utilized (7). PCOS was first diagnosed in 1990 by the NICHD. In 2003, both ESHRE and ASRM updated the definition at Rotterdam (8). Although there is no cure or treatment for PCOS, various medications can alleviate the symptoms (9). PCOS may clinically manifest as HA, oligoanovulation, and polycystic ovary morphology (PCOM). Women with PCOS are categorized into four phenotypes: HA+OA+PCOM, phenotype-A; HA+OA, phenotype-B; HA+PCOM, phenotype-C; and OA+PCOM, phenotype D (10). IR appears to be a key factor PCOS development, with the ovary being only one among several organs affected (11). Nearly 44–70% of women diagnosed with PCOS have IR with endometrial IR and impaired glucose transport, leading to chronic low-grade inflammation, immune dysfunction modifications in the vascular uterus, elevated endometrial gene expression, and cellular abnormalities (12).
PCOS is influenced by multiple factors, including discrete genes, gene–gene interactions, and the environment (13). Genome-wide association studies (GWAS) identified 19 distinct genetic susceptibility loci in women with PCOS, with only 11 loci typically detected in both Han Chinese and European women. GWAS-identified loci only account for <10% of PCOS heredity, indicating that both environmental and non-environmental factors contribute to PCOS development (14). Single-nucleotide polymorphisms (SNPs) may reveal functional changes arising from variations in amino acids or gene expression regulation (15). The complexity of PCOS and the multiple genes implicated in its pathogenesis make genetics a valuable research tool (16). Cooper et al. raised doubts about the genetic basis of PCOS. Since then, many genes have been analyzed for possible links with this disorder (17). Based on linkage analysis, CALPAIN 10 (CALP10) was identified in Mexican Americans and was associated with modified CAPN10 expression (18). CALP10 increases genetic susceptibility, particularly towards T2DM, which shares etiological elements with PCOS (19). SNPs in CALP10 have been linked to disorders of glucose metabolism and IR, both of which may influence susceptibility to PCOS. The SNPs UCSNP-19 (rs3842570), UCSNP-43 (rs3792267), UCSNP-44 (rs2975760), UCSNP-56 (rs2975762), and UCSNP-63 (rs5030952) have been shown to play a role in PCOS development (20, 21). Global studies have provided both positive and negative associations with all five SNPs in women of diverse ethnicities with PCOS; however, no molecular studies have documented a link between Saudi women with PCOS and CALP10 SNPs. The prevalence of PCOS is increasing in Saudi Arabia owing to the high prevalence of obesity. Therefore, this study was designed to determine the molecular relationship of these five CALP10 SNPs with PCOS in Saudi women. This study aims to contribute novel insights into the genetic basis of PCOS susceptibility in this population. This research holds promise for advancing our understanding of PCOS development, potentially paving the way for improved diagnostic and therapeutic strategies tailored to Saudi women with PCOS.
2 Materials and methods
2.1 Study design and plan
This study was designed before ethical approval for enrollment (E-23-7917) from the Institutional Review Board of the College of Medicine at King Saud University and was in line with the Declaration of Helsinki. We enrolled women after obtaining signed informed consent.
In this case-control study, 90 PCOS women and 90 non-PCOS (controls) were selected from patients who visited the outpatient clinic of the Department of Obstetrics and Gynecology at King Khalid University Hospital. Based on a previous study, 90 women with PCOS and 90 non-PCOS women were selected (22). The inclusion criteria for women with PCOS were Saudi nationality and Rotterdam criteria (23). Rotterdam criteria include the presence of (i) polycystic ovaries, (ii) oligoanovulation, and (iii) HA. Saudi women who did not meet the Rotterdam criteria were excluded. Non-PCOS women were selected based on a single ovary, regular menstruation, no family or self-histories of PCOS, and non-Rotterdam criteria. Women without PCOS and those with a family history of irregular menstruation and multiple ovaries were excluded. Samples were collected for 365 days in 2021. The study protocol included women aged 18–40 years. All women (n=180) completed the questionnaire and confirmed the absence of any infection or autoimmune, chronic, or other diseases.
2.2 Sample collection and anthropometric measurements
In this study, Body Mass Index (BMI) was measured using weight in kilograms (kgs) and height in centimeters squared (m2). The equation for BMI was found to be kg/m2 and BMI was divided into normal BMI (<24.9 kg/m2), overweight (25.0–29.9 kg/m2), obesity (30.0–34.9 kg/m2), morbid obesity-I (35.0–39.9 kg/m2), and morbid obesity-II (≥40 kg/m2). All BMI values were recorded when the women visited the outpatient clinic and were diagnosed with PCOS or non-PCOS. Blood was collected from the women and stored in 360 plain vacutainers and 180 EDTA vacutainers. In each vacutainer, 1 mL, 1 mL, and 2 mL blood samples were collected from each woman, i.e., each woman gave 4 mL peripheral blood collected with two coagulants (1 mL + 1 mL) in plain tubes and 2 mL anticoagulant blood in EDTA tubes. The blood collected in the coagulant tubes was used to separate the serum by spinning at 4000 rpm for 10 min. Serum was extracted from the vacutainer tube, and peripheral blood in EDTA tubes was used for molecular analyses such as DNA isolation, PCR, and Sanger sequencing.
2.3 Serum studies
Fasting blood samples were drawn before a minimum of 1/3 day of overnight fasting. The same sample was used to measure FI. The remaining 1 mL of the sample was used to screen creatinine, FSH, TSH, LH, and TT levels. Additionally, TC, TG, HDLc, and LDLc were measured. Using serum samples, FBG, FI, creatinine, FSH, LH, TT, TC, TG and HDLc levels were measured using COBAS equipment and ROCHE kits. However, LDLc levels were calculated manually.
2.4 Molecular analysis of CALP10 SNPs
EDTA blood was used to extract genomic DNA using the Qiagen DNA isolation Kit (Hilden, Germany). The quality and quantity of DNA were measured using a NanoDrop spectrophotometer at a 260/280 ratio. Genotyping was performed with PCR analysis in 50 µL reactions using Qiagen Hot Star Taq Master mix kit containing 10x buffer, 25 mM MgCl2, dNTPs, and 5 units of Taq DNA polymerase. Forward and reverse primers (10 pmol each) were synthesized by IRABIO (Hyderabad, India). Finally, 20 ng genomic DNA was used in a 50 µL reaction volume. Initial denaturation temperatures were optimized for each SNP: rs3842570 (68°C), rs3792267 (68°C), rs2975760 (60°C), rs2975762 (66°C), rs5030952 (66°C). This was followed by 35 cycles of denaturation at 95°C for 30 s; annealing between 60–68°C; and extension at 72°C for 45 s. Final extension was completed at 95°C for 5 min, followed by a final hold at 4°C. The cycling time of the five SNPs was between 1.23 and 1.35 h. All PCR products (187, 245, 240, 217, and 192 bp) were subjected to 2% agarose gel electrophoresis followed by ethidium bromide staining. The details of the SNP ID, primer sequences, methodology, and band sizes are shown in Table 1.
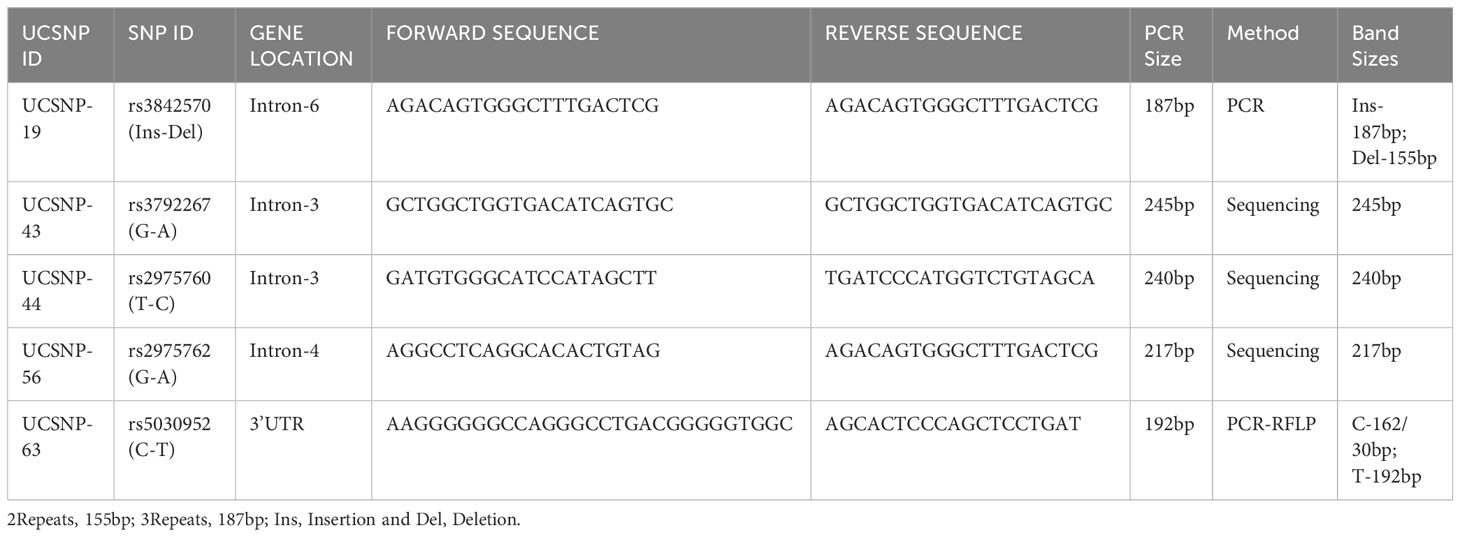
Table 1 Details of CALP10 gene, primer sequences and band sizes along with methodology.
2.5 Restriction enzyme and sanger sequencing analysis
rs3842570 showed 187 bp as an insertion band and 155 bp as a deletion band. The insertion band comprised three repeats, and the deletion comprised two repeats. Each repeat contains a 32 bp sequence (Figure 1). rs5030952 was analyzed by PCR, followed by HhaI digestion for restriction fragment length polymorphism (RFLP) analysis. PCR products were digested with 5 U of HhaI enzyme in a 20 µL reaction volume containing 10x buffer, PCR product, and double distilled water; digestion was started with the final centrifugation for 30 s at 3000 rpm for 18 h at 37°C. Based on the presence of 162 and 30 bp bands confirmed as the CC genotype, the PCR product or TT genotype will have 192 bp and finally, 192, 162, and 30 bp were confirmed as the CT genotype or heterozygous genotype. The digested PCR products were separated by 3% agarose gel electrophoresis to confirm differences between the C and T alleles. For the remaining SNPs (rs3792267, rs2975760, and rs2975762), Sanger sequencing analysis was performed using a combination of specific primers and Big Dye sequencing using a Genetic Analyzer (Applied Biosystems) for multicapillary sequencing analysis. The four nucleotides are represented by different colors: A=green, T=red, G=black, and C=blue. The presence of a single peak indicates homozygosity, whereas the presence of two peaks represents a heterozygous peak that overlaps. UCSNP-19 encodes the genotypes II, ID, and DD. Other SNPs (UCSNP-43 (G-A), UCSNP–44 (T-C), UCSNP56 (G-A), and UCSNP-63 (C-T)) represent particular nucleotide changes (Table 1). Sequencing was performed bidirectionally, and finally, ABI, fasta, and PDF files were received. The sequencing files were analyzed and using BioEdit. PDF files were used as cross-references to reconfirm the analysis. Complete molecular analysis was performed in the G-141 laboratory at KSU, and Sanger sequencing was performed outside the laboratory. To validate the rs3842570 and rs5030952 SNPs, Sanger sequencing was repeated for 10% of the PCR products; the results confirmed 100% accuracy of the PCR and PCR-RFLP analyses (Figure 2). This indicated that the quality control processed in the G-141 laboratory results matched 100% with the validation of the Sanger sequencing results. Finally, the concordance rate was considered to be above 99% among 10% of the random known samples.
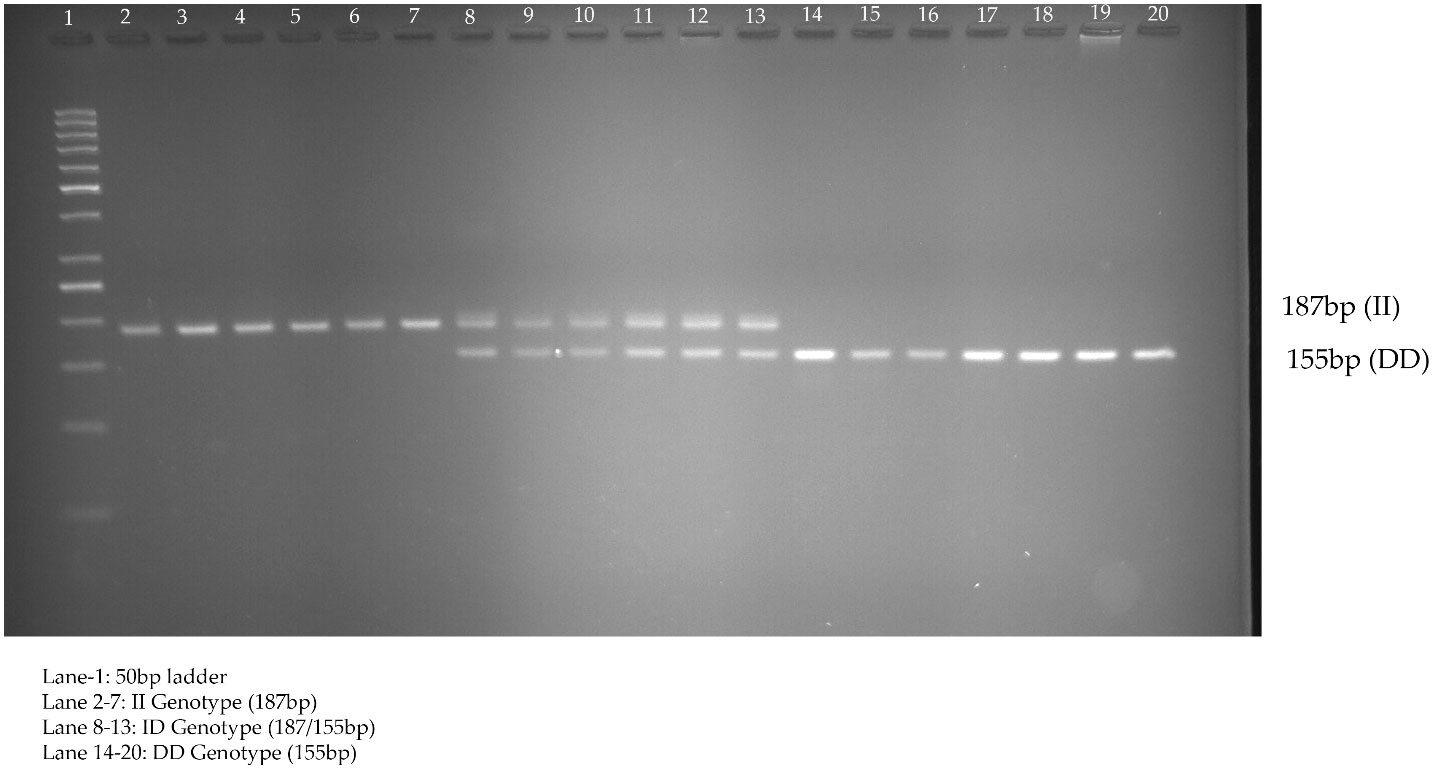
Figure 1 Genotyping of UCSNP-19 (rs3842570) variant studied in PCOS women through direct PCR analysis.
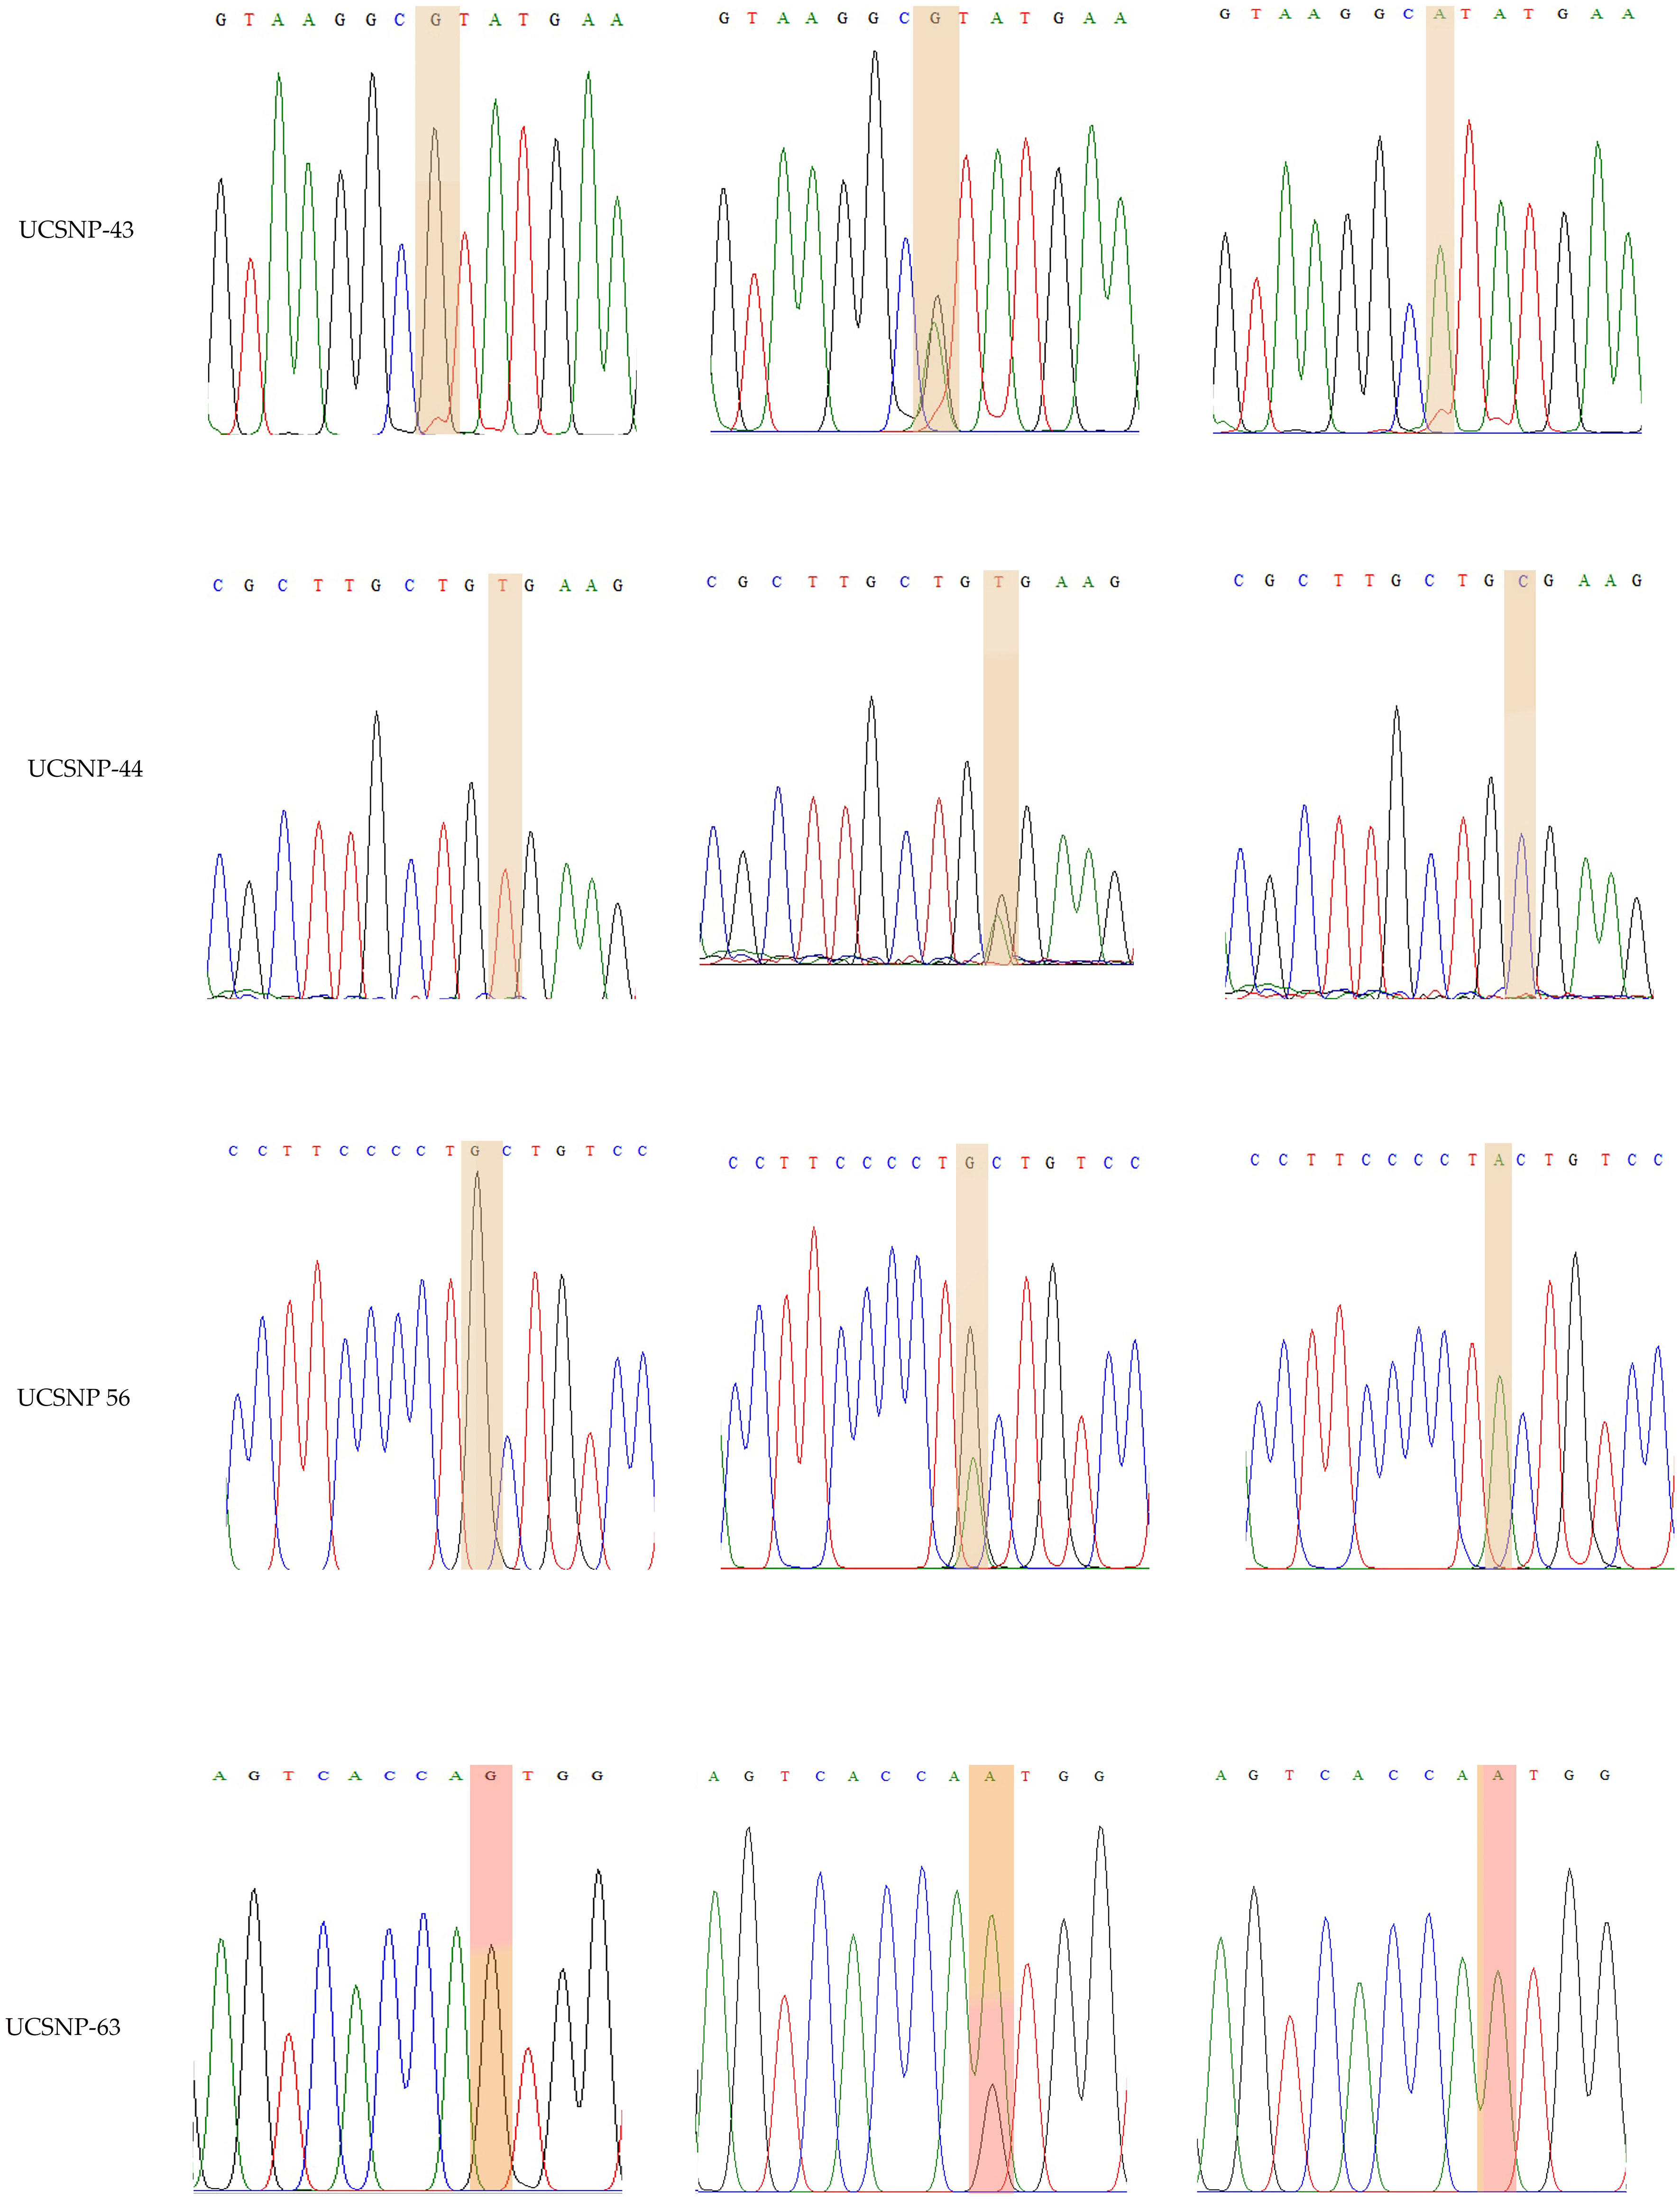
Figure 2 Representation of various traces of Sanger sequencing analysis for UCSNP-43, UCSNP-44, UCSNP56 and UCSNP-63 SNPs in CALP 10 gene.
2.6 Statistical analysis
Biochemical, clinical, anthropometric, and genotypic data were recorded in Microsoft Excel. Categorical or nominal variables were documented as frequencies and percentages (%); numerical variables are indicated as mean ± standard deviation. Continuous data were analyzed using the unpaired t-test; numerical data were analyzed using Fisher’s exact test or χ2-square tests. This study conducted a Shapiro-Wilk test of normality to detect the data as normal distribution. Mann-Whitney U test was applied to analyze the statistical differences between the two groups (PCOS vs non-PCOS women). Using SNPStat software (24), we calculated (i) HWE; (ii) genotype and allele frequencies with 95%CIs, ORs, and p-values; and (iii) haplotypes separately for PCOS and non-PCOS women. A multiple linear regression model was used to test the independent predictors in women with PCOS, along with the SNPs present in CALP10, using SPSS software (25) (version 27.0). ANOVA with logarithmic adjustment of non-normally distributed data and post hoc correction for multiple comparisons was used to compare the three genotype groups in CALP10 using Jamovi software (24). Haploview (version 4.2) software (26) was used to test the LD in the studied women along with the coefficient (D’). Gene–gene interactions, dendrograms, and graphical depletion models were studied using the GMDR model with five SNPs (27). Statistical significance was set at p ≤ 0.05.
3 Results
3.1 Demographic details of PCOS and non-PCOS women using Shapirowilk and Mann-Whitney U test
We selected 180 women (90 women each with and without PCOS) after screening according to Rotterdam criteria. The clinical and demographic features of both groups are shown in Table 2 for Shapiro Wilk test and Table 3 includes Mann-Whitney U tests. Non-PCOS women served as controls for comparison with women with PCOS. Age (31.57 ± 6.72 vs. 30.80 ± 5.58; p=0.230), weight (77.41 ± 12.04 vs. 73.60 ± 11.47; p=0.829), body mass index (BMI; 30.67 ± 4.62 vs. 29.03 ± 4.84; p=0.710), and thyroid-stimulating hormone (TSH; 2.41 ± 0.31 vs. 2.23 ± 0.85; p=0.394) levels and LH/FSH ratio (1.18 ± 0.72 vs. 1.40 ± 0.88; p<0.001) were higher in non-PCOS than in PCOS women. Other parameters such as fasting blood glucose (FBG; 5.03 ± 0.88 vs. 4.77 ± 0.73; p<0.001), fasting insulin (FI; 11.03 ± 6.19 vs. 8.63 ± 1.05; p<0.001), HOMA-IR (2.60 ± 2.02 vs. 1.83 ± 0.35; p<0.001) creatinine (53.48 ± 13.49 vs. 46.86 ± 17.82; p<0.001), total testosterone (TT; 1.87 ± 0.88 vs. 0.86 ± 0.24; p<0.001), follicle-stimulating hormone (FSH; 6.84 ± 2.81 vs. 6.08 ± 2.50; p<0.001), luteinizing hormone (LH; 7.38 ± 4.41 vs. 7.07 ± 2.38; p<0.001), and triglyceride levels (TG; 1.81 ± 1.12 vs. 1.64 ± 0.91; p<0.001), high-density lipoprotein cholesterol (HDLc; 0.62 ± 0.23 vs. 0.48 ± 0.15; p=0.024), family history of PCOS (p<0.0001), and other family histories (p=0.047) were higher in PCOS women and were significantly associated. However, height (159.03 ± 5.23 vs. 158.91 ± 6.82; p=0.166), total cholesterol (TC; 5.06 ± 1.09 vs. 3.10 ± 0.39; p=0.104), and low-density lipoprotein cholesterol (LDLc; 3.62 ± 0.93 vs. 3.20 ± 0.55; p=0.076) were found to be high in PCOS but were not associated when compared with non-PCOS women. The Table 3 analysis of Mann Whitney U test confirmed BMI (p=0.026), FBG (p=0.028), creatinine (p<0.001), FSH (p=0.026), Total testosterone (p<0.001), TC (p<0.001), HDLc (p<0.001) and LDLc (p<0.001) levels were associated.
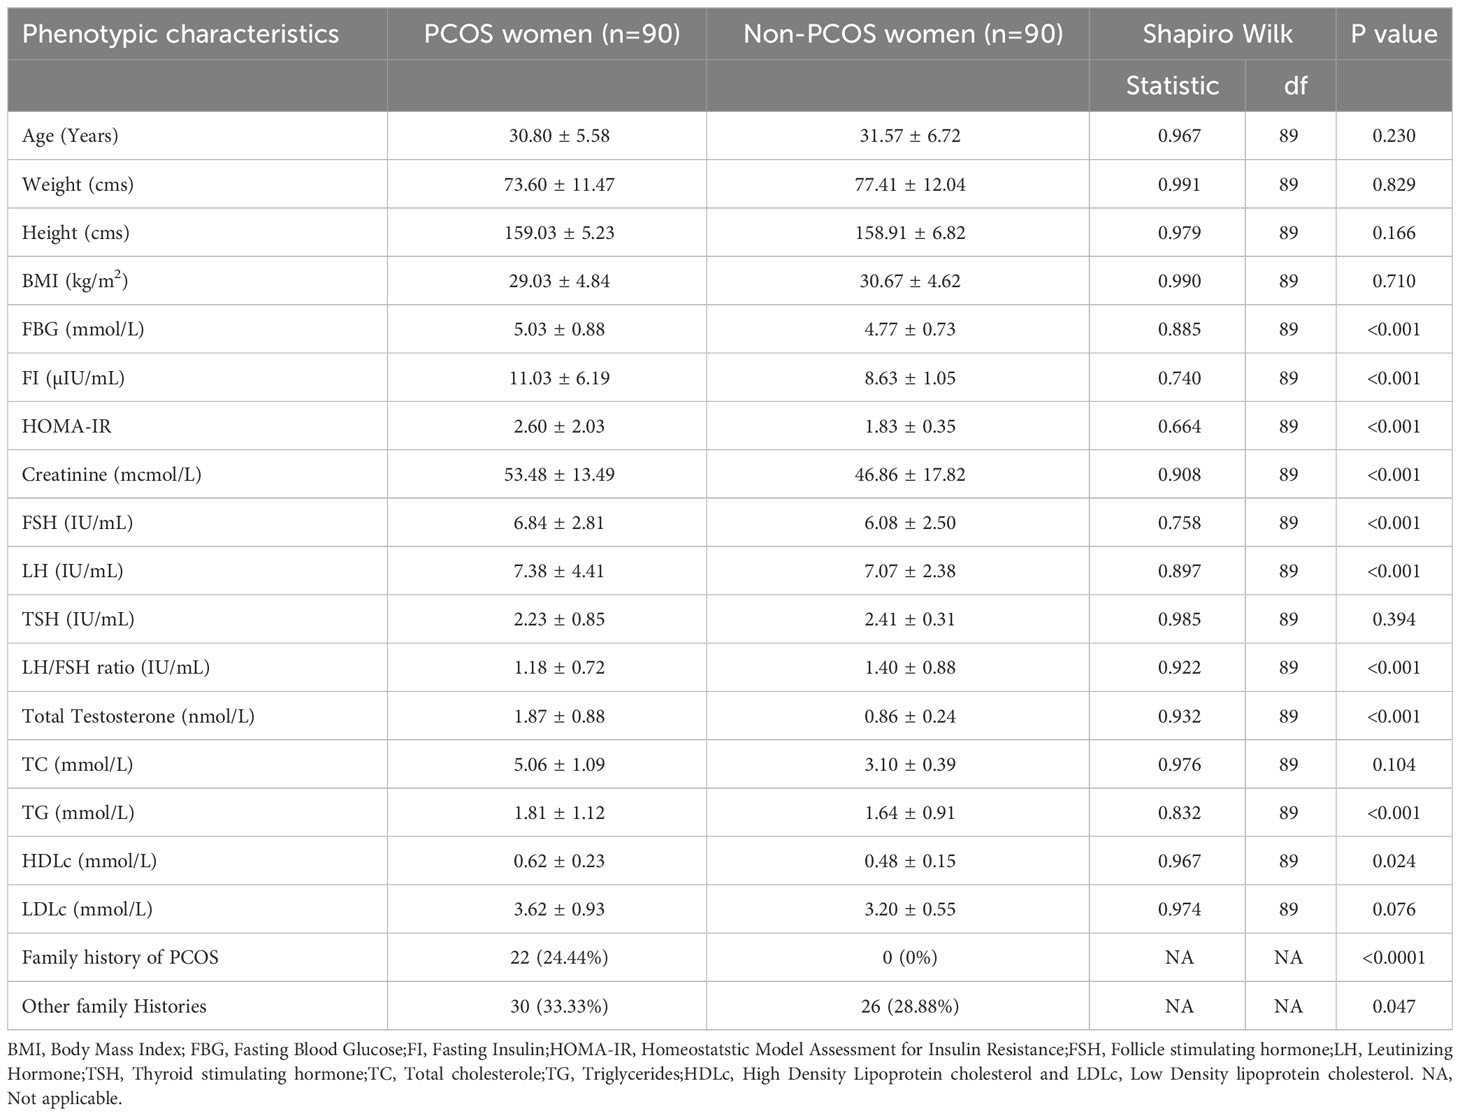
Table 2 Anthropometric and biochemical profiles of PCOS and non-PCOS women.
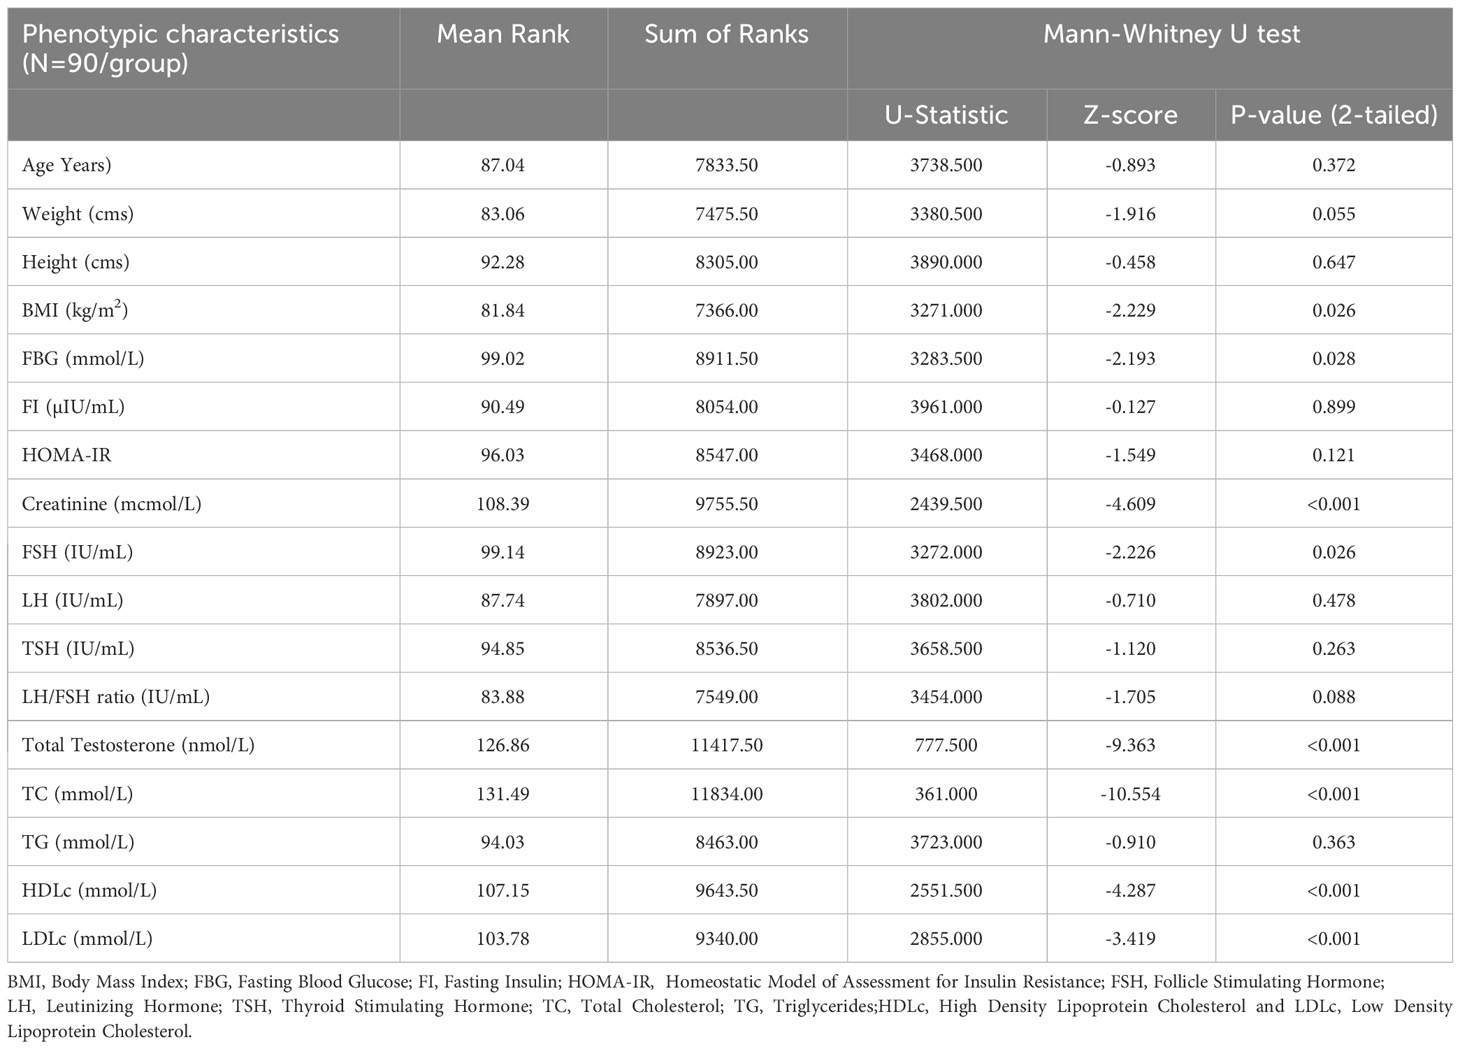
Table 3 Between group comparison for the outcome variables, using a non-parametric Mann-Whitney U test (95% CI, 2-tailed).
3.2 Hardy–Weinberg equilibrium analysis
The genotypes of the five SNPs in the PCOS and non-PCOS groups were found by HWE analysis based on χ2-test results, confirming that the selected PCOS cases were representative of the population (Table 4). The HWE test showed that the distribution of the allele frequencies of rs3842570 (χ2 = 2.13/p=0.14) and rs38425760 (χ2 = 0.62/p=0.42), was consistent in women with PCOS, and that rs3792267 (χ2 = 6.16/p=0.01), rs2975762 (χ2 = 35.41/p<0.0001) and rs5030952 (χ2 = 8.66/p=0.003) SNPs were consistent in non-PCOS women. The overall analysis confirmed that the included population was representative of the entire population for genetic analysis.
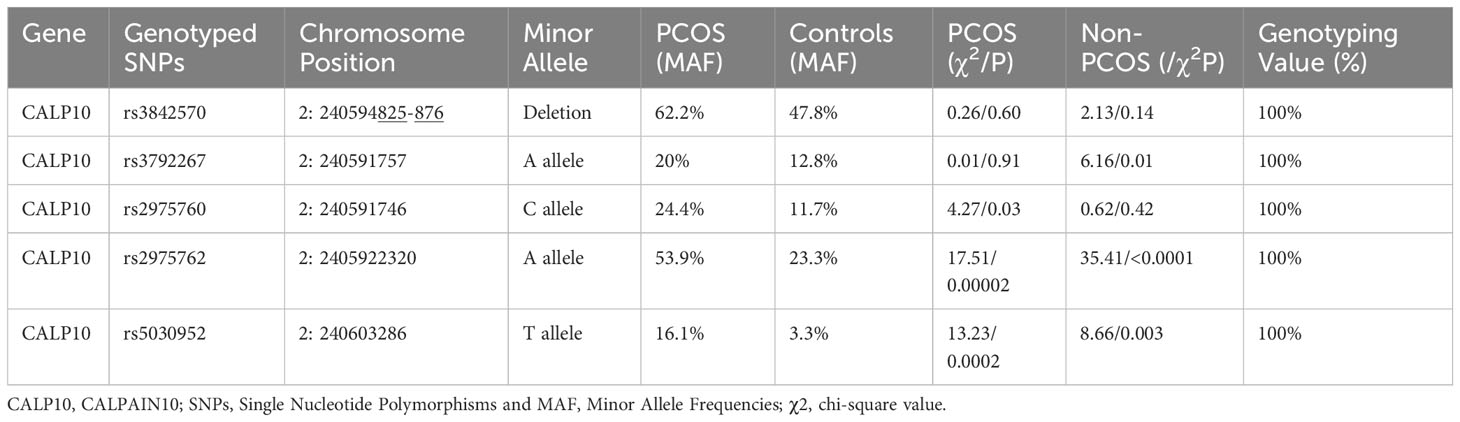
Table 4 The primary information on genetic SNPs in the CALP10 gene and HWE analysis.
3.3 Genotyping analysis for intronic SNPs in CALP10
Table 5 shows the genotypes identified between PCOS cases and non-PCOS controls among five different genotypes: rs3842570 (UCSNP-19), rs3792267 (UCSNP-43), rs2975760 (UCSNP-44), UCSNP56 (rs2975762), and UCSNP-63 (rs5030952). UCSNP-19 (rs3842570) is an insertion (I)-deletion (D) (ID) SNP in CALP10. Genotype II includes 187 bp, which indicates triplet repeats of 32 bp, while genotype DD contains 155 bp, which indicates double repeats of 32 bp (Figure 1). In women with PCOS, the II, ID, and DD genotypes were 15.6%, 44.4%, and 40%, and in women without PCOS, 31.1%, 42.2%, and 26.7%, respectively. Statistical association was found only with the dominant model (ID+DD vs. II: OR, 2.45 (95%CI: 1.18–5.05); p=0.01]]. No significant difference was found between genotypes and other genetic models (ID vs. II: OR, 2.11 (95%CI: 0.96–4.59); p=0.02; DD vs. II: OR, 1.71 (95%CI: 0.78–3.74); p=0.07; DD+II vs. ID: OR, 0.91 (95%CI: 0.50–1.64); p=0.76 and DD vs. II+ID: OR, 1.83 (95%CI: 0.97–3.44); p=0.057). The combination of ID and DD genotypes confirmed 2.4 times higher risk associated with PCOS. We did not observe any significant association between UCSNP-43 (rs3792267) and PCOS. The frequencies of the GG, GA, and AA genotypes in the PCOS cases were 66.8%, 26.7%, and 6.7%, and in non-PCOS, 76.7%, 21.1%, and 2.2%, respectively. None of the genotypes (GA vs. GG: OR, 1.45 (95%CI: 0.72–2.91); p=0.20; AA vs. GG: OR, 3.45 (95%CI: 0.67–17.74); p=0.11) or genetic models (GA+AA vs. GG: OR, 1.64 (95%CI: 0.82–3.16); p=0.13; AA+GG vs. GA: OR, 0.73 (95%CI: 0.36–1.46); p=0.38; AA vs. GA+GG: OR, 3.14 (95%CI: 0.61–16.01); p=0.14) showed significant association. Hence, rs3792267 is not associated with PCOS in Saudi women.
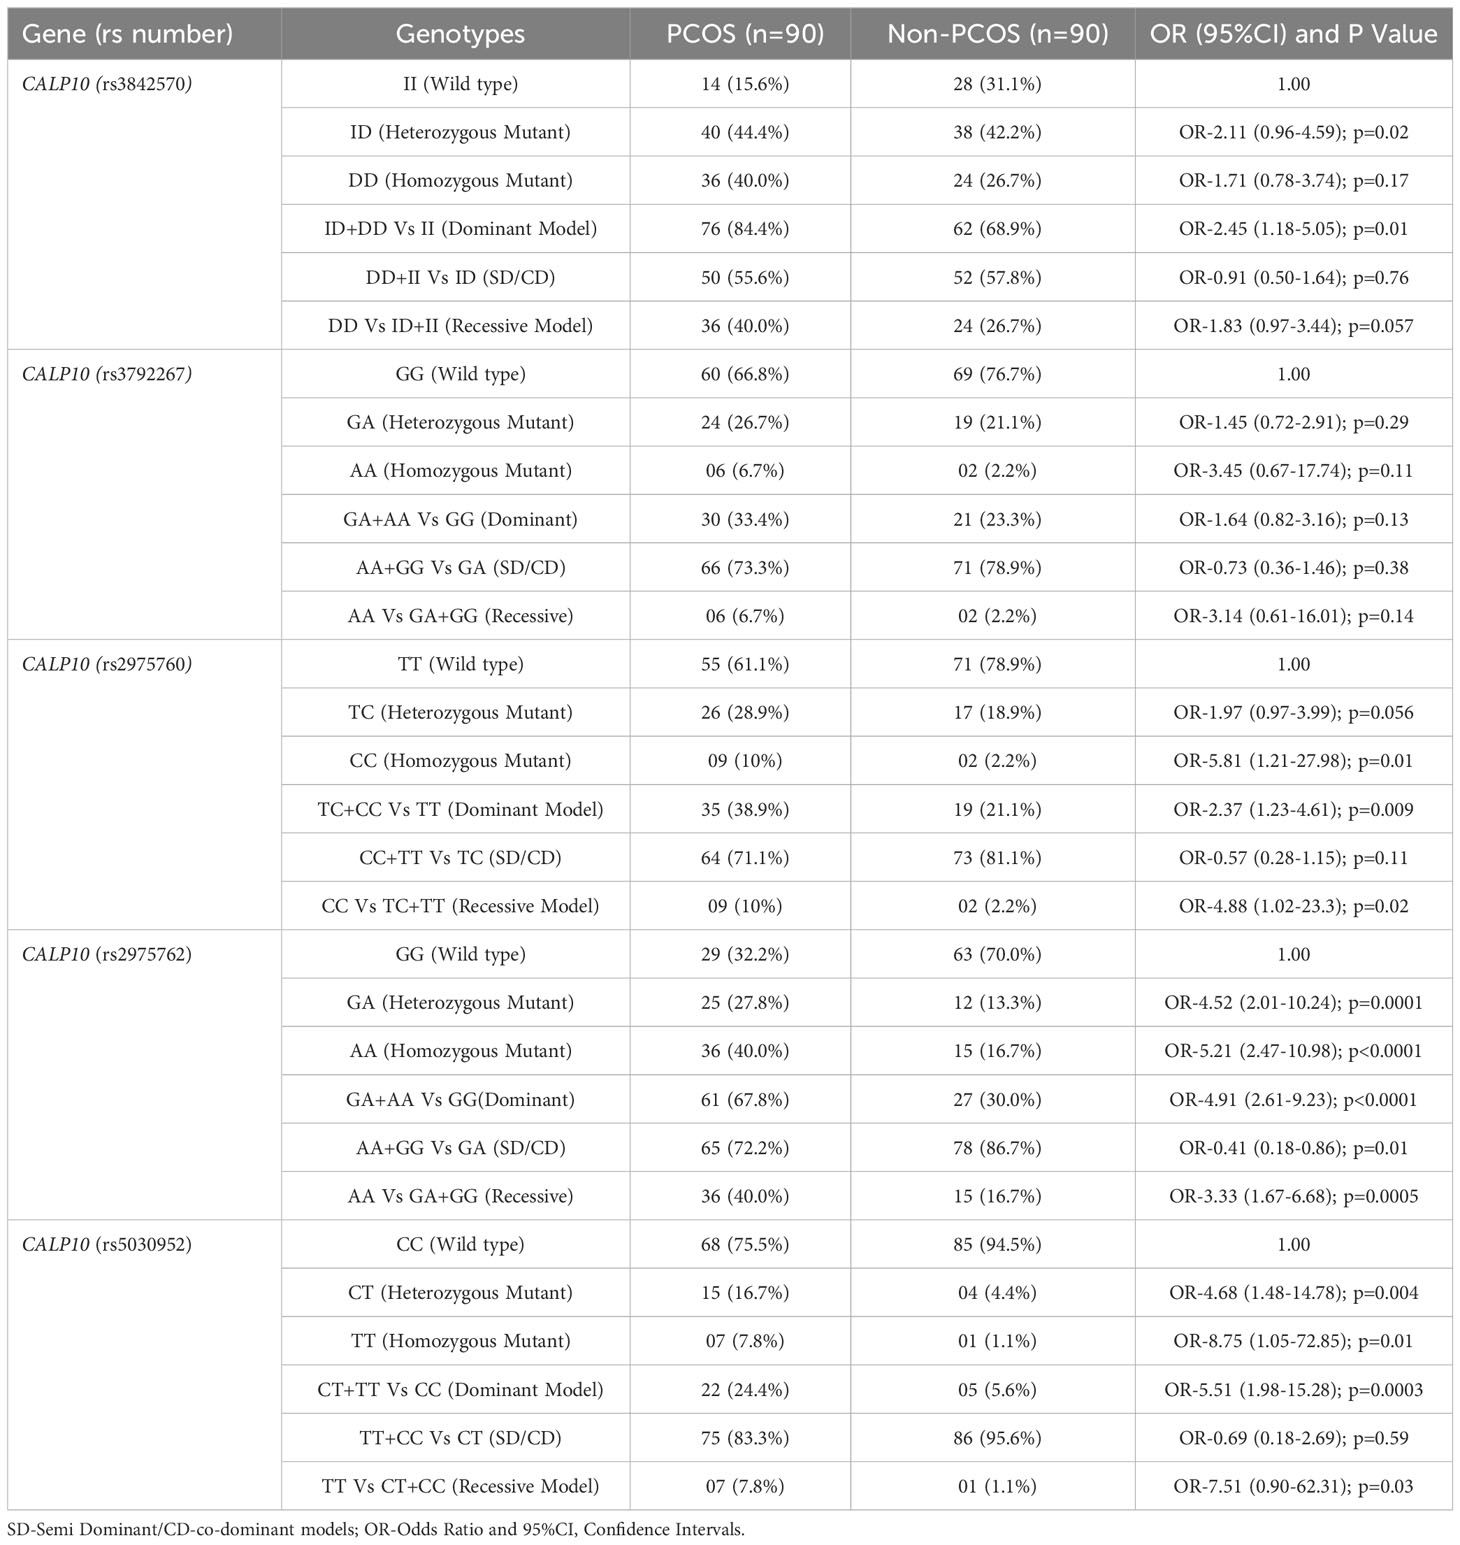
Table 5 Genotype frequencies and genetic models for PCOS and non-PCOS women in all 5 SNPs present in CALP10 gene.
The TT, TC, and CC genotype distribution for UCSNP-44 (rs2975760) in PCOS and non-PCOS subjects was 61.1%, 28.9%, 10%, and 78.9%, 18.9%, and 2.2%, respectively. Genotype analysis (TC vs. TT: OR, 1.97 (95%CI: 0.97–3.99); p=0.056; CC vs. TT: OR, 5.81 (95%CI: 1.21–27.98); p=0.01)) confirmed a positive association with dominant (TC+CC vs. TT: OR, 2.37 (95%CI: 1.23–4.61); p=0.009) and recessive models (CC vs. TC+TT: OR, 4.88 (95%CI: 1.02–23.3); p=0.02). However, the co-dominant model CC+TT vs TC: OR-0.57 (95%CI: 0.28-1.15); p=0.11) was not associated (p=0.11).
UCSNP56 (rs2975762) was significantly associated with PCOS women among genotypes (GA vs. GG: OR, 4.52 (95%CI: 2.01–10.24); p=0.0001; vs. AA vs. GG: OR, 5.21 (95%CI: 2.47–10.98); p<0.0001) and dominant (GA+AA vs. GG: OR, 4.91 (95%CI: 2.61-9.23); p<0.0001) and recessive models (GA vs. GG: OR, 3.33 (95%CI: 1.67–6.68); p=0.0005). The co-dominant model (AA+GG vs GA: OR-0.41 (95%CI: 0.18-0.86); p=0.01) was not associated. The overall prevalence of GG, GA, and AA genotypes in patients with PCOS was 32.2%, 27.8%, and 40%, and for non-PCOS, 70%,13.3%, and 16.7%, respectively.
UCSNP-63 (rs5030952) was the final SNP studied. The CC, CT, and TT genotypes present in both PCOS (75.5%, 16.7%, 7.8%) and non-PCOS (94.5%, 4.4%, 1.1%) subjects were strongly associated with both the genotypes (CT vs. CC: OR, 4.68 (95%CI: 1.48–14.78); p=0.004; TT vs. CC: OR, 8.75 (95%CI: 1.05–72.85); p=0.0003). Among genetic models, only the dominant model (TT+CT vs. CC: OR, 5.51 (95%CI: 1.98–15.28); p=0.0003) was associated. and other models such as Recessive: TT vs CT+CC: OR-0.69 (95%CI: 0.18-2.69); p=0.59) and co-dominant models (TT+CC vs CT: OR-7.51 (95%CI: 0.90-62.31); p=0.03), negative association was documented.
3.4 Overall allele frequency analysis in five CALP10 SNPs
Allele frequencies in PCOS and non-PCOS subjects are shown in Table 6. Among the five CALP10 SNPs studied, 80% differed significantly between the PCOS and non-PCOS groups. D allele frequency in UCSNP-19 (rs3842570) was 62.2% and 47.8% in cases and controls, and 52.2% and 37.8% in controls and cases of the recruited women. The allelic association was documented [D vs. I: OR, 1.81 (95%CI: 1.18–2.74); p=0.005]. The allele frequencies in UCSNP-43 (rs3792267) were not statistically associated due to the presence of 20% and 12.8% of A alleles and 80% and 87.2% of G alleles in both PCOS and non-PCOS subjects [A vs. G: OR, 1.71 (95%CI: 0.96–3.11); p=0.06]. The remaining SNPs, UCSNP-44 (rs2975760), UCSNP 56 (rs2975762), and UCSNP-63 (rs5030952), were significantly associated with PCOS and non-PCOS groups. The minor allele frequency (MAF) of the C allele was 24.4% in PCOS women and 11.7% in non-PCOS women [C vs. T: OR, 2.45 (95%CI: 1.39–4.32); p=0.01]. The MAF of the A allele in UCSNP56 was high in PCOS women (53.9%) and 23.3% in non-PCOS subjects [A vs. G: OR, 3.84 (95%CI: 2.44–6.04); p<0.0001. UCSNP-63 had a high T allele frequency in PCOS women (16.1%) and only 3.3% in non-PCOS women [T vs. C: OR, 5.57 (95%CI: 2.25–13.78); p=0.0004].
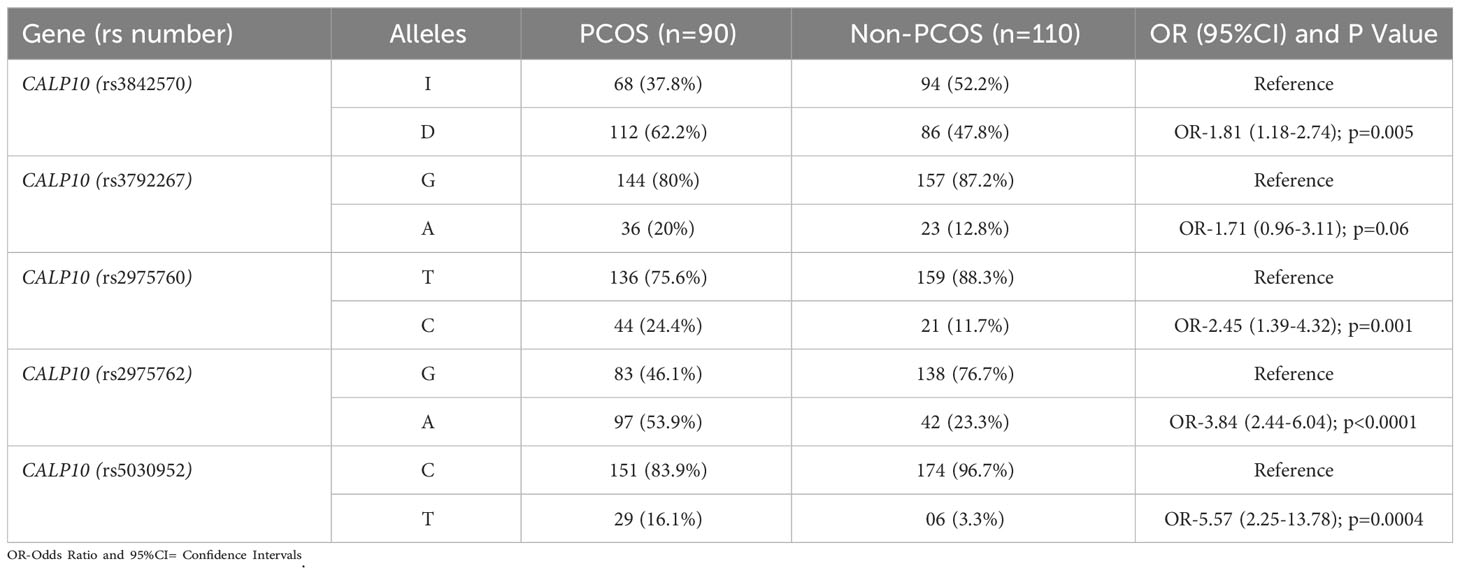
Table 6 Genetic Variants of 5 SNPs present in CALP10 gene and allele frequencies in PCOS and non-PCOS women.
3.5 Multiple linear regression model
The dependent and independent variables in the multiple linear regression model are shown in Table 7. The dependent variables were age, weight, BMI, FBG, FI, creatinine, FSH, LH, TSH, TT, TC, TG, HDL-c, and LDL-c levels. The rs3842570, rs3792267, rs2975760, rs2975762, and rs5030952 SNPs were considered these as dependent variables. The genotypes of the independent variables were recorded as 1 for homozygous normal variants, 2 for heterozygous variants, and 3 for homozygous variants. The analysis performed with 14 dependent variables and five independent variables showed that FBG levels were significantly associated with PCOS (p<0.001); the remaining 13 variables showed non-significant associations (p>0.05).
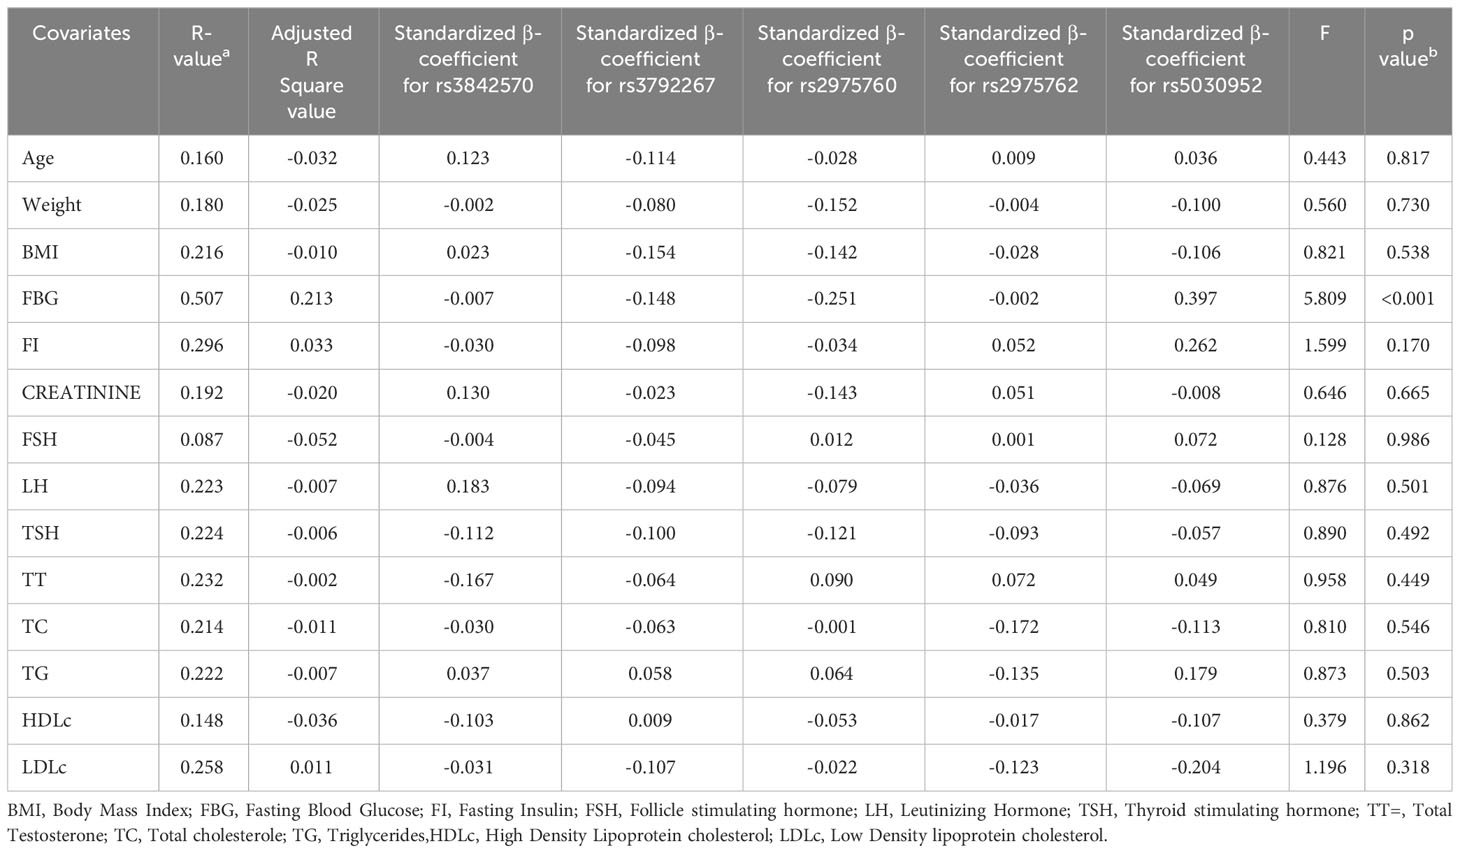
Table 7 Analysis of Multiple linear regression model in SNPs present in CALP10 gene and PCOS covariates.
3.6 ANOVA for CALP10 SNPs and PCOS
ANOVA (Table 8) confirmed the association of FSH (p=0.0001) and TC (p=0.09) with UCSNP-19; of FI (p=0.002) and TG (p=0.01) with UCSNP56; and of FBG (p=0.001), FI (p=0.004), FSH (p=0.02), and LDL-c (p=0.04) with UCSNP-63. However, the other SNPs were not associated with any of the covariates. The five SNPs in PCOS women were associated with higher counts for age (31.73 ± 5.62), weight (76.01 ± 10.26), and BMI (29.94 ± 3.96), and levels of FBG (6.01 ± 0.49), FI (17.17 ± 8.46), creatinine (57.67 ± 8.62), FSH (11.72 ± 6.65), LH (8.12 ± 4.74), TSH (2.51 ± 0.85), TT (2.14 ± 1.06), TC (5.50 ± 1.28), TG (2.48 ± 1.68), HDL-c (0.71 ± 0.25), and LDL-c (4.03 ± 1.32). Most of the high counts were confirmed in UCSNPs 19, 44, 56, and 66; these four SNPs were genotypically associated. Thus, among patients with PCOS, a potential relationship was documented with specific biochemical parameters, as well as with weight and BMI.
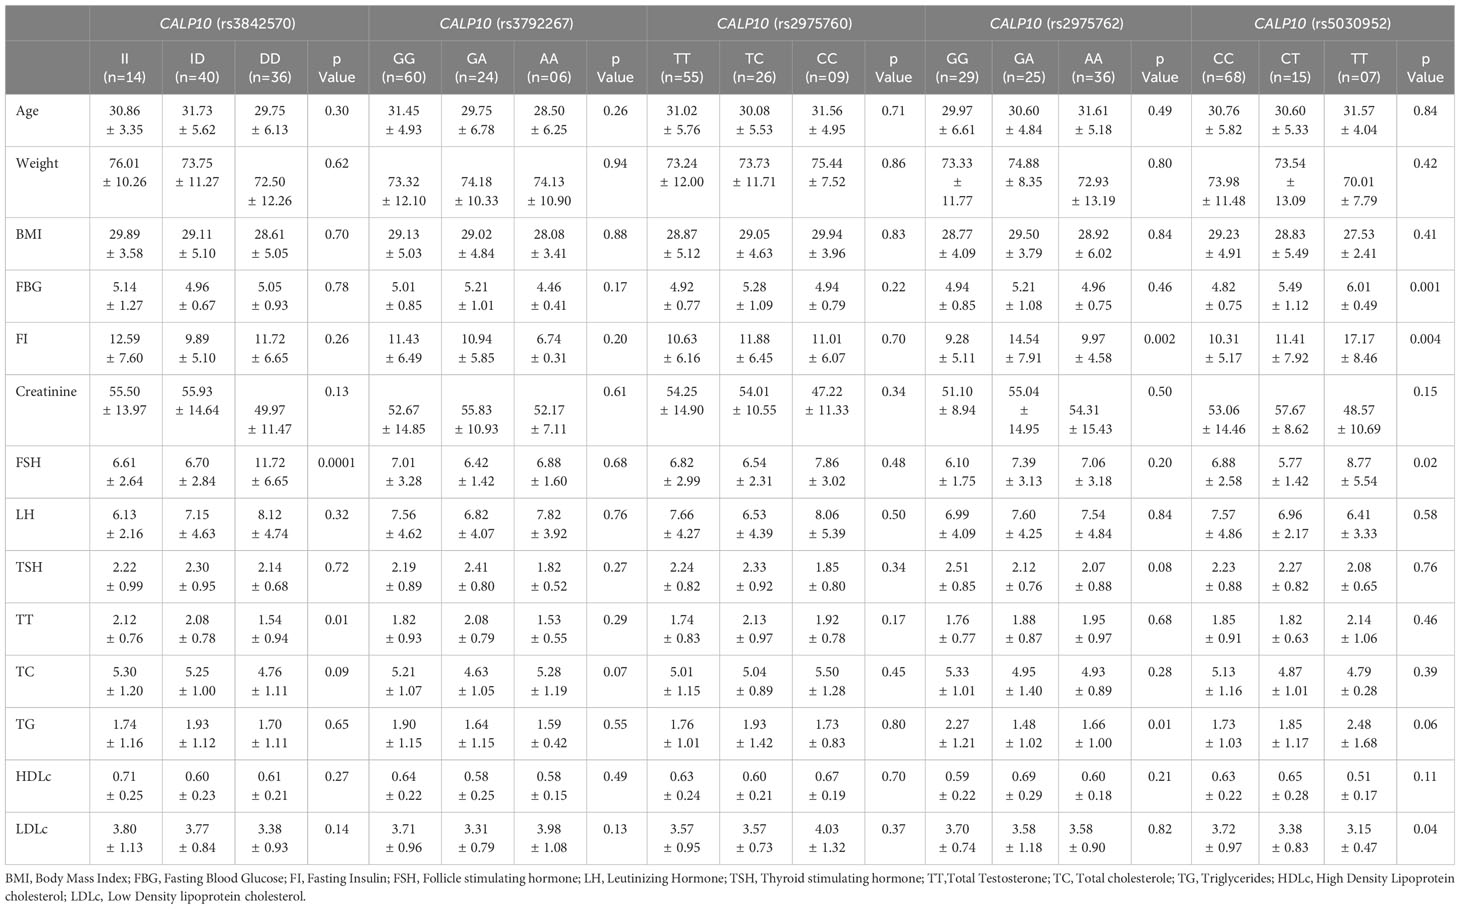
Table 8 One-way ANOVA analysis studied between SNPs in CALP10 and PCOS covariates.
3.7 Haplotype analysis for CALP10 and PCOS
Haplotype analysis revealed a genetic association between SNPs in PCOS and non-PCOS women. The combination of D-A-T-G (p=0.04), D-G-C-A (p=0.01), D-A-T-A (p=0.01), I-G-C-G (p=0.04), D-G-C-G (p=0.02), I-A-T-G (p=0.03), I-A-C-A (p=0.01), D-A-C-A (p=0.006), I-A-C-G (p=0.01), and I-A-T-A (0.00) alleles showed association in PCOS women. In non-PCOS women, I-A-T-G (p=0.03), D-A-C-A (p=0.01), D-A-C-G (p=0.01), and I-A-T-A (0.00) showed a strong association. However, other SNPs were not associated (Table 9).
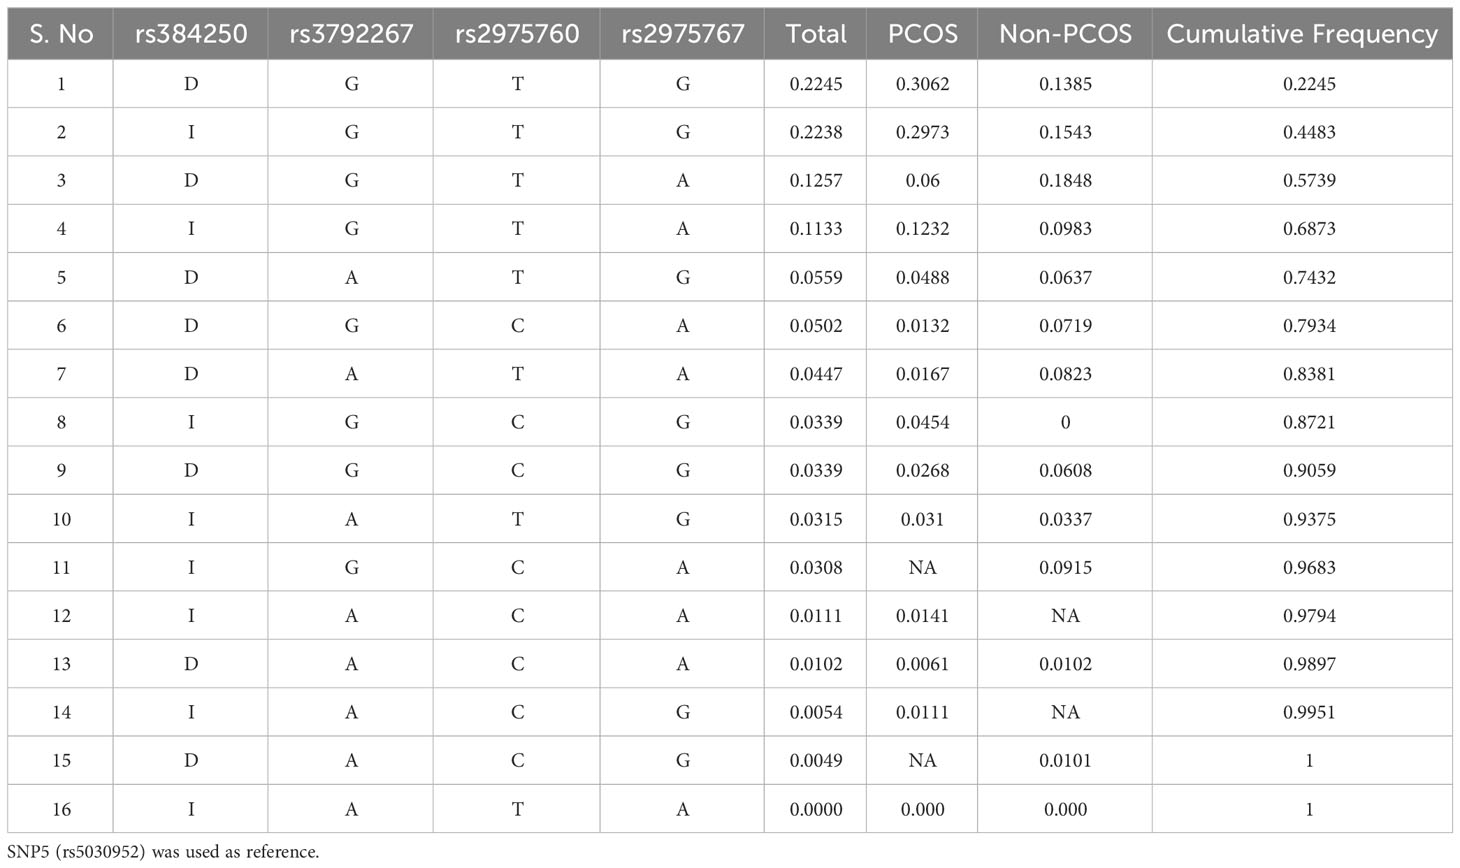
Table 9 Haplotype Analysis studied between PCOS and non-PCOS genotypes in 5 SNPs.
3.8 Linkage disequilibrium analysis
LD analysis revealed genetic associations between these five SNPs in women with PCOS. A strong association was detected between all combinations (Table 10 and Figure 3), except for the combination of rs3972267 and rs5030952 in women without PCOS (p=0.058). Haplotype analysis of pairwise correlations closely mirrored the precise distance between SNPs. The combination of rs3972267 and rs5030952 in women without PCOS was an unsuitable predictor in CALP10 (Figure 4). The LD analysis confirmed that PCOS was associated and that CALP10 had a role, except for the combination of rs3972267 and rs5030952 in non-PCOS women.
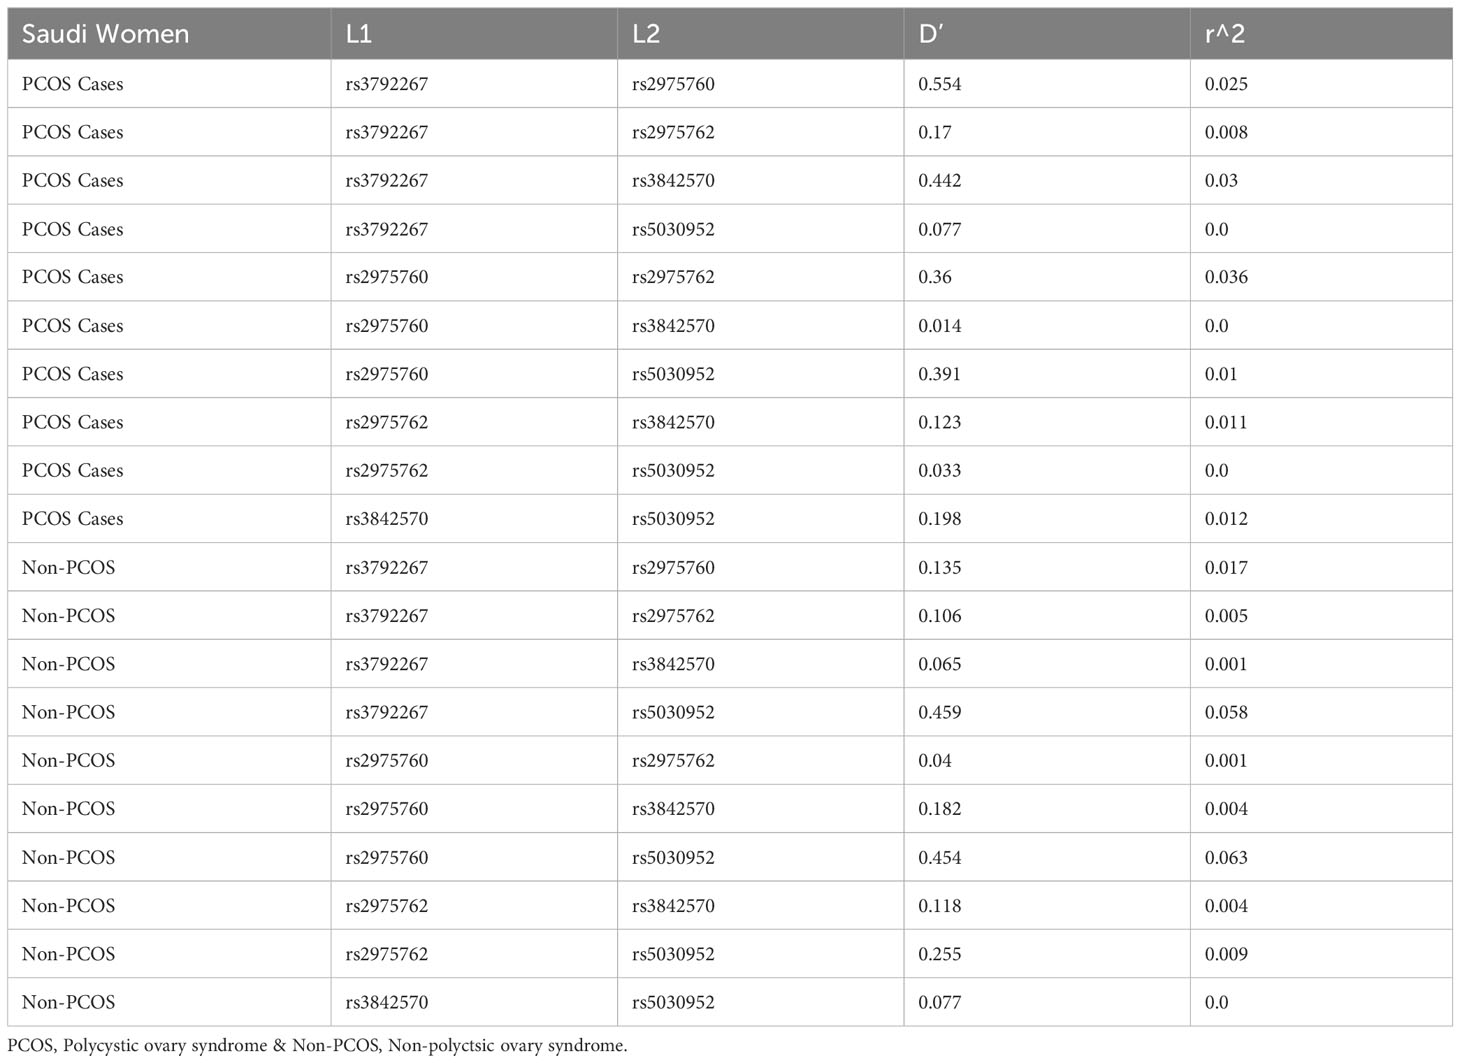
Table 10 Linkage Disequilibrium analysis studied in Saudi women and 5 SNPs in CALP10 gene.
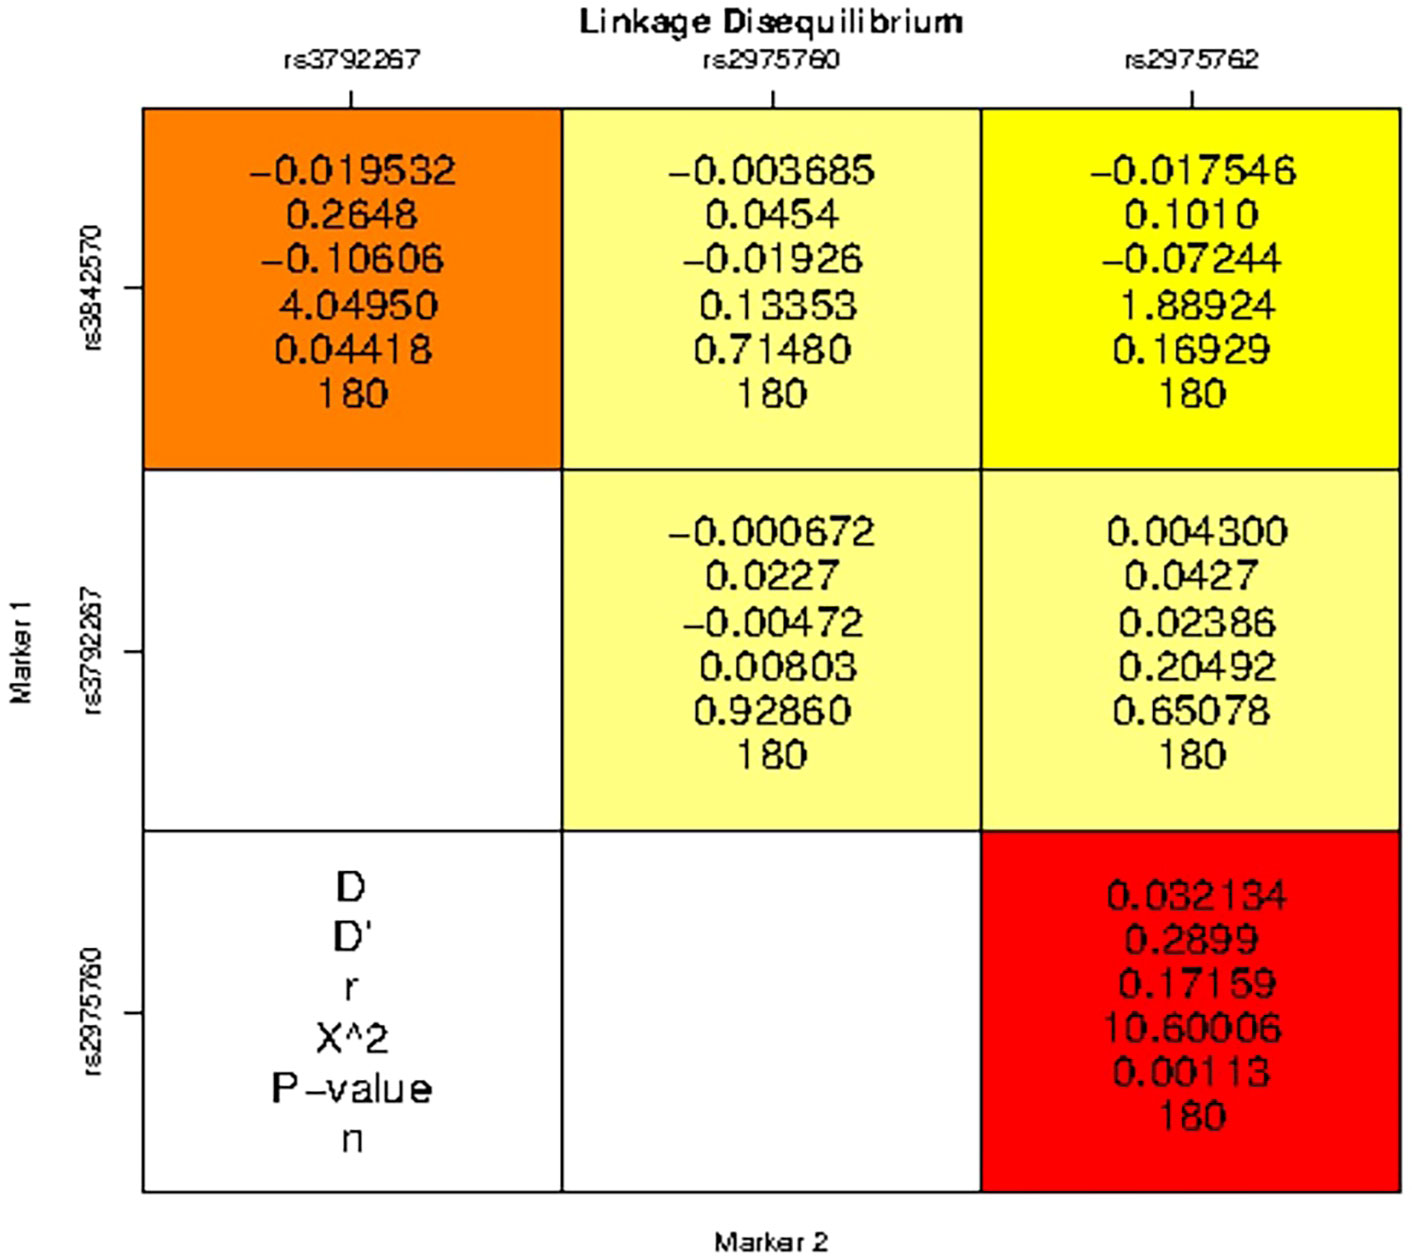
Figure 3 Linkage disequilibrium (LD) analysis studies between SNPs in CALP10 gene and PCOS disease risk.
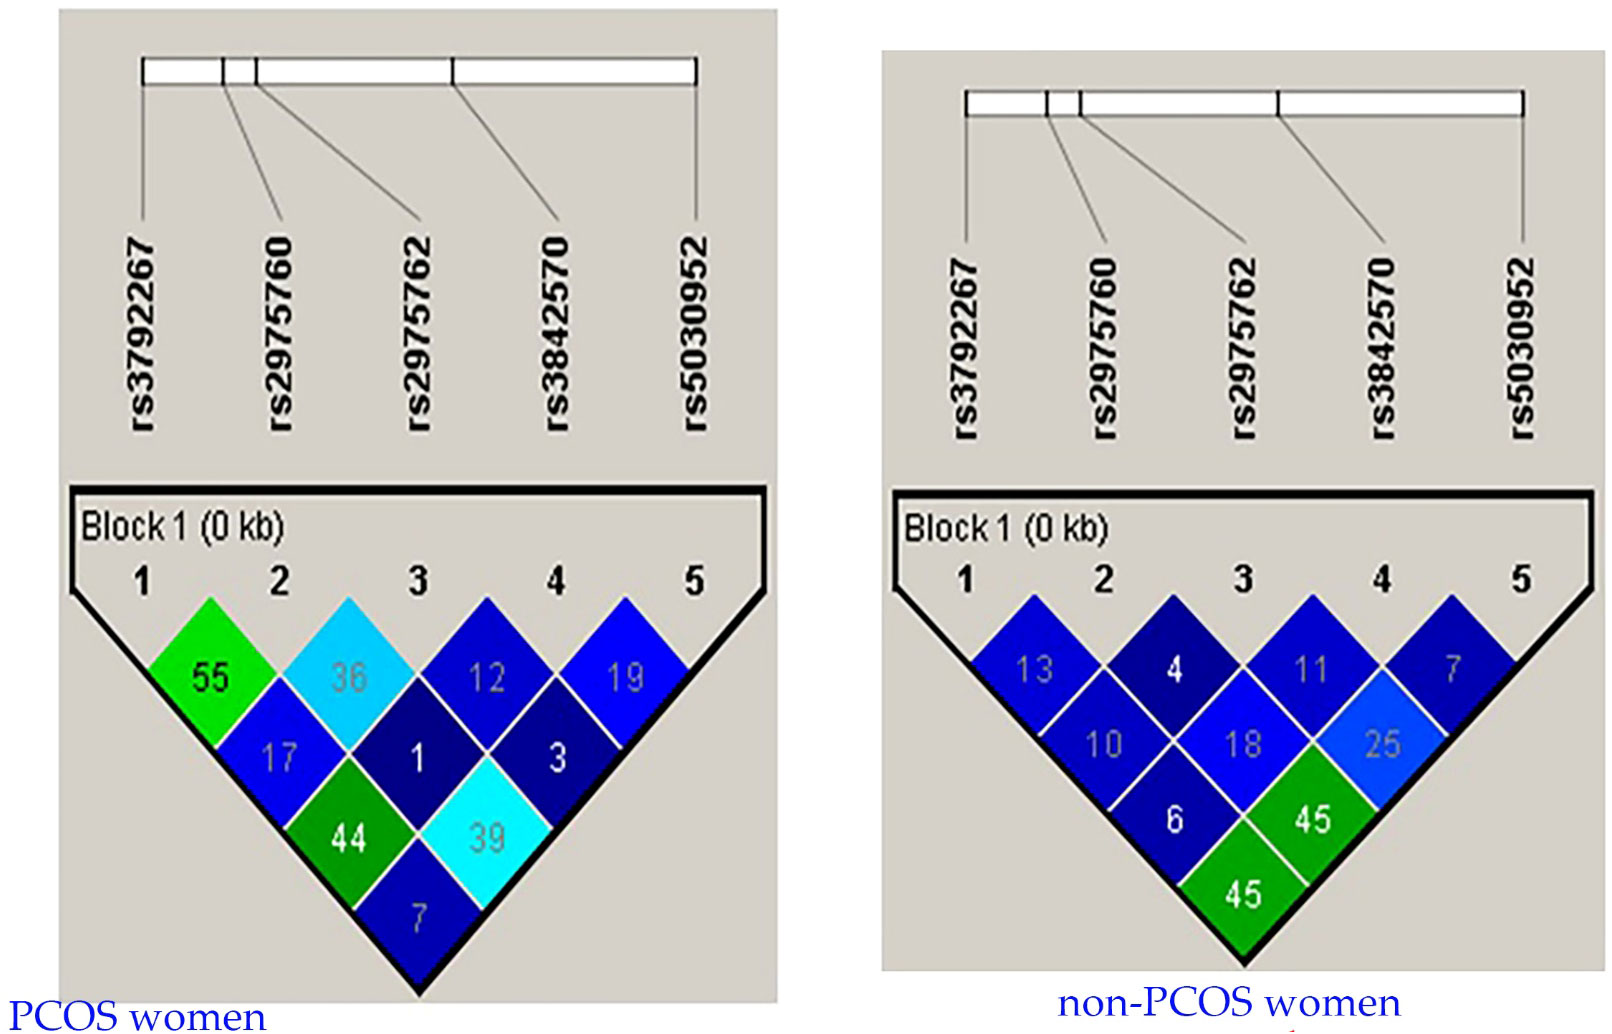
Figure 4 r2 pairwise measures of LD analysis between 5 SNPs in CALP10 gene of Saudi women with PCOS and non-PCOS.
3.9 Generalized multifactor dimensionality reduction model analysis
3.9.1 Gene–gene interaction analysis
Table 11 describes the details of gene–gene interactions in women with PCOS. The GMDR analysis of gene–gene interactions indicated that the S1 model (rs5030952) and five-factor model, i.e., S1-S5 (rs5030952, rs2975760, rs3842570, rs32975762, rs5030952), had 10/10 cross-valid consistency and high-test accuracy (S1-S4, 0.9–0.667) when compared with the five-factor model (0.7278). The best model was the S1 gene–gene interaction model. The statistical test set in the S1 model (p<0.0001) was highly significant, followed by the two- and five-factor models of gene–gene interaction (p<0.05). This indicates a strong gene–gene interaction in the S1 model for PCOS risk among the five CALP10 SNPs.
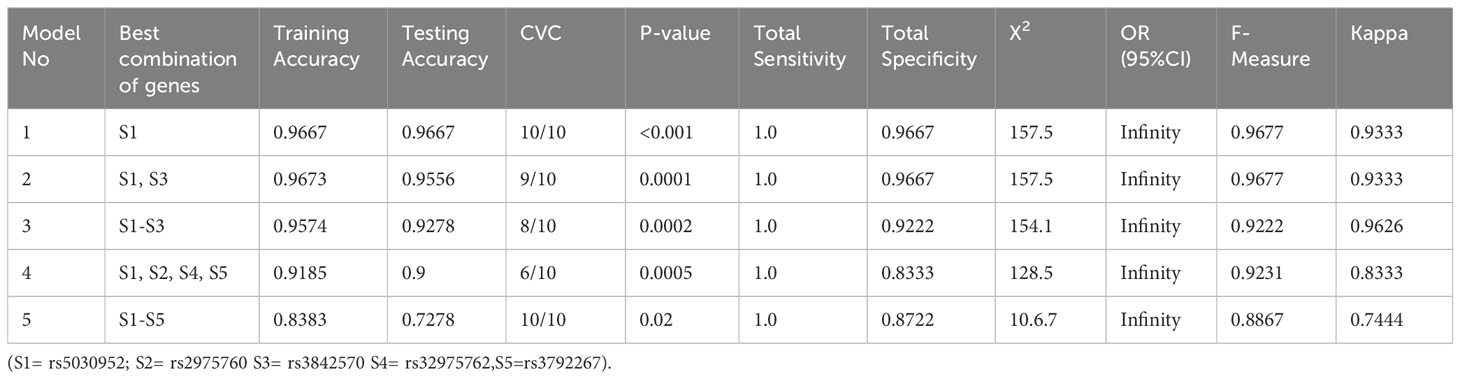
Table 11 Determination of PCOS risk by gene-gene interaction analysis.
3.9.2 Dendrogram model
In contrast to the empirical dendrogram presented in Figure 5, the dendrograms from randomly shuffled simulations were flat. rs3842570 had a green streak, whereas the remaining SNPs had blue streaks. The dendrogram analysis did not show a strong association in women with PCOS.
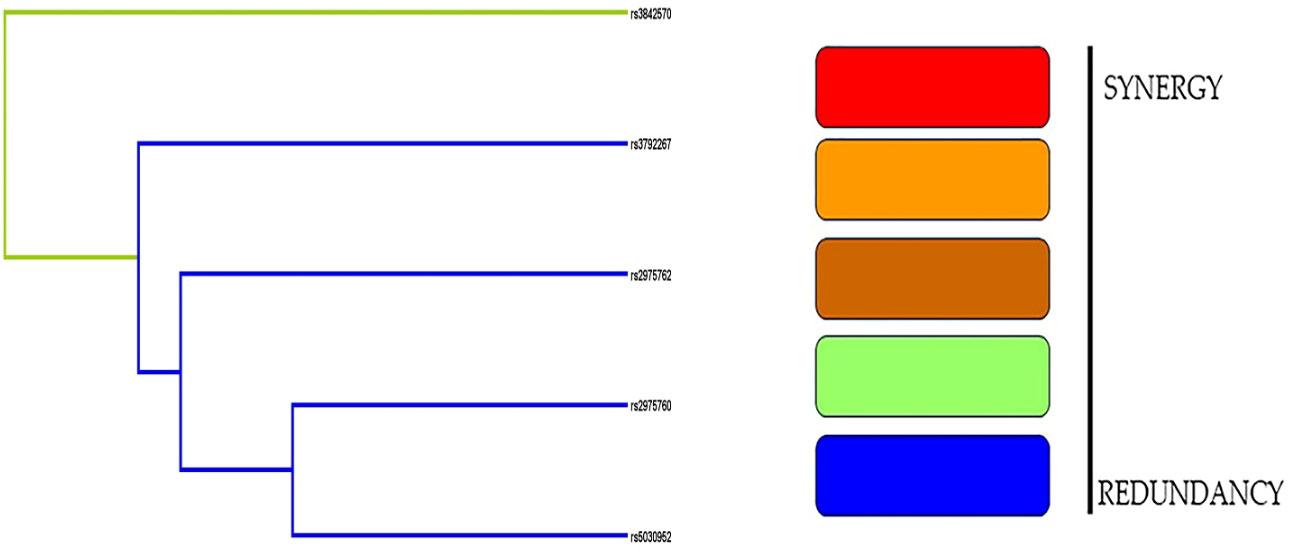
Figure 5 Dendogram analysis revealed the interaction between 5 SNPs and PCOS women.
3.9.3 Graphical depletion analysis
The darker cells indicate a combination of high risks, and the light cells indicate low risks (Figure 6). A blank cell indicates the absence of genotype data. The bar confirms the hypothetical case on the left and the control on the right. The graphical depletion model showed only a limited high-risk combination in S1 between rs2975760 and rs3842570.
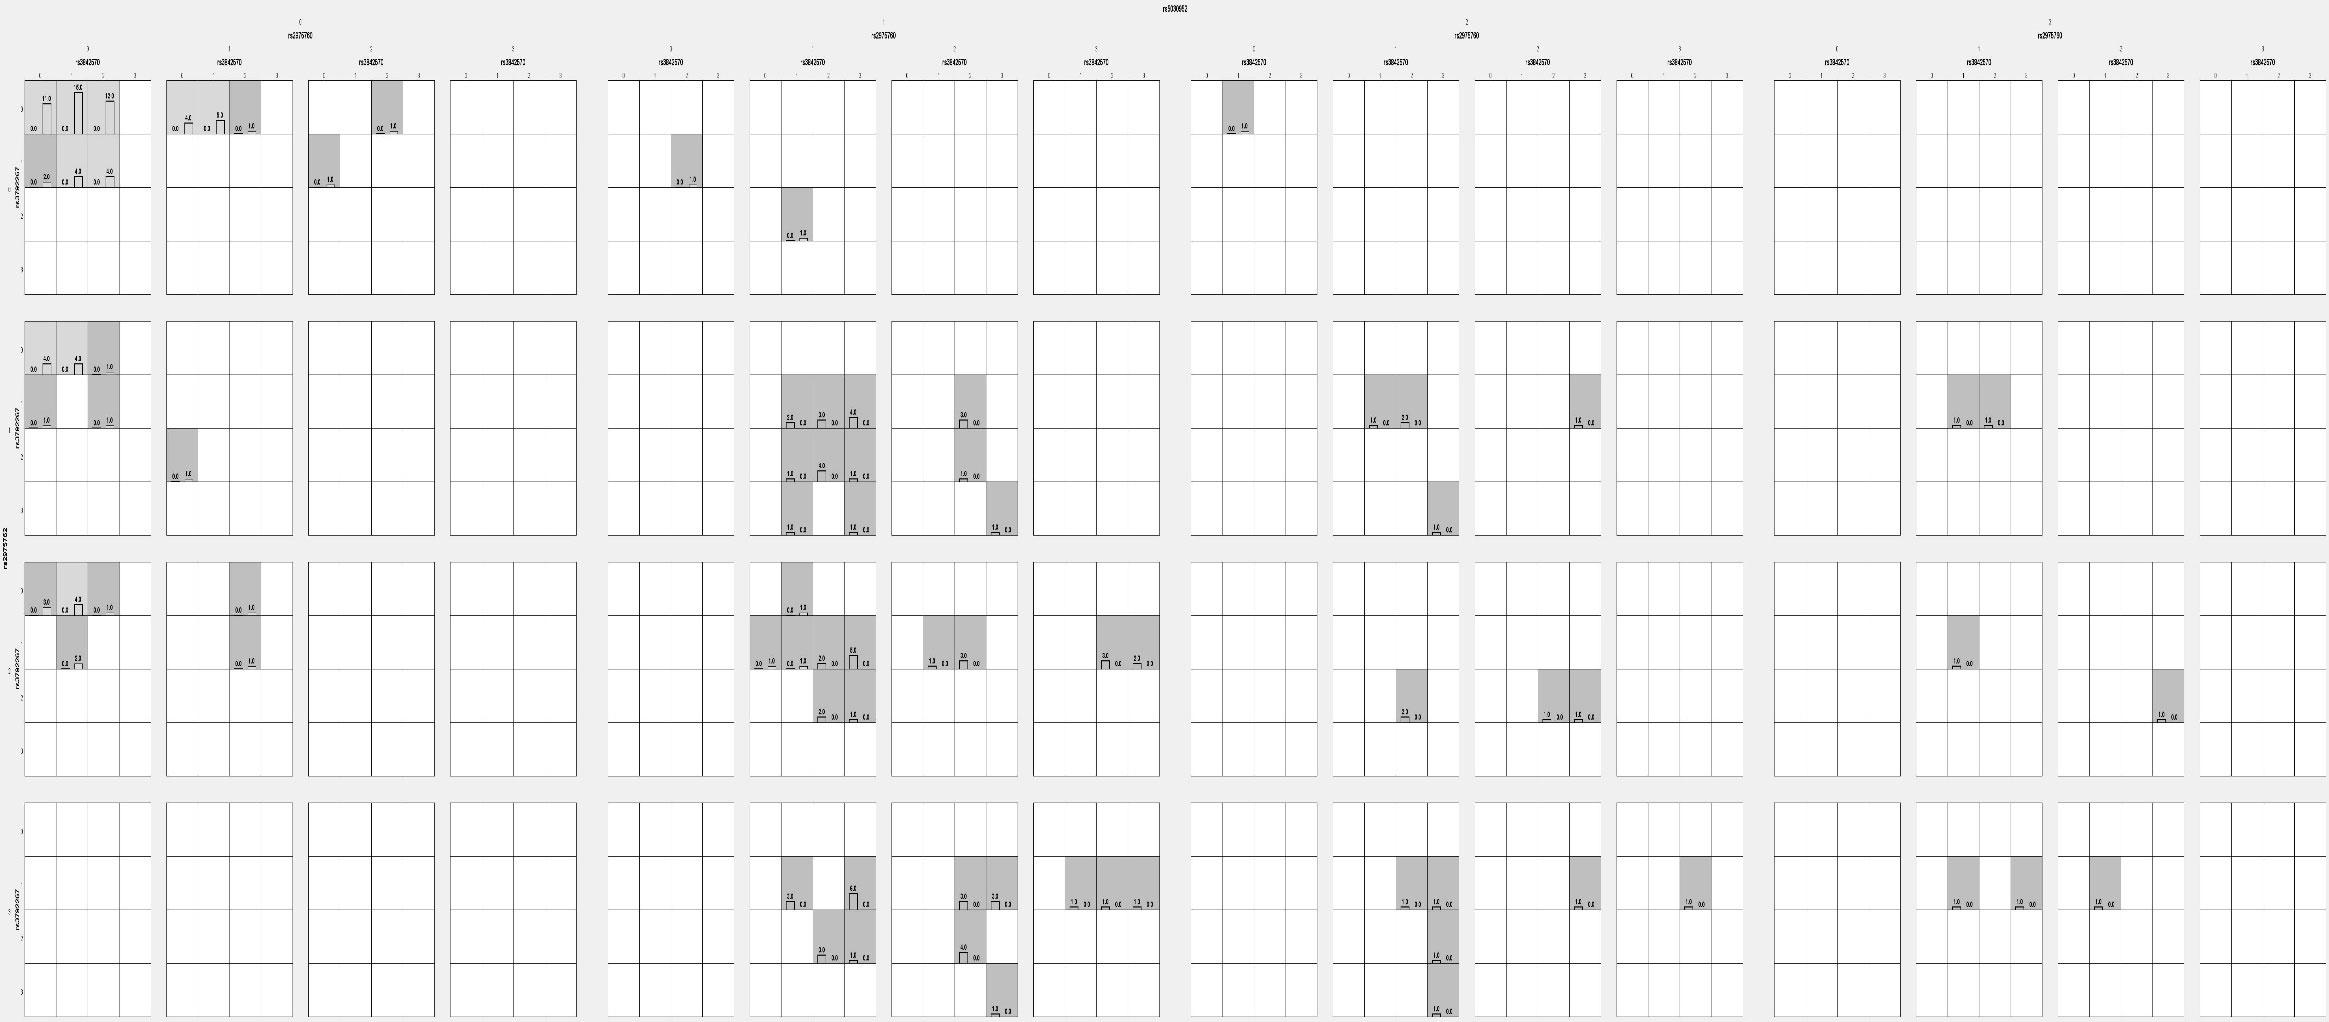
Figure 6 Analysis of Graphical depletion studied model using GMDR analysis in PCOS women with 5 SNPs.
3.10 Classification of FBG levels according to BMI categorization in PCOS and non- PCOS women
The Table 12, in this study has categorized FBG levels according to different BMI categories such as Normal BMI (<24.9 kg/m2), Overweight (25.0-29.9 kg/m2), obesity (30.0-34.9 kg/m2) and morbid obesity (>35.0 kg/m2). When BMI levels measured between PCOS and non-PCOS, none of them were found to be associated in any of the classification (p<0.05). When it comes to FBG between PCOS and non-PCOS, FBG was associated between obesity (4.83 ± 0.66 vs 4.54 ± 0.53; p=0.001) and morbid-obesity (5.43 ± 1.55 vs 4.96 ± 0.88; p=0.01).
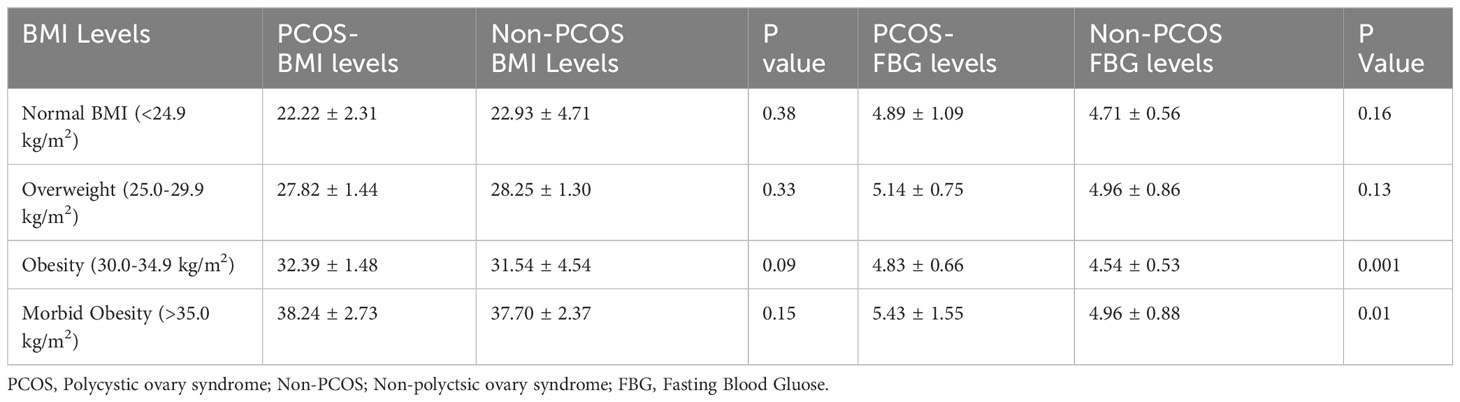
Table 12 Classification of FBG levels according to BMI categorization in PCOS and non-PCOS women.
4 Discussion
An irregular or absent menstrual cycle is a common characteristic in women with PCOS. PCOS is defined as a hormonal condition in women that has a direct impact on the female reproductive system. The name PCOS is derived from cysts known to be filled with fluid in sacs that often develop in the ovaries, causing them to expand. Previous studies in the past have shown that approximately half of the women with PCOS become overweight or obese, indicating that BMI is involved in PCOS pathogenesis. Further, the co-occurrence of PCOS and obesity has a strong hereditary basis (28). PCOS studies in Saudi women are important because of the increasing prevalence of obesity, DM, and lifestyle diseases. PCOS is associated with an increased risk of impaired glucose tolerance, and variants of CALP10 have been linked to IR. Therefore, CALP10 SNPs were analyzed in Saudi women diagnosed with PCOS.
Among five SNPs studied, rs3792267 (UCSNP-43), rs2975760 (UCSNP-44), rs2975767 (UCSNP56), and rs5030952 (UCSNP-63) were associated with allele frequencies and genotype associations, including different genetic models. FBG was strongly associated with the MLR model. In ANOVA, FSH and TT in rs3842570; FI and TG in rs2975762; and FBG, FI, FSH, and LDL-c in rs5030952 were associated. Haplotype analysis revealed a positive association of allele combinations with PCOS, and LD analysis confirmed a positive association between the studied SNPs. No strong associations were found with gene–gene interactions, dendrograms, or graphical depletion models. However, a nominal association with genotype frequencies was documented in women with PCOS. Based on the results together, we state that these SNPs in CALP10 might be associated with PCOS in women, in whom FBG and FI might play a role via IR.
Gupta et al. confirmed that UCSNP44 had the best SNP–SNP interaction. Here, we employed the MDR/GMDR statistical model to explore gene–gene interactions of five SNPs with PCOS (29). This analysis confirmed a normal association, limited by a low sample size, which was reflected by the dendrogram and graphical depletion methods.
Hormonal imbalance and metabolic dysregulation underlie PCOS pathogenesis (30). This disease is also characterized by problematic follicular development. Inflammation, congestion, and dystrophy were identified as the three probable PCOS pathologies by Fogue and Massabuau in 1910. According to the inflammatory theory, internal or external infection causes microcystic ovaries. According to the congestion theory, the lesion occurs as a result of a decrease in blood flow to the ovary caused by pressure or partial torsion. Finally, the dystrophy explanation proposes changes or aberrations in ovarian nutrition (31, 32). In 1953, Stein and Leventhal developed the Rotterdam Criteria to identify with PCOS women (33).
Multiple studies in Saudi women with PCOS have confirmed associations with various disorders. Aldossary et al. confirmed obesity as a risk factor for PCOS (34). Some studies dealt with the psychological burden among Saudi women with PCOS (35, 36). Another study confirmed low vitamin D levels in women with PCOS in Saudi Arabia (30). Low levels of vitamin D, FSH, sex hormone-binding globulin, and estradiol were recorded in women with PCOS, together with high androgen, LH, TT, FBG, TC, and LDLc levels (37).
SNPs in CALP10 are associated with the similar pathophysiology via Insulin resistance in both PCOS and T2DM (19). The encoded protein (CALP10 or CAPN10) is essential for calcium-regulated intracellular signaling. CAPN10 was the first T2DM susceptibility gene to be positionally cloned (38). The gene contains 12–15 exons and is located on chromosome 2q37. It was associated with T2DM and is a possible gene for PCOS because IR and T2DM are associated with PCOS; variations in CAPN10 can cause PCOS (39). Figure 7 shows the relationship between CALP10 and PCOS via glucose metabolism. IR and hyperinsulinemia affect 65–70% of women with PCOS, 70–80% obese women with PCOS, and 20–25% of lean women with PCOS (40). The link between T2DM and PCOS development may be due to shared insulin-related pathways. Patients who have IR are more likely to develop T2DM and cardiovascular disease (CVD) owing to the mutual interaction between IR and excess androgen levels. Continuous pancreatic stress under IR can result in impaired glucose tolerance and islet cell death, leading to T2DM (41). CALP10 has been linked to the insulin signaling pathway; hence, SNPs in CALP10 may determine insulin secretion and action (42).
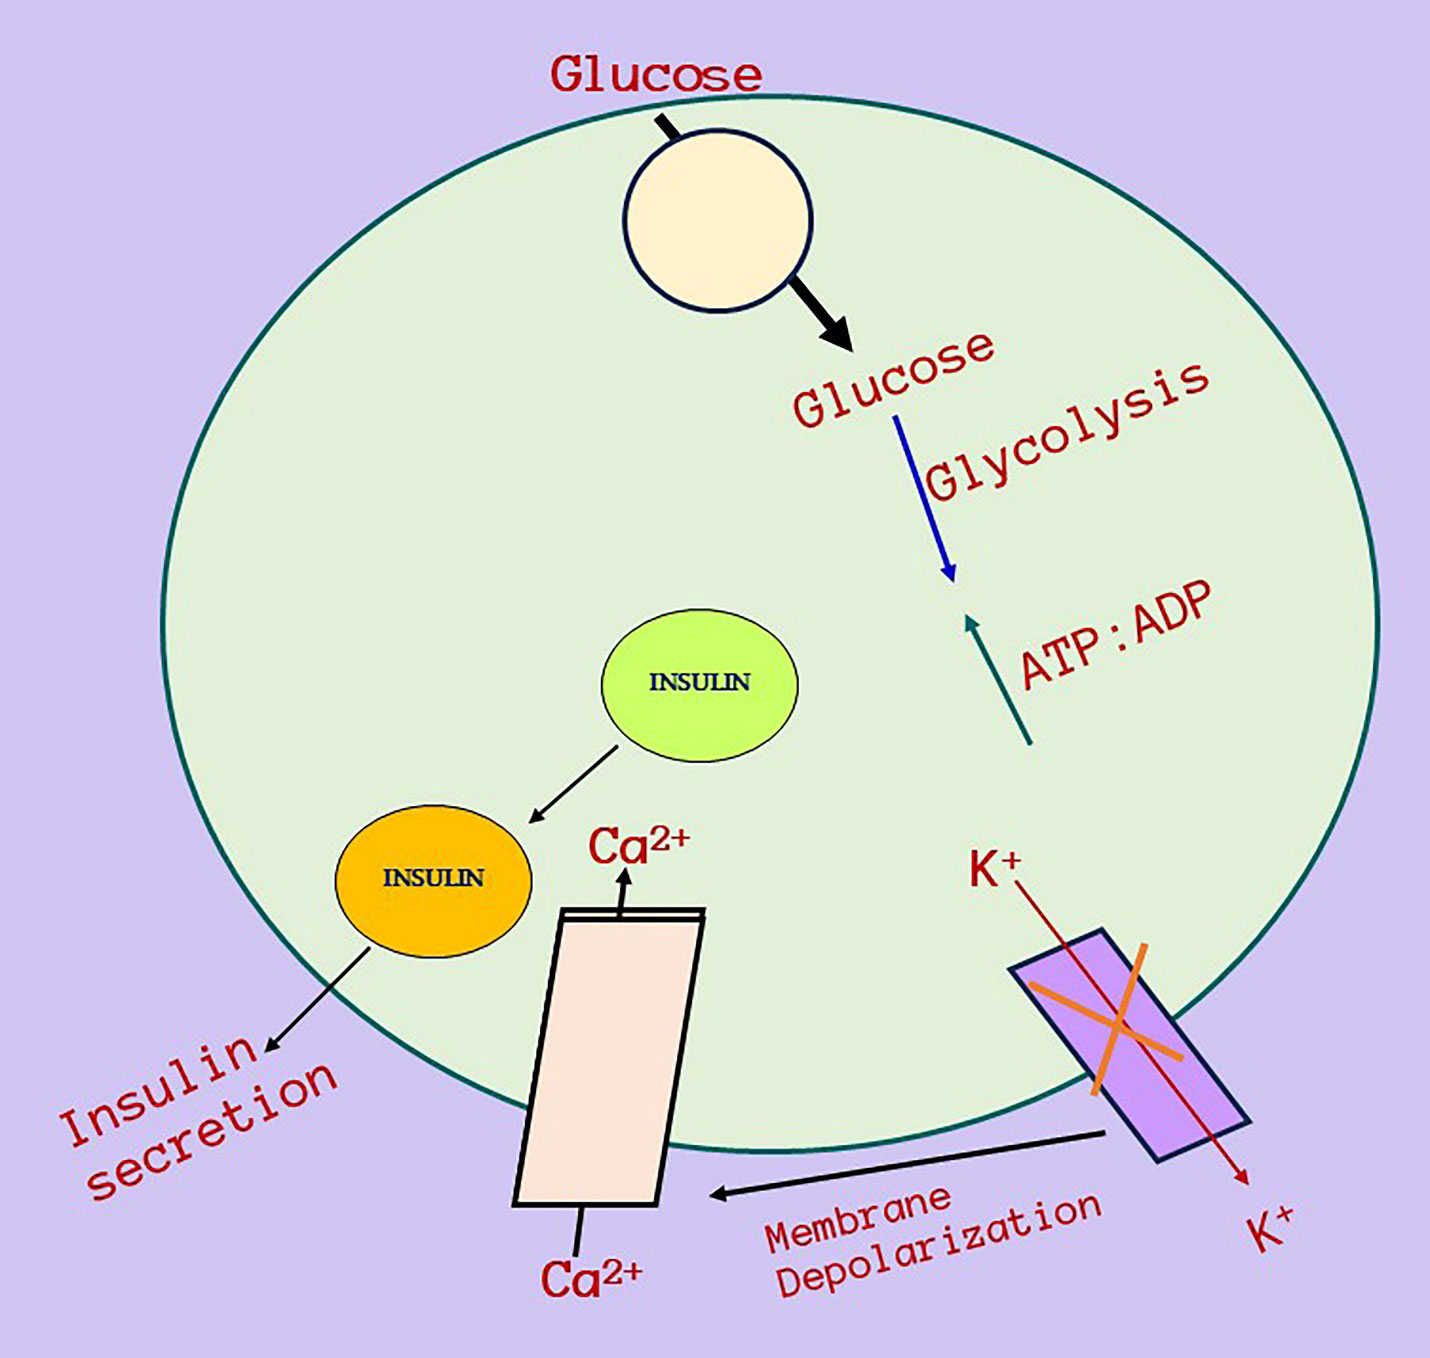
Figure 7 Relationship between CALP10 gene, glucose metabolism, Insulin resistance and PCOS. Calpain-10 gene mechanism of action and its relationship with insulin resistance and then ultimately towards PCOS. This diagram depicts a potential strategy for Calpain-10 gene activation when glucose enters cells, increases the glucose absorption and metabolism raises ATP levels, which causes inactivation of ATP-sensitive K+ channels, membrane depolarization, and calcium influx and affects insulin and then insulin secretion. PCOS and diabetes is connected via insulin resistance and there is a high chances in the minimal of PCOS women to develop prediabetes in the future.
Splicing governs the accurate removal of introns during mRNA processing. Introns contain splice sites, splicing regulatory sequences, as well as regulatory elements such as enhancers, silencers, and insulators, which control gene expression. Variants within these elements can affect the binding of transcription factors or other regulatory proteins, altering gene expression patterns. Dysregulation of gene expression underlies the development of various diseases, including cancer, autoimmune disorders, and metabolic conditions. Introns can also give rise to non-coding RNAs, which interact with other genes and proteins, influencing gene expression and cellular processes. Although several disease-associated genetic variants have been identified within introns, many intronic variants are benign and have no functional consequences. Researchers have employed various techniques such as functional studies, computational predictions, and large-scale association studies to evaluate their effects on gene function and disease susceptibility (43–45).
Here, we used four intronic SNPs and one 3′UTR SNP. rs3792267 was found to have no role in Saudi women with PCOS. This was supported by Anastasia et al. (46)Wiltgen et al. (47), Reddy et al. (48), and other studies (20, 38, 49–54). However, Marquez et al. found an association of rs3792267 in Chilean women with PCOS. Other SNPs in our study, such as rs3842570, were nominally associated with only a dominant model (55). This is supported by Vollmert et al. (38). However, other studies do not agree with our results (20, 47, 49–52, 55). In our study, the DD genotype was documented to be 40%, which is much higher than that reported by Dasgupta et al. and Unsal et al. (22.9% and 13.6%, respectively).
rs2975760 was associated with allele frequency, CC genotype, and dominant and recessive models, similar to studies by Al-Murshedi et al. (56) in Iraqi women and Yilmaz et al. (52) in Turkish women and women of other ethnicities. However, it was not associated with PCOS in other studies (20, 29, 38, 51, 54, 57, 58). Global studies indicate that rs2975760 is involved in IR, which is observed in PCOS and T2DM. rs2975760 has been studied in relation with PCOS, and different genotype frequencies have been documented. When it comes to our study, TT, TC, CC genotypes present in the PCOS women were 61.1%, 28.9% & 10%. The SNP rs2975760 studied in other global women confirmed differences in the 3 genotypes such as 61.8%, 20.7% & 17.4% in Dasgupta et al. studies, 75%, 25% & 0% in Unsal et al. studies, 58%, 27% & 15% in Al -Murshedi et al. studies and finally, 95.6%, 4.4% & 0% in Khazamipour et al. studies. Hence, the CC genotype plays an important role in specific ethnicities. rs2975760 in CALP10 was studied in Saudi women with gestational diabetes mellitus, and no association was found (59 ). Our study findings were also in agreement with that study.
In our study, rs2975762 was strongly associated with allele frequency, the GA/AA genotype, and dominant and recessive models. The MAFs of the PCOS and non-PCOS groups were 53.9% and 23.3%, respectively. Vollmert et al. (38) reported MAFs of 44.7% in women with PCOS and 36.7% in controls. This SNP has also been documented in women of diverse ethnicities with PCOS.
The rs5030952 was the final SNP analyzed in our study. Statistical association between PCOS in women and allele frequencies, CT/TT genotypes, and the dominant model was confirmed. This SNP was not associated with other ethnic populations (20, 38, 47–52, 55). A recent review article confirmed the relationship between rs3842570, rs3792267, rs2975760, and rs5030952 SNPs of the CALP10 gene and PCOS via the insulin resistance gene, which was confirmed as a risk factor, and these SNPs have been proven as possible causes for various phenotypes in PCOS women, affecting androgen production and causing hypercholesterolemia. As a result, specifically, rs3842570, and rs5030952 SNPs in metabolic or inflammatory pathways are regarded as genetic determinants for PCOS risk (60).
The only documented meta-analysis on PCOS with different SNPs confirmed that UCSNP-19, UCSNP-44, and UCSNP-63 were associated with PCOS, whereas UCSNP-43, UCSNP-56, UCSNP-58, and UCSNP-110 were not (21). Subgroup analysis revealed that UCSNP-19, UCSNP-45, and UCSNP-63 may lower the risk of PCOS in Asian women but not in Caucasian women. Allele frequencies and the dominant model were commonly associated with UCSNP-19, UCSNP-44, and UCSNP-63. The recessive model was associated only with UCSNP-44 and UCSNP-63. In our study, allele frequencies and dominant models were commonly associated with UCSNP-43, UCSNP-44, UCSNP56, UCSNP-63, and UCSNP-44; UCSNP56 was also associated with the recessive model. Heterozygous genotypes were commonly associated with UCSNP56 and UCSNP-63, and homozygous variant genotypes were commonly associated with UCSNP-44, UCSNP56, and UCSNP-63. Ben Salem et al. studied rs3792267, rs3842570, and rs5030952 in 127 Tunisian patients with PCOS and 150 control subjects, and the genotype analysis confirmed a non-significant association (61).
We assume that SNPs selected in CALP10 gene may be playing a role in the PCOS women via Insulin resistance because in general 30-40% of PCOS women predicting to have elevated glucose levels which further tends to develop prediabetes or diabetes in the future. Apart from this, the prevalence of diabetes is high in Saudi women (62). The ANOVA analysis performed in this study showed FSH and TT levels were associated in rs3842570 SNP, fasting Insulin/Insulin (FI) and TG levels in rs2975760 SNP and FBG and Insulin levels in rs5030952 SNP. Based on the previous studies, PCOS is commonly associated with hormonal and metabolic abnormalities in which FSH, Insulin, TG and FBG levels are involved. Both FBG and TG levels are connected with insulin resistance and it is a common factor in the PCOS women. Additionally, PCOS is also involved with hyperandrogenism which indicates as elevated testosterone levels. Based on the obtained results from ANOVA analysis, we predict that rs3842570, rs2975760 and rs5030952 SNPs are playing a role with hyperandrogenism, hormonal and metabolic abnormalities in the PCOS women. The associated parameters in MLR and ANOVA analysis might be playing a role in PCOS women as these parameters are calculated using 5 SNPs present in the CALP10 gene.
PCOS is maternally inherited with a 50% risk, in an autosomal dominant manner (63). Family history has a huge impact, especially in Saudi Arabia, where consanguineous marriages are common. Based on family history, it is essential to predict an individual’s risk for developing PCOS (64). In our study, 24.4% of the women had a family history of PCOS, and 33.3% had other family histories, including 16.7% with T2DM, 5.6% with hypertension (HTN), and 11.1% with a combination of T2DM and HTN. Among the control subjects, 28.9% of Saudi women had a family history of T2DM (14.4%), HTN (3.3%), or a combination thereof (11.1%). The remaining 71.1% of the control patients reported no disease in the family.
A cross-sectional questionnaire-based study among 710 women confirmed a PCOS prevalence of 32.5% in Madinah women of Saudi Arabia (65). The prevalence of this hormonal disorder has not been well reported in Saudi Arabia. Factors that affect post-diagnosis survival are as important as disease incidence in establishing prevalence. Documenting the prevalence of PCOS in Saudi Arabia is critical for healthcare planning, early detection and treatment, public awareness, research advancements, and policy progress. This can improve the circumstances of women with PCOS while promoting improved healthcare outcomes in the country.
Noncommunicable diseases (NCDs), including cancer, diabetes, CVD, and chronic respiratory diseases, are currently the primary cause of morbidity and mortality in Saudi Arabia, accounting for almost 78% of annual fatalities, with diabetes being the most prevalent. The emergence of multiple chronic medical conditions is known as multimorbidity (66). BMI has been demonstrated to be the leading risk factor in Saudi men and women, followed by high glucose levels as the second leading disease risk factor in Saudi women, and diabetes as the third leading risk factor in men. Obesity, HTN, and diabetes are growing problems in Saudi Arabia (67). By 2050, 1.3 billion cases of diabetes are predicted by 2050 (68). Besides, psychiatric disorders have increased between 30–46% in Saudi Arabia, and these diseases are more prevalent in confirmed chronic conditions, with women with PCOS having a higher risk of psychiatric problems, such as depression, anxiety, and stress (36). The combination of IR and β-cell dysfunction leads to the development of T2DM among women with PCOS, which is considered an endocrinological disorder and it includes obesity, HTN, dyslipidemia, and metabolic syndrome (22). The incidence of PCOS in women is increasing due to an aging population, and the possibility of metabolic syndrome is also increasing concomitantly (69). Women who experience PCOD during their reproductive years develop diabetes at around the age of 40 (70).
CALP10 has been found to be the best predictor for assessing genetic SNPs in women with PCOS as CALP10 is a validated marker for T2DM (7). In the present study, a positive association was found between UCSNPs 43, 44, 56, and 63. We showed that screening for SNPs in CALP10 among women with PCOS in Saudi Arabia is a suitable approach for assessing current and future projected disorders in women diagnosed with PCOS.
Based on confirmation from gynecologists, PCOS and non-PCOS samples were collected, and clinical details such as acne, hirsutism, menstrual irregularities, infertility, and acanthosis nigricans were excluded, which is one of the limitations of this study. However, all women with PCOS were confirmed to have PCO, which is one of the strengths of this study. The selection of a two-digit sample size is another limitation. Performing Sanger sequencing for rs3792267, rs2975760, and rs2975762, and validating for rs5030952 was one of the strengths of this study. We did not document the diagnosis details of Rotterdam criteria, images of polycystic ovaries/missing the percentages of oligoanovulation and details of the infertility treatment in the PCOS women which will be considered as the third limitation of this study. The non-PCOS group had a family history of T2DM, HTN, or both. We selected non-PCOS women without any family history of PCOS, but we never checked or documented questions regarding other human diseases in the recruited women.
5 Conclusion
This study contributes to the understanding of the development of PCOS in Saudi women with rs3842570, rs2975760, rs2975767, and rs5030952 SNPs in CALP10. Additional statistics have also highlighted the risk factors for women with PCOS. This study recommends screening for additional SNPs present in CALP10 with a larger sample size and conducting functional studies to validate the role of SNPs and specific pathways. The present study supports the hypothesis that SNPs in CALP10 contribute to the susceptibility to PCOS in Saudi women. Replication studies with large sample sizes are warranted to verify the molecular role of PCOS in the global population. We strongly recommend conducting a nationwide study among women with PCOS to determine the prevalence of PCOS in Saudi Arabia.
Data availability statement
The original contributions presented in the study are included in the article/supplementary material. Further inquiries can be directed to the corresponding author.
Ethics statement
The studies involving humans were approved by Institutional Review Board at King Saud University. The studies were conducted in accordance with the local legislation and institutional requirements. The participants provided their written informed consent to participate in this study.
Author contributions
AAA: Conceptualization, Data curation, Resources, Supervision, Writing – original draft. AFA: Conceptualization, Data curation, Formal analysis, Supervision, Writing – original draft, Writing – review & editing. IAK: Conceptualization, Data curation, Funding acquisition, Supervision, Writing – original draft, Writing – review & editing.
Funding
The author(s) declare financial support was received for the research, authorship, and/or publication of this article. The authors would like to extend their sincere appreciation to the Researchers Supporting Project number (RSPD2023R735), King Saud University, Riyadh, Saudi Arabia, for funding this work.
Conflict of interest
The authors declare that the research was conducted in the absence of any commercial or financial relationships that could be construed as a potential conflict of interest.
Publisher’s note
All claims expressed in this article are solely those of the authors and do not necessarily represent those of their affiliated organizations, or those of the publisher, the editors and the reviewers. Any product that may be evaluated in this article, or claim that may be made by its manufacturer, is not guaranteed or endorsed by the publisher.
References
1. Zhao H, Zhang J, Cheng X, Nie X, He B. Insulin resistance in polycystic ovary syndrome across various tissues: An updated review of pathogenesis, evaluation, and treatment. J Ovarian Res (2023) 16:9. doi: 10.1186/s13048-022-01091-0
2. Lakshmi JN, Babu AN, Kiran SM, Nori LP, Hassan N, Ashames A, et al. Herbs as a source for the treatment of polycystic ovarian syndrome: A systematic review. BioTech (2023) 12:4. doi: 10.3390/biotech12010004
3. Kicińska AM, Maksym RB, Zabielska-Kaczorowska MA, Stachowska A, Babińska A. Immunological and metabolic causes of infertility in polycystic ovary syndrome. Biomedicines (2023) 11:1567. doi: 10.3390/biomedicines11061567
4. Cowan S, Lim S, Alycia C, Pirotta S, Thomson R, Gibson-Helm M, et al. Lifestyle management in polycystic ovary syndrome–beyond diet and physical activity. BMC Endocrine Disord (2023) 23:14. doi: 10.1186/s12902-022-01208-y
5. Turesheva A, Aimagambetova G, Ukybassova T, Marat A, Kanabekova P, Kaldygulova L, et al. Recurrent pregnancy loss etiology, risk factors, diagnosis, and management. Fresh look into a full box. J Clin Med (2023) 12:4074. doi: 10.3390/jcm12124074
6. Lempesis IG, Apple SJ, Duarte G, Palaiodimos L, Kalaitzopoulos DR, Dalamaga M, et al. Cardiometabolic effects of SGLT2 inhibitors on polycystic ovary syndrome. Diabetes/Metabolism Res Rev (2023):e3682. doi: 10.1002/dmrr.3682
7. Zhan W, Tang W, Shen X, Xu H, Zhang J. Exposure to bisphenol A and its analogs and polycystic ovarian syndrome in women of childbearing age: a multicenter case-control study. Chemosphere (2023) 313:137463. doi: 10.1016/j.chemosphere.2022.137463
8. Rakic D, Jakovljevic V, Jovic N, Bicanin Ilic M, Dimitrijevic A, Vulovic T, et al. The potential of SGLT-2 inhibitors in the treatment of polycystic ovary syndrome: the current status and future perspectives. Biomedicines (2023) 11:998. doi: 10.3390/biomedicines11040998
9. Ali A, Paramanya A, Poojari P, Arslan-Acaroz D, Acaroz U, Kostić A.Ž. The utilization of bee products as a holistic approach to managing polycystic ovarian syndrome-related infertility. Nutrients (2023) 15:1165. doi: 10.3390/nu15051165
10. Albahlol IA, Neamatallah M, Serria MS, El-Gilany A-H, Setate YA, Alkasaby NM, et al. Vitamin D receptor gene polymorphism and polycystic ovary syndrome susceptibility. BMC Med Genomics (2023) 16:1–9. doi: 10.1186/s12920-023-01541-8
11. Tong C, Wu Y, Zhang L, Yu Y. Insulin resistance, autophagy and apoptosis in patients with polycystic ovary syndrome: Association with PI3K signaling pathway. Front Endocrinol (2022) 13:1091147. doi: 10.3389/fendo.2022.1091147
12. Li J, Chen S, Qin R, Liu X, Fan L, Wei M, et al. Talin1 regulates glucose metabolism and endometrial receptivity via GLUT-4 in patients with polycystic ovary syndrome and insulin resistance. Gynecological Endocrinol (2023) 39:2231085. doi: 10.1080/09513590.2023.2231085
13. Gao M, Liu X, Gu H, Xu H, Zhong W, Wei X, et al. Association between single nucleotide polymorphisms, TGF-β1 promoter methylation, and polycystic ovary syndrome. (2023). Available at: https://assets.researchsquare.com/files/rs-2986072/v1/4f8f4569-0f24-4045-8450-ea0856c6953a.pdf?c=1688148352.
14. Vanhise K, Wang ET, Norris K, Azziz R, Pisarska MD, Chan JL. Racial and ethnic disparities in polycystic ovary syndrome. Fertility Sterility. (2023) 119(3):348–54. doi: 10.1016/j.fertnstert.2023.01.031
15. Xing C, Zhao H, Zhang J, He B. The association of CYP17A1, CYP19A1, and SHBG gene polymorphisms in polycystic ovary syndrome susceptibility: a systematic review and meta-analysis. Front Physiol (2022) 13:637. doi: 10.3389/fphys.2022.741285
16. Larsen CB, Kudela E, Biringer K. Association of FSHR and DENND1A polymorphisms with polycystic ovary syndrome: a meta-analysis. JBRA Assisted Reprod (2023) 27:60. doi: 10.5935/1518-0557.20220043
17. Cooper HE, Spellacy WN, Prem KA, Cohen WD. Hereditary factors in the Stein-Leventhal syndrome. Am J obstetrics gynecology (1968) 100:371–87. doi: 10.1016/S0002-9378(15)33704-2
18. Horikawa Y, Oda N, Cox NJ, Li X, Orho-Melander M, Hara M, et al. Genetic variation in the gene encoding calpain-10 is associated with type 2 diabetes mellitus. Nat Genet (2000) 26:163–75. doi: 10.1038/79876
19. Ehrmann DA, Schwarz PE, Hara M, Tang X, Horikawa Y, Imperial J, et al. Relationship of calpain-10 genotype to phenotypic features of polycystic ovary syndrome. J Clin Endocrinol Metab (2002) 87:1669–73. doi: 10.1210/jcem.87.4.8385
20. Dasgupta S, Sirisha PV, Neelaveni K, Anuradha K, Reddy BM. Association of CAPN10 SNPs and haplotypes with polycystic ovary syndrome among South Indian Women. PloS One (2012) 7:e32192. doi: 10.1371/journal.pone.0032192
21. Shen W, Li T, Hu Y, Liu H, Song M. Calpain-10 genetic polymorphisms and polycystic ovary syndrome risk: a meta-analysis and meta-regression. Gene (2013) 531:426–34. doi: 10.1016/j.gene.2013.08.072
22. Al-Mutawa J. Genetic contribution between APE1 variants in polycystic ovarian syndrome. Saudi J Biol Sci (2023) 30:103563. doi: 10.1016/j.sjbs.2023.103563
23. Group, R.E.a.S.P.C.W. Revised 2003 consensus on diagnostic criteria and long-term health risks related to polycystic ovary syndrome (PCOS). Hum Reprod (2004) 19:41–7. doi: 10.1093/humrep/deh098
24. Solé X, Guinó E, Valls J, Iniesta R, Moreno V. SNPStats: a web tool for the analysis of association studies. Bioinformatics (2006) 22:1928–9. doi: 10.1093/bioinformatics/btl268
26. Barrett JC, Fry B, Maller J, Daly MJ. Haploview: analysis and visualization of LD and haplotype maps. Bioinformatics (2005) 21:263–5. doi: 10.1093/bioinformatics/bth457
27. Lou X-Y, Chen G-B, Yan L, Ma JZ, Zhu J, Elston RC, et al. A generalized combinatorial approach for detecting gene-by-gene and gene-by-environment interactions with application to nicotine dependence. Am J Hum Genet (2007) 80:1125–37. doi: 10.1086/518312
28. Chaudhary H, Patel J, Jain NK, Panchal S, Laddha N, Joshi R. Association of FTO gene variant rs9939609 with polycystic ovary syndrome from Gujarat, India. BMC Med Genomics (2023) 16:216. doi: 10.1186/s12920-023-01654-0
29. Dasgupta S, Reddy BM. The role of epistasis in the etiology of polycystic ovary syndrome among Indian women: SNP-SNP and SNP-environment interactions. Ann Hum Genet (2013) 77:288–98. doi: 10.1111/ahg.12020
30. Bindayel IA. Low vitamin D Level in Saudi women with polycystic ovary syndrome. Front Nutr (2021) 8:611351. doi: 10.3389/fnut.2021.611351
31. Azziz R. Epidemiology and pathogenesis of the polycystic ovary syndrome in adults. UptoDate May (2013) 1:247.e1-247.e11. doi: 10.1016/j.ajog.2015.12.013
32. Ibrahim G, Alnowaiser D, Alabbasi H, Abuhaimed J, Albukhari M, Alharthi M, et al. The relationship between lifestyle and the frequency of polycystic ovary syndrome in Saudi female residing in Riyadh. Int J Reproduction Contraception Obstetrics Gynecology (2018) 7:20–6. doi: 10.18203/2320-1770.ijrcog20175826
33. Stein IF, Leventhal ML. Amenorrhea associated with bilateral polycystic ovaries. Am J obstetrics gynecology (1935) 29:181–91. doi: 10.1016/S0002-9378(15)30642-6
34. Aldossary K, Alotaibi A, Alkhaldi K, Alharbi R. Prevalence of polycystic ovary syndrome, and relationship with obesity/overweight: cross-sectional study in Saudi Arabia. J Adv Pharm Educ Res (2020) 10:187.Available at: https://japer.in/storage/models/article/onkQdQ9Iryw5pO5O1uH5cJ0zThqZ357VsdNwLsTqrjBz6lhvj0peDFcH9UEC/prevalence-of-polycystic-ovary-syndrome-and-relationship-with-obesityoverweight-cross-sectional-st.pdf.
35. Asdaq SMB, Yasmin F. Risk of psychological burden in polycystic ovary syndrome: A case control study in Riyadh, Saudi Arabia. J Affect Disord (2020) 274:205–9. doi: 10.1016/j.jad.2020.05.086
36. Alamri AS, Alhomrani M, Alsanie WF, Almuqbil M, Alqarni KM, Alshehri SM, et al. Role of polycystic ovarian syndrome in developing psychological burden in Saudi Arabian females: A case control study. Front Public Health (2022) 10:999813. doi: 10.3389/fpubh.2022.999813
37. Sindi RA. Hormonal, metabolic, and Vitamin D status variabilities among Saudi women with polycystic ovarian syndrome versus nonpolycystic ovarian syndrome controls: A retrospective study. Saudi J Health Sci (2022) 11:179. doi: 10.4103/sjhs.sjhs_91_22
38. Vollmert C, Hahn S, Lamina C, Huth C, Kolz M, Schopfer-Wendels A, et al. Calpain-10 variants and haplotypes are associated with polycystic ovary syndrome in Caucasians. Am J Physiology-Endocrinology Metab (2007) 292:E836–44. doi: 10.1152/ajpendo.00584.2005
39. Ajmal N, Khan SZ, Shaikh R. Polycystic ovary syndrome (PCOS) and genetic predisposition: A review article. Eur J obstetrics gynecology Reprod biology: X (2019) 3:100060. doi: 10.1016/j.eurox.2019.100060
40. Marshall J, Dunaif A. Аll women with PCOS should be treated for insulin resistance. Fertil Steril (2012) 97:18–22. doi: 10.1016/j.fertnstert.2011.11.036
41. Chen T, Yu Y, Jia F, Luan P, Liu X. The relationship between polycystic ovary syndrome and insulin resistance from 1983 to 2022: A bibliometric analysis. Front Public Health (2022) 10:960965. doi: 10.3389/fpubh.2022.960965
42. Permutt MA, Bernal-Mizrachi E, Inoue H. Calpain 10: the first positional cloning of a gene for type 2 diabetes? J Clin Invest (2000) 106:819–21. doi: 10.1172/JCI11228
43. Palazzo AF, Gregory TR. The case for junk DNA. PloS Genet (2014) 10:e1004351. doi: 10.1371/journal.pgen.1004351
44. Palazzo AF, Lee ES. Non-coding RNA: what is functional and what is junk? Front Genet (2015) 6:2. doi: 10.3389/fgene.2015.00002
45. Pagni S, Mills JD, Frankish A, Mudge JM, Sisodiya SM. Non-coding regulatory elements: Potential roles in disease and the case of epilepsy. Neuropathology Appl Neurobiol (2022) 48:e12775. doi: 10.1111/nan.12775
46. Anastasia K, Koika V, Roupas ND, Armeni A, Marioli D, Panidis D, et al. Association of Calpain (CAPN) 10 (UCSNP-43, rs3792267) gene polymorphism with elevated serum androgens in young women with the most severe phenotype of polycystic ovary syndrome (PCOS). Gynecological Endocrinol (2015) 31:630–4. doi: 10.3109/09513590.2015.1032932
47. Wiltgen D, Furtado L, Kohek MB, Spritzer PM. CAPN10 UCSNP-43, UCSNP-19 and UCSNP-63 polymorphisms and metabolic syndrome in polycystic ovary syndrome. Gynecological Endocrinol (2007) 23:173–8. doi: 10.1080/09513590701233661
48. Reddy BM, Kommoju UJ, Dasgupta S, Rayabarapu P. Association of type 2 diabetes mellitus genes in polycystic ovary syndrome aetiology among women from southern India. Indian J Med Res (2016) 144:400. doi: 10.4103/0971-5916.198678
49. Gonzalez A, Abril E, Roca A, AragóN MJ, Figueroa MJ, Velarde P, et al. CAPN10 alleles are associated with polycystic ovary syndrome. J Clin Endocrinol Metab (2002) 87:3971–6. doi: 10.1210/jcem.87.8.8793
50. Haddad L, Evans JC, Gharani N, Robertson C, Rush K, Wiltshire S, et al. Variation within the type 2 diabetes susceptibility gene calpain-10 and polycystic ovary syndrome. J Clin Endocrinol Metab (2002) 87:2606–10. doi: 10.1210/jcem.87.6.8608
51. Unsal T, Konac E, Yesilkaya E, Yilmaz A, Bideci A, Ilke Onen H, et al. Genetic polymorphisms of FSHR, CYP17, CYP1A1, CAPN10, INSR, SERPINE1 genes in adolescent girls with polycystic ovary syndrome. J Assisted Reprod Genet (2009) 26:205–16. doi: 10.1007/s10815-009-9308-8
52. Yılmaz M, Yurtcu E, Demirci H, Ergün M, Ersoy R, Karakoc A, et al. Calpain 10 gene single-nucleotide 44 polymorphism may have an influence on clinical and metabolic features in patients with polycystic ovary syndrome. J endocrinological Invest (2009) 32:13–7. doi: 10.1007/BF03345671
53. Thathapudi S, Jayashankar Erukkambattu QH, Addepally U, Kodati V. Association of calpain 10 gene UCSNP-43 polymorphism (rs3792267) with polycystic ovarian syndrome. Int J Reprod Contracept. Obstet. Gynecol (2017) 4:1185–90. doi: 10.18203/2320-1770.ijrcog20150452
54. Zhang X, Shi C, Wei L, Sun F, Ji L. The association between the rs2975760 and rs3792267 single nucleotide polymorphisms of calpain 10 (CAPN10) and gestational diabetes mellitus. Med Sci Monitor: Int Med J Exp Clin Res (2019) 25:5137. doi: 10.12659/MSM.914930
55. Márquez JL, Pacheco A, Valdés P, Salazar LA. Association between CAPN10 UCSNP-43 gene polymorphism and polycystic ovary syndrome in Chilean women. Clinica chimica Acta (2008) 398:5–9. doi: 10.1016/j.cca.2008.07.028
56. Al-Murshedi HH, Jawad AF, Al-Tu’ma FJ, Hadi EA, Al-Tu’ma MMK. Molecular studies of CAPN-10 gene (rs2975760) and its association with insulin resistance in polycystic ovarian syndrome of Iraqi women. J Contemp Med Sci (2022) 8;382–7. doi: 10.22317/jcms.v8i6.1298
57. Khazamipour A, Nejatizadeh A, Kalantar SM, Khashavi Z, Kalantar SM. Association study of calpain-10 Gene Polymorphism in Patients with Polycystic Ovarian Syndrome. Genet 3rd Millennium. (2015) 13(1):3924–30. Available at: https://d1wqtxts1xzle7.cloudfront.net/96403356/Dr_20Nejati...-libre.pdf?1672112647=&response-content-disposition=inline%3B+filename%3DAssociation_Study_of_Calpain_10_Gene_Pol.pdf&Expires=1701188541&Signature=VCTzqgMMMEUqwndL6EW~NH-8Un-PKRKtAjkwP~9iLOjrkqwGMl~Q4tyJ7cJ8B8FKsw9acmmlBVRg6mBBE0Ijo4XevgBsTLtnDHJunegDm0APov7kgpTmfmLtAAHOWIpcSEEWLJjGYyr0ybYp3nvn6GnPkuok66chmm~HUGVLoKYktrb7bqHXolLMLs-q9JTAds9LoM7-KZwqHg69e1K1CYe7XCr3uJAfewkg6Gp~VvqVAF0Bn4tXne4zpkSZDqwTZ7LDBhzNZVvcoZ4WY9mueYyvqVsvlEiyP81FZfDlPg67V9nB9-Z0pwRXbnsG6P54ho5epXpLaEpUnlXZBehNkg__&Key-Pair-Id=APKAJLOHF5GGSLRBV4ZA.
58. Ramanathan B, Murugan J, Velayutham K. Pilot study on evaluation and determination of the prevalence of Polycystic Ovarian Syndrome (PCOS) associated gene markers in the South Indian population. Indian J Endocrinol Metab (2021) 25:551. doi: 10.4103/ijem.ijem_340_21
59. Qusti Sy BM, Almalki AM, Alghamdi A, Alturkistani RF, Baljoon R. Tumor necrosis factor and calpain 10 polymorphism impacts in women with GDM. Int J Pharm Phytopharmacological Res (eIJPPR) (2020) 10:15–26.
60. Sharma P, Bhatia K, Kapoor HS, Kaur B, Khetarpal P. Genetic variants of Metabolism and Inflammatory pathways, and PCOS risk–Systematic review, Meta-analysis, and In-silico analysis. Gene (2023) 147796:147796. doi: 10.1016/j.gene.2023.147796
61. Ben Salem A, Attaoua R, Mtiraoui N, Belkahla S, Ezzidi I, Ajina M, et al. Common polymorphisms of calpain-10 and the risk of polycystic ovary syndrome in Tunisian population: a case–control study. Mol Biol Rep (2014) 41:6569–74. doi: 10.1007/s11033-014-3540-8
62. Aljulifi MZ. Prevalence and reasons of increased type 2 diabetes in Gulf Cooperation Council Countries. Saudi Med J (2021) 42:481. doi: 10.15537/smj.2021.42.5.20200676
63. Bogari NM. Genetic construction between polycystic ovarian syndrome and type 2 diabetes. Saudi J Biol Sci (2020) 27:2539–43. doi: 10.1016/j.sjbs.2020.05.004
64. Kahsar-Miller M, Azziz R. The development of the polycystic ovary syndrome: family history as a risk factor. Trends Endocrinol Metab (1998) 9:55–8. doi: 10.1016/S1043-2760(98)00021-6
65. Alraddadi SM, Borzangi KA, Almuher EM, Albaik AF, Aljawad LA, Shaqroon AA, et al. Prevalence of polycystic ovarian syndrome with associated risk factors and impact on well-being among women in reproductive aged (18–45) years in Al-Madinah 2017. World J Pharm Res (2018) 7:231–47.
66. Hakami SM, Omar MT, Alsaad SM, Vennu VS, Hattan LI, Bindawas SM. Association between non-communicable diseases and physical activity level in older adults visiting primary health care centers in Jizan, Saudi Arabia. Saudi Med J (2023) 44:580. doi: 10.15537/smj.2023.44.6.20230076
67. Alzahrani MS, Alharthi YS, Aljamal JK, Alarfaj AA, Vennu V, Noweir MD. National and regional rates of chronic diseases and all-cause mortality in Saudi Arabia—Analysis of the 2018 household health survey data. Int J Environ Res Public Health (2023) 20:5254. doi: 10.3390/ijerph20075254
68. Ong KL, Stafford LK, Mclaughlin SA, Boyko EJ, Vollset SE, Smith AE, et al. Global, regional, and national burden of diabetes from 1990 to 2021, with projections of prevalence to 2050: a systematic analysis for the Global Burden of Disease Study 2021. Lancet (2023) 402(10397):203–4. doi: 10.1016/S0140-6736(23)01301-6
69. Sangaraju SL, Yepez D, Grandes XA, Manjunatha RT, Habib S, Grandes X. Cardio-metabolic disease and polycystic ovarian syndrome (PCOS): a narrative review. Cureus (2022) 14:e25076. doi: 10.7759/cureus.25076
Keywords: polycystic ovarian syndrome, non-PCOS, CALP10, SNPs, Saudi women, diabetes, obesity
Citation: Alageel AA, Alshammary AF and Ali Khan I (2023) Molecular role of non-exonic variants in CALPAIN 10 gene in polycystic ovarian syndrome in Saudi women. Front. Endocrinol. 14:1303747. doi: 10.3389/fendo.2023.1303747
Received: 28 September 2023; Accepted: 23 November 2023;
Published: 27 December 2023.
Edited by:
Elena Piccinin, University of Bari Aldo Moro, ItalyReviewed by:
Omar Ammar, Delta University for Science and Technology, EgyptMaryam Pirhoushiaran, Tehran University of Medical Sciences, Iran
Ramon Bossardi Ramos, Albany Medical College, United States
Copyright © 2023 Alageel, Alshammary and Ali Khan. This is an open-access article distributed under the terms of the Creative Commons Attribution License (CC BY). The use, distribution or reproduction in other forums is permitted, provided the original author(s) and the copyright owner(s) are credited and that the original publication in this journal is cited, in accordance with accepted academic practice. No use, distribution or reproduction is permitted which does not comply with these terms.
*Correspondence: Imran Ali Khan, imkhan@ksu.edu.sa