 Ioannis G. Lempesis1,2,3
 Nicole Hoebers2
 Yvonne Essers2
 Johan W. E. Jocken2
 Rosemary Dineen1,3
 Ellen E. Blaak2Konstantinos N. Manolopoulos1,3†
 Gijs H. Goossens2*†
- 1Institute of Metabolism and Systems Research (IMSR), College of Medical and Dental Sciences, University of Birmingham, Birmingham, United Kingdom
- 2Department of Human Biology, NUTRIM School of Nutrition and Translational Research in Metabolism, Maastricht University Medical Centre+, Maastricht, The Netherlands, Maastricht, Netherlands
- 3Centre for Endocrinology, Diabetes and Metabolism, Birmingham Health Partners, Birmingham, United Kingdom
Introduction: Upper and lower body fat accumulation poses an opposing obesity-related cardiometabolic disease risk. Depot-differences in subcutaneous adipose tissue (SAT) function may underlie these associations. We aimed to investigate the inflammatory signatures of abdominal (ABD) and femoral (FEM) SAT in postmenopausal women with normal weight or obesity.
Methods: We included 23 postmenopausal women with normal weight (n = 13) or obesity (n = 10). In vivo secretion of adipokines from ABD and FEM SAT was measured using the arterio-venous balance technique. Adipokine gene expression and adipocyte morphology were examined in ABD and FEM SAT. Furthermore, adipokine expression and secretion were investigated in vitro using differentiated human primary ABD and FEM subcutaneous adipocytes derived from the study participants.
Results: Plasma leptin and plasminogen activator inhibitor (PAI)-1 concentrations were higher, and ABD and FEM adipocytes were larger in women with obesity than normal weight. No differences in adipocyte size and blood flow were apparent between ABD and FEM SAT. We found significant release of leptin and monocyte chemoattractant protein (MCP)-1 from ABD and FEM SAT, with higher fractional release of MCP-1 from ABD than FEM SAT. Gene expression of leptin, PAI-1, and tumor necrosis factor-α was lower in ABD than FEM SAT and higher in women with obesity than normal weight. In ABD adipocytes, interleukin-6, PAI-1, and leptin gene expression were higher, while adiponectin and dipeptidyl-peptidase-4 gene expression were lower than in FEM adipocytes. Finally, ABD adipocytes secreted less MCP-1 compared to FEM adipocytes.
Discussion: These findings demonstrate that upper and lower body SAT and adipocytes are characterized by distinct inflammatory signatures in postmenopausal women, which seem independent of adipocyte size.
1 Introduction
Obesity is characterized by excessive accumulation of white adipose tissue (AT), which contributes to the development of insulin resistance and related cardiometabolic diseases (1–4). Body fat distribution is an important determinant of cardiometabolic derangements (5). Abdominal (ABD) obesity (upper body fat accumulation) is associated with an increased risk for insulin resistance, type 2 diabetes mellitus, cardiovascular disease, and all-cause mortality, while gluteofemoral (lower body) fat storage is associated with a more beneficial cardiometabolic risk profile for a given body mass index (BMI) in both men and women (1, 6–10).
ABD obesity is characterized by subcutaneous AT (SAT) and visceral AT accumulation, which are both related to cardiometabolic risk factors, dependent on factors such as sex and ethnicity (11–13). However, next to differences in body fat distribution, AT dysfunction is tightly linked to obesity-related complications (1, 2, 14). AT dysfunction is characterized by adipocyte hypertrophy, impaired lipid metabolism, decreased adipose tissue blood flow (ATBF), mitochondrial dysfunction, altered oxygenation, a state of chronic low-grade inflammation, and impaired adipokine expression/secretion (1–3, 15–17). Together, these impairments contribute to lipid spillover in the circulation, ectopic fat deposition, and low-grade systemic inflammation, collectively aggravating cardiometabolic disease development (1, 4, 5, 18–20). The predominant sequestration of lipids in lower body AT depots in premenopausal women seems to confer protection against the development of cardiometabolic diseases (4, 8, 21–23). In addition to AT depot-differences in lipid metabolism, differences in the inflammatory signatures between upper and lower body AT may contribute to the disease risk associated with a certain body fat distribution pattern (8).
Studies that have compared the inflammatory phenotype of upper and lower body SAT are scarce. Although no major differences in gene expression of inflammatory markers were previously found between ABD and gluteal SAT (23, 24), recent findings suggest that in vivo IL-6 release from gluteofemoral SAT may be lower than from ABD SAT in healthy men with normal body weight (23, 25). The latter findings might indicate that lower body SAT is characterized by a more beneficial inflammatory phenotype. Importantly, it remains to be established whether differences in the SAT depot-specific expression and secretion of (anti-)inflammatory factors exist in women as well as between people with normal weight and obesity.
Therefore, the present cross-sectional study aimed to investigate whether the expression and secretion of several well-known (anti-)inflammatory adipokines differ between upper and lower body SAT in postmenopausal women with normal weight or obesity. We hypothesized that the expression and secretion of proinflammatory factors are higher in upper body as compared to lower body SAT and adipocytes. To test our hypothesis, we compared the in vivo release of several adipokines across ABD and femoral (FEM) SAT, and investigated SAT depot-specific adipocyte morphology and adipokine expression in well-phenotyped postmenopausal women with normal weight or obesity. Furthermore, the expression and secretion of adipokines was examined in vitro using differentiated human multipotent adipose-derived stem (hMADS) cells derived from ABD and FEM SAT from the same individuals.
2 Materials and methods
2.1 Study design
A total of 23 healthy postmenopausal women (aged 50–65 years) with normal weight (BMI 18–25 kg/m2) or obesity (BMI 30–40 kg/m2) were recruited. All subjects underwent a medical evaluation during the screening visit (see Supplementary Materials Methods—Study design for details). The in vivo measurements were conducted at the University of Birmingham/Queen Elizabeth Hospital Birmingham (Birmingham, UK). The University of Birmingham Ethics committee and the UK Health Research Authority National Health System Research Ethics Committee approved the present study (approval no. 18/NW/0392). The study was performed according to the Declaration of Helsinki, and all participants provided written informed consent before taking part in the study procedures. The in vitro experiments and sample analyses were performed at Maastricht University Medical Center+ (Maastricht, the Netherlands).
Exclusion criteria were smoking, cardiovascular disease, type 2 diabetes mellitus, liver or kidney malfunction, any chronic medical condition requiring the use of medication known to affect body weight, glucose and/or lipid metabolism, use of anti-inflammatory agents (e.g., non-steroidal anti-inflammatory drugs, steroids) within 14 days prior to study start, planned blood donation 2 months prior to or after study completion, and marked alcohol consumption (>14 alcoholic units/week). Premenopausal or perimenopausal women, defined as either regular periods or a period within the last 12 months from screening date, were also excluded. Finally, individuals were excluded from the study if blood vessels were unsuitable for cannulation (i.e., too-small veins or arterial plaques).
Participants were asked to arrive at the Clinical Research Facility after an overnight fast, having avoided strenuous exercise and alcohol for at least 24 h, on three occasions. Each of these study visits took place within 1 week of the previous visit, separated by at least 2 days. Briefly, during the first visit, participants were screened, and an oral glucose tolerance test (OGTT) was performed. During the second visit, arterio-venous concentration differences across ABD and FEM SAT were assessed and blood flow in these fat depots was determined. During the third visit, a dual-energy x-ray absorptiometry (DXA) scan was performed to determine body fat percentage and body composition, and ABD and FEM SAT biopsies were collected. These measurements are explained in more detail in the next section.
2.2 In vivo measurements
2.2.1 Screening
Body weight, height, waist (measured midway between the lower margin of the last palpable rib and the top of the iliac crest) and hip circumferences (measured at the level of the greater trochanters) were determined. Blood pressure and heart rate were measured using a standard oscillometric blood pressure monitor with an upper arm cuff. Next, we screened blood vessels in ABD and FEM SAT using ultrasound to determine whether veins would be suitable for cannulation. Finally, an OGTT was performed to exclude individuals with type 2 diabetes mellitus.
2.2.2 Body composition
A dual x-ray absorptiometry (DXA) scan was performed after an overnight fast to determine body composition and body fat percentage (Lunar iDXA, GE Healthcare) (26).
2.2.3 Arterio-venous concentration differences
Arterio-venous concentration differences of adipokines across the ABD and FEM SAT depots were assessed, as described previously (27, 28). Briefly, selective venous catheterization of one the branches of the superficial epigastric veins (draining ABD SAT) was performed (28–30). Next, a superficial branch of the great saphenous vein (draining FEM SAT) was cannulated (31). Finally, an arterial catheter was inserted into the radial artery. Blood samples were taken simultaneously from the three sites (arterial, ABD, and FEM) at two different time-points 60 min after the cannulation procedures (allowing participants to relax), separated by 30 min, under fasting conditions.
For the ABD SAT depot, veins located above the inguinal ligament, as determined by using the anterior superior iliac spine and the projected pubic symphysis as reference points, were identified. The SAT areas lateral of the umbilicus and between the lower end of the rib cage and the inguinal ligament were scanned with ultrasound (Philips CX50 Ultrasound, Bothell, USA) on each side to identify suitable veins for cannulation and ATBF measurements in the ABD SAT depot. After application of local anesthetic (lidocaine hydrochloride 1%), a 20-gauge central venous catheter was inserted with the Seldinger technique. Veins in FEM SAT that were suitable for cannulation and ATBF measurements were identified by scanning the inner aspect of the thigh, approximately halfway between the groin and the knee. A catheter (Venflon®) was placed and secured in place. Finally, an arterial catheter was inserted into the radial artery of the non-dominant hand using local anesthetic (1% lidocaine) and ultrasound guidance.
After completion of sample collection and blood flow measurements, all catheters were removed, and the study participants were given a meal. Due to the technical difficulties to cannulate the small veins in these SAT depots and to collect blood samples, we successfully completed the measurements and sample collection for nine women with normal weight and six women with obesity. Due to the limited number of paired blood samples draining ABD and FEM SAT for the individuals with normal weight and obesity, we decided to pool the data for all study participants per SAT depot to achieve sufficient statistical power to detect SAT depot-differences in adipokine release.
2.2.4 Adipose tissue blood flow
Fasting ATBF was measured in ABD and FEM SAT using a Doppler ultrasound technique, as previously described (32). Briefly, the SAT areas lateral of the umbilicus and between the lower end of the rib cage and the inguinal ligament were scanned on each side to identify suitable veins for ATBF measurements in the ABD SAT depot. In the FEM depot, the great saphenous vein and its branches drain mostly FEM SAT. Suitable FEM veins for ATBF measurements were identified by scanning the inner aspect of the thigh, approximately halfway between the groin and the knee.
2.3 Biochemical analyses
During screening, blood samples were drawn to determine electrolytes, liver enzymes, full blood count, thyroid hormones, glucose, insulin, and HbA1c. Blood samples were collected into heparinized tubes, centrifuged at 4°C at 1,000g, and plasma was snap-frozen and stored at −80°C until analysis. Adipokine concentrations were determined using high-sensitive ELISAs [adiponectin and PAI-1 from Biovendor, interleukin (IL)-6 and monocyte chemoattractant protein (MCP)-1 from Diaclone, and leptin and dipeptidyl-peptidase (DPP)-4 from R&D Systems, insulin MSD].
2.4 Adipose tissue biopsies and adipocyte morphology
ABD and FEM SAT biopsies and adipocyte morphology were collected and assessed, respectively, as described before (33). ABD SAT needle biopsy specimens (up to ∼1 g) were collected 6–8 cm lateral from the umbilicus and from the FEM region (anterior site of the upper leg), respectively, under local anesthesia (1% lidocaine) after an overnight fast. Biopsy specimens were immediately rinsed with sterile saline, and visible blood vessels were removed with sterile tweezers. A small part of the SAT sample was fixed overnight in 4% paraformaldehyde and embedded in paraffin for histology. Another part was used for isolation of hMADS cells, as described before (33). The remaining tissue was snap-frozen in liquid nitrogen and stored at −80°C for gene/protein expression analysis.
Histological sections (8 μm) were cut from paraffin-embedded tissue, mounted on microscope glass slides, and dried overnight in an incubator at 37°C. Sections were stained with hematoxylin and eosin. Digital images were captured with the use of a Leica DFC320 digital camera (Leica, Rijswijk, Netherlands) at ×20 magnification (Leica DM3000 microscope; Leica). Computerized morphometric analysis (Leica QWin V3, Cambridge, England) of individual adipocytes was performed by measuring at least 200 adipocytes per sample.
2.5 Calculations
Adipokine release across ABD and FEM adipose tissue was assessed using the arteriovenous difference technique. Fractional release [FR = ((venous - arterial concentration)/arterial concentration) * 100%] was calculated for each adipokine using the concentration from SAT depot-specific blood samples. A positive FR value reflects the release of adipokines from SAT. All calculations were performed as described previously (28–30).
Indexes of pancreatic β-cell function and insulin resistance were calculated using the updated computer model-based homeostatic model assessment (HOMA) method (34).
2.6 Human primary adipocyte experiments
hMADS cells, an established human white adipocyte model (35), were obtained from ABD and FEM subcutaneous SAT. Cells were seeded at a density of 2,000 cells/cm2 and kept in proliferation medium for 7 days and thereafter in differentiation medium for 14 days. All experiments were performed on day 14 of adipogenic differentiation. Paired ABD and FEM adipocyte samples derived from nine women with normal weight and nine women with obesity were used for these experiments.
2.7 Adipose tissue and adipocyte gene expression analysis
Total RNA was extracted from all frozen SAT specimens (∼150 mg) and hMADS cells using a TRIzol reagent (Invitrogen, Breda, Netherlands), and SYBR-Green–based real-time PCRs were performed using an iCycler (Bio-Rad, Veenendaal, Netherlands; primer sequences are shown in Supplemental Table 1). Results were normalized to the mean of 18S ribosomal RNA.
2.8 Adipocytokine secretion measurement
The medium of the hMADS cells was collected over 24 h to determine adipokine secretion using high-sensitive ELISA. If necessary, samples were diluted with a provided dilution buffer from the manufacturer prior to the assay, which was performed in duplicates, according to the manufacturer’s instructions.
2.9 Statistical analyses
To assess whether there was significant release of adipokines from ABD and/or FEM SAT, we compared the fractional release value for each adipokine against zero release (that is, no net release). AT depot-differences in the secretion of adipokines and gene expression within women with normal weight and obesity were analyzed using Student’s paired t-tests (Wilcoxon signed rank tests in case data were not normally distributed), while differences between individuals with normal weight and obesity were determined using unpaired t-tests (Mann–Whitney test in case data were not normally distributed). GraphPad Prism version 8 for Windows was used to perform statistics, and p < 0.05 was considered as statistically significant. Data are presented as mean ± SEM.
3 Results
3.1 Subject characteristics
Participants’ characteristics are shown in Table 1. By definition, the BMI was higher in women with obesity compared to normal weight (both p < 0.001). Furthermore, waist and hip circumferences were significantly higher in women with obesity, while the waist-to-hip ratio was not statistically different between groups (p = 0.443). The sizes of all AT depots examined (visceral, ABD, and leg fat) were higher in women with obesity (all p < 0.001). In addition, women with obesity tended to have higher fasting insulin concentrations (p = 0.053). In line, Homeostasis Model Assessment 2–Insulin Resistance was higher in women with obesity compared with normal weight (p = 0.050).
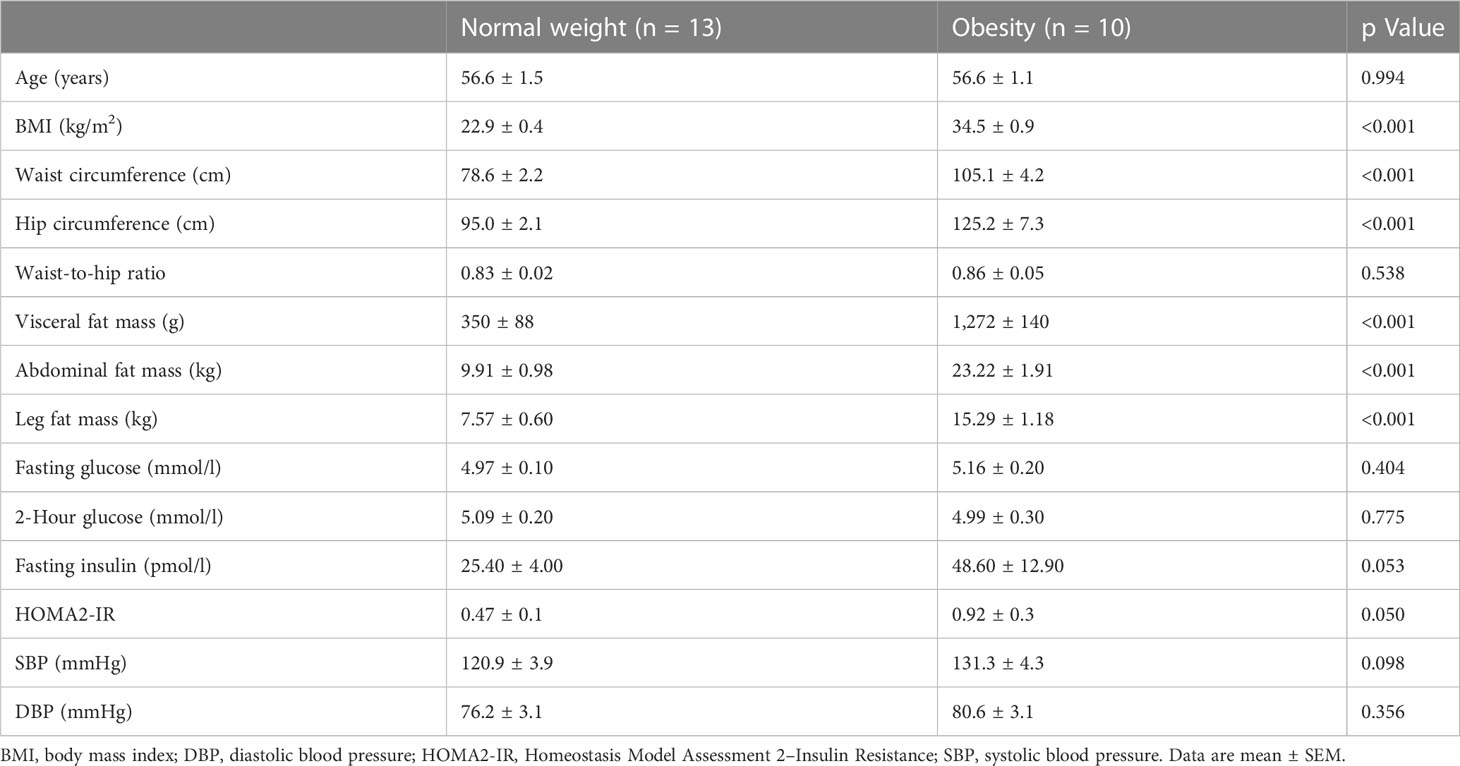
Table 1 Anthropometric characterization and metabolic profile of participants.
3.2 Plasma adipokine concentrations
Arterial plasma concentrations of adipokines were measured after an overnight fast (Figure 1). Plasma leptin concentrations were significantly higher in women with obesity compared to normal weight (46.6 ± 3.1 vs. 9.8 ± 1.8 ng/ml, respectively, p < 0.001) (Figure 1A). Furthermore, PAI-1 concentrations were higher in individuals with obesity than normal weight (39.8 ± 4.3 vs. 24.8 ± 2.4 ng/ml, respectively, p = 0.036) (Figure 1B). No significant differences were found for circulating DPP-4 (412.0 ± 30.1 vs. 469.4 ± 15.4 ng/ml, p = 0.272) and MCP-1 concentrations (339.6 ± 31.6 vs. 287.4 ± 17.1 ng/ml, respectively, p = 0.299) between women with obesity and normal weight (Figures 1C, D). Finally, a tendency for lower circulating adiponectin concentration in women with obesity compared to normal weight was found (6.8 ± 0.9 vs. 12.1 ± 1.6 µg/ml, respectively, p = 0.088) (Figure 1E). IL-6 concentrations were below the detection limit for most individuals and are therefore not reported.
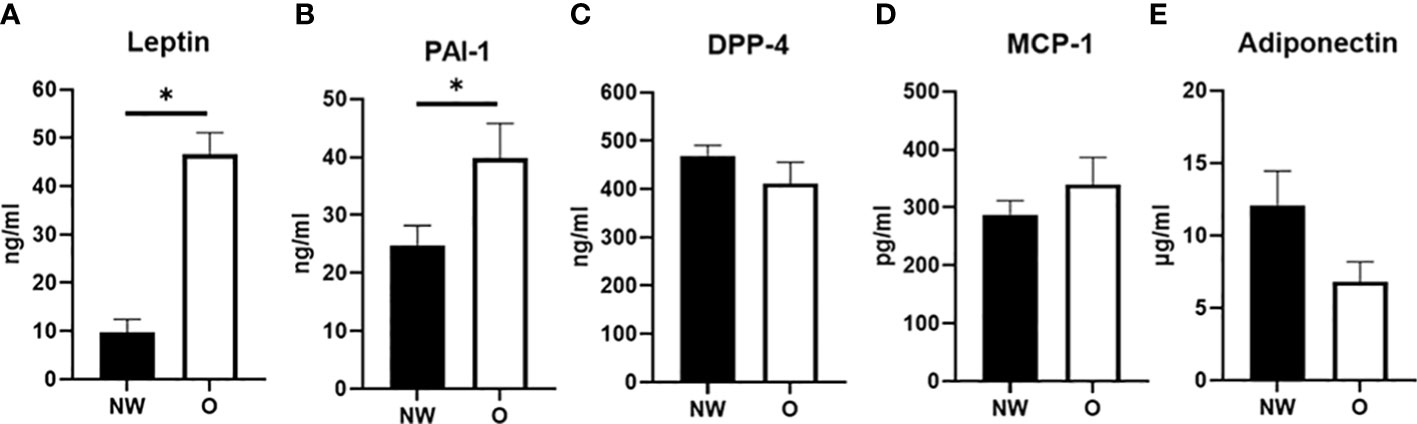
Figure 1 Plasma adipokine concentrations in arterial blood from postmenopausal women with normal weight (n = 9) and obesity (n = 6). (A) Leptin, (B) plasminogen activator inhibitor (PAI-1), (C) dipeptidyl-peptidase (DPP)-4, (D) monocyte chemoattractant protein (MCP-1), and (E) adiponectin; NW, normal weight; O, obesity. Data are expressed as mean ± SEM. *p < 0.05.
3.3 In vivo secretion of adipokines from abdominal and femoral subcutaneous adipose tissue
To explore whether in vivo adipokine release is different across ABD and FEM SAT, we directly measured the fractional release (FR) of several adipokines in women with obesity or normal weight using the arterio-venous balance technique (Figure 2). Significant FR was only found for leptin and MCP-1 (both p = 0.001 vs. zero release). Leptin FR was similar between ABD and FEM depots (30.7 ± 2.6 vs. 44.1 ± 11.4%, respectively, p = 0.383) (Figure 2A). The FR of MCP-1 across ABD SAT was significantly higher than that across FEM SAT (31.6% ± 4.4% vs. 24.2% ± 4.5%, respectively, p = 0.023) (Figure 2D).
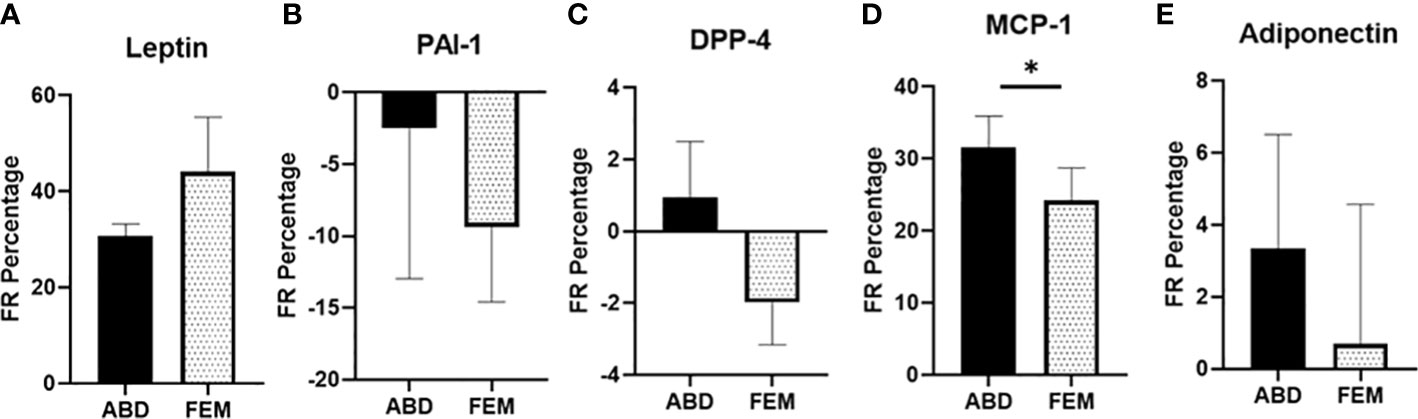
Figure 2 Fractional release of adipokines across subcutaneous abdominal (ABD) and femoral (FEM) subcutaneous adipose tissue (SAT) in postmenopausal women with normal weight (n = 9) and obesity (n = 6). (A) Leptin (B) PAI-1, (C) DPP-4, (D) MCP-1, and (E) adiponectin; paired data from ABD and FEM SAT are shown. Data are expressed as mean ± SEM. *p < 0.05.
3.4 Abdominal and femoral subcutaneous adipose tissue blood flow
Pooled data from women with normal weight and obesity demonstrated that fasting ATBF was not significantly different between ABD and FEM SAT (9.3 ± 2.1 versus 5.8 ± 1.8 ml/min, p = 0.296). More specifically, there were also no significant differences between fasting ABD and FEM ATBF in women with normal weight (p = 0.641, n = 8) and obesity (p = 0.313, n = 6). Furthermore, ABD ATBF (8.4 ± 2.1 vs. 11.2 ± 2.9 ml/min, respectively, p = 0.459) and FEM ATBF (5.3 ± 1.5 vs. 6.4 ± 2.1 ml/min, respectively, p = 0.755) were not significantly different between women with normal weight and obesity.
3.5 Abdominal and femoral adipocyte morphology
Adipocytes from women with normal weight were significantly smaller compared to adipocytes from women with obesity, both for ABD (p = 0.014) and FEM SAT (p = 0.001) (Figure 3A). The smaller mean adipocyte size of ABD and FEM SAT in normal-weight individuals was explained by a lower frequency of very large adipocytes and a higher frequency of very small adipocytes as compared to women with obesity (Figure 3B). Pooled data from women with normal weight and obesity showed that adipocyte size was not different between ABD and FEM SAT (68.5 ± 1.9 versus 68.4 ± 1.6 μm, p = 0.791). In line with this, no significant differences in adipocyte size were found between ABD and FEM SAT in women with normal weight (p = 0.730) and obesity (p = 1.000).
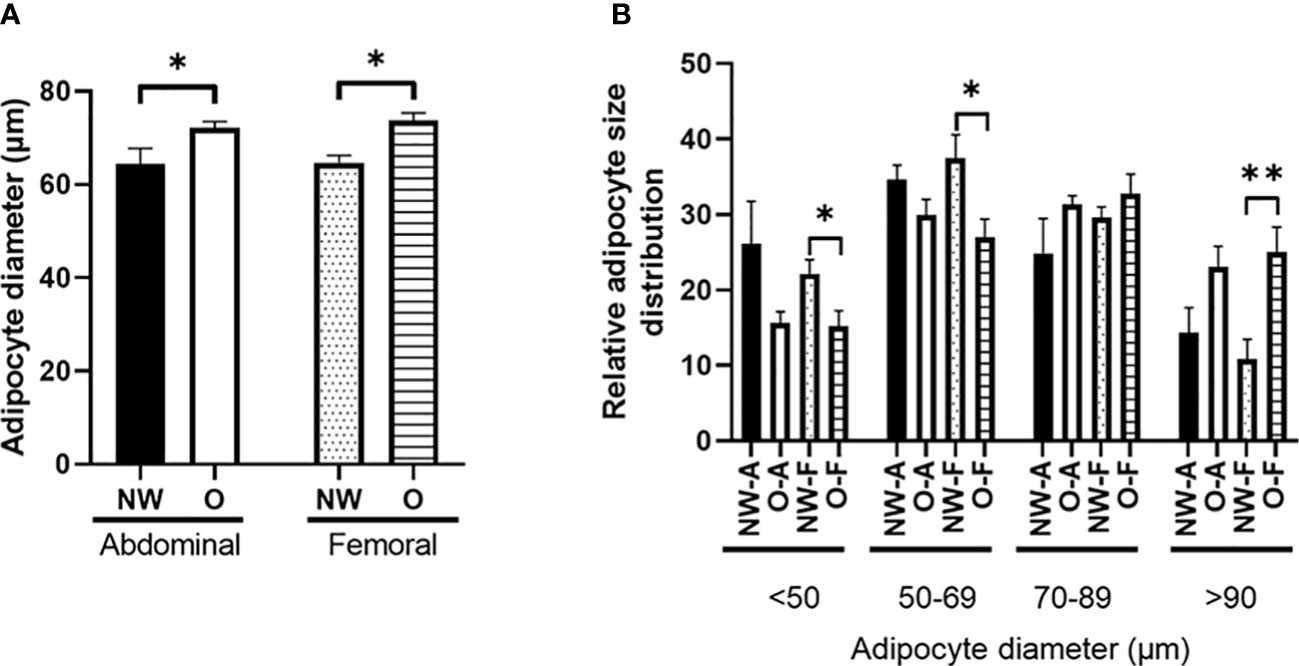
Figure 3 Morphology of subcutaneous adipocytes from individuals with normal weight (n = 11) and obesity (n = 8). (A) Fat cell size; (B) relative adipocyte size distribution (%). NW-A, normal weight ABD; O-A, obese abdominal; NW-F, normal weight FEM; O-F, obese FEM. NW, normal weight; O, obesity. Data are expressed as mean ± SEM. *p < 0.05, **p < 0.001.
3.6 Abdominal and femoral subcutaneous adipose tissue gene expression
Next, we assessed the adipokine gene expression profile in ABD and FEM SAT (Figures 4A–G). Pooled data from women with normal weight or obesity showed that gene expression of leptin (p = 0.010) and MCP-1 (p = 0.027) was significantly lower in ABD than FEM SAT, while a tendency for lower PAI-1 (p = 0.080) and tumor necrosis factor-α (TNF-α; p = 0.090) gene expression in ABD compared to FEM was found. No significant differences in gene expression of IL-6, DPP-4, and adiponectin were found between ABD and FEM SAT.
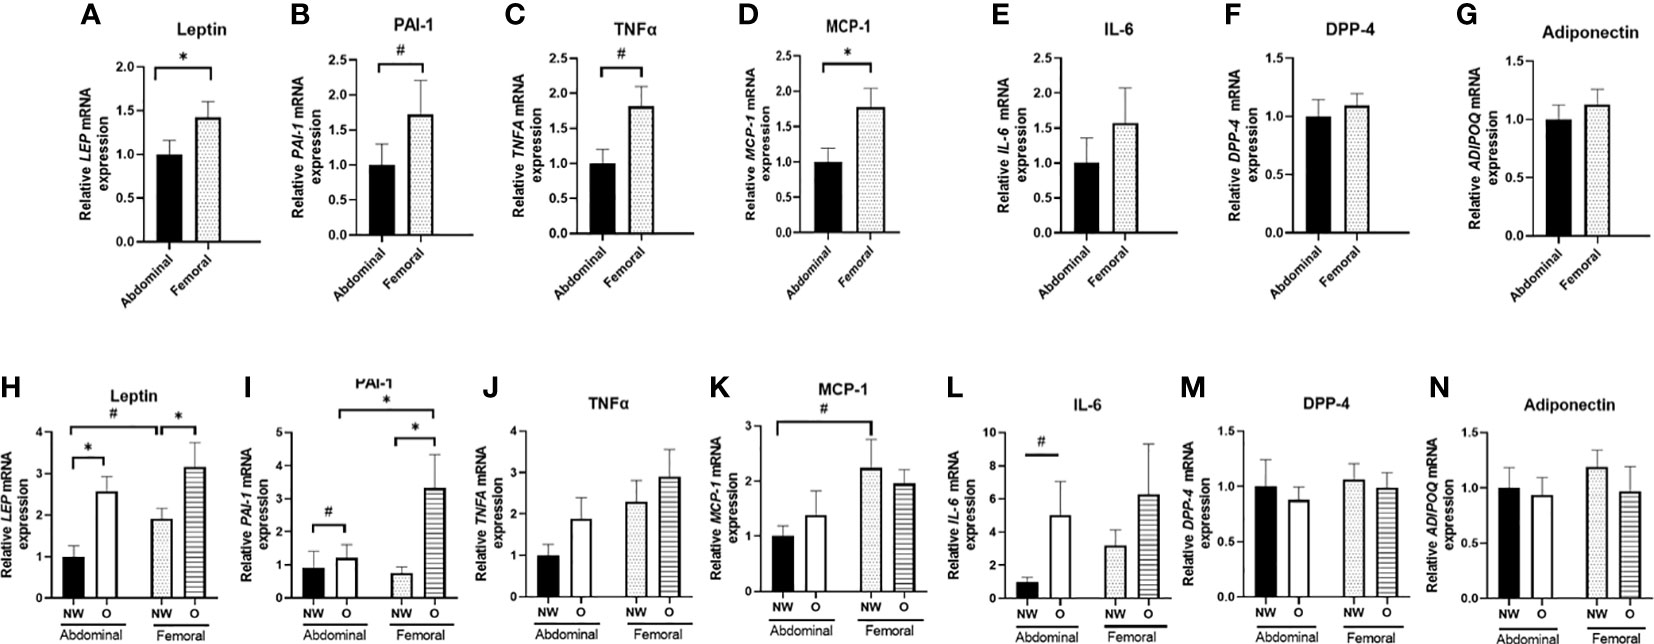
Figure 4 Gene expression of adipokines in ABD and FEM subcutaneous adipose tissue. Data are shown for the total group of women with normal weight and obesity (A–G; pairs n = 18) as well as for the normal weight and obese groups separately (H–N; ABD NW, n = 10, ABD O n = 9, FEM NW n = 11, FEM O n = 9). NW, normal weight; O, obesity. Data are expressed as mean ± SEM. *p < 0.05, # p < 0.01.
Furthermore, we compared adipokine gene expression in women with normal weight and obesity separately (Figures 4H–N). ABD (p = 0.002) and FEM (p = 0.046) SAT gene expression of leptin were significantly higher in women with obesity than normal weight. Furthermore, ABD (p = 0.095) and FEM SAT (p = 0.014) gene expression of PAI-1 were higher in obesity. In addition, ABD SAT gene expression of IL-6 (p = 0.053) tended to be higher in women with obesity than normal weight. When examining SAT depot-differences in normal weight and obese groups separately, we found a significantly lower PAI-1 gene expression in ABD than FEM SAT in women with obesity (p = 0.008). Moreover, leptin (p = 0.052) and MCP-1 (p = 0.075) gene expression tended to be lower in ABD than FEM SAT in individuals with normal weight. No significant SAT depot-differences in adiponectin, DPP-4, and TNF-α gene expression were found in individuals with normal weight and obesity.
We found significant SAT depot-specific correlations between fat cell size and gene expression levels. Leptin gene expression was positively correlated with fat cell size both in ABD (r = 0.657; p = 0.024) and FEM SAT (r = 0.515; p = 0.024), while PAI-1 gene expression in FEM SAT was positively correlated with FEM fat cell size (r = 0.690; p = 0.001) but PAI-1 gene expression in ABD AT was not significantly associated with ABD fat cell size (r = 0.385, p = 0.218). No significant correlations between fat cell size and gene expression levels of IL-6, TNF-α, DPP-4, MCP-1, and adiponectin were found (data not shown).
3.7 Gene expression in differentiated human multipotent adipose-derived stem from abdominal and femoral subcutaneous adipose tissue
Since AT consists of multiple cell types (3), including immune cells, we next specifically examined gene expression in differentiated hMADS derived from ABD and FEM SAT (Figures 5A–G) obtained from the same individuals with normal weight or obesity that underwent in vivo measurements and SAT biopsies (Figure 5). Pooled data from women with normal weight or obesity showed that gene expression of leptin (p = 0.009, Figure 5A), PAI-1 (p < 0.001, Figure 5B), and IL-6 (p < 0.001, Figure 5E) were significantly higher in ABD compared to FEM adipocytes. ABD adipocytes showed a lower gene expression of DPP-4 (p = 0.035, Figure 5F) and adiponectin (p = 0.029, Figure 5G). No significant differences between ABD and FEM adipocytes were observed for TNF-α (p = 0.284, Figure 5C) and MCP-1 (p = 0.712, Figure 5D) gene expression. Gene expression of the adipocyte differentiation markers PPARγ, C/EBPα, PLIN1, and FAS was not significantly different between ABD and FEM adipocytes (Supplementary Materials—Figure 1).
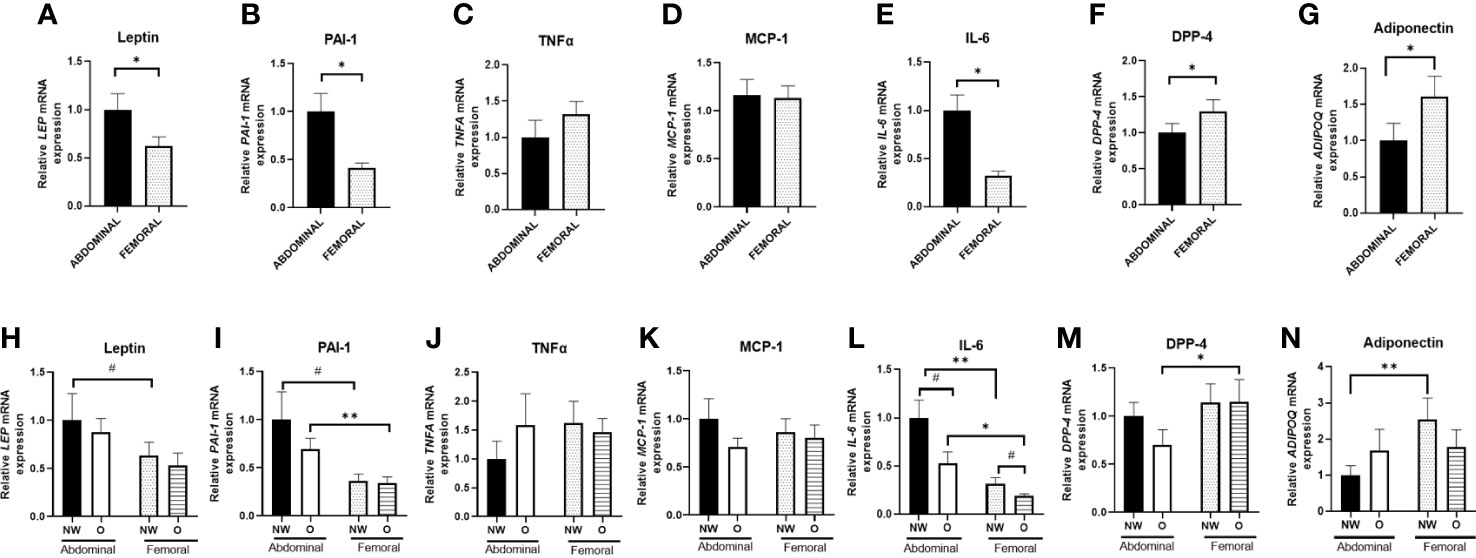
Figure 5 Adipokine gene expression in adipose tissue–derived mesenchymal stem cells that were differentiated for 14 days. Data are shown for the total group of women with normal weight and obesity (A–G; n = 18) as well as for both groups separately (H–N; ABD NW, n = 9; ABD O, n = 9; FEM NW, n = 9; FEM O, n = 9). NW, normal weight; O, obesity. Data are expressed as mean ± SEM. *p < 0.05, **p < 0.001, # p < 0.01.
Furthermore, we compared adipokine gene expression in differentiated adipocytes from women with normal weight or obesity separately (Figures 5H–N). We found a higher gene expression of IL-6 and PAI-1 in ABD compared to FEM adipocytes derived from individuals with normal weight (p = 0.006 and p = 0.068, respectively) and obesity (p = 0.018 and p = 0.002, respectively) (Figures 5L, I). Furthermore, ABD adipocytes derived from normal-weight women showed lower adiponectin (p = 0.005, Figure 5N) and higher leptin (p = 0.098) gene expression compared to FEM adipocytes (Figure 5H). In addition, DPP-4 gene expression (Figure 5M) was significantly lower in ABD than FEM adipocytes derived from women with obesity (p = 0.043). No adipocyte depot-differences were found for TNF-α and MCP-1 gene expression (Figures 5J, K). Finally, IL-6 gene expression tended to be higher in both ABD (p = 0.054) and FEM (p = 0.069) adipocytes derived from women with normal weight compared to obesity (Figure 5L).
3.8 Adipokine secretion from differentiated abdominal and femoral human multipotent adipose-derived stem
Finally, we investigated the secretion of adipokines from human primary ABD and FEM adipocytes (Figure 6). Pooled data from women with normal weight or obesity showed significantly lower secretion of MCP-1 from ABD compared to FEM adipocytes (198.5 ± 39.1 pg/ml versus 337.6 ± 58.5 pg/ml, p = 0.004) (Figure 6C). No significant depot-differences in secretion rates of leptin, PAI-1, IL-6, and DPP-4 between ABD and FEM adipocytes were present.
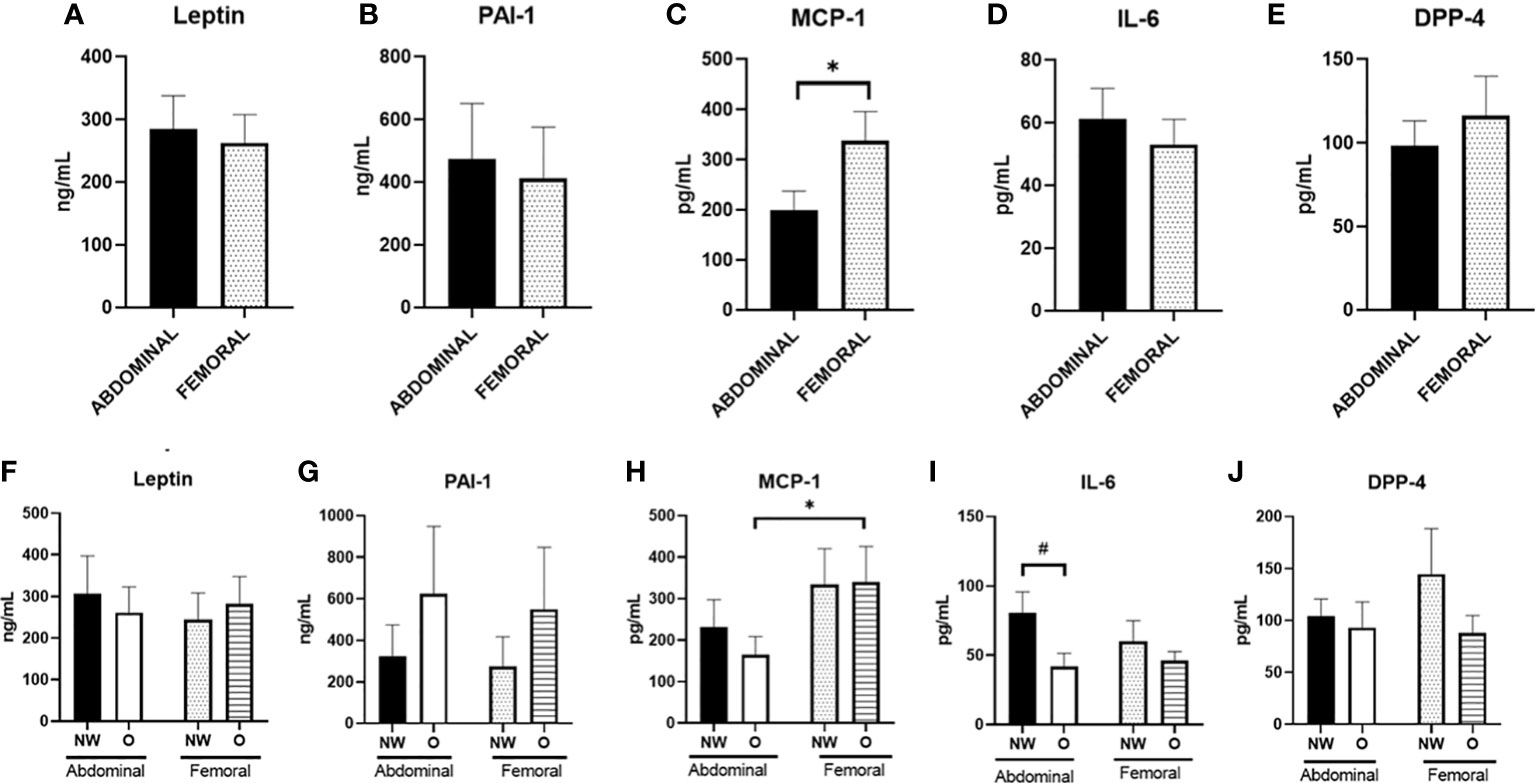
Figure 6 Adipokine secretion from adipose tissue–derived mesenchymal stem cells that were differentiated for 14 days. Data are shown for the total group of women with normal weight and obesity (A–E; n = 18) as well as for both groups separately (F–J); ABD NW, n = 9; abdominal O, n = 9; FEM NW, n = 9; FEM O, n = 9). NW, normal weight; O, obesity. Data are expressed as mean ± SEM. *p < 0.05, # p < 0.01.
When comparing adipokine secretion from ABD and FEM adipocytes from women with normal weight or obesity separately, we found a significantly lower secretion of MCP-1 from ABD compared to FEM adipocytes derived from women with obesity (165 ± 44 vs. 340 ± 85 pg/ml, p = 0.013) (Figure 6H). No significant depot-differences in secretion rates of leptin, PAI-1, IL-6, DPP-4, and MCP-1 between ABD and FEM adipocytes were present. In addition, the secretion of IL-6 from ABD adipocytes tended to be higher in cells derived from women with normal weight compared to obesity (80.5 ± 15.2 pg/ml versus 41.8 ± 9.4 pg/ml, respectively, p = 0.063) (Figure 6D). Adiponectin secretion was below the detection limit, and these data are therefore not reported.
4 Discussion
In the present study, we investigated the inflammatory signatures of ABD and FEM SAT in postmenopausal women with normal weight and obesity. More specifically, we compared the in vivo release of adipokine from ABD and FEM SAT in both groups, examined adipocyte morphology and gene expression of adipokines in these SAT depots, and determined gene expression and secretion of adipokines in vitro using differentiated human primary ABD and FEM subcutaneous adipocytes derived from the same study participants. The present findings demonstrate for the first time that upper and lower body adipose tissue as well as adipocytes are characterized by distinct inflammatory signatures in postmenopausal women with normal weight and obesity.
In the present study, we assessed leptin and adiponectin as classical adipokines altered in obesity (36–39) and determined the expression and secretion of several well-known proinflammatory molecules (TNF-α, IL-6, PAI-1, DPP-4, and MCP-1) that have been linked to obesity and cardiometabolic disease risk (2, 3, 40–49). We found significant fractional release of leptin and MCP-1 from ABD and FEM subcutaneous SAT, with similar fractional release of leptin from both SAT depots and higher release of MCP-1 from ABD compared to FEM SAT. The comparable release of leptin from FEM and ABD SAT is in line with a previous report (23). No release of other adipokines, including PAI-1, DPP-4, and adiponectin, across ABD and FEM SAT was detectable. The latter is in line with previous studies, showing no significant release of adiponectin, IL-6, and DPP-4 across human ABD SAT in people with normal weight and obesity (48, 50). One study that did report in vivo DPP-4 release across human ABD SAT only found significant release in few individuals with low (<288 ng/ml) plasma DPP-4 concentrations (48), while mean DPP-4 concentrations were much higher (>400 ng/ml) in the present study. The lack of detectable adiponectin release across SAT may be explained by a low release rate and long half-life, reflected by relatively constant circulating concentrations of these adipokines (8). We found higher arterial concentrations of leptin and PAI-1 in women with obesity. Since no differences in the in vivo fractional release of these factors from ABD and FEM SAT were found between individuals with normal weight and obesity, the higher-circulating leptin and PAI-1 concentrations are likely explained by the higher total fat mass in obesity.
Differences in the functional properties between AT depots may underlie the cardiometabolic disease risk associated with a certain body fat distribution pattern. Indeed, functional differences between ABD and FEM SAT seem to emerge from adipocytes having distinct properties (4, 9). Many studies have demonstrated a close relationship between adipocyte morphology and AT function, with hypertrophic adipocytes (as often seen in people with obesity) showing impairments in lipid metabolism and a more proinflammatory phenotype, which may aggravate insulin resistance (1, 3, 4, 51). In the present study, women with obesity had larger adipocytes than individuals with normal weight, both in ABD and FEM SAT. However, adipocyte size did not differ between ABD and FEM SAT in both groups. This is in agreement with some (23, 52, 53) but not all previous reports comparing upper and lower body SAT (33, 54–56), and may relate to characteristics of the study populations investigated (i.e., age and metabolic status). Our study participants did not have severe obesity and had, by definition for inclusion in the study, a relatively healthy metabolic profile. In line with adipocyte hypertrophy in women with obesity, we found higher SAT gene expression of leptin, PAI-1, and IL-6 (only in ABD SAT) in the people with obesity. Few studies, however, have directly compared upper and lower body SAT inflammation. Intriguingly, despite similar fat cell sizes in both SAT depots, the present findings demonstrate lower gene expression of leptin, MCP-1, PAI-1, and TNF-α in ABD than FEM SAT. Previous reports indicated that lower body SAT shows a similar (24) or more proinflammatory profile compared to ABD SAT (57). Moreover, global transcriptional profiling of men and women failed to identify differentially expressed clusters of inflammation-specific genes between ABD and gluteal SAT, although stronger associations between the expression of proinflammatory factors and several obesity-related traits were found for ABD SAT (23).
Since whole-AT gene expression profiles are determined by gene expression in multiple adipose-derived cell types such as adipocytes and immune cells, we also specifically investigated gene expression profiles in differentiated human primary ABD and FEM subcutaneous adipocytes derived from the participants that underwent the in vivo measurements and SAT biopsies. Interestingly, we observed that hMADS cells derived from ABD and FEM SAT that have been differentiated in vitro (and therefore been exposed to the same experimental microenvironment) show different gene expression patterns. Indeed, we demonstrate higher gene expression of the proinflammatory factors IL-6 and PAI-1 in ABD compared to FEM adipocytes derived from women with both normal weight and obesity. Furthermore, the expression of leptin was higher and that of adiponectin lower in ABD compared to FEM adipocytes derived from women with normal weight. These findings highlight intrinsic differences in the inflammatory signatures of human ABD and FEM adipocytes, which are already present in cells derived from a healthy (‘non-obese’) AT microenvironment (i.e., normal-weight individuals). In addition, DPP-4 gene expression was lower in ABD than FEM adipocytes derived from women with obesity. Adipocyte differentiation markers were not significantly different between ABD and FEM adipocytes, suggesting that these differences in adipocyte gene expression are not due to differences in adipocyte differentiation between ABD and FEM adipocytes. The fact that inflammatory gene expression was not higher in differentiated human primary ABD and FEM adipocytes derived from women with obesity compared to normal weight provides further support for the notion that adipocyte hypertrophy and/or the contribution of the inflammatory cell component are key factors determining the in vivo AT inflammatory signature. The differences in adipocyte gene expression did, however, not translate into functional differences in the secretion of adipokines. Specifically, we only found a lower secretion of MCP-1 from ABD compared to FEM adipocytes derived from both women with normal weight or obesity, but no differences in the secretion rates of leptin, PAI-1, IL-6, and DPP-4 between ABD and FEM adipocytes were apparent. The discrepancy between MCP-1 fractional release in vivo being higher from ABD versus FEM SAT, while ABD SAT MCP-1 gene expression as well as ABD adipocyte MCP-1 secretion were lower compared to FEM SAT/adipocytes might be explained by depot-differences in post-transcriptional regulation and secretory pathways influencing the release of adipokines from these fat depots. Notably, gene expression of IL-6 was higher in ABD than FEM adipocytes, while no significant differences in IL-6 gene expression were found between ABD and FEM AT. This might be explained by depot-differences in IL-6 expression due to the presence of other cells than adipocytes such as immune cells (58), which warrants further investigation.
A strength of the present study is that we, for the first time, combined paired in vivo measurements across ABD and FEM SAT, analyses in ABD and FEM SAT biopsies, and in vitro experiments using differentiated human primary ABD and FEM subcutaneous adipocytes derived from the study participants. Furthermore, we did not perform the experiments using a pool of stem cells from normal-weight and obese donors (risking those outcomes are influenced/masked by strong effects seen in a specific donor) or a single donor, as often done, but performed the in vitro experiments with cells from many donors with normal weight and obesity separately.
Noteworthy, the present study also has some limitations. First, a formal power calculation was not performed, given the exploratory nature of the study. The number of participants we aimed to include in our study to detect differences was based on previous studies using the arterio-venous balance technique to investigate group differences in adipokines/metabolites across upper-body versus lower-body AT (25). Third, due to the technical difficulties to cannulate and collect blood samples from the small veins in ABD and FEM, we were able to successfully complete sample collection for nine women with normal weight and six women with obesity. Due to the limited number of paired blood samples draining ABD and FEM SAT for the individuals with normal weight and obesity, we could unfortunately not analyze data separately for both groups due to limited statistical power. Secondly, we determined ATBF using Doppler ultrasound, which provides data on intravascular blood flow in relatively large SAT veins rather than at the capillary level (32). Unfortunately, it was not possible to utilize the 133Xe wash-out technique due to the global production stop of medical 133Xe (32). Consequently, we could not quantify absolute fluxes of adipokines per unit AT, and data on in vivo release of adipokines should therefore be interpreted with some caution. Nevertheless, calculation of fractional release of adipokines also yields valuable insights into adipokine release across different AT depots, especially since ATBF was not significantly different between ABD and FEM SAT in the present study. Finally, we only studied the superficial layer of SAT. Previous studies have shown different functional properties when comparing adipocytes derived from the superficial and deep subcutaneous layers (59).
In conclusion, our findings demonstrate that upper and lower body SAT are characterized by distinct inflammatory signatures in postmenopausal women with normal weight and obesity, which seem independent of adipocyte size. Future studies with a larger sample size are warranted to investigate functional differences of upper and lower body SAT in different populations, taking age, sex, metabolic status, body composition, obesity duration and weight cycling, as well as differential immune cell populations into account, and relate these to metabolic health at the whole-body level.
Data Availability Statement
The original data of the present study are included in the article/Supplementary Material. Further inquiries related to raw data can be directed to the corresponding author.
Ethics statement
The studies involving human participants were reviewed and approved by University of Birmingham Ethics committee and the UK Health Research Authority National Health System Research Ethics Committee. The patients/participants provided their written informed consent to participate in this study.
Author contributions
KM and GG acquired funding, conceived, and designed research, interpreted data, and revised the manuscript. IL performed experiments, analyzed data, interpreted data, prepared figures, and drafted the manuscript. NH, YE, JJ, and RD performed experiments and analyzed data. EB and JJ interpreted data and revised the manuscript. All authors contributed to the article and approved the submitted version.
Funding
This work was supported by the European Foundation for the Study of Diabetes (EFSD) under an EFSD/Lilly European Diabetes Research Program grant to GG and KM and Maastricht University (the Netherlands) and the University of Birmingham (UK) under a joint PhD scholarship grant to GG and KM.
Acknowledgments
The authors would like to express their gratitude to the study participants, the teams of the NIHR/Wellcome Trust Clinical Research Facility at Queen Elisabeth Hospital Birmingham, especially research fellows Alessandro Prete, Yasir Elhassan, and Punith Kempegowda and research nurses Nula Kelly, Samantha Timmis, Katie Deans, Hafwen Thornhill, and Claire Brown and the NIHR CRN West Midlands (UK), for support during the clinical studies and Wendy Sluijsmans (Department of Human Biology, Maastricht University Medical Center+, the Netherlands) for the excellent technical assistance with biochemical analysis.
Conflict of interest
The authors declare that the research was conducted in the absence of any commercial or financial relationships that could be construed as a potential conflict of interest.
Publisher’s note
All claims expressed in this article are solely those of the authors and do not necessarily represent those of their affiliated organizations, or those of the publisher, the editors and the reviewers. Any product that may be evaluated in this article, or claim that may be made by its manufacturer, is not guaranteed or endorsed by the publisher.
Supplementary material
The Supplementary Material for this article can be found online at: https://www.frontiersin.org/articles/10.3389/fendo.2023.1205799/full#supplementary-material
References
1. Lempesis IG, van Meijel RLJ, Manolopoulos KN, Goossens GH. Oxygenation of adipose tissue: a human perspective. Acta Physiologica (2020) 228(1):e13298. doi: 10.1111/apha.13298
2. Goossens GH. The role of adipose tissue dysfunction in the pathogenesis of obesity-related insulin resistance. Physiol Behav (2008) 94(2):206–18. doi: 10.1016/j.physbeh.2007.10.010
3. Rosen ED, Spiegelman BM. What we talk about when we talk about fat. Cell (2014) 156(1-2):20–44. doi: 10.1016/j.cell.2013.12.012
4. Goossens GH, Jocken JWE, Blaak EE. Sexual dimorphism in cardiometabolic health: the role of adipose tissue, muscle and liver. Nat Rev Endocrinol (2021) 17(1):47–66. doi: 10.1038/s41574-020-00431-8
5. Goossens GH. The metabolic phenotype in obesity: fat mass, body fat distribution, and adipose tissue function. Obes facts (2017) 10(3):207–15. doi: 10.1159/000471488
6. Yusuf S, Hawken S, Ounpuu S, Bautista L, Franzosi MG, Commerford P, et al. Obesity and the risk of myocardial infarction in 27,000 participants from 52 countries: a case-control study. Lancet (2005) 366(9497):1640–9. doi: 10.1016/S0140-6736(05)67663-5
7. Seidell JC, Perusse L, Despres JP, Bouchard C. Waist and hip circumferences have independent and opposite effects on cardiovascular disease risk factors: the Quebec family study. Am J Clin Nutr (2001) 74(3):315–21. doi: 10.1093/ajcn/74.3.315
8. Karpe F, Pinnick KE. Biology of upper-body and lower-body adipose tissue–link to whole-body phenotypes. Nat Rev Endocrinol (2015) 11(2):90–100. doi: 10.1038/nrendo.2014.185
9. Manolopoulos KN, Karpe F, Frayn KN. Gluteofemoral body fat as a determinant of metabolic health. Int J Obes (2010) 34(6):949–59. doi: 10.1038/ijo.2009.286
10. Christiansen MR, Ureña MG, Borisevich D, Grarup N, Martínez JA, Oppert J-M, et al. Abdominal and gluteofemoral fat depots show opposing associations with postprandial lipemia. Am J Clin Nutr (2021) 114(4):1467–75. doi: 10.1093/ajcn/nqab219
11. Fox CS, Massaro JM, Hoffmann U, Pou KM, Maurovich-Horvat P, Liu C-Y, et al. Abdominal visceral and subcutaneous adipose tissue compartments: association with metabolic risk factors in the framingham heart study. Circulation (2007) 116(1):39–48. doi: 10.1161/CIRCULATIONAHA.106.675355
12. Matsha TE, Ismail S, Speelman A, Hon GM, Davids S, Erasmus RT, et al. Visceral and subcutaneous adipose tissue association with metabolic syndrome and its components in a south African population. Clin Nutr ESPEN (2019) 32:76–81. doi: 10.1016/j.clnesp.2019.04.010
13. Rønn PF, Andersen GS, Lauritzen T, Christensen DL, Aadahl M, Carstensen B, et al. Abdominal visceral and subcutaneous adipose tissue and associations with cardiometabolic risk in Inuit, africans and europeans: a cross-sectional study. BMJ Open (2020) 10(9):e038071. doi: 10.1136/bmjopen-2020-038071
14. Bays HE. Adiposopathy: is “Sick fat” a cardiovascular disease? J Am Coll Cardiol (2011) 57(25):2461–73. doi: 10.1016/j.jacc.2011.02.038
15. Shulman GI. Ectopic fat in insulin resistance, dyslipidemia, and cardiometabolic disease. New Engl J Med (2014) 371(12):1131–41. doi: 10.1056/NEJMra1011035
16. Goossens GH, Blaak EE. Adipose tissue dysfunction and impaired metabolic health in human obesity: a matter of oxygen? Front Endocrinol (2015) 6(55). doi: 10.3389/fendo.2015.00055
17. Frayn KN, Karpe F. Regulation of human subcutaneous adipose tissue blood flow. Int J Obes (2014) 38(8):1019–26. doi: 10.1038/ijo.2013.200
18. Potts JL, Coppack SW, Fisher RM, Humphreys SM, Gibbons GF, Frayn KN. Impaired postprandial clearance of triacylglycerol-rich lipoproteins in adipose tissue in obese subjects. Am J Physiology-Endocrinology And Metab (1995) 268(4):E588–E94. doi: 10.1152/ajpendo.1995.268.4.E588
19. Riemens SC, Sluiter WJ, Dullaart RP. Enhanced escape of non-esterified fatty acids from tissue uptake: its role in impaired insulin-induced lowering of total rate of appearance in obesity and type II diabetes mellitus. Diabetologia (2000) 43(4):416–26. doi: 10.1007/s001250051324
20. McQuaid SE, Hodson L, Neville MJ, Dennis AL, Cheeseman J, Humphreys SM, et al. Downregulation of adipose tissue fatty acid trafficking in obesity. a driver for ectopic fat deposition? Diabetes (2011) 60(1):47–55. doi: 10.2337/db10-0867
21. Pi-Sunyer FX. The epidemiology of central fat distribution in relation to disease. Nutr Rev (2004) 62(suppl_2):S120–S6. doi: 10.1111/j.1753-4887.2004.tb00081.x
22. McQuaid SE, Humphreys SM, Hodson L, Fielding BA, Karpe F, Frayn KN. Femoral adipose tissue may accumulate the fat that has been recycled as VLDL and nonesterified fatty acids. Diabetes (2010) 59(10):2465–73. doi: 10.2337/db10-0678
23. Pinnick KE, Nicholson G, Manolopoulos KN, McQuaid SE, Valet P, Frayn KN, et al. Distinct developmental profile of lower-body adipose tissue defines resistance against obesity-associated metabolic complications. Diabetes (2014) 63(11):3785–97. doi: 10.2337/db14-0385
24. Malisova L, Rossmeislova L, Kovacova Z, Kracmerova J, Tencerova M, Langin D, et al. Expression of inflammation-related genes in gluteal and abdominal subcutaneous adipose tissue during weight-reducing dietary intervention in obese women. Physiol Res (2014) 63(1):73–82. doi: 10.33549/physiolres.932537
25. Manolopoulos KN, O'Reilly MW, Bujalska IJ, Tomlinson JW, Arlt W. Acute hypercortisolemia exerts depot-specific effects on abdominal and femoral adipose tissue function. J Clin Endocrinol Metab (2017) 102(4):1091–101. doi: 10.1210/jc.2016-3600
26. Kaul S, Rothney MP, Peters DM, Wacker WK, Davis CE, Shapiro MD, et al. Dual-energy X-ray absorptiometry for quantification of visceral fat. Obesity (2012) 20(6):1313–8. doi: 10.1038/oby.2011.393
27. Frayn KN, Coppack SW. Assessment of white adipose tissue metabolism by measurement of arteriovenous differences. In: Ailhaud G, editor. Adipose tissue protocols. Totowa, NJ: Springer New York (2001). p. 269–79.
28. Melvin A, McQuaid SE. In-vivo metabolic studies of regional adipose tissue. Cardiovasc Endocrinol Metab (2018) 7(4):75–9. doi: 10.1097/XCE.0000000000000154
29. Frayn K, Coppack S, Humphreys S, Whyte P. Metabolic characteristics of human adipose tissue in vivo. Clin Sci (1989) 76(5):509–16. doi: 10.1042/cs0760509
30. Frayn KN, Coppack SW, Humphreys SM. Subcutaneous adipose tissue metabolism studied by local catheterization. Int J Obes related Metab Disord J Int Assoc Study Obes (1993) 17 Suppl 3:S18–21.
31. McQuaid SE, Manolopoulos KN, Dennis AL, Cheeseman J, Karpe F, Frayn KN. Development of an arterio-venous difference method to study the metabolic physiology of the femoral adipose tissue depot. Obes (Silver Spring Md (2010) 18(5):1055–8. doi: 10.1038/oby.2009.486
32. Lempesis IG, Goossens GH, Manolopoulos KN. Measurement of human abdominal and femoral intravascular adipose tissue blood flow using percutaneous Doppler ultrasound. Adipocyte (2021) 10(1):119–23. doi: 10.1080/21623945.2021.1888471
33. Vogel MAA, Jocken JWE, Sell H, Hoebers N, Essers Y, Rouschop KMA, et al. Differences in upper and lower-body adipose tissue oxygen tension contribute to the adipose tissue phenotype in humans. J Clin Endocrinol Metab (2018) 103(10):3688–97. doi: 10.1210/jc.2018-00547
34. Wallace TM, Levy JC, Matthews DR. Use and abuse of HOMA modeling. Diabetes Care (2004) 27(6):1487–95. doi: 10.2337/diacare.27.6.1487
35. Jocken JWE, Goossens GH, Popeijus H, Essers Y, Hoebers N, Blaak EE. Contribution of lipase deficiency to mitochondrial dysfunction and insulin resistance in hMADS adipocytes. Int J Obes (2016) 40(3):507–13. doi: 10.1038/ijo.2015.211
36. Mantzoros CS, Magkos F, Brinkoetter M, Sienkiewicz E, Dardeno TA, Kim S-Y, et al. Leptin in human physiology and pathophysiology. Am J Physiology-Endocrinology Metab (2011) 301(4):E567–E84. doi: 10.1152/ajpendo.00315.2011
37. Straub LG, Scherer PE. Metabolic messengers: adiponectin. Nat Metab (2019) 1(3):334–9. doi: 10.1038/s42255-019-0041-z
38. Santaniemi M, Kesaniemi YA, Ukkola O. Low plasma adiponectin concentration is an indicator of the metabolic syndrome. Eur J Endocrinol (2006) 155(5):745–50. doi: 10.1530/eje.1.02287
39. Achari AE, Jain SK. Adiponectin, a therapeutic target for obesity, diabetes, and endothelial dysfunction. Int J Mol Sci (2017) 18(6):1321. doi: 10.3390/ijms18061321
40. Fasshauer M, Bluher M. Adipokines in health and disease. Trends Pharmacol Sci (2015) 36(7):461–70. doi: 10.1016/j.tips.2015.04.014
41. Lamers D, Famulla S, Wronkowitz N, Hartwig S, Lehr S, Ouwens DM, et al. Dipeptidyl peptidase 4 is a novel adipokine potentially linking obesity to the metabolic syndrome. Diabetes (2011) 60(7):1917–25. doi: 10.2337/db10-1707
42. Kim CS, Park HS, Kawada T, Kim JH, Lim D, Hubbard NE, et al. Circulating levels of MCP-1 and IL-8 are elevated in human obese subjects and associated with obesity-related parameters. Int J Obes (2006) 30(9):1347–55. doi: 10.1038/sj.ijo.0803259
43. Sethi JK, Hotamisligil GS. Metabolic messengers: tumour necrosis factor. Nat Metab (2021) 3(10):1302–12. doi: 10.1038/s42255-021-00470-z
44. Kern PA, Ranganathan S, Li C, Wood L, Ranganathan G. Adipose tissue tumor necrosis factor and interleukin-6 expression in human obesity and insulin resistance. Am J physiology-endocrinology Metab (2001) 280(5):E745–51. doi: 10.1152/ajpendo.2001.280.5.E745
45. Ouchi N, Parker JL, Lugus JJ, Walsh K. Adipokines in inflammation and metabolic disease. Nat Rev Immunol (2011) 11(2):85–97. doi: 10.1038/nri2921
46. Nawaz SS, Siddiqui K. Plasminogen activator inhibitor-1 mediate downregulation of adiponectin in type 2 diabetes patients with metabolic syndrome. Cytokine: X (2022) 4(1):100064. doi: 10.1016/j.cytox.2022.100064
47. Drucker DJ. Incretin action in the pancreas: potential promise, possible perils, and pathological pitfalls. Diabetes (2013) 62(10):3316–23. doi: 10.2337/db13-0822
48. Sell H, Blüher M, Klöting N, Schlich R, Willems M, Ruppe F, et al. Adipose dipeptidyl peptidase-4 and obesity: correlation with insulin resistance and depot-specific release from adipose tissue in vivo and in vitro. Diabetes Care (2013) 36(12):4083–90. doi: 10.2337/dc13-0496
49. Bruun JM, Lihn AS, Pedersen SB, Richelsen B. Monocyte chemoattractant protein-1 release is higher in visceral than subcutaneous human adipose tissue (AT): implication of macrophages resident in the AT. J Clin Endocrinol Metab (2005) 90(4):2282–9. doi: 10.1210/jc.2004-1696
50. Goossens GH, Jocken JWE, Van Baak MA, Jansen EHJM, Saris WHM, Blaak EE. Short-term β-adrenergic regulation of leptin, adiponectin and interleukin-6 secretion in vivo in lean and obese subjects. Diabetes Obes Metab (2008) 10(11):1029–38. doi: 10.1111/j.1463-1326.2008.00856.x
51. Stinkens R, Goossens GH, Jocken JW, Blaak EE. Targeting fatty acid metabolism to improve glucose metabolism. Obes Rev (2015) 16(9):715–57. doi: 10.1111/obr.12298
52. Mauriege P, Imbeault P, Prud’Homme D, Tremblay A, Nadeau A, Despres J. Subcutaneous adipose tissue metabolism at menopause: importance of body fatness and regional fat distribution. J Clin Endocrinol Metab (2000) 85(7):2446–54. doi: 10.1210/jc.85.7.2446
53. Lönn M, Mehlig K, Bengtsson C, Lissner L. Adipocyte size predicts incidence of type 2 diabetes in women. FASEB J (2010) 24(1):326–31. doi: 10.1096/fj.09-133058
54. Hames KC, Koutsari C, Santosa S, Bush NC, Jensen MD. Adipose tissue fatty acid storage factors: effects of depot, sex and fat cell size. Int J Obes (2015) 39(6):884–7. doi: 10.1038/ijo.2015.10
55. Mundi MS, Karpyak MV, Koutsari C, Votruba SB, O'Brien PC, Jensen MD. Body fat distribution, adipocyte size, and metabolic characteristics of nondiabetic adults. J Clin Endocrinol Metab (2010) 95(1):67–73. doi: 10.1210/jc.2009-1353
56. Santosa S, Jensen MD. Adipocyte fatty acid storage factors enhance subcutaneous fat storage in postmenopausal women. Diabetes (2013) 62(3):775–82. doi: 10.2337/db12-0912
57. Evans J, Goedecke JH, Söderström I, Burén J, Alvehus M, Blomquist C, et al. Depot- and ethnic-specific differences in the relationship between adipose tissue inflammation and insulin sensitivity. Clin Endocrinol (Oxf) (2011) 74(1):51–9. doi: 10.1111/j.1365-2265.2010.03883.x
58. Fain JN. Release of interleukins and other inflammatory cytokines by human adipose tissue is enhanced in obesity and primarily due to the nonfat cells. Vitamins Hormones (2006) 74:443–77. doi: 10.1016/S0083-6729(06)74018-3
Keywords: adipose tissue, adipokines, inflammation, body fat distribution, obesity
Citation: Lempesis IG, Hoebers N, Essers Y, Jocken JWE, Dineen R, Blaak EE, Manolopoulos KN and Goossens GH (2023) Distinct inflammatory signatures of upper and lower body adipose tissue and adipocytes in women with normal weight or obesity. Front. Endocrinol. 14:1205799. doi: 10.3389/fendo.2023.1205799
Received: 14 April 2023; Accepted: 02 June 2023;
Published: 26 June 2023.
Edited by:
Luca Busetto, University of Padua, ItalyReviewed by:
Valeria Guglielmi, University of Rome Tor Vergata, ItalyGeorgia Colleluori, Marche Polytechnic University, Italy
Copyright © 2023 Lempesis, Hoebers, Essers, Jocken, Dineen, Blaak, Manolopoulos and Goossens. This is an open-access article distributed under the terms of the Creative Commons Attribution License (CC BY). The use, distribution or reproduction in other forums is permitted, provided the original author(s) and the copyright owner(s) are credited and that the original publication in this journal is cited, in accordance with accepted academic practice. No use, distribution or reproduction is permitted which does not comply with these terms.
*Correspondence: Gijs H. Goossens, G.Goossens@maastrichtuniversity.nl
†These authors have contributed equally to this work and share last authorship