 Bo Song
 Cihang Lu
 Di Teng
 Weiping Teng
- Department of Endocrinology and Metabolism, Institute of Endocrinology, National Health Commission Key Laboratory of Diagnosis and Treatment of Thyroid Diseases, The First Hospital of China Medical University, Shenyang, Liaoning, China
Background: Increased body mass index (BMI) and metabolic abnormalities both have potential associations with thyroid disease. The aim of this study was to investigate the correlation between different metabolic phenotypes of obesity and thyroid disorders using nationwide data from China.
Methods: Data were collected from a cross-sectional survey called the Thyroid Disorders, Iodine Status, and Diabetes Epidemiological Survey conducted between 2015 and 2017 in China. A total of 69007 subjects aged 18 years or older were defined and divided into six groups on the basis of BMI and metabolic health status: metabolically healthy normal weight (MHNW), metabolically unhealthy normal weight (MUNW), metabolically healthy overweight (MHOW), metabolically unhealthy overweight (MUOW), metabolically healthy obesity (MHO), and metabolically unhealthy obesity (MUO). We estimated the odds ratios (ORs) and confidence intervals [CIs] for different thyroid disorders according to metabolic phenotypes using multivariate logistic regression models.
Results: In our study, we found that the prevalence of subclinical hypothyroidism was almost as high in the MUNW group as in the MUO group, the prevalence of overt hyperthyroidism was highest in the MUNW group and Graves’ disease was highest in the MHO group. Our results also suggested that the prevalence of goiter and thyroid nodules increased with increased BMI values and that the MUO group had the highest incidence. Multivariate logistic regression analysis indicated that subjects with unhealthy metabolic phenotypes (MUNW, MUOW, and MUO) all had an increased risk of subclinical hypothyroidism, regardless of their BMI. MUNW subjects had an approximately 1.6-fold higher risk of overt hyperthyroidism and a 1.8-fold higher risk of Graves’ disease than their metabolically healthy counterparts (MHNW). The present study also demonstrated that the MUO group had the highest risk of goiter and thyroid nodules among the metabolic phenotypes of obesity.
Conclusion: Based on our study, we found that metabolic abnormalities and obesity play different roles in various thyroid diseases. Metabolically unhealthy individuals, both with and without obesity, have a higher risk of thyroid disorders than metabolically healthy individuals without obesity.
1 Introduction
With rapid economic development and lifestyle changes, obesity has become a common health problem in both developed and developing countries (1, 2). The prevalence of obesity has increased rapidly worldwide. Ward et al. (3) suggested that up to 57.8% of the population of the United States will be overweight or obese by 2030. Due to its high incidence worldwide, it is essential to find a more scientific treatment for obesity that may help save health care resources. Metabolic health is also receiving increasing attention. Recent studies identified a subgroup of obese subjects with a low burden of metabolic abnormalities as having the so-called metabolically healthy obesity (MHO) phenotype (4). Metabolic health refers to the absence of both metabolic syndrome and any known diabetes, coronary artery disease, stroke, hypertension or dyslipidemia (5). In addition, not all individuals in the normal weight range present with a healthy metabolic and disease-free profile. Approximately 20% of the normal weight adult population is metabolically unhealthy, displaying an increased risk of obesity-related abnormalities such as reduced insulin sensitivity, elevated blood pressure, atherogenic lipids, and cardiovascular events (6, 7).
In recent years, several studies have shown that metabolic syndrome (MetS) and obesity are independent risk factors for developing serious diseases, such as type 2 diabetes mellitus (T2DM) (8), cardiovascular disease (CVD) (9), and malignant tumors (10). However, few studies have explored the relationship between metabolic obesity phenotypes and thyroid disorders. The thyroid plays an important role in metabolic regulation. Thyroid hormones have multiple effects on glucose and lipid metabolism, blood pressure regulation, and energy consumption. Recent studies found that patients with hypothyroidism had an increased risk of metabolic syndrome (11). Sari et al. discovered that functional and morphological alterations of the thyroid gland were associated with obesity (12). In addition, increased thyroid volume and nodule prevalence were reported for the first time insulin resistance(IR) patients in an iodine-sufficient area (13).
Thyroid Disorders, Iodine Status and Diabetes (TIDE), a national epidemiological cross-sectional study, was conducted from 2015 to 2017 covering all 31 provinces of mainland China. The overall results have been previously reported (14). All subjects received a complete questionnaire survey, physical examination, laboratory examination, and body composition examination. Baseline data for body mass index (BMI), metabolic status and thyroid function were collected to identify the association between the metabolic phenotype and thyroid disorders in the Chinese population. Therefore, the present study aimed to investigate this association between metabolic phenotypes and thyroid disorders using TIDE data.
2 Materials and methods
2.1 Subjects
For this cross-sectional study, we obtained data from subjects who participated in the TIDE survey. The TIDE survey is a national epidemiological cross-sectional survey conducted in 31 provincial regions of mainland China using a whole-cluster, stratified random sampling design. The specific sampling and implementation methods have been previously published and described in Supplementary Method 1 (15). A total of 80937 adults were deemed eligible for this study and completed the survey. In the current analysis, we excluded 6467 subjects who did not have demographic and thyroid function test information as well as 5463 individuals who had incomplete data regarding metabolic status. Therefore, the final sample consisted of 69007 respondents. The flowchart of patient inclusion is shown in Supplementary Figure S1. This study was conducted according to the Declaration of Helsinki as revised in 2013, and the protocol was approved by the Ethics Committee of China Medical University (2014-103-2; serial number: IRB [2008]115). All participants gave their written informed consent before this study.
2.2 Data collection
Basic sociodemographic and clinical information about the subjects was obtained by trained investigators using a standardized questionnaire. This information included age, sex, education level, regional location, personal and family medical history, lifestyle habits such as current smoking status, family income, and household salt consumption. Standardized measurements of the participants’ height, weight, waist circumference (WC), and blood pressure (BP) were taken. BMI was calculated by dividing weight in kg by height in square meters (kg/m2). Prior to measuring BP, participants were asked to rest in a seated position for 5 minutes, and three measurements were taken using a mercury sphygmomanometer. The average of three readings was calculated for systolic and diastolic BP. Height, weight, and waist and hip circumference were measured with the participant in light clothing and without shoes.
All participants underwent an oral glucose tolerance test (OGTT) after 10 hours of overnight fasting followed by early morning fasting blood and spot urine sample collection. These samples were used for basic biochemical examinations, including fasting plasma glucose (FPG), lipid profile, glycosylated hemoglobin (HbA1c), thyroid function, 2-hour plasma glucose (2-hPG), uric acid (UA), and urinary iodine concentration (UIC). Serum and urine samples were obtained by centrifugation of the blood samples and preserved at -20°C before analysis. Upon completion of the survey and specimen collection, all specimens were transported via a cold chain system to the central laboratory in Shenyang, China.
2.3 Laboratory measurements
Total cholesterol (TC), high-density lipoprotein cholesterol (HDL-C), triglycerides (TGs) and low-density lipoprotein cholesterol (LDL-C) were measured with an automatic biochemical analyzer (Mindray BS-180 Analyzer). Bio-Rad reagents were used for HbA1c measurement. We used the hexokinase enzymatic method to measure fasting blood glucose. Serum thyroid-stimulating hormone (TSH) and free thyroxine (FT4) values were measured with an electrochemiluminescence immunoassay on a Cobas 601 analyzer (Roche Diagnostics, Switzerland). Serum TSH, thyroid peroxidase antibodies (TPOAbs) and thyroglobulin antibodies (TGAbs) were measured with an electrochemiluminescence immunoassay on a Cobas 601 analyzer (Roche Diagnostics, Switzerland). When the TSH level exceeded the upper limit of the reference range (0.27-4.20 mIU/L), FT4 and free triiodothyronine (FT3) levels were measured. UIC was measured by inductively coupled plasma−mass spectrometry (Agilent 7700x; Agilent Technologies, Santa Clara, CA). All participants underwent thyroid ultrasonography by specially trained technicians using a portable instrument (LOGIQ 100 PRO; GE, Milwaukee, WI, with 7.5-MHz linear transducers). Two trained quality control personnel apart from the sonographers were responsible for supervising the accuracy and reliability of the ultrasound results.
2.4 Definition of body weight status and metabolic phenotype
A definition for metabolically healthy adults has recently been proposed that meets all of the following criteria (1): systolic blood pressure (SBP) ≤130 mmHg, diastolic blood pressure (DBP) ≤85 mmHg, no antihypertensive treatment and no self-reported history of hypertension; (2) HDL-cholesterol>1 mmol/L (>40 mg/dl) for men and >1.3 mmol/l (>50 mg/dl) for women; (3) serum triglycerides ≤ 1.7 mmol/l (≤150 mg/dl); and (4) fasting plasma glucose ≤ 5.6 mmol/l (≤100 mg/dl) and no drug treatment with glucose-lowering agents and no self-reported history of diabetes (16). Body weight status was categorized according to the Working Group on Obesity in China (17) as normal weight (BMI ≥ 18.5 and < 24 kg/m2), overweight (BMI≥ 24 and < 28 kg/m2), and obesity (BMI≥28 kg/m2). In addition, the metabolically unhealthy phenotype was defined within each BMI group who did not meet at least one of the four criteria. Based on the BMI categories and metabolic health status, all study subjects were divided into 6 groups: metabolically healthy normal weight (MHNW), metabolically healthy overweight (MHOW), metabolically healthy obesity (MHO), metabolically unhealthy normal weight (MUNW), metabolically unhealthy overweight (MUOW), and metabolically unhealthy obesity (MUO).
2.5 Clinical diagnosis
The diagnostic criteria for thyroid disorders are listed in Table 1.
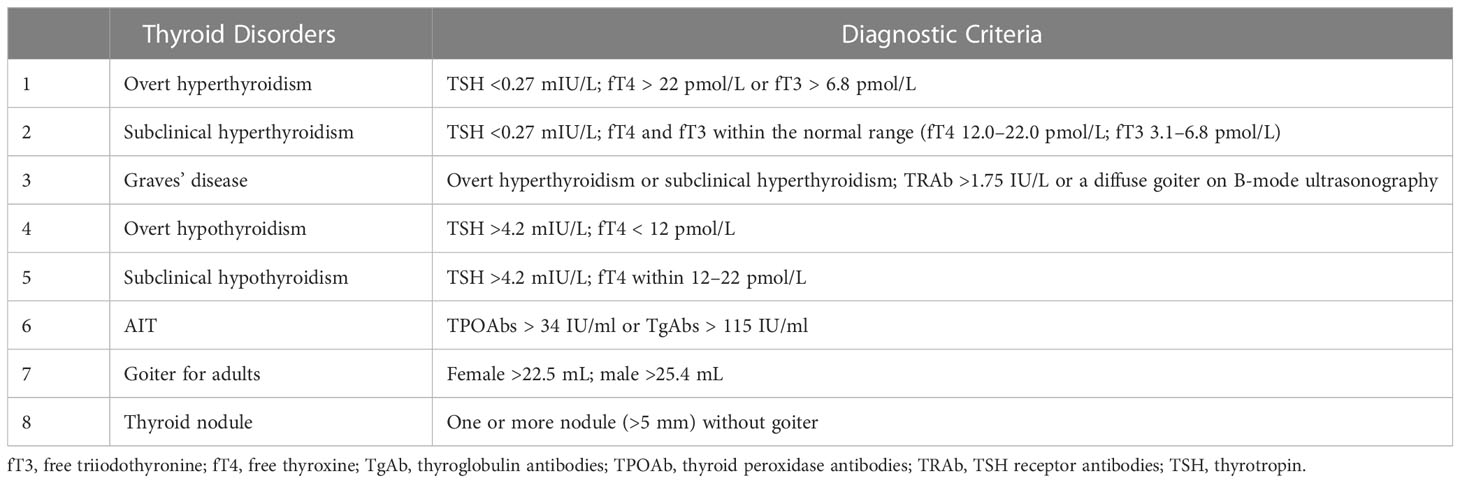
Table 1 Diagnostic criteria for thyroid disorders.
2.6 Statistical analysis
All statistical analyses were performed using SPSS software (version 23.0; IBM Corp., Armonk, NY, USA). Statistical significance was defined as P<0.05. To obtain national estimates, all calculations were weighted to represent the overall Chinese adult population aged 18 years or older using the weighted coefficients derived from 2010 China population census data and the sampling scheme of the current survey. Standard errors were calculated with appropriate statistical techniques with data from the complex survey design. We performed a descriptive analysis of BMI, UIC, TPOAbs, TgAbs, TSH levels, and thyroid volume using quartile stratification and compared the medians for differences using Student’s independent t test. To assess the independence of two categorical variables, the chi-square test or Fisher’s exact test was used. Baseline characteristics are presented as weighted means ± standard errors (SEs) for continuous variables and numbers (percentages) for categorical variables depending on their type. Univariable and multivariable logistic regression were used to estimate odds ratios (ORs) with 95% confidence intervals [CIs] for the association between the six metabolic obesity categories and the risk of thyroid disorders. We fitted 3 logistic regression models. Model 1 was a crude model that was not adjusted for covariates. Model 2 was adjusted for age, sex and ethnicity. Model 3 was further adjusted for smoking status, educational level, family income, UIC, TPOAbs, and TgAbs except for AIT, which was adjusted for smoking status, educational level, family income and UIC. In all analyses, P < 0.05 was considered statistically significant.
3 Results
3.1 Baseline characteristics of the participants
Table 2 summarizes the demographic and biochemical characteristics of the six groups of participants, which included 69007 subjects (34690 men and 34317 women). In the study population, the metabolically unhealthy group was the largest group (64.10%). Among the normal weight participants, almost half were metabolically unhealthy (MHNW 26.14%, MUNW 25.47%). Among the rest of the participants, with the increase in BMI, the proportion of metabolically unhealthy individuals gradually increased (MHOW 8.00%, MUOW 26.00%, MHO 1.75%, MUO 12.54%). Compared with the metabolically healthy group, metabolically unhealthy subjects were more likely to be older and male (P< 0.0001). The metabolically unhealthy group had more current smokers, more rural residents, lower educational levels and lower family incomes than the metabolically healthy group. In addition, people of Han ethnicity were more likely to be metabolically unhealthy than people of other ethnicities. Compared with metabolically healthy individuals, the metabolically unhealthy population comprised individuals with higher anthropometric indexes (BMI, WC), individuals with a more unfavorable risk profile (higher levels of blood pressure, FPG, uric acid, TSH and HbA1c, dyslipidemia, and lower levels of HDL-C) and individuals with lower UIC values (P< 0.0001). In addition, within the different metabolic status groups, the above indicators also gradually increased with increasing BMI (P< 0.0001). There was no difference in the TSH, TPOAb, or TGAb values between these six groups.
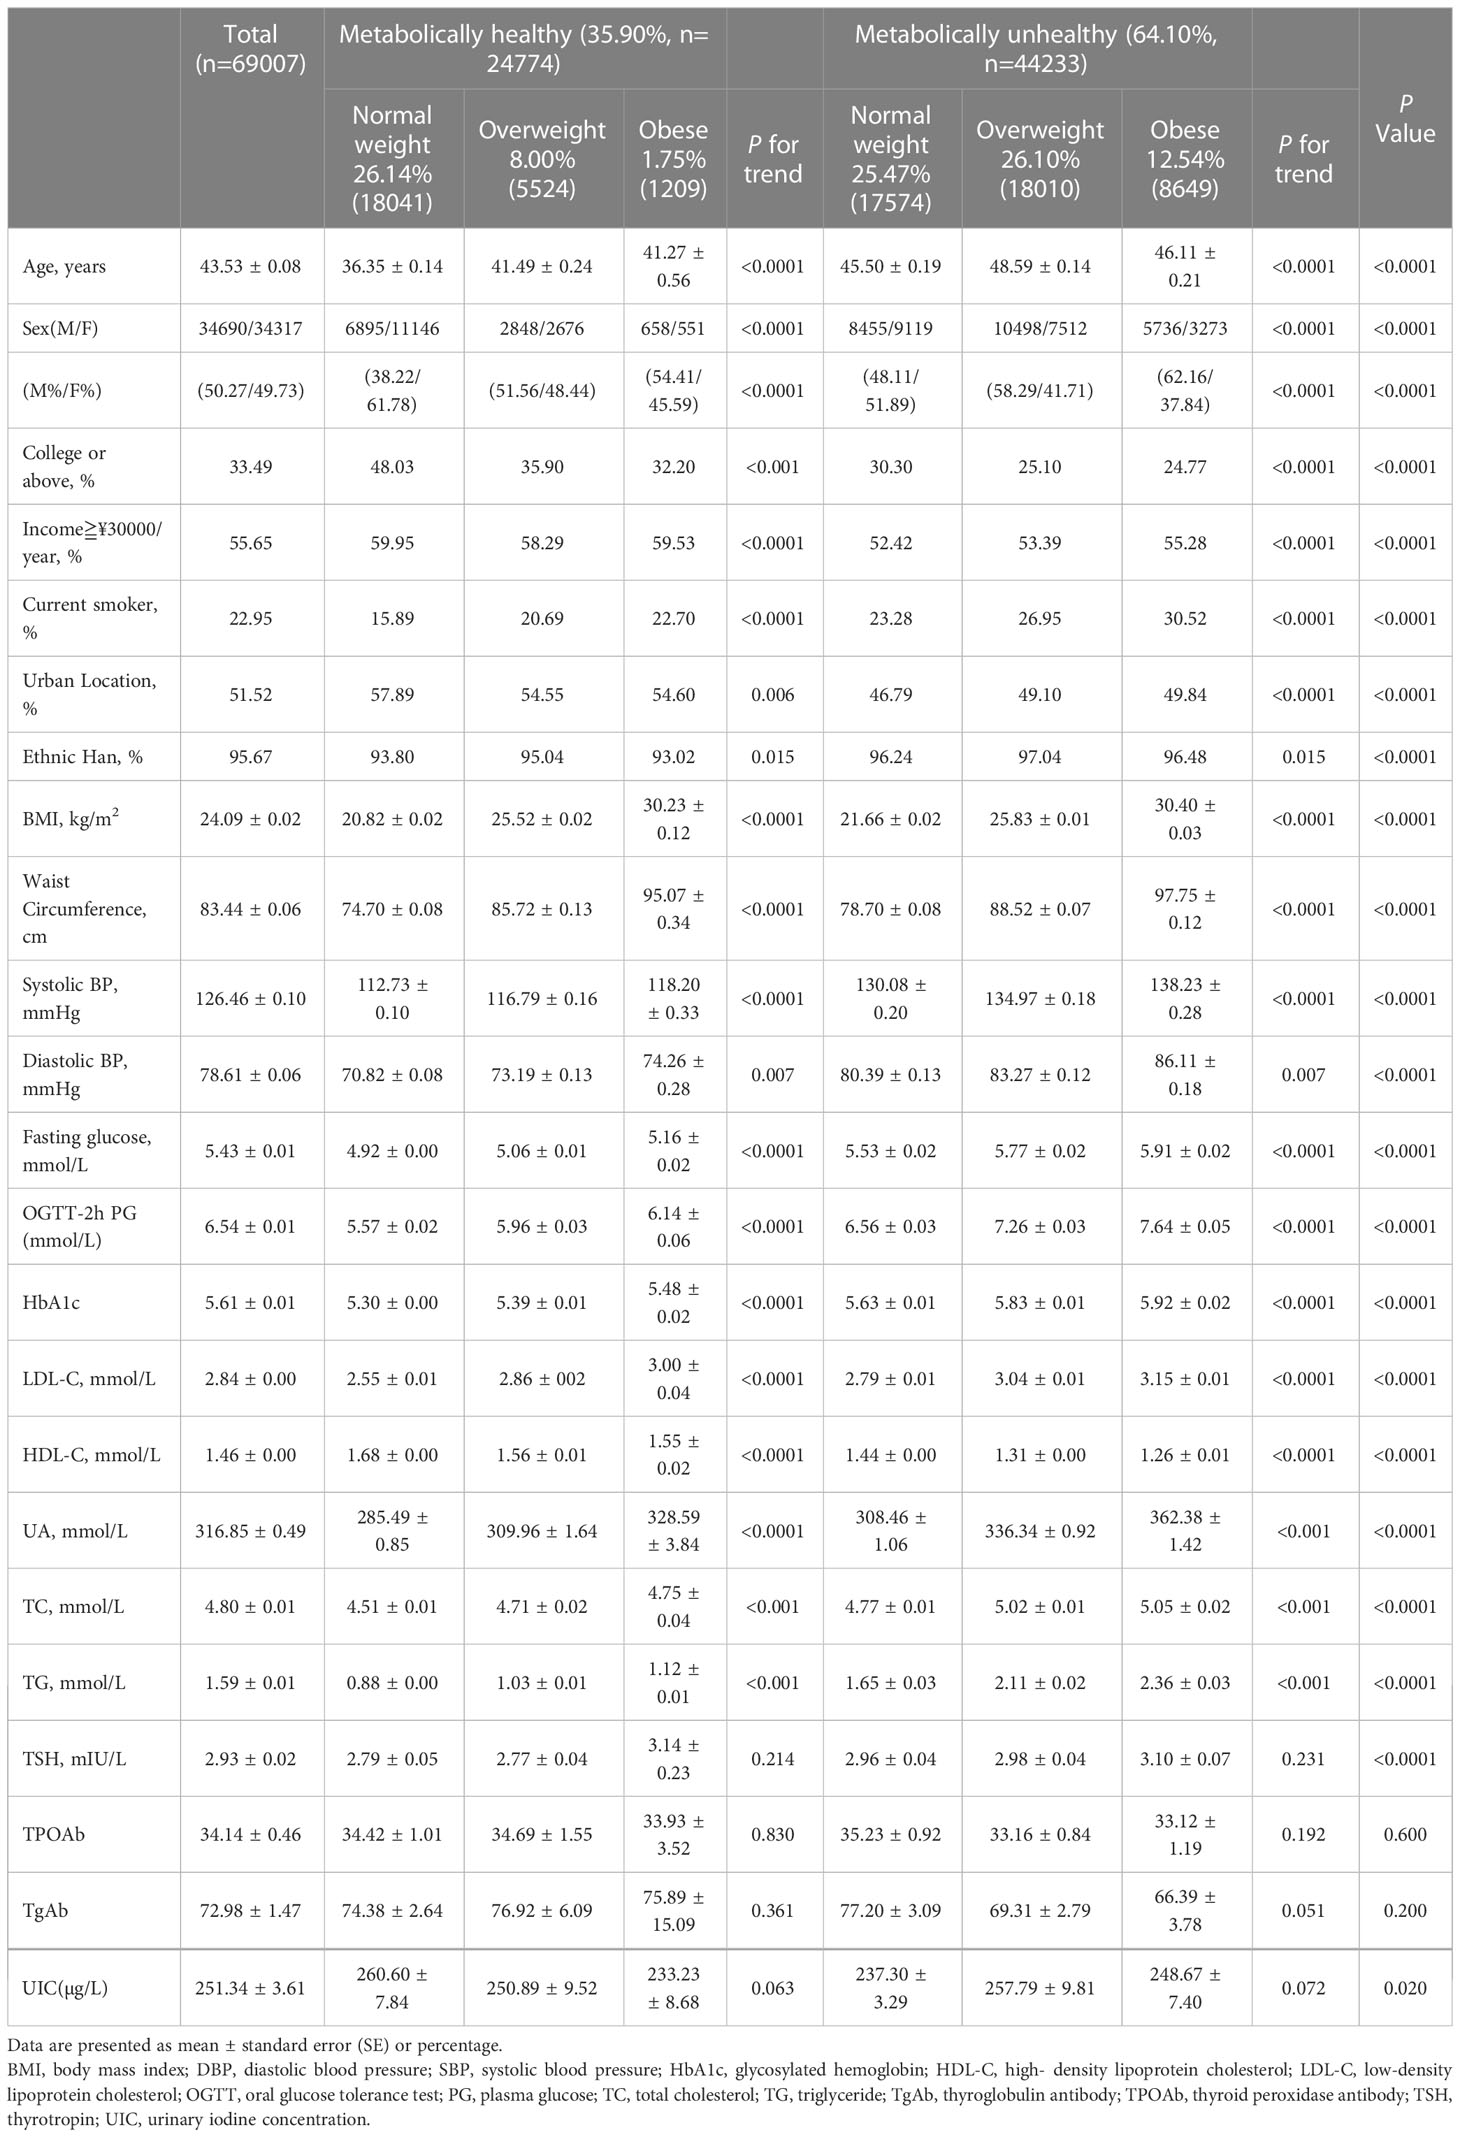
Table 2 Baseline characteristics of study participants.
3.2 Prevalence distributions of thyroid obesity disorders by metabolic phenotype and sex
We compared the prevalence of different thyroid disorders based on six metabolic phenotypes for obesity and sex, which is summarized in Table 3 and Figure 1. The prevalence of subclinical hypothyroidism in the overall population was 12.92% [CI 12.58–13.26%], that of overt hypothyroidism was 1.02% [CI 0.92–1.11%], that of subclinical hyperthyroidism was 0.43% [CI 0.37–0.49%], that of overt hyperthyroidism was 0.77% [CI 0.68–0.86%], that of Graves’ disease was 0.54% [CI 0.46–0.61%], that of AIT was 14.38% [CI 14.03–14.74%], that of goiter was 1.16% [CI 1.07–1.26%]and thyroid nodules was 20.29% [CI 19.87–20.71%]. In addition, the prevalence of these thyroid disorders among females was significantly higher than that among males. There was a significant difference in the prevalence of subclinical hypothyroidism, Graves’ disease and thyroid nodules between these six groups both in the total, female and male populations (all P < 0.05). The prevalence of overt hypothyroidism and goiter were related to these six phenotypes in the total and female populations (all P < 0.05) but were related to none of the obesity metabolic phenotypes among males (P > 0.05). There was a significant difference in the prevalence of overt hyperthyroidism in the total population (P < 0.05) that was not correlated with the obesity metabolic phenotypes in the male and female subgroups (P > 0.05). The prevalence of AIT was not significantly different in either the total or male population (all P > 0.05), whereas that in the female population was significant (P < 0.05). No significant differences in the prevalence of subclinical hyperthyroidism were observed between these six groups in the total, female and male populations (all P > 0.05).
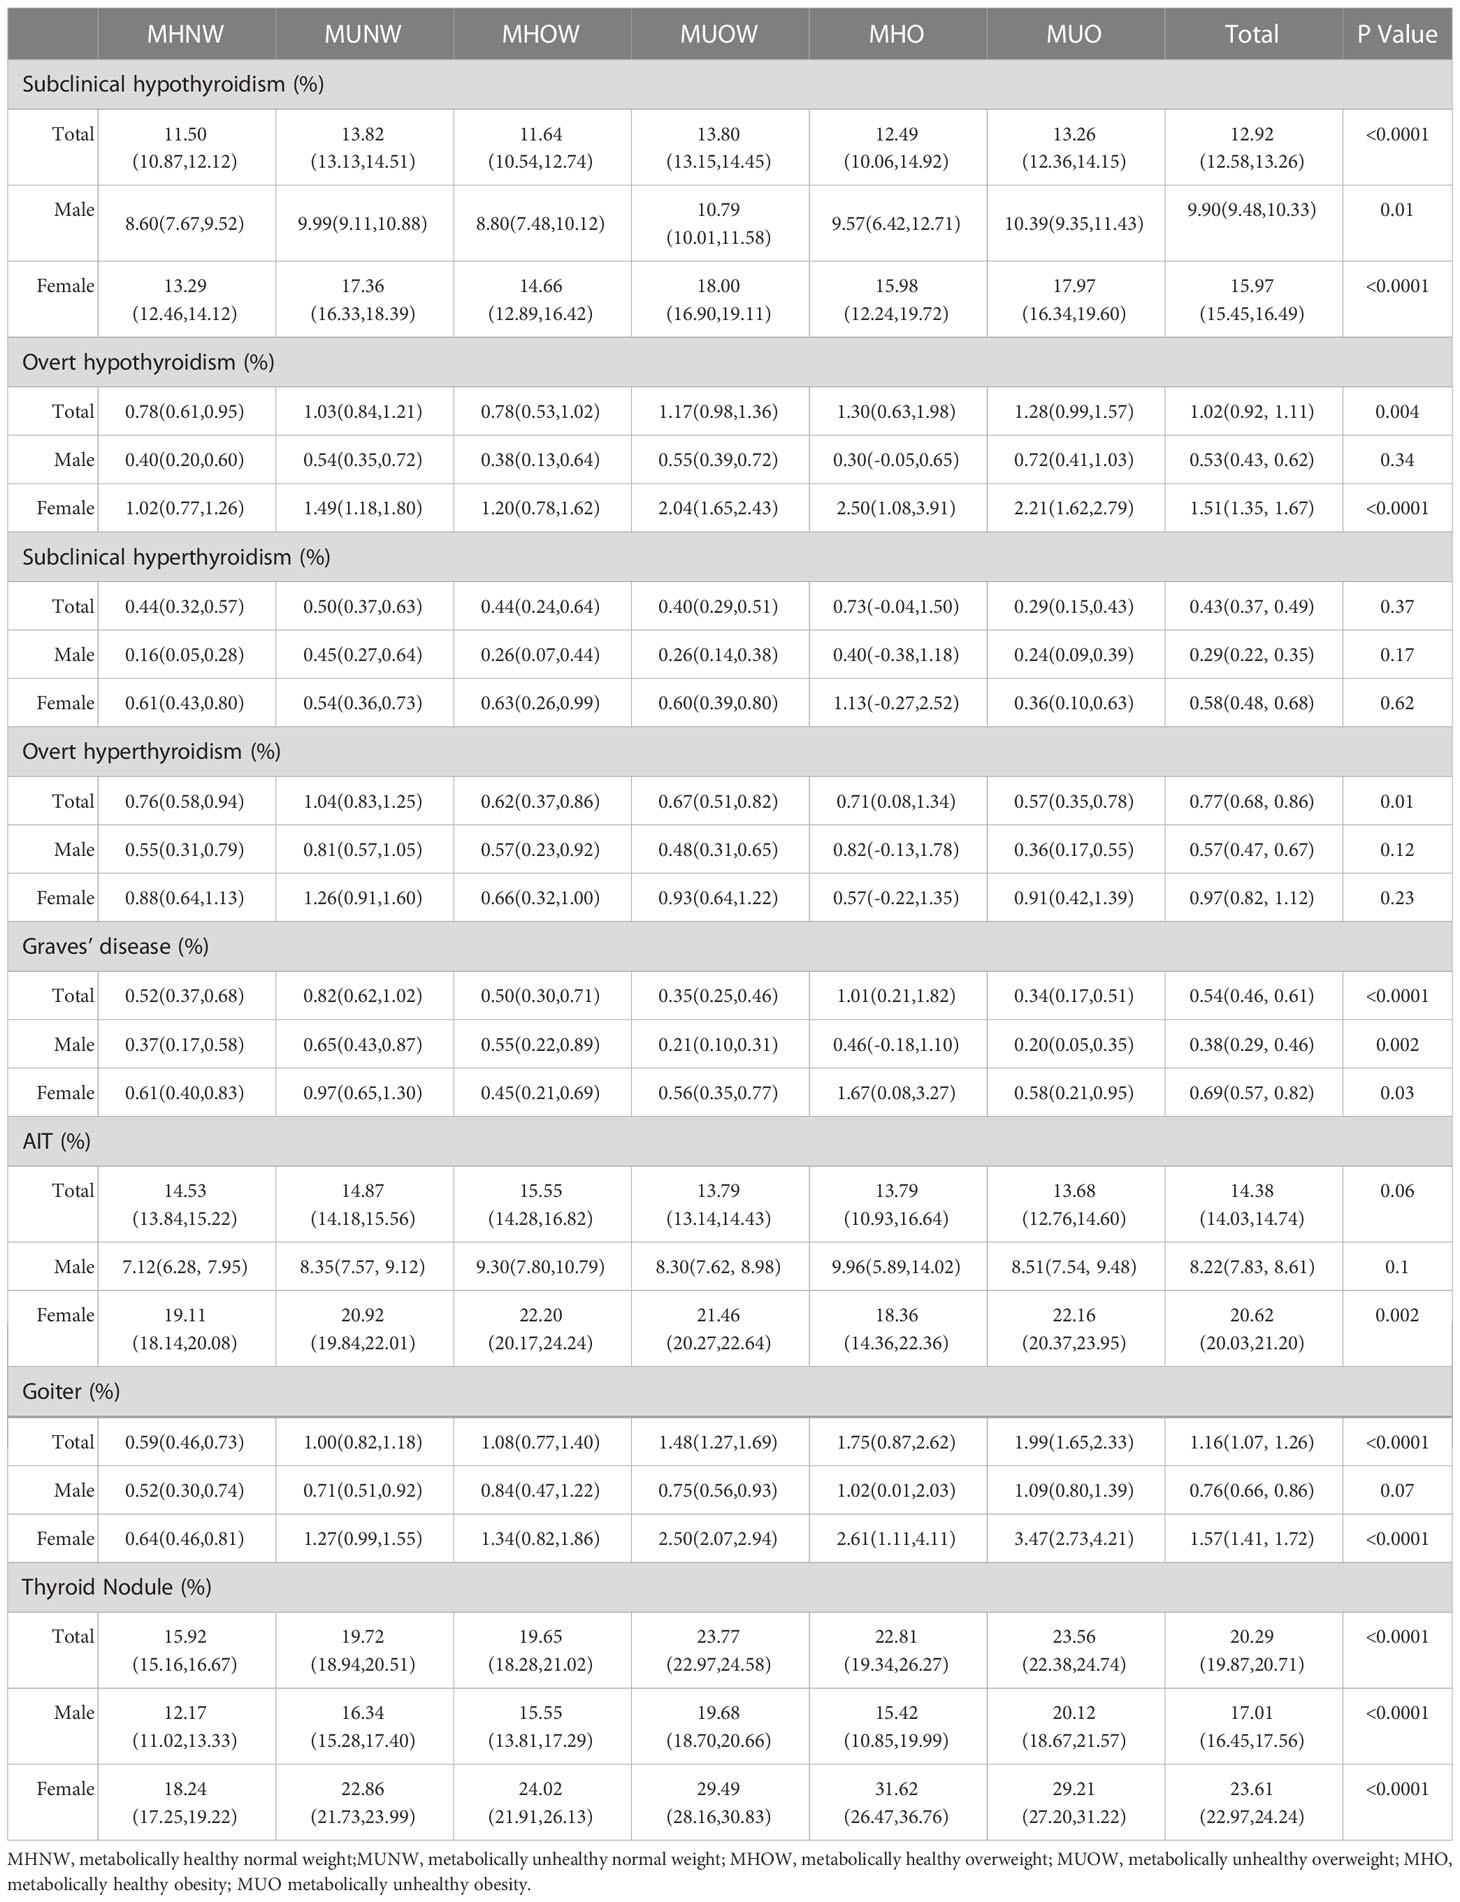
Table 3 Prevalence distributions of thyroid disorders by metabolic obesity phenotype and gender.
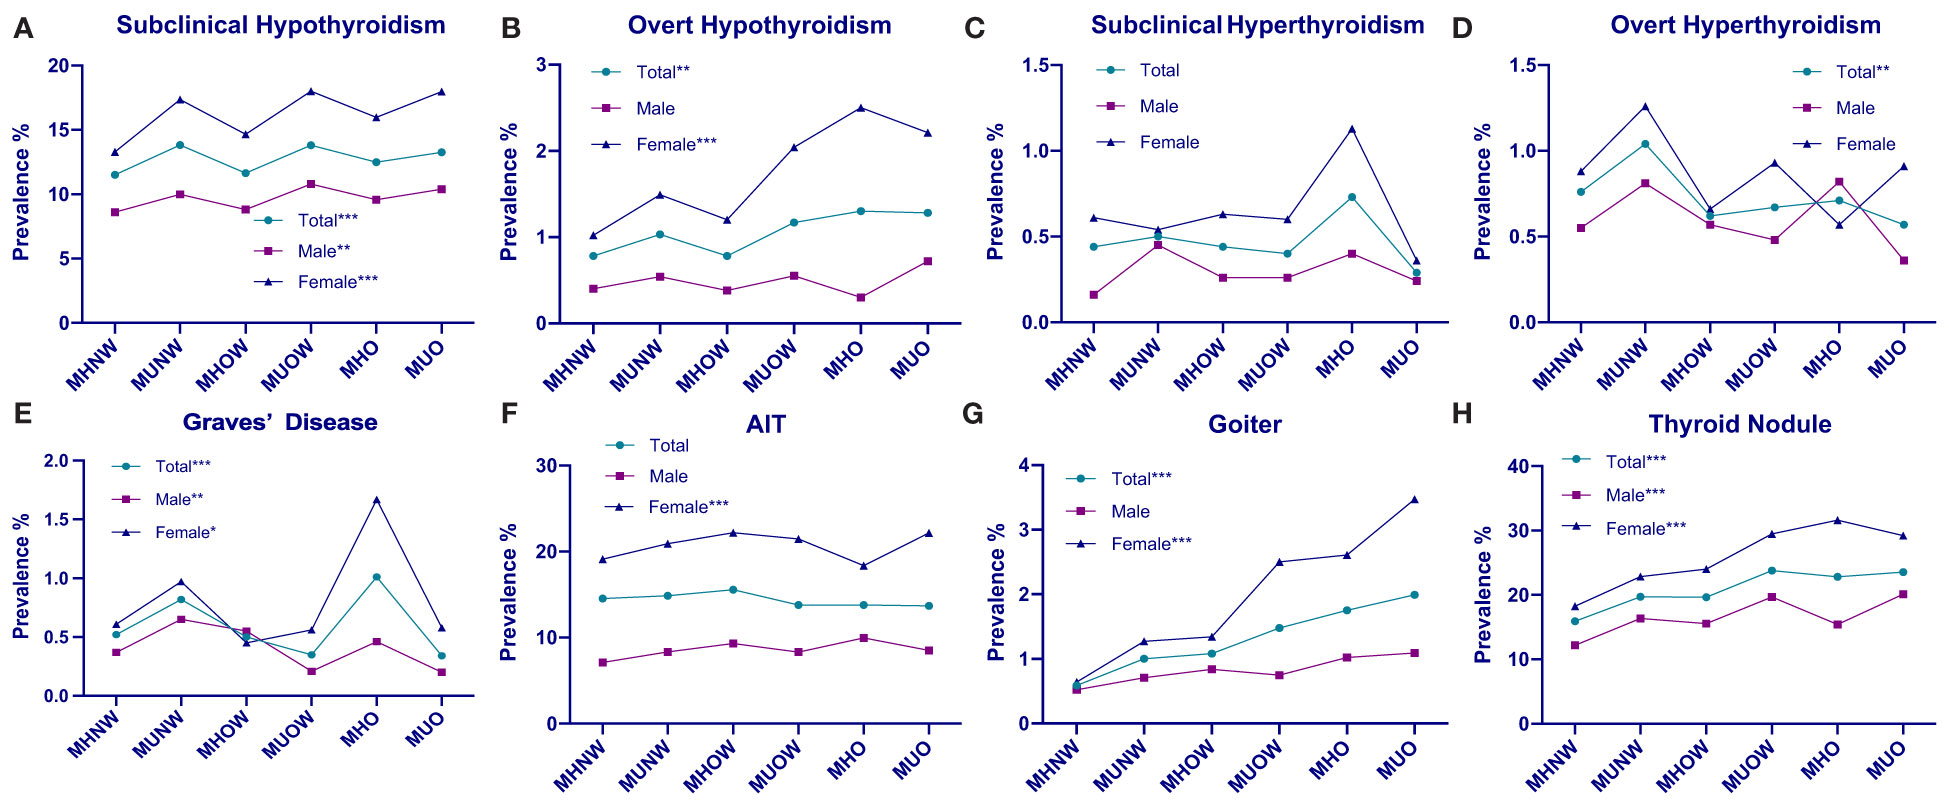
Figure 1 Prevalence distributions of thyroid disorders by metabolic phenotype and sex. (A) Prevalence of subclinical hypothyroidism in the overall, male, and female populations, stratified by metabolic obesity phenotype. (B) Prevalence of overt hypothyroidism in the overall, male, and female population, stratified by metabolic obesity phenotype. (C) Prevalence of subclinical hyperthyroidism in the overall, male, and female population, stratified by metabolic obesity phenotype. (D) Prevalence of overt hyperthyroidism in the overall, male, and female population, stratified by metabolic obesity phenotype. (E) Prevalence of Graves’ disease in the overall, male, and female population, stratified by metabolic obesity phenotype. (F) Prevalence of AIT in the overall, male, and female population, stratified by metabolic obesity phenotype. (G) Prevalence of goiter in the overall, male, and female population, stratified by metabolic obesity phenotype. (H) Prevalence of thyroid nodule in the ove rall, male, and female population, stratified by metabolic obesity phenotype. *P < 0.05 for trend. **P < 0.01for trend. ***P < 0.001 for trend.
3.3 Association between different metabolic phenotypes and thyroid disorders
As indicated in Figure 2 and Supplementary Table 1, we analyzed the risk of thyroid
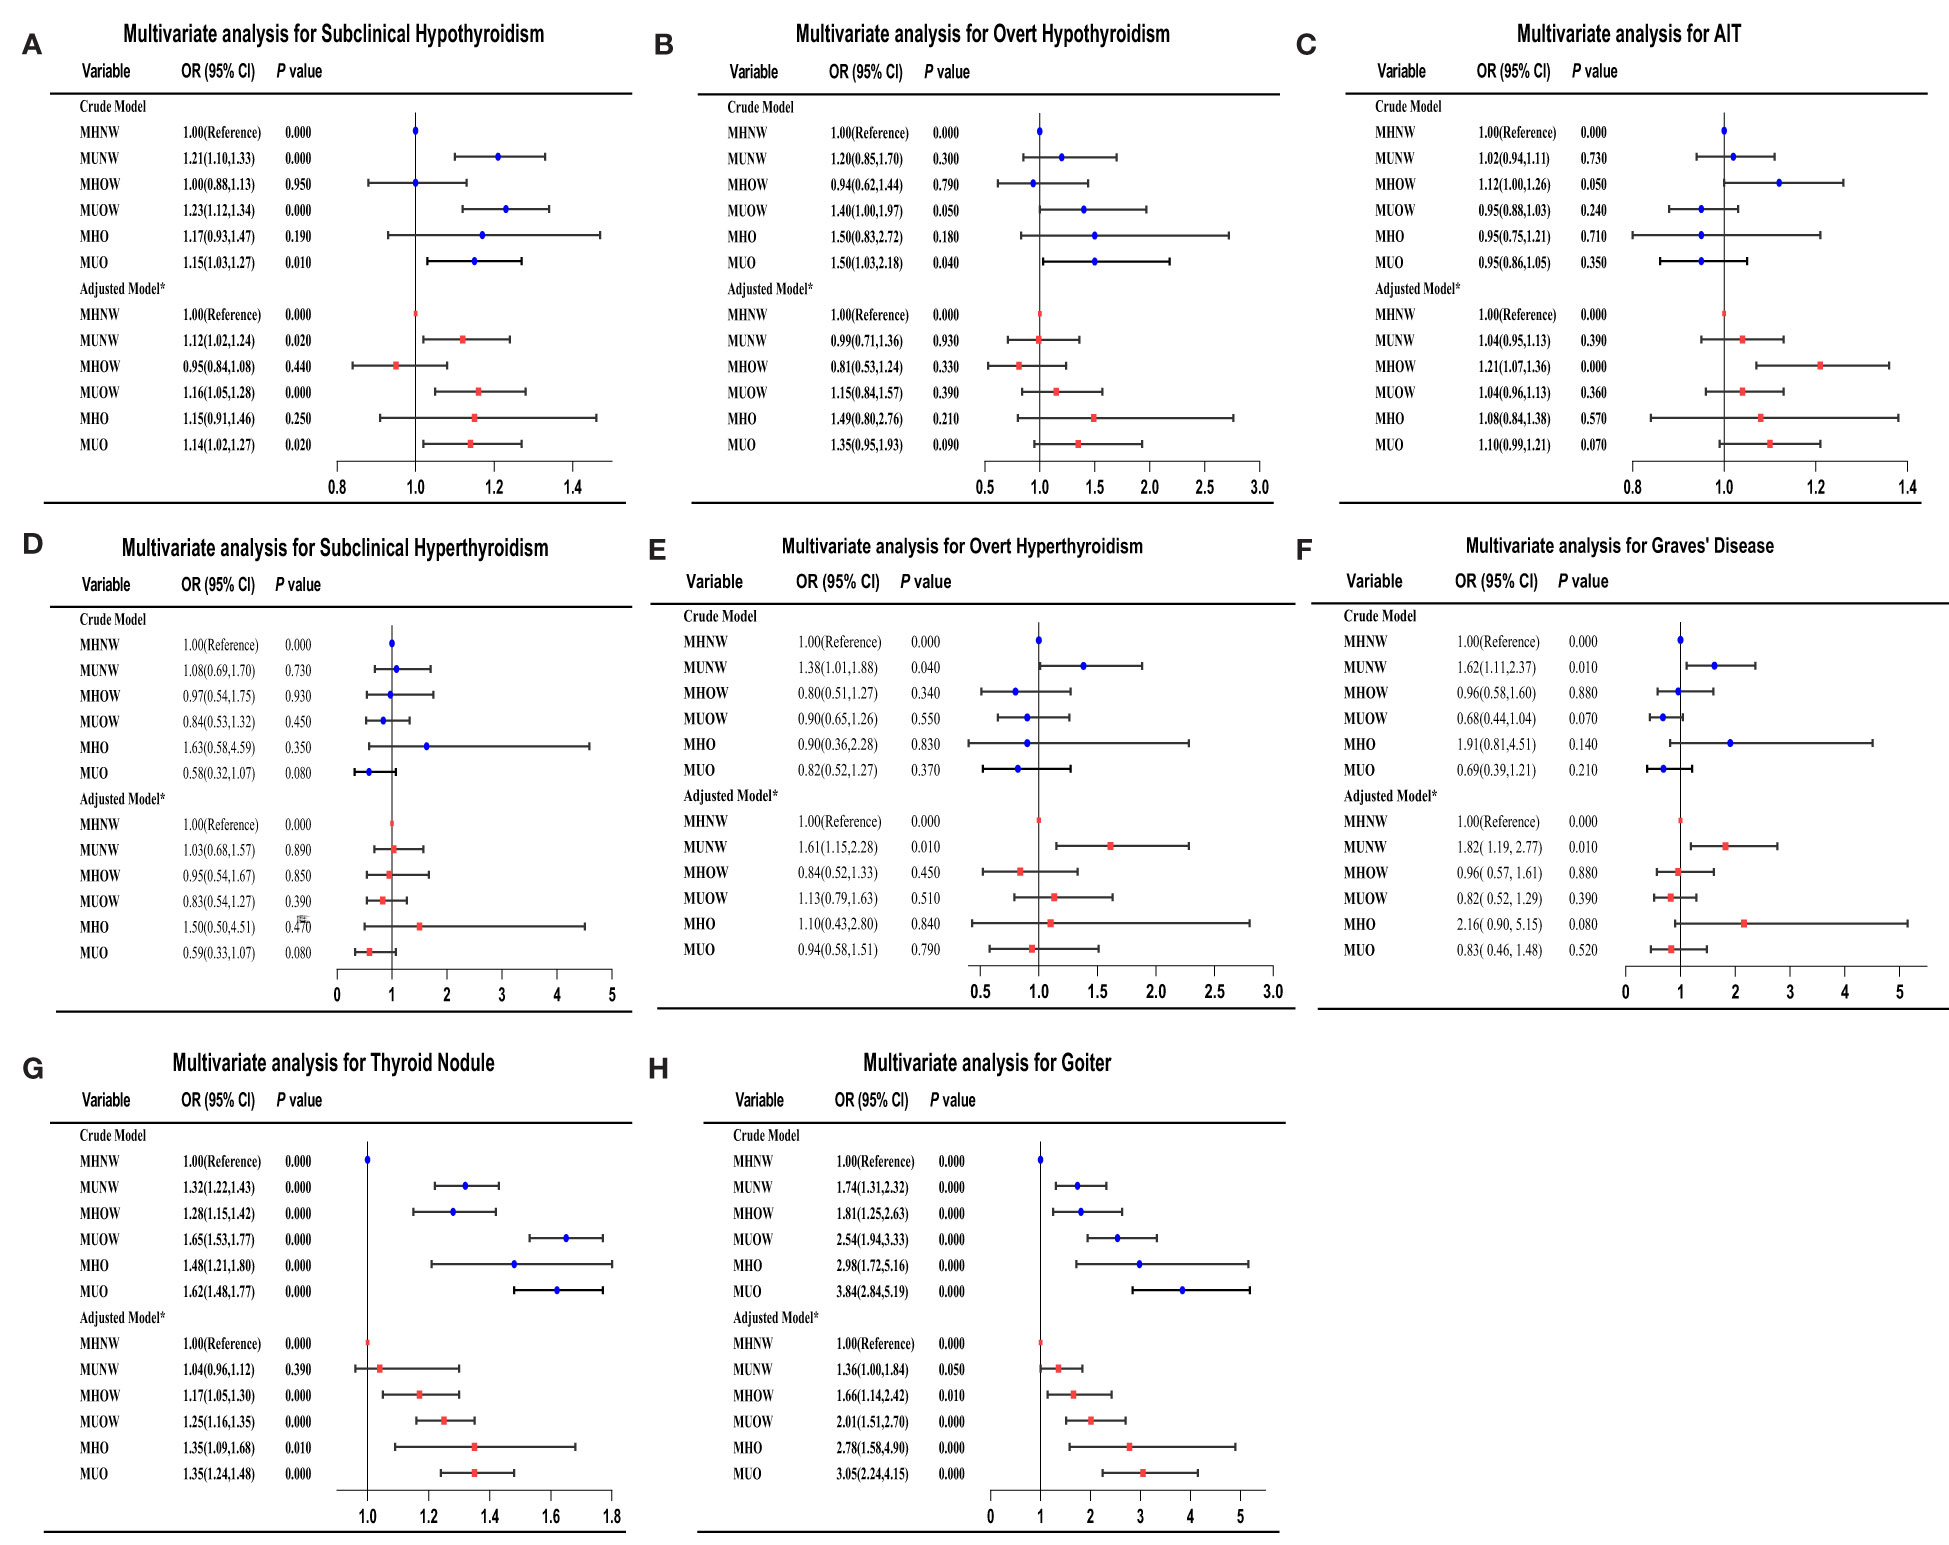
Figure 2 Adjusted ORs and CIs estimating the association between different metabolic obesity phenotypes and thyroid disorders. (A) subclinical hypothyroidism; (B) overt hypothyroidism; (C) AIT; (D) subclinical hyperthyroidism; (E) overt hyperthyroidism; (F) Graves’ disease; (G) thyroid nodules; (H) goiter. CI, confidence interval; OR, odds ratio. *Multivariate analysis model adjusted for sex, age, smoking status, educational level, family income, UIC, TPOAbs, and TgAbs.
disorders among patients with different metabolic obesity phenotypes. The logistic regression analysis included adjustments for essential demographic, anthropometric, and serological information in the present study. Using the MHNW group as the reference group, the metabolically unhealthy phenotypes were all associated with a higher risk of subclinical hypothyroidism in both crude and adjusted models. Subjects in the MUNW, MUOW, and MUO groups had a 1.13-fold (P < 0.01), 1.17-fold (P < 0.001) and 1.15-fold (P < 0.01) increased risk of subclinical hypothyroidism, respectively, compared to the MHNW phenotype in the fully adjusted model. In the total study population, the association observed between an increased risk of overt hypothyroidism and the MUO phenotype in the unadjusted state disappeared after adjustment for confounding variables, including UIC, TPOAbs and TGAbs. The multiple logistic regression analysis revealed that only the MUNW group was associated with a higher risk of overt hyperthyroidism and Graves’ disease than patients with MHNW (all P < 0.01). The associated risks in the fully adjusted model were 1.61 (95% CI = 1.15–2.28) for overt hyperthyroidism and 1.82 (95% CI 1.19-2.77) for Graves’ disease in the MUNW group. Similarly, only the MHOW phenotype was significantly associated with AIT in both the crude and adjusted models. In the fully adjusted model, the ORs for goiter were 1.36 (95% CI, 1.00–1.84) in the MUNW group, 1.66 (95% CI, 1.14–2.42) in the MHOW group, 2.01 (95% CI, 1.51–2.70) in the MUOW group, 2.78 (95% CI, 1.58–4.90) in the MUO group, and 3.05 (95% CI, 2.73–4.13) in the MUO group compared with the MHNW group. Among the subjects with thyroid nodules, the OR for the MHOW group was 1.17 [CI 1.05–1.30], the OR for the MUOW group was 1.25 [CI 1.16–1.35], the OR for the MHO group was 1.35 [CI 1.09–1.68] and the OR for the MUO group was 1.35 [CI 1.24–1.48] after full adjustment. No differences were found in subclinical hyperthyroidism or different metabolic phenotypes in either crude or adjusted models. A similar trend was also observed in overt hypothyroidism in all adjusted models, but we found that the MUOW and MUO groups had a 1.40-fold (P < 0.05) and 1.50-fold (P < 0.05) increased risk, respectively, compared to the MHNW phenotype in the crude model.
4 Discussion
In recent years, obese individuals who do not present metabolic abnormalities and normal weight individuals who present metabolic abnormalities have attracted widespread attention. Some studies have examined the association between different subtypes of obesity and metabolic abnormalities with the risk of various diseases, such as cancer, cardiovascular disease, and chronic kidney disease (18–20). To our knowledge, this is the first study to evaluate the prevalence of thyroid disorders among different metabolic obesity phenotypes and the relationship between the risks of thyroid disorders and metabolic phenotypes in the Chinese adult population using TIDE study data, a nationally representative database. The important results of this study are as follows: (1) the prevalence of various thyroid diseases differed significantly within the six groups by obesity and metabolism. (2) MUNW subjects were associated with a higher risk of overt hyperthyroidism and Graves’ disease incidence than other subjects. (3) Subjects with unhealthy metabolic phenotypes (MUNW, MUOW, and MUO) all had an increased risk of subclinical hypothyroidism regardless of their BMI status. (4) Subjects with the MUO phenotype (the unhealthiest phenotype) were found to have the highest risk of goiter and thyroid nodules compared with other groups.
Recent studies have demonstrated that an estrogen-induced increase occurs in thyroid follicular cell proliferation (21). In Garber et al.’s review, the prevalence of thyroid disorders was shown to be higher among females, and the male-to-female ratio was 1:4 (22), which is consistent with our results. We found that the prevalence of eight thyroid disorders among females was much higher than that among males. Although previous cohort studies have reported an association between thyroid function and different metabolic obesity phenotypes, the role of obesity and metabolic abnormalities in thyroid disorders is still unclear (23). Amouzegar et al. conducted a 9-year follow-up study among 1938 individuals from the Tehran Thyroid Study (TTS). They found that FT4 was positively related to metabolically healthy nonobesity (MHNO) development and negatively related to metabolically healthy obesity (MHO) development, while TSH was positively related to MUNO development (24). The pathophysiology and management of metabolic abnormality of obesity and different thyroid diseases are different. Different thyroid diseases had different pathophysiology could make Mets, but there is no Mets on hyperthyroidism.
Based on our study, we found that metabolic abnormalities and obesity play different roles in various thyroid diseases. There is general agreement that thyroid hormones regulate basal energy expenditure and influence glucose and lipid metabolism (25). The effects of thyroid hormones on the synthesis, mobilization, and degradation of lipids and different aspects of TG-HDL metabolism and apolipoprotein AV (ApoAV) levels could explain lipid abnormalities in thyroid dysfunction, especially hypothyroidism (26, 27). Subclinical hypothyroidism (SCH), which is defined as isolated elevation of TSH levels with free thyroxine (FT4) and free triiodothyronine (FT3) within the normal range, is a relatively common disorder (28). A cross-sectional study conducted by Mahdavi et al. in an Iranian population found no significant association between obesity and the prevalence of subclinical hypothyroidism (29). Shin et al. conducted a cross-sectional study among 6241 euthyroid subjects. They found that individuals in the lowest FT4 quartile had an increased odds ratio of being insulin resistant in both the normal weight and the overweight/obese groups (30). Similar to these studies, our results suggested that subjects with unhealthy metabolic phenotypes (MUNW, MUOW, and MUO) all had an increased risk of SCH, regardless of their BMI status. In our study, we also found that the prevalence of SCH was almost as high in the MUNW group as in the MUO group. No significant differences were observed in the prevalence of subclinical hypothyroidism among the 3 BMI categories. Consistent with our results, a meta-analysis found that BMI was not positively correlated with the prevalence of subclinical hypothyroidism in a meta-regression (P=0.50) (31).
It is commonly noticed in clinical practice that obese individuals often have higher TSH levels (32). Thyroid hormones are involved in body weight regulation through energy consumption. Hyperthyroidism with excess thyroid hormones is often accompanied by weight loss and increased steatolysis and energy expenditure. The latter phenomenon results from a reduced thermodynamic efficiency of the biological machine with increased heat production (33). A recent meta-analysis performed by Song et al. using 22 studies found a positive association between obesity and the risk of hypothyroidism (OR: 1.86; 95% CI: 1.63–2.11, P < 0.001). However, no association was found between obesity and hyperthyroidism (34). Our results also suggested that the prevalence of overt hyperthyroidism and Graves’ disease was highest among MUNW subjects. Similarly, we found that MUNW subjects had an approximately 1.6-fold higher risk of overt hyperthyroidism and a 1.8-fold higher risk of Graves’ disease than their metabolically healthy counterparts (MHNW). In addition, no significant relationship was found between the overweight and obesity groups. An adaptation process to increase energy expenditure as normalization of elevated TSH levels in obese subjects has been reported after weight loss (35). In addition, no significant differences were observed in the prevalence of AIT among the 3 BMI categories. A previous study on subjects without thyroid autoimmunity at baseline found no significant association between the baseline abdominal obesity phenotype and the development of TPOAb positivity (36).
Moreover, our results suggested that the prevalence of goiter and thyroid nodules was related to both obesity and metabolic abnormalities. The prevalence of these two diseases increased with higher BMI values, and the MUO group had the highest incidence. The present study also demonstrated that the MUO group had significantly larger thyroid volumes and the highest risk for goiter and thyroid nodules among the obesity metabolic phenotypes. Correlations between BMI, metabolic factors and thyroid nodules have been confirmed by some previous studies. In previous studies, Ayturk et al. (37) and Rezzonico et al. (13) indicated that subjects with MetS had a larger thyroid gland volume by ultrasound and had a significantly increased thyroid nodule prevalence. Demir et al. (38) assessed the antiproliferative and pleiotropic effects of statins on thyroid volume and nodularity. They found that the total thyroid volume decreased more among patients receiving 20 mg of rosuvastatin than in the control group (p < 0.05). Xu et al. (39) investigated the prevalence of thyroid nodules (TNs) and their related factors and found that metabolic factors, including central obesity, hypertension, diabetes and fatty liver, were positively associated with TNs. In most of these studies, thyroid volume was significantly positively correlated with BMI (40). In a recent local community study, Zhu et al. investigated the prevalence of TNs and their related factors and found that being overweight might be a risk factor for TNs (41). Although a causal relationship was not specifically found, the association between thyroid volume and BMI has been asserted.
In our study, we could draw the conclusion that metabolically unhealthy individuals, both with and without obesity, have a higher risk of thyroid disorder incidence than metabolically healthy individuals without obesity. Metabolically healthy individuals exhibit lower thyroid disorder prevalence than their unhealthy counterparts at each BMI level. Furthermore, it has been reported that leptin has direct effects on the formation of thyroid disorders. Leptin promotes thyrotropin-releasing hormone (TRH) expression and synthesis in the paraventricular hypothalamic and arcuate nucleus, which, in turn, can cause an increase in serum TSH levels. Excess leptin secreted from greater amounts of adipose tissue may stimulate the hypothalamic–pituitary–thyroid axis, increasing thyrotropin secretion (42).
Some studies have reported that leptin levels were substantially higher in MUO individuals than in MHO individuals (43). In addition, an inverse correlation between adiponectin and proteinuria was found (44), and adiponectin was higher in individuals with a metabolically healthy phenotype than in metabolically abnormal individuals independent of body mass index (45). This explains why hypothyroidism was more associated with metabolically unhealthy individuals in our results. It has also been reported that the relationship between obesity and thyroid nodules is probably related to leptin secreted by adipose tissue (46). Elevated serum leptin concentrations in obese individuals can promote increased thyroid-stimulating hormone levels, leading to the occurrence and development of thyroid nodules.
Several strengths of our study should be noted, including the large sample size, the population-based design, suitable exclusion criteria, and the performance of all examinations by the same trained staff. However, this study also has some limitations, which should be addressed. First, this was a cross-sectional study, so we could not confirm the cause-and-effect relationship between metabolic obesity phenotypes and thyroid disorders. Second, epidemiological investigations are methodologically challenged by the impact of geographic, environmental, genetic, drug and other factors that may influence disease outcomes, and therefore, reverse causation or confounding should be kept in mind. Third, since our study excluded the usage of all drugs with potential effects on thyroid function and only included adults, obesity and overweight were defined solely based on BMI values. Therefore, it is uncertain whether the findings can be generalized to the entire Chinese population. Finally, the analyses did not include other thyroid-related serum elements, such as free triiodothyronine (FT3) or anti-TSH receptor antibodies.
5 Conclusion
In conclusion, this cross-sectional study in a Chinese population demonstrates that metabolically unhealthy individuals have a higher risk of thyroid disorder incidence than metabolically healthy individuals regardless of BMI status. The findings indicate that all metabolically unhealthy individuals, even those without obesity, should be encouraged to improve their metabolic status to reduce the risk of thyroid disorders.
Author’s note
The authors hereby confirm that neither the manuscript nor any part of it has been published or is being considered for publication elsewhere. We acknowledge that all authors participated sufficiently in the work and take public responsibility for its content.
Data availability statement
The original contributions presented in the study are included in the article/Supplementary Material. Further inquiries can be directed to the corresponding author.
Ethics statement
The studies involving human participants were reviewed and approved by The Medical Ethics Committee of China Medical University. (2014-103-2; serial number: IRB [2008]115). The patients/participants provided their written informed consent to participate in this study.
Author contributions
BS is the first author of this study. DT is the corresponding author supervising this work. BS managed the case and drafted the manuscript. CL provided major statistical and technical support. BS, CL, WT and ZS assisted in literature review and organizing data from the literature. WT and ZS reviewed the manuscript. The data of the cross-sectional study is from the TIDE survey group. All authors contributed to the article and approved the submitted version.
Funding
This study was supported by The Research Fund for Public Welfare, National Health and Family Planning Commission of China (Grant No. 201402005). The funder had no role in study design, data collection or analysis, or in the presentation or publication of the results.
Acknowledgments
We sincerely appreciate the strong support and cooperation of members responsible for the TIDE project in the 31 provinces/cities.
Conflict of interest
The authors declare that the research was conducted in the absence of any commercial or financial relationships that could be construed as a potential conflict of interest.
Publisher’s note
All claims expressed in this article are solely those of the authors and do not necessarily represent those of their affiliated organizations, or those of the publisher, the editors and the reviewers. Any product that may be evaluated in this article, or claim that may be made by its manufacturer, is not guaranteed or endorsed by the publisher.
Supplementary material
The Supplementary Material for this article can be found online at: https://www.frontiersin.org/articles/10.3389/fendo.2023.1158013/full#supplementary-material
Abbreviations
BMI, Body mass index; MHNW, metabolically healthy normal weight; MUNW, metabolically unhealthy normal weight; MHOW, metabolically healthy overweight; MUOW, metabolically unhealthy overweight; MHO, metabolically healthy obesity; MUO, metabolically unhealthy obesity; TIDE, Thyroid Disorders, Iodine Status, and Diabetes Epidemiological; MetS, Metabolic syndrome; TNs, thyroid nodules; BP, blood pressure; HDL-C, low high-density lipoprotein cholesterol; T2DM, type 2 diabetes mellitus; TSH, thyroid-stimulating hormone; FT4, free thyroxine; TPOAbs, thyroid peroxidase antibodies; TGAbs, thyroglobulin antibodies; OGTT, oral glucose tolerance test; SBP, systolic blood pressure; DBP, diastolic blood pressure; FPG, fasting plasma glucose; CI, confidence interval; ORs, odds ratios; IR, insulin resistance; SHC, subclinical hypothyroidism.
References
1. Afshin A, Forouzanfar MH, Reitsma MB, Sur P, Estep K, Lee A, et al. Health effects of overweight and obesity in 195 countries over 25 years. N Engl J Med (2017) 377(1):13–27. doi: 10.1056/NEJMoa1614362
2. Ng M, Fleming T, Robinson M, Thomson B, Graetz N, Margono C, et al. Global, regional, and national prevalence of overweight and obesity in children and adults during 1980-2013: a systematic analysis for the global burden of disease study 2013. Lancet (2014) 384(9945):766–81. doi: 10.1016/S0140-6736(14)60460-8
3. Ward ZJ, Bleich SN, Cradock AL, Barrett JL, Giles CM, Flax C, et al. Projected U.S. state-level prevalence of adult obesity and severe obesity. N Engl J Med (2019) 381(25):2440–50. doi: 10.1056/NEJMsa1909301
4. Phillips CM. Metabolically healthy obesity across the life course: epidemiology, determinants, and implications. Ann N Y Acad Sci (2017) 1391(1):85–100. doi: 10.1111/nyas.13230
5. Expert Panel on Detection, Evaluation, and Treatment of High Blood Cholesterol in Adults. Executive summary of the third report of the national cholesterol education program (NCEP) expert panel on detection, evaluation, and treatment of high blood cholesterol in adults (Adult treatment panel III). Jama. (2001) 285(19):2486–97. doi: 10.1001/jama.285.19.2486
6. Stefan N, Schick F, Häring HU. Causes, characteristics, and consequences of metabolically unhealthy normal weight in humans. Cell Metab (2017) 26(2):292–300. doi: 10.1016/j.cmet.2017.07.008
7. Pluta W, Dudzińska W, Lubkowska A. Metabolic obesity in people with normal body weight (MONW)-review of diagnostic criteria. Int J Environ Res Public Health (2022) 19(2):624. doi: 10.3390/ijerph19020624
8. Cameron AJ, Magliano DJ, Zimmet PZ, Welborn TA, Colagiuri S, Tonkin AM, et al. The metabolic syndrome as a tool for predicting future diabetes: the AusDiab study. J Intern Med (2008) 264(2):177–86. doi: 10.1111/j.1365-2796.2008.01935.x
9. Twig G, Yaniv G, Levine H, Leiba A, Goldberger N, Derazne E, et al. Body-mass index in 2.3 million adolescents and cardiovascular death in adulthood. N Engl J Med (2016) 374(25):2430–40. doi: 10.1056/NEJMoa150384
10. Ligibel JA, Alfano CM, Courneya KS, Demark-Wahnefried W, Burger RA, Chlebowski RT, et al. American Society of clinical oncology position statement on obesity and cancer. J Clin Oncol (2014) 32(31):3568–74. doi: 10.1200/JCO.2014.58.4680
11. Waring AC, Rodondi N, Harrison S, Kanaya AM, Simonsick EM, Miljkovic I, et al. Thyroid function and prevalent and incident metabolic syndrome in older adults: the health, ageing and body composition study. Clin Endocrinol (Oxf). (2012) 76(6):911–8. doi: 10.1111/j.1365-2265.2011.04328.x
12. Sari R, Balci MK, Altunbas H, Karayalcin U. The effect of body weight and weight loss on thyroid volume and function in obese women. Clin Endocrinol (Oxf). (2003) 59(2):258–62. doi: 10.1046/j.1365-2265.2003.01836.x
13. Rezzonico J, Rezzonico M, Pusiol E, Pitoia F, Niepomniszcze H. Introducing the thyroid gland as another victim of the insulin resistance syndrome. Thyroid. (2008) 18(4):461–4. doi: 10.1089/thy.2007.0223
14. Li Y, Teng D, Ba J, Chen B, Du J, He L, et al. Efficacy and safety of long-term universal salt iodization on thyroid disorders: epidemiological evidence from 31 provinces of mainland China. Thyroid. (2020) 30(4):568–79. doi: 10.1089/thy.2019.0067
15. Li Y, Teng D, Shi X, Qin G, Qin Y, Quan H, et al. Prevalence of diabetes recorded in mainland China using 2018 diagnostic criteria from the American diabetes association: national cross sectional study. Bmj (2020) 369:m997. doi: 10.1136/bmj.m997
16. Ortega FB, Lavie CJ, Blair SN. Obesity and cardiovascular disease. Circ Res (2016) 118(11):1752–70. doi: 10.1161/CIRCRESAHA.115.306883
17. Chen C, Lu FC. The guidelines for prevention and control of overweight and obesity in Chinese adults. BioMed Environ Sci (2004) 17 Suppl:1–36.
18. Park YM, White AJ, Nichols HB, O'Brien KM, Weinberg CR, Sandler DP. The association between metabolic health, obesity phenotype and the risk of breast cancer. Int J Cancer. (2017) 140(12):2657–66. doi: 10.1002/ijc.30684
19. Chen HY, Lu FH, Chang CJ, Wang RS, Yang YC, Chang YF, et al. Metabolic abnormalities, but not obesity per se, associated with chronic kidney disease in a Taiwanese population. Nutr Metab Cardiovasc Dis (2020) 30(3):418–25. doi: 10.1016/j.numecd.2019.09.029
20. Xu Y, Li H, Wang A, Su Z, Yang G, Luo Y, et al. Association between the metabolically healthy obese phenotype and the risk of myocardial infarction: results from the kailuan study. Eur J Endocrinol (2018) 179(6):343–52. doi: 10.1530/EJE-18-0356
21. Manole D, Schildknecht B, Gosnell B, Adams E, Derwahl M. Estrogen promotes growth of human thyroid tumor cells by different molecular mechanisms. J Clin Endocrinol Metab (2001) 86(3):1072–7. doi: 10.1210/jc.86.3.1072
22. Garber JR, Cobin RH, Gharib H, Hennessey JV, Klein I, Mechanick JI, et al. Clinical practice guidelines for hypothyroidism in adults: cosponsored by the American association of clinical endocrinologists and the American thyroid association. Endocr Pract (2012) 18(6):988–1028. doi: 10.4158/EP12280.GL
23. Wang Y, Lin H, Li Q, Guan L, Zhao M, Zhong F, et al. Association between different obesity phenotypes and hypothyroidism: a study based on a longitudinal health management cohort. Endocrine. (2021) 72(3):688–98. doi: 10.1007/s12020-021-02677-2
24. Amouzegar A, Kazemian E, Abdi H, Mansournia MA, Bakhtiyari M, Hosseini MS, et al. Association between thyroid function and development of different obesity phenotypes in euthyroid adults: a nine-year follow-up. Thyroid. (2018) 28(4):458–64. doi: 10.1089/thy.2017.0454
25. Silva JE. The thermogenic effect of thyroid hormone and its clinical implications. Ann Intern Med (2003) 139(3):205–13. doi: 10.7326/0003-4819-139-3-200308050-00010
26. Zhu X, Cheng SY. New insights into regulation of lipid metabolism by thyroid hormone. Curr Opin Endocrinol Diabetes Obes (2010) 17(5):408–13. doi: 10.1097/MED.0b013e32833d6d46
27. Rensen PC, van Dijk KW, Havekes LM. Apolipoprotein AV: low concentration, high impact. Arterioscler Thromb Vasc Biol (2005) 25(12):2445–7. doi: 10.1161/01.ATV.0000193889.65915.f9
28. Delitala AP, Pilia MG, Ferreli L, Loi F, Curreli N, Balaci L, et al. Prevalence of unknown thyroid disorders in a sardinian cohort. Eur J Endocrinol (2014) 171(1):143–9. doi: 10.1530/EJE-14-0182
29. Mahdavi M, Amouzegar A, Mehran L, Madreseh E, Tohidi M, Azizi F. Investigating the prevalence of primary thyroid dysfunction in obese and overweight individuals: Tehran thyroid study. BMC Endocr Disord (2021) 21(1):89. doi: 10.1186/s12902-021-00743-4
30. Shin JA, Mo EY, Kim ES, Moon SD, Han JH. Association between lower normal free thyroxine concentrations and obesity phenotype in healthy euthyroid subjects. Int J Endocrinol (2014) 2014:104318. doi: 10.1155/2014/104318
31. van Hulsteijn LT, Pasquali R, Casanueva F, Haluzik M, Ledoux S, Monteiro MP, et al. Prevalence of endocrine disorders in obese patients: systematic review and meta-analysis. Eur J Endocrinol (2020) 182(1):11–21. doi: 10.1530/EJE-19-0666
32. Valdés S, Maldonado-Araque C, Lago-Sampedro A, Lillo-Muñoz JA, Garcia-Fuentes E, Perez-Valero V, et al. Reference values for TSH may be inadequate to define hypothyroidism in persons with morbid obesity: di@bet.es study. Obes (Silver Spring) (2017) 25(4):788–93. doi: 10.1002/oby.21796
33. Santini F, Marzullo P, Rotondi M, Ceccarini G, Pagano L, Ippolito S, et al. Mechanisms in endocrinology: the crosstalk between thyroid gland and adipose tissue: signal integration in health and disease. Eur J Endocrinol (2014) 171(4):R137–52. doi: 10.1530/EJE-14-0067
34. Song RH, Wang B, Yao QM, Li Q, Jia X, Zhang JA. The impact of obesity on thyroid autoimmunity and dysfunction: a systematic review and meta-analysis. Front Immunol (2019) 10:2349. doi: 10.3389/fimmu.2019.02349
35. Reinehr T, Isa A, de Sousa G, Dieffenbach R, Andler W. Thyroid hormones and their relation to weight status. Horm Res (2008) 70(1):51–7. doi: 10.1159/000129678
36. Amouzegar A, Kazemian E, Abdi H, Gharibzadeh S, Tohidi M, Azizi F. Abdominal obesity phenotypes and incidence of thyroid autoimmunity: a 9-year follow-up. Endocr Res (2020) 45(3):202–9. doi: 10.1080/07435800.2020.1749847
37. Ayturk S, Gursoy A, Kut A, Anil C, Nar A, Tutuncu NB. Metabolic syndrome and its components are associated with increased thyroid volume and nodule prevalence in a mild-to-moderate iodine-deficient area. Eur J Endocrinol (2009) 161(4):599–605. doi: 10.1530/EJE-09-0410
38. Demir C, Anil C, Bozkus Y, Mousa U, Kut A, Nar A, et al. Do statins affect thyroid volume and nodule size in patients with hyperlipidemia in a region with mild-to-Moderate iodine deficiency? a prospective study. Med Princ Pract (2018) 27(1):1–7. doi: 10.1159/000486748
39. Xu L, Zeng F, Wang Y, Bai Y, Shan X, Kong L. Prevalence and associated metabolic factors for thyroid nodules: a cross-sectional study in southwest of China with more than 120 thousand populations. BMC Endocr Disord (2021) 21(1):175. doi: 10.1186/s12902-021-00842-2
40. Semiz S, Senol U, Bircan, Gümüşlü S, Bilmen S, Bircan I. Correlation between age, body size and thyroid volume in an endemic area. J Endocrinol Invest. (2001) 24(8):559–63. doi: 10.1007/BF03343894
41. Zhu HF, Yang Y, Li JY, Li XM, Ma AG. [Prevalence of thyroid nodules and influencing factors among employees of a company in qingdao]. Zhonghua Yu Fang Yi Xue Za Zhi. (2012) 46(3):228–32.
42. Ghamari-Langroudi M, Vella KR, Srisai D, Sugrue ML, Hollenberg AN, Cone RD. Regulation of thyrotropin-releasing hormone-expressing neurons in paraventricular nucleus of the hypothalamus by signals of adiposity. Mol Endocrinol (2010) 24(12):2366–81. doi: 10.1210/me.2010-0203
43. Jamar G, Caranti DA, de Cassia Cesar H, Masquio DCL, Bandoni DH, Pisani LP. Leptin as a cardiovascular risk marker in metabolically healthy obese: hyperleptinemia in metabolically healthy obese. Appetite. (2017) 108:477–82. doi: 10.1016/j.appet.2016.11.013
44. Goldstein BJ, Scalia R. Adiponectin: a novel adipokine linking adipocytes and vascular function. J Clin Endocrinol Metab (2004) 89(6):2563–8. doi: 10.1210/jc.2004-0518
45. Ahl S, Guenther M, Zhao S, James R, Marks J, Szabo A, et al. Adiponectin levels differentiate metabolically healthy vs unhealthy among obese and nonobese white individuals. J Clin Endocrinol Metab (2015) 100(11):4172–80. doi: 10.1210/jc.2015-2765
Keywords: metabolic health, obesity, TIDE, thyroid disorders, prevalence
Citation: Song B, Lu C, Teng D, Shan Z and Teng W (2023) Association between different metabolic phenotypes of obesity and thyroid disorders among Chinese adults: a nationwide cross-sectional study. Front. Endocrinol. 14:1158013. doi: 10.3389/fendo.2023.1158013
Received: 03 February 2023; Accepted: 05 April 2023;
Published: 21 April 2023.
Edited by:
Alberto Chavez-Velazquez, Texas Diabetes Institute - University Health, United StatesReviewed by:
Carmen Cabanelas Pazos Moura, Federal University of Rio de Janeiro, BrazilDharma Lindarto, Department of Internal Medicine, Indonesia
Copyright © 2023 Song, Lu, Teng, Shan and Teng. This is an open-access article distributed under the terms of the Creative Commons Attribution License (CC BY). The use, distribution or reproduction in other forums is permitted, provided the original author(s) and the copyright owner(s) are credited and that the original publication in this journal is cited, in accordance with accepted academic practice. No use, distribution or reproduction is permitted which does not comply with these terms.
*Correspondence: Di Teng, 18698818800@163.com