 Lingli Ma1
 Nan Wu
 Qing Wang
- 1Department of Endocrinology and Metabolism, China-Japan Union Hospital of Jilin University, Changchun, China
- 2Department of Dermatology, China-Japan Union Hospital of Jilin University, Changchun, China
Objective: Diabetic retinopathy (DR) is a common diabetic microvascular complication and a major cause of acquired vision loss. Finding effective biomarkers for the early identification and diagnosis of DR is crucial. This study aimed to comprehensively evaluate the accuracy of microRNAs (miRNAs) in the diagnosis of DR via a meta-analysis of previously published diagnostic studies. This study has been registered on the PROSPERO website, with the number CRD42022323238.
Methods: We searched PubMed, Cochrane Library, Embase, Web of Science, China Wanfang database, and China Knowledge Network database to identify relevant articles published from the time of database creation to April 10, 2022. Stata 14.0 software was used to calculate the pooled sensitivity, specificity, positive likelihood ratio (PLR), negative likelihood ratio (NLR), diagnostic ratio (DOR), and area under the summary receiver operating characteristic (ROC) curve to assess the accuracy of miRNAs in the diagnosis of DR. Heterogeneity between studies was assessed using Cochran-Q test and I2 statistic for quantitative analysis. The random-effect model was selected due to significant heterogeneity. Subgroup analysis and regression analysis were also performed to determine the potential sources of heterogeneity.
Results: We included 25 articles detailing 52 studies with 1987 patients with DR and 1771 non-DR controls. The findings demonstrated overall sensitivity (0.82, 95% CI: 0.78 ~ 0.85), specificity (0.84, 95% CI: 0.81 ~ 0.86), PLR (5.0, 95% CI: 4.2 ~ 5.9), NLR (0.22, 95% CI: 0.18 ~ 0.26), and the area under the summary ROC curve (0.90, 95% CI: 0.87 ~ 0.92). Furthermore, we performed subgroup analysis and found that panels of multiple miRNAs could enhance the pooled sensitivity (sensitivity, specificity, and AUC values were 0.89, 0.87, and 0.94, respectively).
Conclusion: The meta-analysis showed that miRNAs can be used as potential diagnostic markers for DR, with high accuracy of diagnoses observed with the detection of miRNAs in plasma and serum.
Introduction
Diabetic retinopathy (DR) is a diabetic microvascular complication (1) and an important cause of visual impairment and blindness in adults worldwide (2). Among individuals with diabetes, the global prevalence of DR is 22.27%. In 2020, the number of adults diagnosed with DR was estimated to be 103.12 million (3), and this number is expected to increase to 160.5 million by 2045 (4). The early stages of DR have no conscious symptoms, and as the extent of the disease progresses vision loss can occur to varying degrees, and if untreated progresses to the proliferative stage, irreversible vision loss can result, therefore, it is critical to prevent progression from the early stages of DR (5, 6). Fundus fluorescein angiography is the gold standard for the diagnosis of DR (7, 8), and fundoscopy, fundus photography, and optical coherence tomography have emerged in the clinical setting (8). However, because fluorescein angiography is invasive, time-consuming, and risky, and in addition, interpretation of fundoscopic examinations and photographic reports requires physicians with expertise and skills in diabetes-related eye diseases (9), these methods are not applicable to the routine screening of DR in clinical practice. In recent years, miRNAs have been shown to play an important role in various diabetic complications (10, 11). The application of circulating miRNAs as biomarkers of DR has garnered significant interest (12, 13). Therefore, the construction of circulating markers for early diagnosis of DR and timely treatment are fundamental goals to improve its diagnosis and treatment.
MicroRNAs (miRNAs) are a group of endogenous non-coding single-stranded small molecule RNAs of 19-24 nucleotides in length (14), which are involved in the post-transcriptional regulation of gene expression and are closely associated with various pathophysiological processes in the human body (15–17). Since abnormal alterations in miRNA expression precedes the expression of the corresponding regulated proteins, the abnormal expression of miRNAs may already be present when patients with diabetes have not yet developed retinal microvascular damage, or when the damage has not yet affected visual function (18). miRNAs are not only widely present in a variety of human tissues and cells, but can also bind to Argonaute proteins (19), which, in turn, prevents the degradation of RNA enzymes, allowing miRNAs to be stably expressed in serum, plasma, and other body fluids (20). This stability, ubiquity, high specificity, high sensitivity, and recent advances in the detection and analysis methods render miRNAs potentially useful novel biomarkers for DR diagnosis (21).
However, there is little consistency in previous studies; hence, no reliable conclusions can be drawn regarding the relationship between miRNAs and DR. In addition, most of the available data are derived from retrospective studies with a small sample size lacking quantitative criteria. Therefore, we performed a diagnostic meta-analysis for the first time to determine the potential diagnostic value of miRNAs in patients with DR.
Materials and Methods
We have registered our protocol on PROSPERO (CRD42022323238) and can be found at: https://www.crd.york.ac.uk/prospero/. This meta-analysis follows the PRISMA statement of preferred reporting items for systematic evaluation and meta-analysis (Supplementary Table 1).
Search Strategy
We searched PubMed, Cochrane Library, Embase, Web of Science, China Wanfang database, and China Knowledge Network (CNKI) database to identify relevant articles published from the time of database creation to April 10, 2022, without restricting the language of publication. A search strategy for diagnostic DR of circulating microRNAs was developed based on PICOS principles. We obtained all the medical subject headings (MeSH) and entry words on the National Center for Biotechnology Information (NCBI) website, and search terms included “Diabetic Retinopathy” OR “Diabetic Retinopathies” OR “Retinopathies, Diabetic” OR “Retinopathy, Diabetic” AND “MicroRNAs” OR “MicroRNA” OR “miRNAs” OR “Micro RNA” OR “RNA, Micro” OR “Primary MicroRNA” OR “MicroRNA, Primary” OR “Primary miRNA” OR “pri-miRNA” OR “pri miRNA” OR “RNA, Small Temporal” OR “Temporal RNA, Small” OR “stRNA” OR “Small Temporal RNA” OR “pre-miRNA” OR “pre miRNA” AND “sensitiv*” OR “sensitivity and specificity” OR “predictive” OR “value*” OR “accuracy*”. We searched PubMed using the following strategy:((((Diabetic Retinopathy[Title/Abstract]) OR (Diabetic Retinopathies[Title/Abstract])) OR (Retinopathies, Diabetic[Title/Abstract])) AND ((((((MicroRNAs[Title/Abstract]) OR (miRNA[Title/Abstract])) OR (Micro RNA[Title/Abstract])) OR (pri-miRNA[Title/Abstract])) OR (stRNA[Title/Abstract])) OR (miR[Title/Abstract]))) AND (sensitiv*[Title/Abstract] OR sensitivity and specificity[MeSH Terms] OR (predictive[Title/Abstract] AND value*[Title/Abstract]) OR predictive value of tests[MeSH Term] OR accuracy*[Title/Abstract]).
Eligibility Criteria and Quality Assessment
Subjects were recruited with the following inclusion criteria: (1) all patients in the case group were diagnosed following clinically recognized diagnostic criteria; (2) the intervention was characterized by the diagnosis of DR performed using miRNA examination; (3) false positive (FP), true positive (TP), false negative (FN), and true negative (TN) could be derived directly or calculated from the literature. The exclusion criteria were set as follows: (1) non-human trials; (2) non-case-control studies; (3) reviews, letters, or conference proceedings; (4) insufficient data.
Two investigators used the Quality Assessment of Diagnostic Accuracy Studies-2 (QUADAS-2) (22) tool to independently assess the risk of bias and clinical applicability of included studies. The tool comprised four main components: selection of cases, trials to be evaluated, gold standard, and case flow and progression. Disagreements were resolved by agreement between the two investigators through negotiation or by involving a third reviewer.
Data Extraction
Data and information were extracted independently by two investigators from eligible studies, including first author, year of publication, country, miRNAs, number of samples, internal reference, cut-off values, control source, sample source, assay method, miRNAs expression, AUC with 95% confidence intervals (CIs), sensitivity, specificity, TP, FP, FN, and TN.
Statistical Analysis
We extracted TP, FP, FN, and TN values to calculate pooled sensitivity, specificity, positive likelihood ratio (PLR), negative likelihood ratio (NLR), diagnostic ratio (DOR), and corresponding 95% confidence interval (CI). Summary receiver operating characteristic (SROC) curves were plotted to calculate the area under the curve (AUC) to test the pooled diagnostic value of miRNAs. We used the chi-square test and I2 test to assess the heterogeneity between studies. Heterogeneity between studies was assessed using Cochran-Q test and I2 statistic for quantitative analysis, with P-value was less than 0.05 for Cochran-Q test and I2>50%, indicating significant heterogeneity between studies and selection of random-effect model (23, 24). We performed subgroup analysis and regression analysis to determine the source of heterogeneity. Sensitivity analysis was performed to determine the robustness of the meta-analysis results. Deeks’ funnel plots were used to examine publication bias. In addition, Fagan′s nomogram was drawn to further assess the diagnostic efficacy of miRNAs. Review Manager 5.3 was used to evaluate the quality of the literature, and Stata 14.0 was used to analyze all data. A P-value < 0.05 was considered statistically significant.
Results
Literature Search and Study Characteristics
We searched 423 records in PubMed, Cochrane Library, Embase, Web of Science, China Wanfang database, and CNKI database. Of these, 296 duplicate studies were excluded. Subsequently, based on the titles and abstracts, 246 irrelevant studies, reviews, conference proceedings, and commentaries were excluded, and we evaluated 50 full-text articles and excluded 25 studies based on the exclusion criteria, including 16 studies with insufficient data and six reviews and three studies that were not related to miRNAs. The remaining 25 documents were included in the meta-analysis. The screening flow chart is shown in Figure 1.
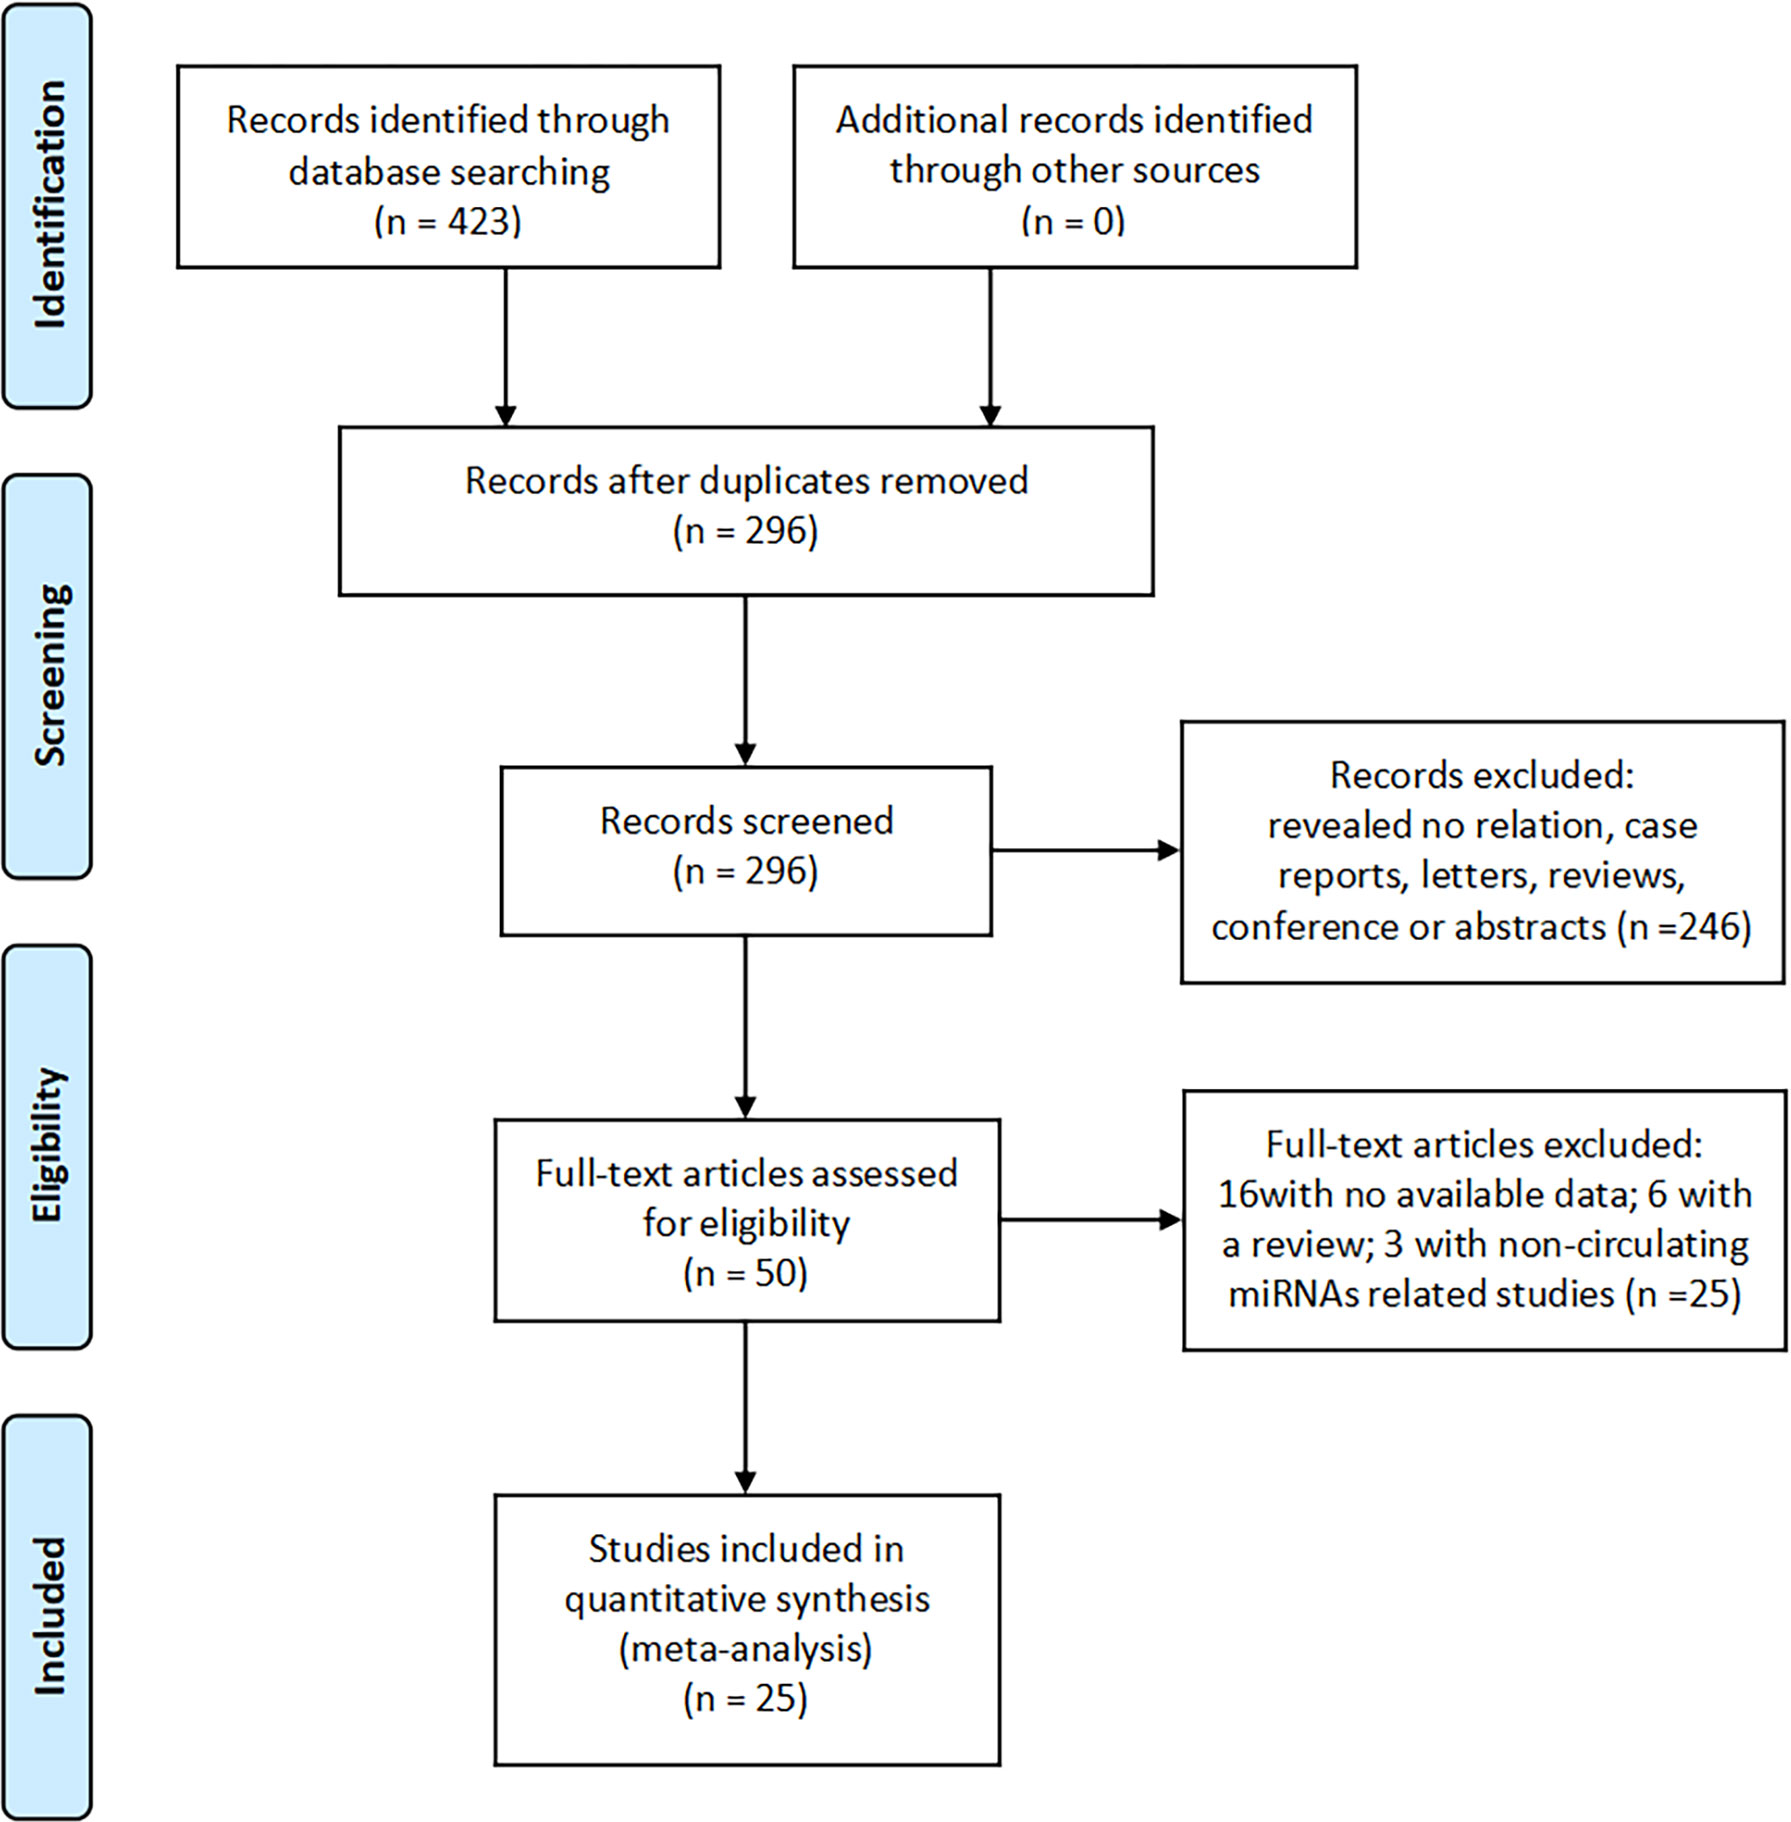
Figure 1 Flow diagram showing selection of studies for meta-analysis.
In total, 25 documents (spanning years 2014 to 2022) included in this meta-analysis involved 52 studies (11, 18, 20, 25–46) (Table 1), all of which were case-control studies that included a total of 1987 patients with DR and 1771 non-DR controls, with the source of controls being diabetic patients not diagnosed with DR, healthy population, and patients with cataract. Among these 52 studies, 41 studies reported a single miRNA, and 11 studies discussed a panel of miRNAs. A total of 38 studies detected miRNAs in serum, 10 studies extracted miRNAs in plasma, and four studies extracted miRNAs from the aqueous humor. A total of four studies were conducted in Africa, two studies were conducted in Europe, and the remaining studies were conducted in Asian populations. In addition, 7 of the included studies involved the examination of miRNA-21, and miRNA-20b, miRNA-93, and miRNA-15 were examined in five studies.
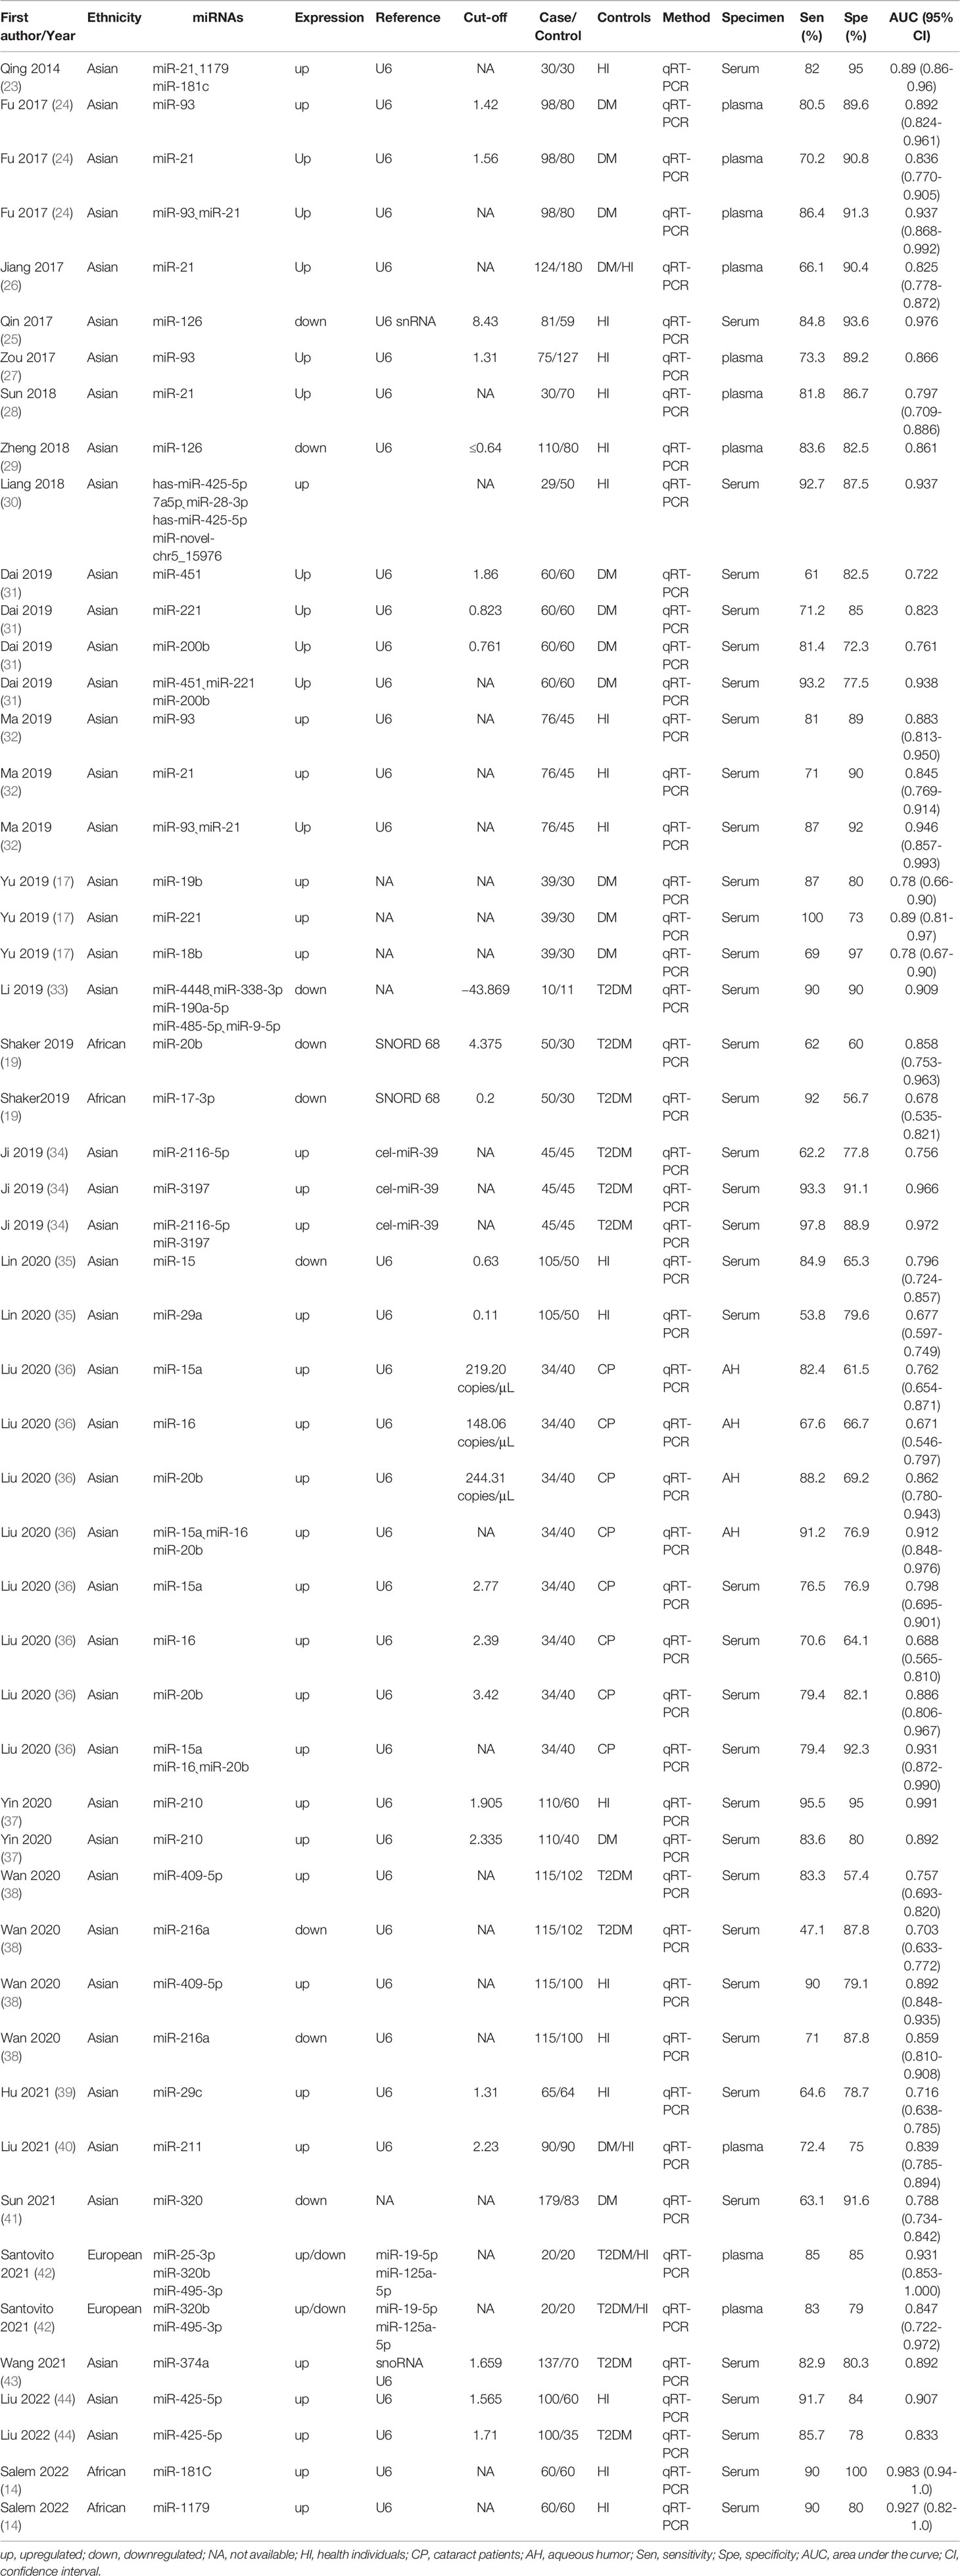
Table 1 Characteristics of the included studies.
Quality Assessment
The quality of the included studies was evaluated using the QUADAS-2, and the results were analyzed by applying Review Manager 5.3. The results are shown in Figure 2. Most of the studies included in our meta-analysis were continuous and time scaled. Given that all patients with DR included in the study were diagnosed by clinically recognized diagnostic criteria, all trials involved case-control studies, introducing high or unclear risks in the selection field.
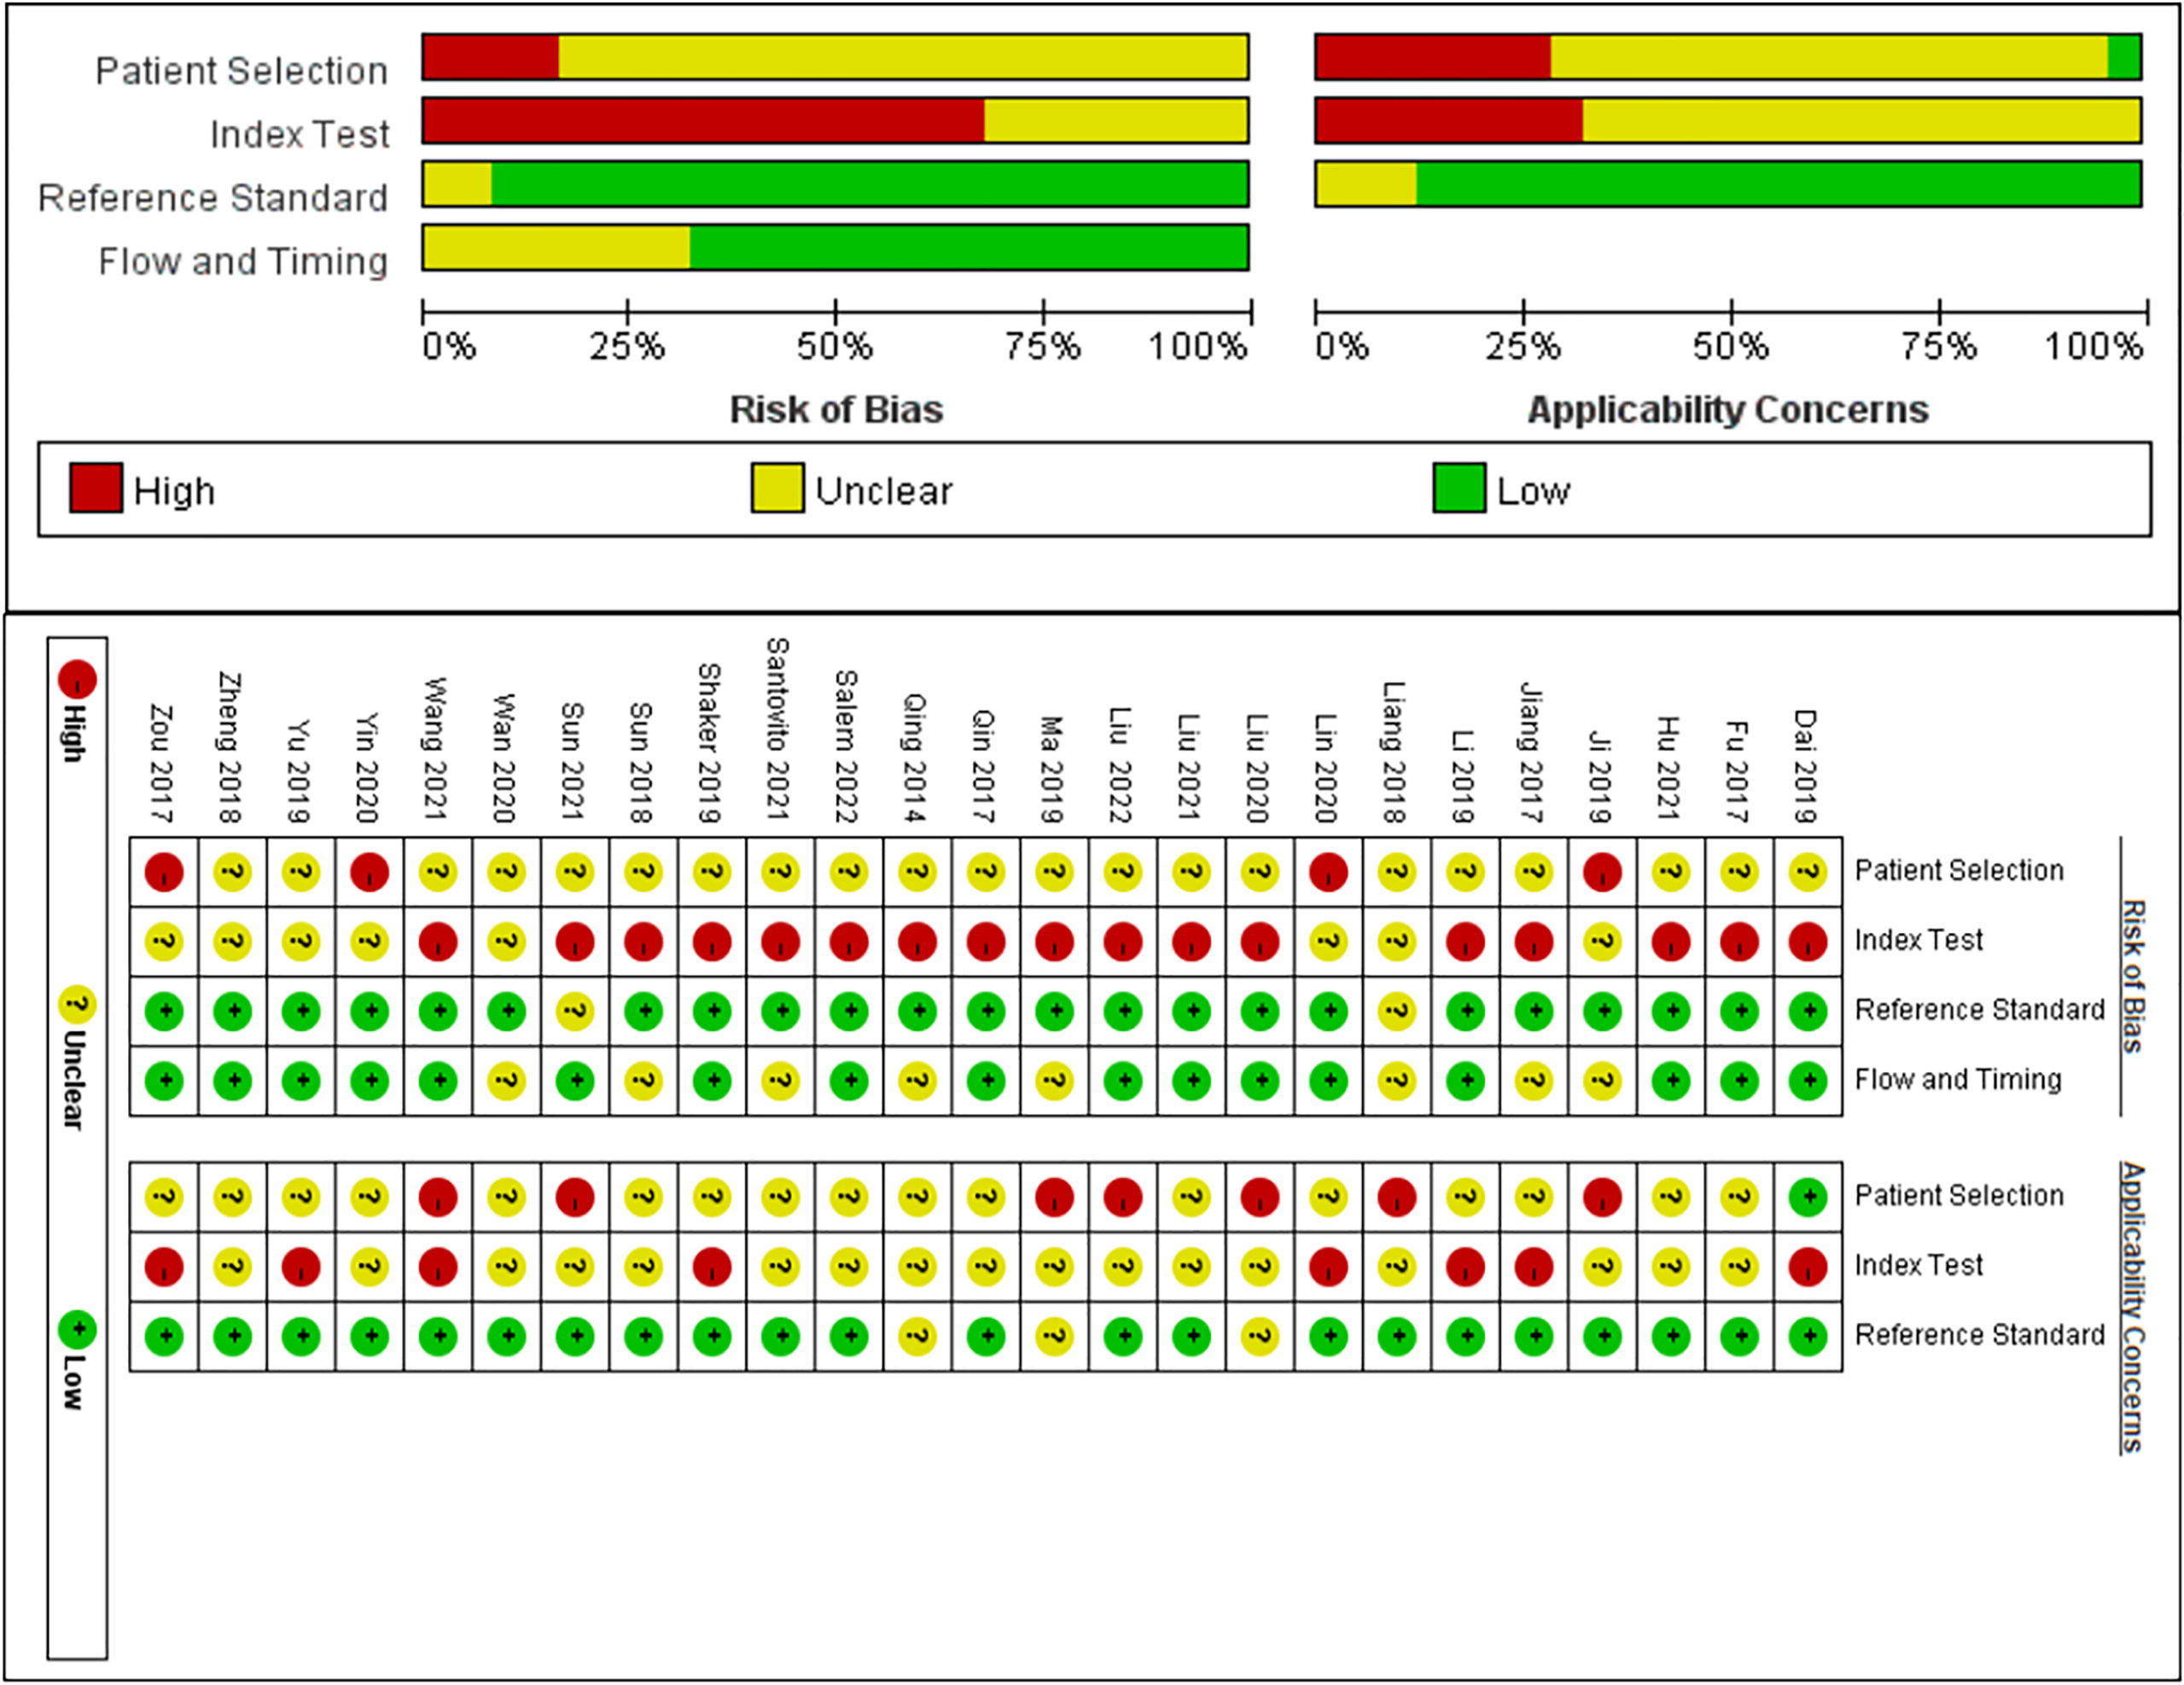
Figure 2 Quality Assessment of Diagnostic Accuracy Studies (QUADAS)-2 assessment for risk of bias and applicability. Red, yellow and green indicate high, unclear and low risk respectively.
Diagnostic Accuracy of MiRNAs in DR
The sensitivity and specificity of miRNAs in diagnosing DR are shown in Figure 3. Forest plots of pooled data showed I2 = 85.11% for sensitivity and I2 = 76.96% for specificity, suggesting a large heterogeneity between studies, and a random effects model was used to estimate the diagnostic performance of miRNAs in DR. The results for diagnostic accuracy of miRNA for DR were as follows: sensitivity, 0.82 (95% CI: 0.78-0.85); specificity, 0.84 (95% CI: 0.81-0.86); NLR, 0.22 (95% CI: 0.18 -0.26); PLR, 5.0 (95% CI: 4.2-5.9), and DOR, 23 (95% CI: 17-31). In addition, we plotted the SROC curve to assess the diagnostic accuracy (Figure 4). The AUC was 0.90 (95% CI: 0.87-0.92), which indicated a strong overall accuracy of miRNAs in the diagnosis of DR. Aiding in the process of clinical decision during diagnosis is an important value of biomarkers. Therefore, we plotted a graph (Figure 5) based on the combination of PLR and NLR to determine their clinical applicability. PLR >10 and NLR <0.1 represent high diagnostic accuracy. We observed superior diagnostic efficacy of miRNAs in two studies in the articles by Yin et al. and Ji et al. (25, 37). Therefore, miR-3197 and miR-210 may be promising miRNAs and should be further examined in future studies (Figure 5A). MiRNAs with high diagnostic accuracy were also confirmed by Fagan′s nomogram, with post-test probabilities of 0.56 and 0.5 for PLR and NLR, respectively, when the pre-test probability was set at 20% (Figure 5B).
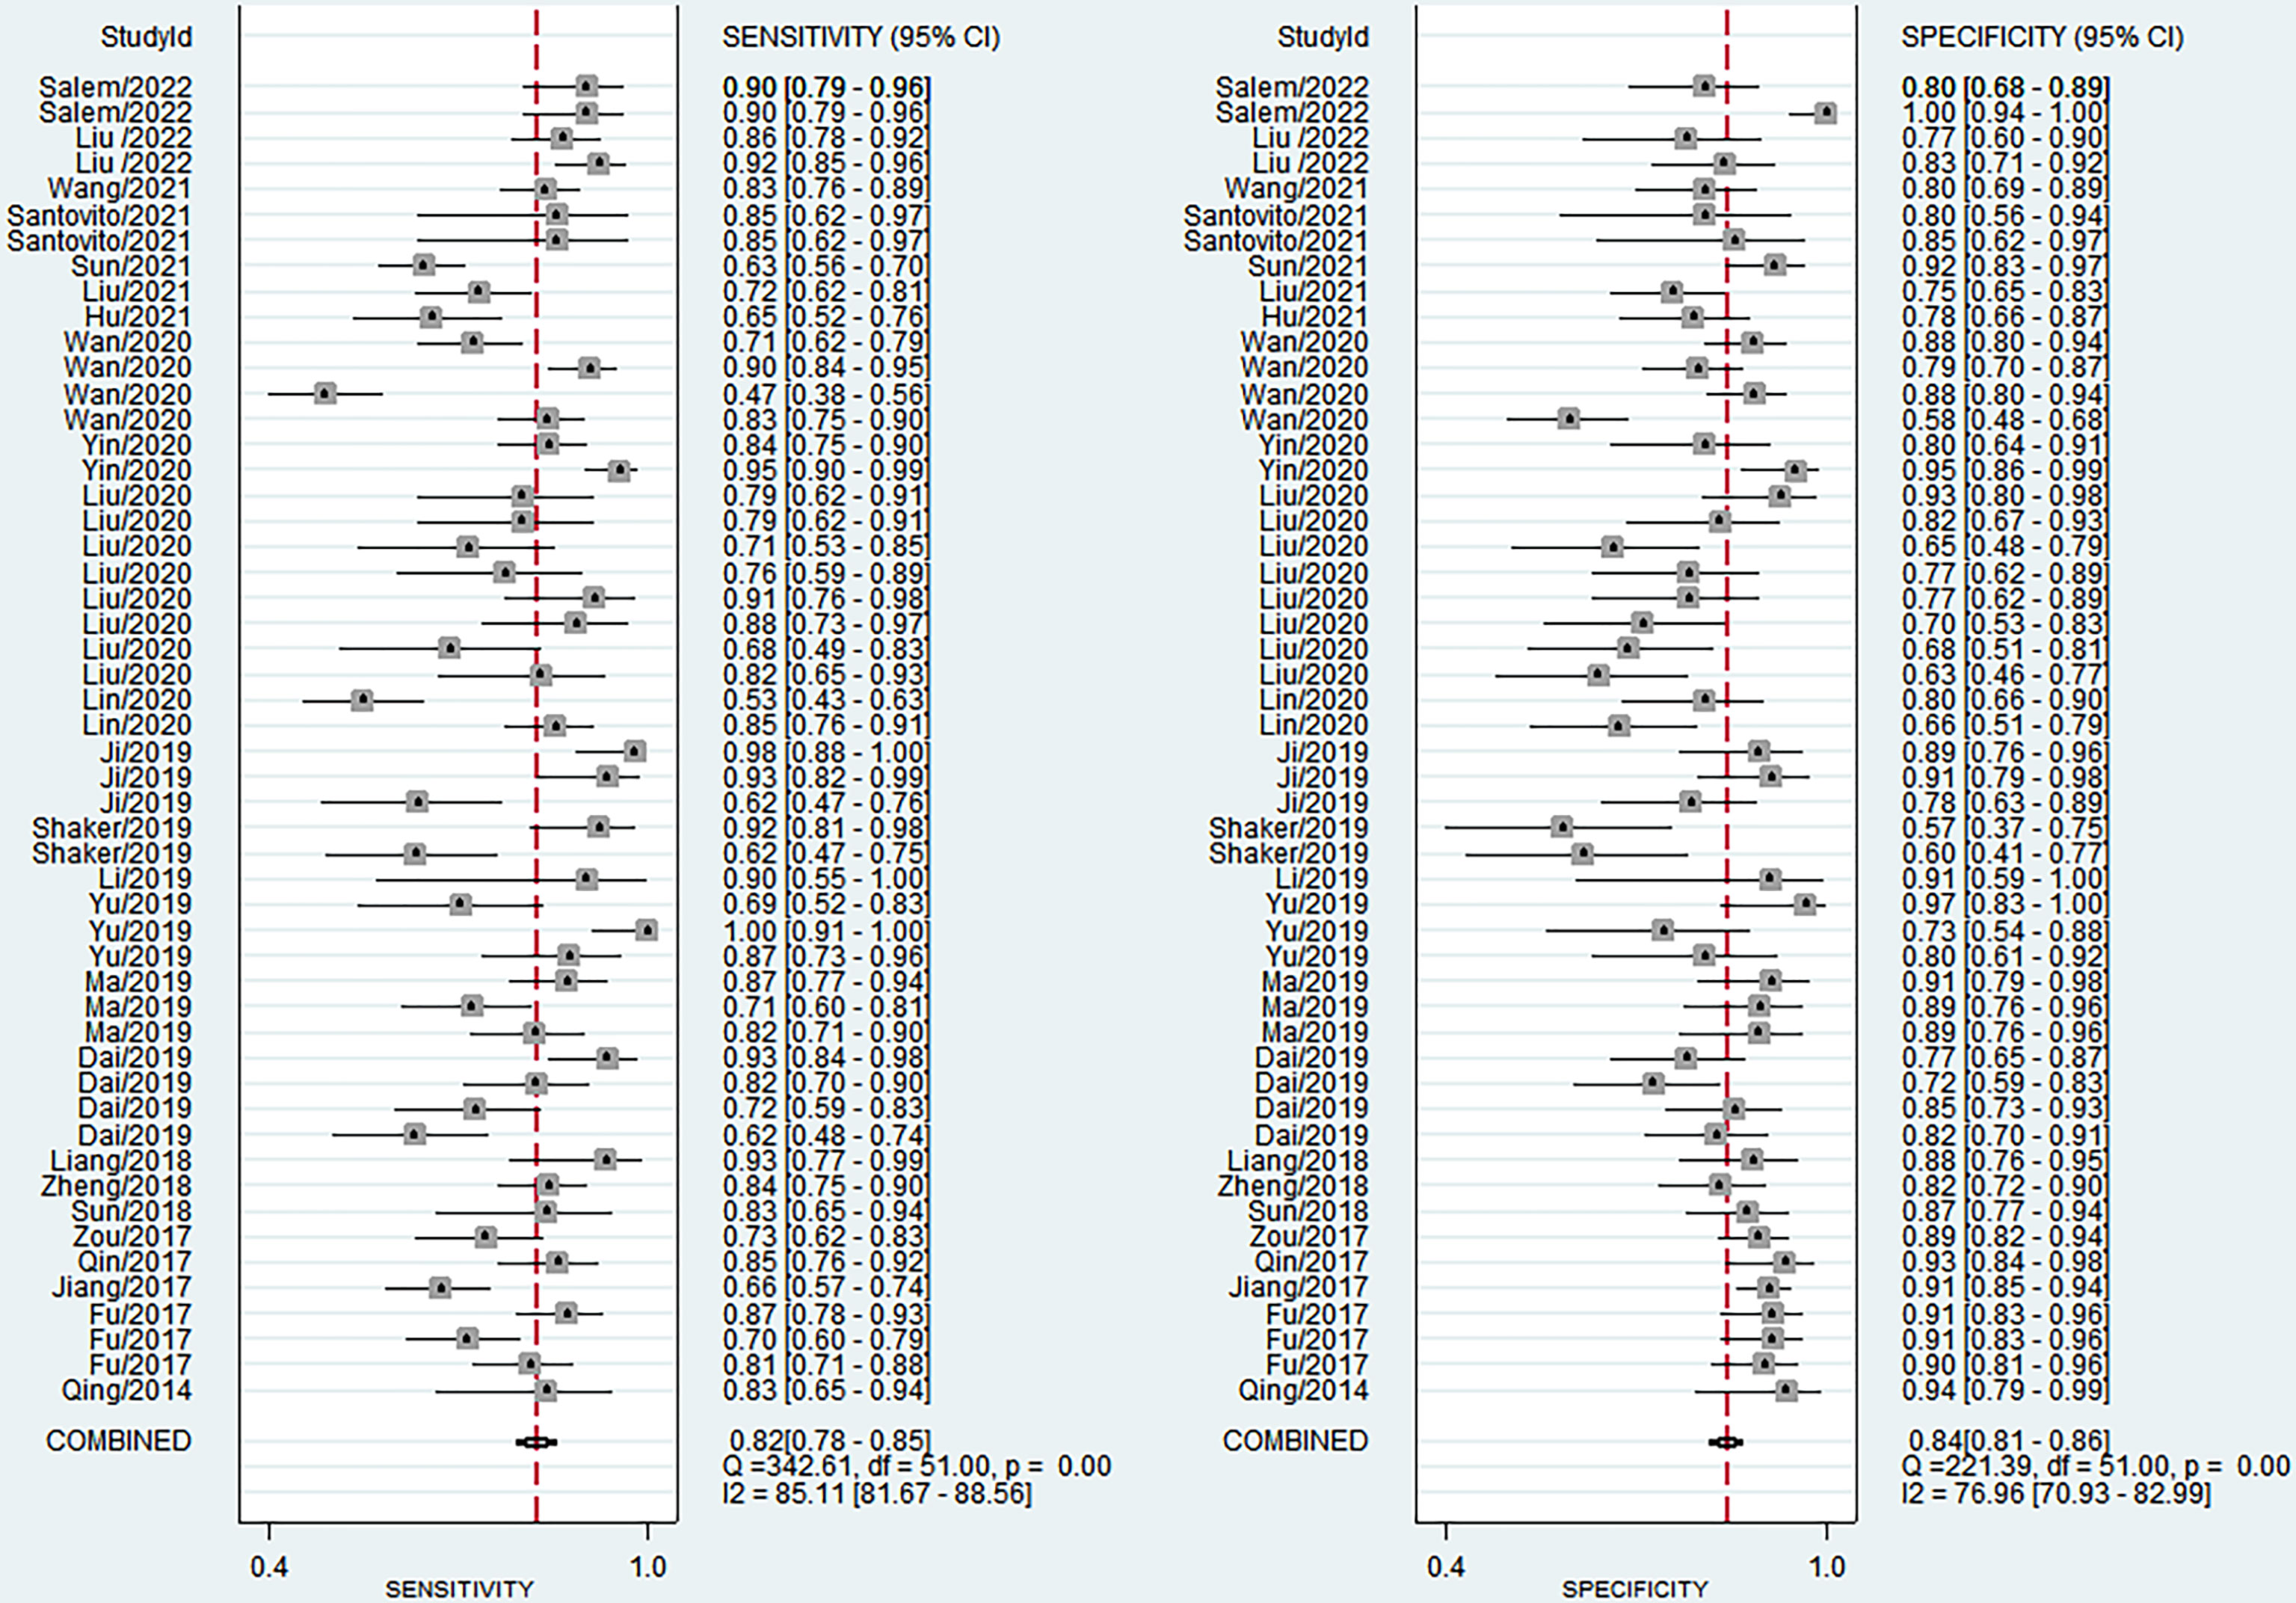
Figure 3 Forest plots of studies examining microRNAs used in the diagnosis of diabetic retinopathy.
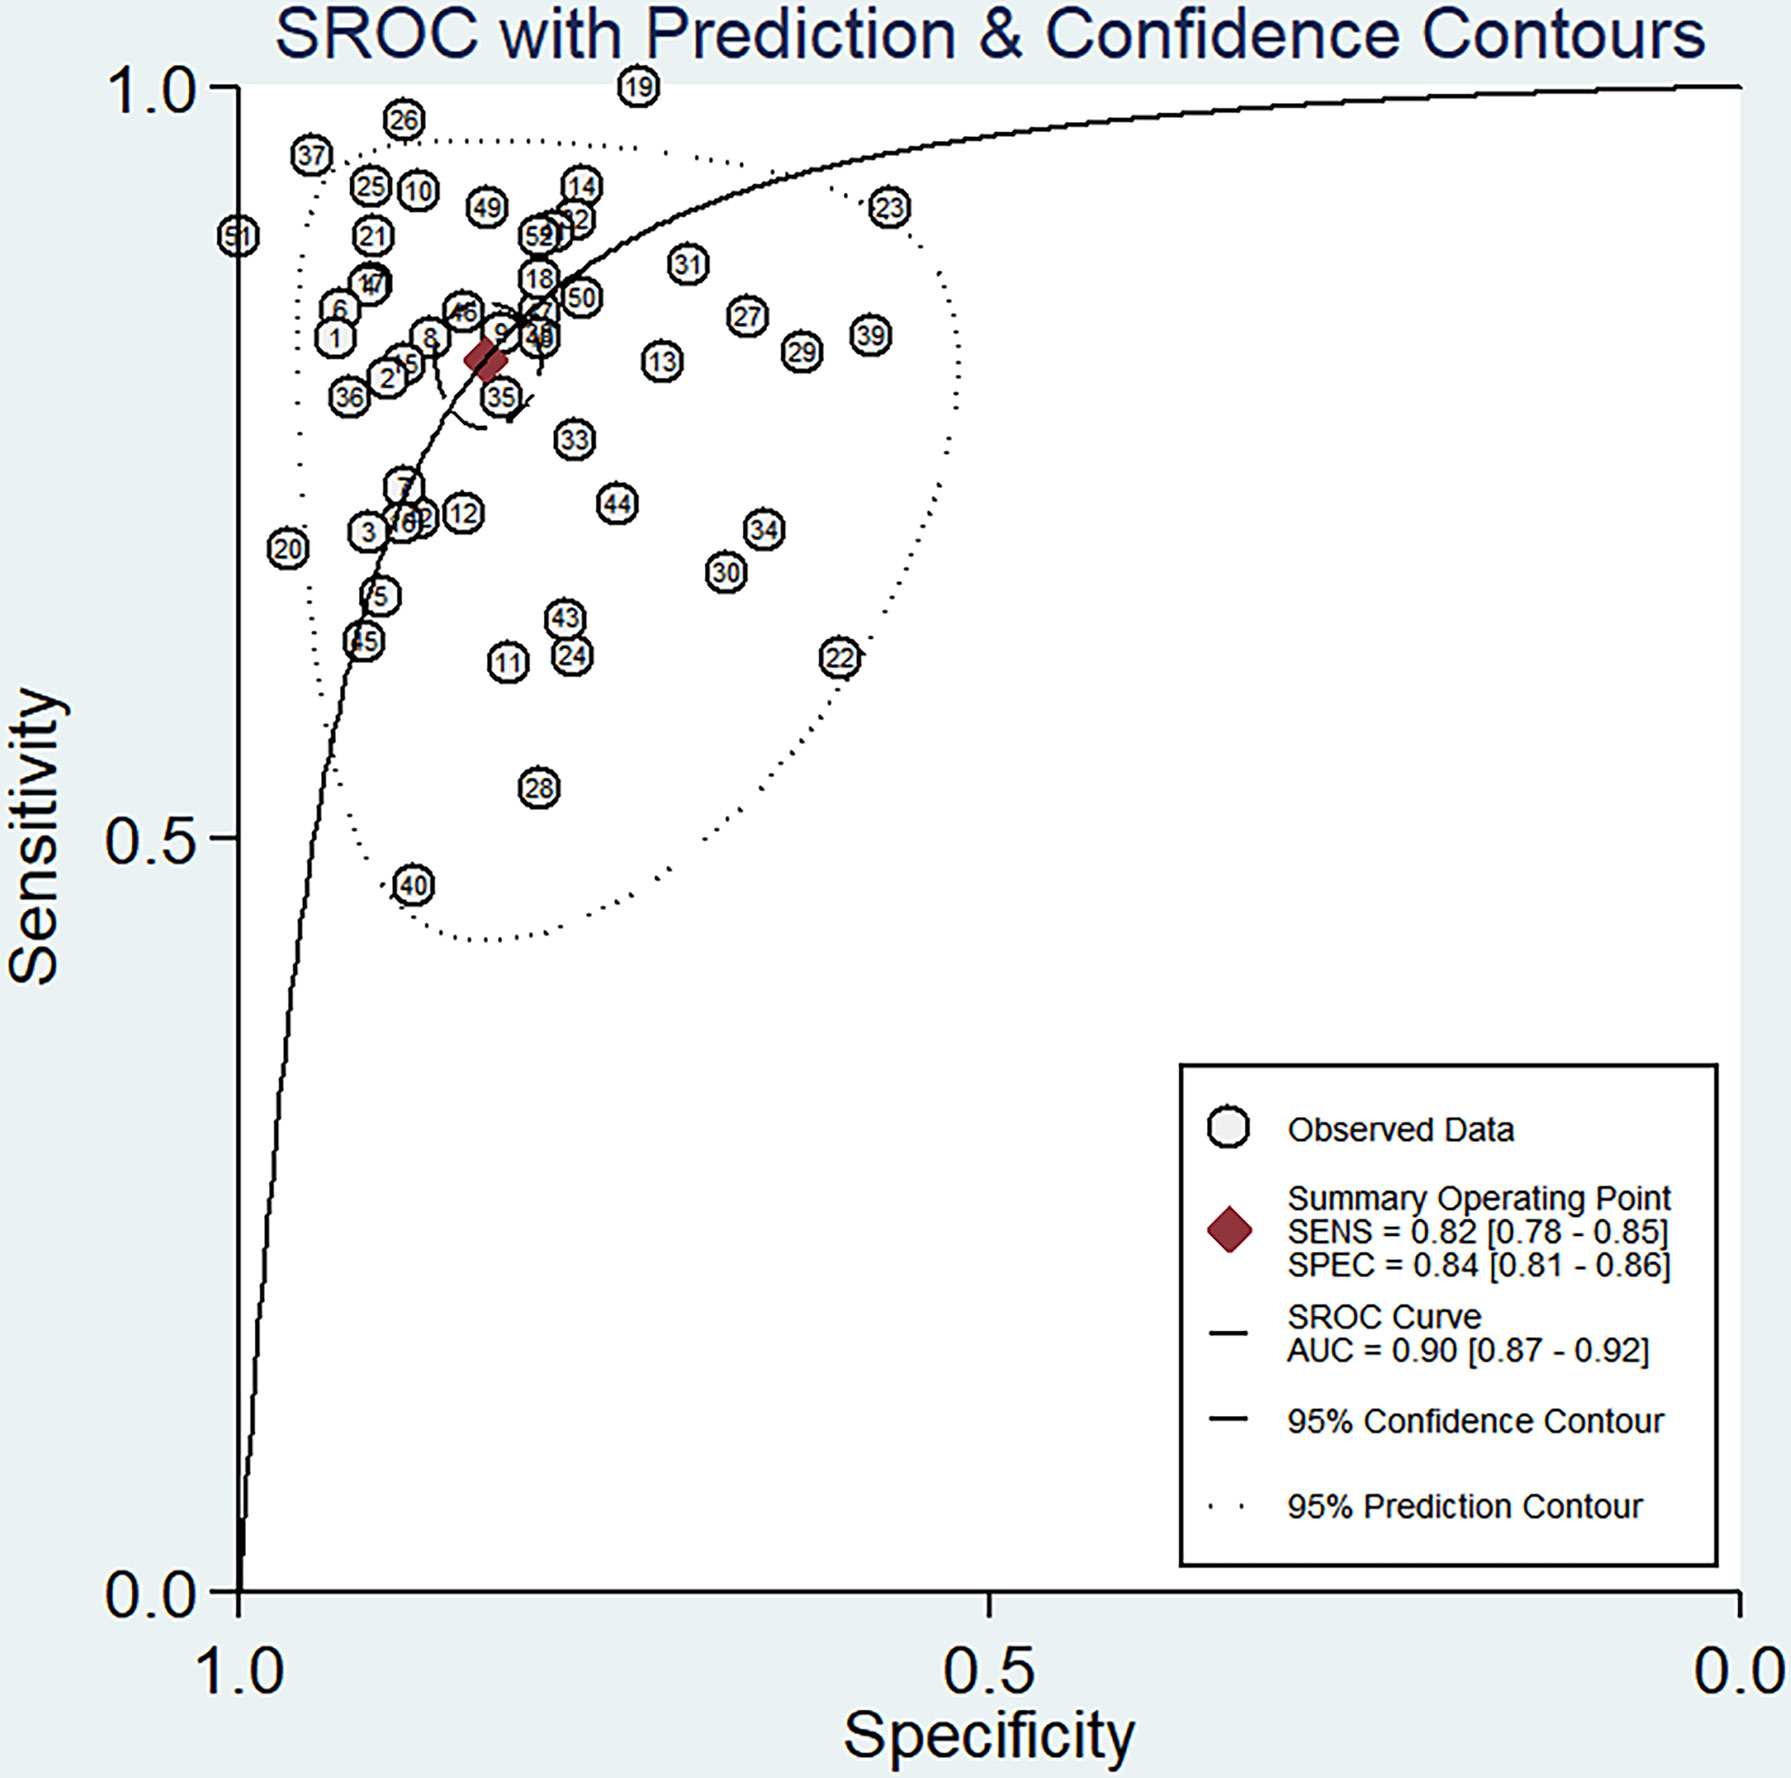
Figure 4 Summary receiver operator characteristic (SROC) curve examining the overall accuracy of miRNAs in the diagnosis of diabetic retinopathy.
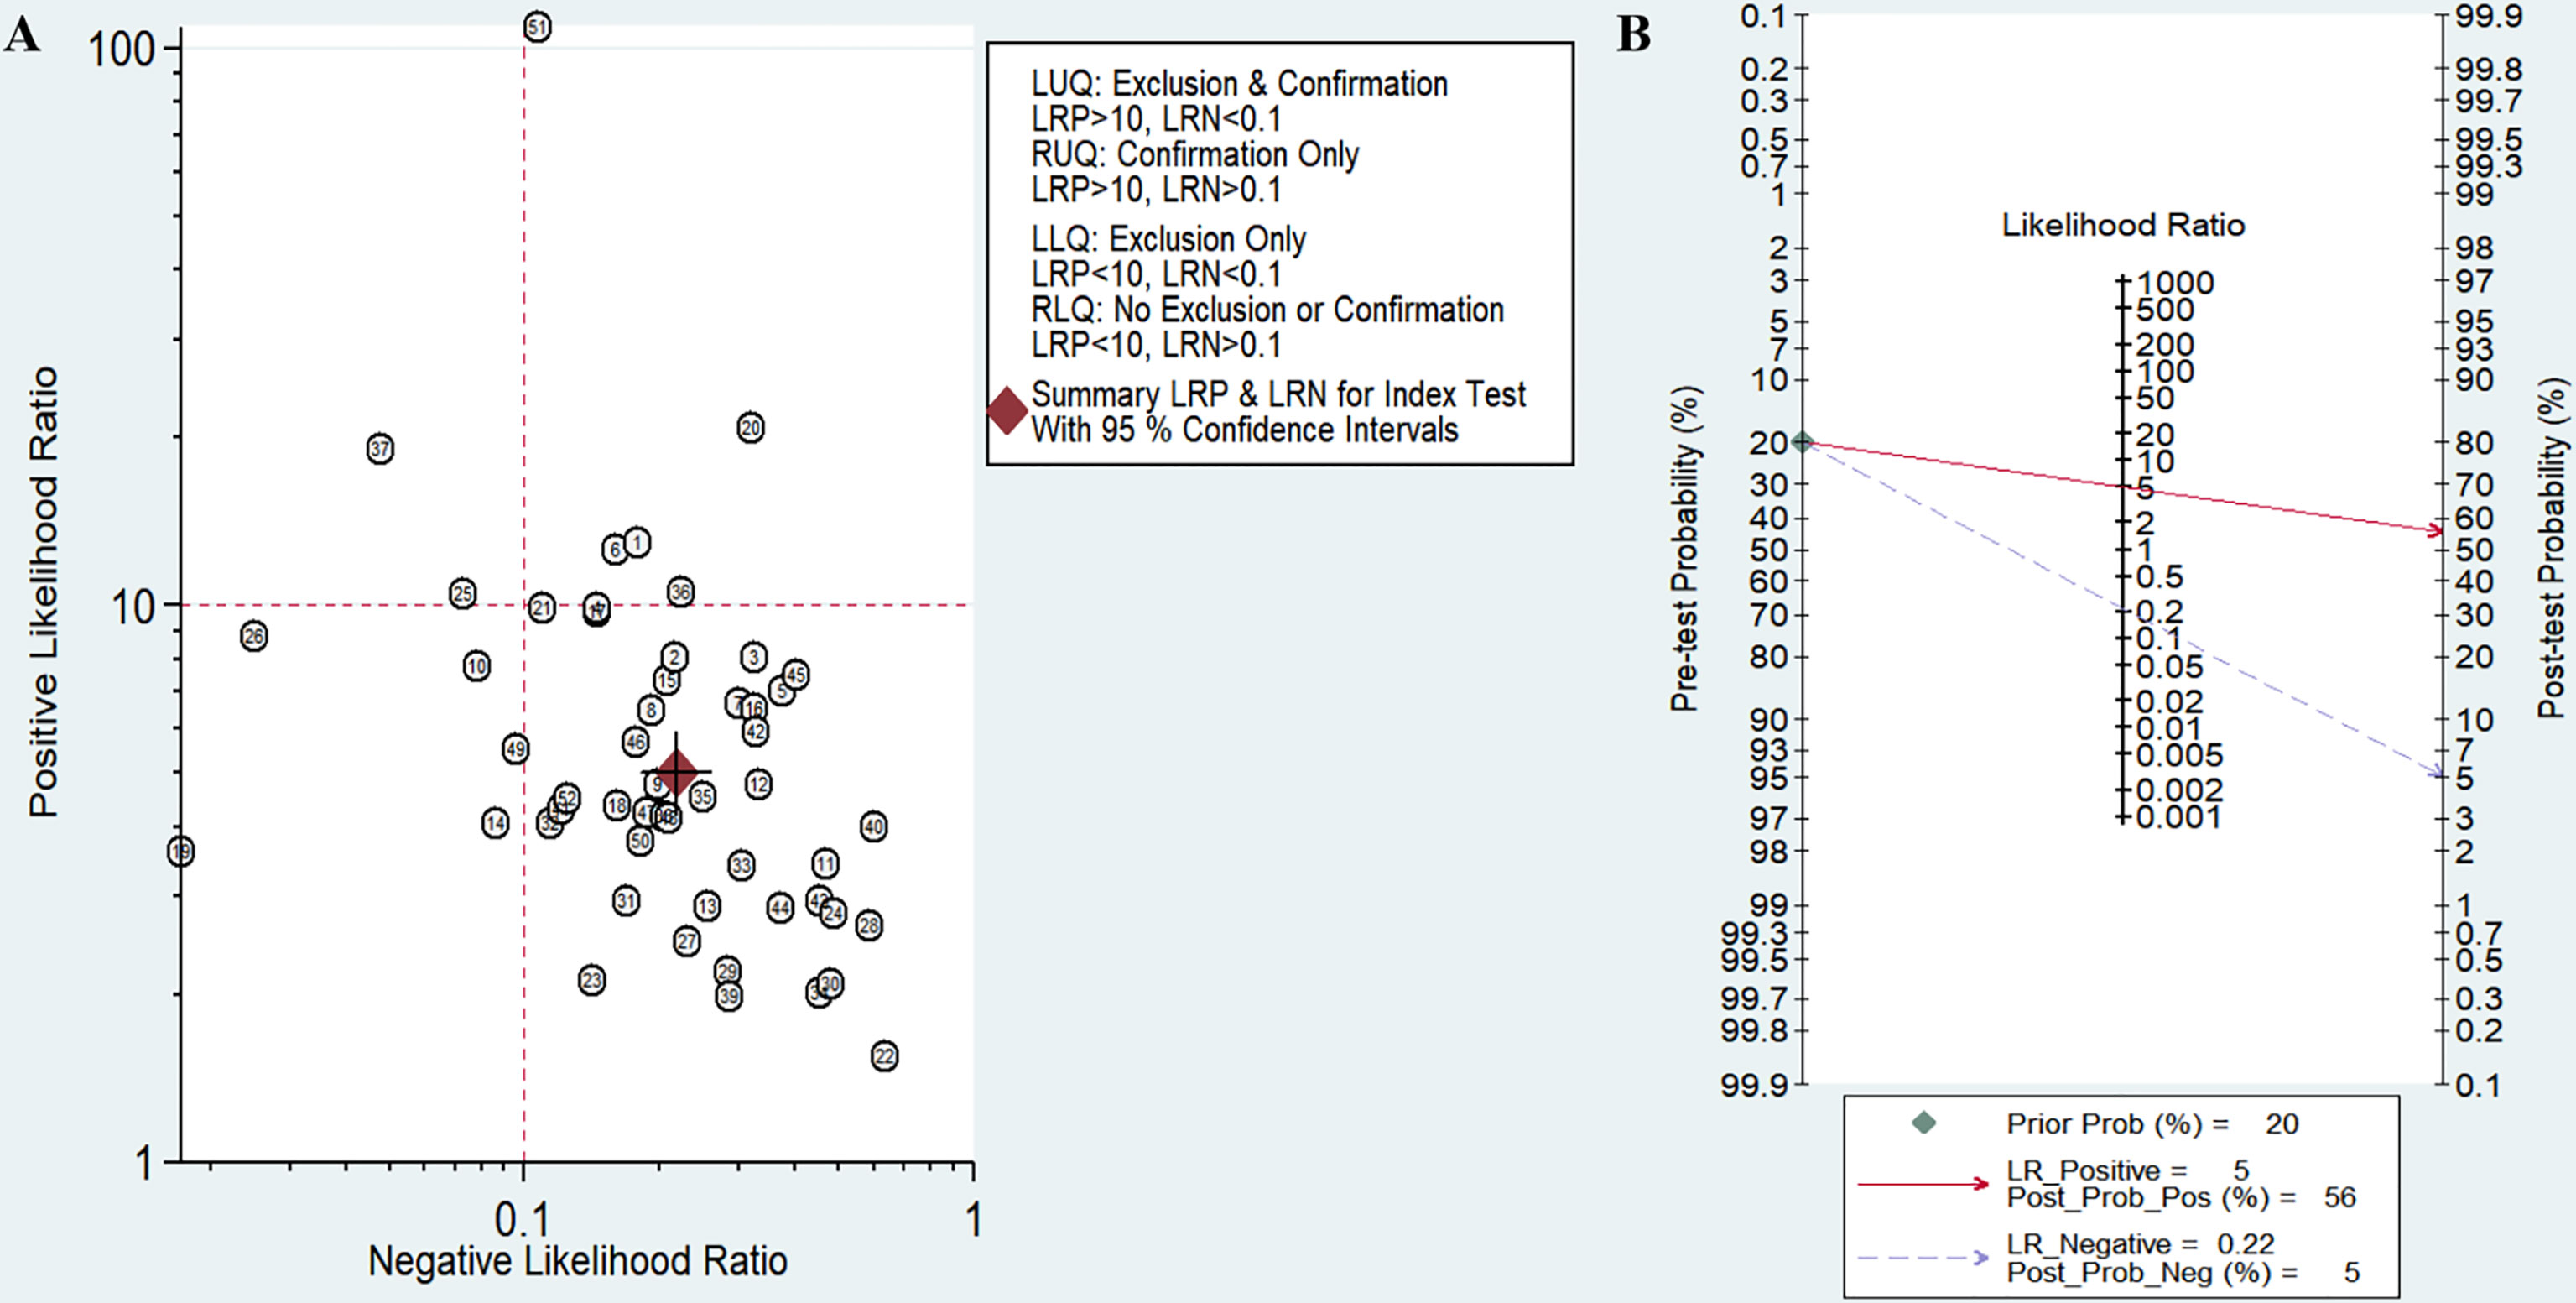
Figure 5 Assessment of clinical applicability of miRNAs for diagnosis of diabetic retinopathy (DR). (A) Summary of positive likelihood ratio and negative likelihood ratio for diagnosis of DR; (B) Fagan’s nomogram of miRNA studies for diagnosis of DR.
Subgroup Analyses, Meta-Regression, and Sensitivity Analyses
To explore the potential heterogeneity, we performed subgroup analysis (Table 2) and regression analysis, grouped according to miRNA profiling, sample size, sample source, miRNA expression, ethnicity, internal reference and cut-off values setting. Notably, the diagnostic accuracy of miRNA panel was higher compared to single miRNA. The sensitivity, specificity, PLR, NLR, DOR and AUC values for single miRNAs and miRNA panel were 0.80 (95% CI: 0.76-0.83), 0.83 (95% CI: 0.79-0.86), 4.6 (95% CI: 3.8-5.5), 0.24 (95% CI: 0.20-0.30), 19 (95% CI: 14-26) and 0.88 (95% CI: 0.85-0.91) and 0.89 (95% CI: 0.85-0.92), 0.87 (95% CI: 0.83-0.91), 7.1 (95% CI: 5.2-9.6), 0.13 (95% CI: 0.09-0.17), 56 (95% CI: 37-86) and 0.94 (95% CI: 0.92-0.96), respectively. The results of the diagnostic accuracy of DR for sample size <100 and sample ≥100 are listed as follows: the sensitivity was 0.82 (95% CI: 0.79-0.85) vs. 0.80 (95% CI: 0.72-0.86), specificity was 0.84 (95% CI: 0.80-0.87) vs. 0.83 (95% CI: 0.78-0.87), PLR was 5.1 (95% CI: 4.1-6.3) vs. 4.7 (95% CI: 3.6-6.2), NLR was 0.21 (95% CI: 0.17-0.26) vs. 0.24 (95% CI: 0.17-0.34), DOR was 24 (95% CI: 17-35) vs. 20 (95% CI: 12-32), and AUC was 0.90 (95% CI: 0.87-0.92) vs. 0.89 (95% CI: 0.85-0.91). No significant difference was observed in the overall diagnostic accuracy of DR for sample size <100 compared to that observed with sample size ≥100. In plasma samples, the values corresponding to sensitivity, specificity, PLR, NLR, DOR, and AUC were 0.78 (95% CI: 0.73-0.82), 0.87 (95% CI: 0.83-0.90), 6.1 (95% CI: 4.7-7.9), 0.25 (95% CI: 0.20-0.31), 24 (95% CI: 16-36), and 0.90 (95% CI: 0.87-0.92), respectively. In serum samples, the values corresponding to sensitivity, specificity, PLR, NLR, DOR, and AUC were 0.83 (95% CI: 0.78-0.86), 0.84 (95% CI: 0.80-0.87), 5.1 (95% CI: 4.1-6.3), 0.21 (95% CI: 0.16-0.26), 25 (95% CI: 17-36), and 0.90 (95% CI: 0.87-0.92), respectively. In aqueous humor, the values corresponding to sensitivity, specificity, PLR, NLR, DOR, and AUC were 0.83 (95% CI: 0.72-0.91), 0.69 (95% CI: 0.61-0.87), 2.7 (95% CI: 2.0-3.7), 0.24 (95% CI: 0.13-0.43), 11 (95% CI: 5-26), and 0.77 (95% CI: 0.73-0.80), respectively. Interestingly, miRNA expression levels were also correlated with diagnostic value, and our results showed that miRNAs with increased expression exhibited better diagnostic value. In the group demonstrating increased expression of miRNAs, the corresponding values for sensitivity, specificity, PLR, NLR, DOR and AUC were 0.83 (95% CI: 0.79-0.86), 0.84 (95% CI: 0.81-0.87), 5.1 (95% CI: 4.2-6.2), 0.21 (95% CI: 0.17-0.25), 25 (95% CI: 18-35) and 0.90 (95% CI: 0.87-0.92), respectively. In addition, ethnicity had an impact on the diagnostic value of miRNAs, compared to the Asian population, the non-Asian populations had higher diagnostic accuracy, for sensitivity 0.86 (95% CI: 0.76-0.92), specificity 0.83 (95% CI: 0.61-0.94), PLR 5.0 (95% CI: 1.9 -13.1), NLR 0.17 (95% CI: 0.09-0.32), DOR 29 (95% CI: 7-124), and AUC 0.91 (95% CI: 0.88-0.93). Surprisingly, most studies selected U6 as an internal reference, yet the diagnostic value of the selected other miRNA internal reference groups was more significant than the U6 group, with sensitivity, specificity, PLR, NLR, DOR and AUC for the U6 group, respectively, of 0.80 (95% CI: 0.77-0.83), 0.84 (95% CI: 0.81-0.87), 5.0 (95%CI: 4.1-6.0), 0.24 (95%CI: 0.20-0.28), 21 (95%CI: 16-29) and 0.89 (95%CI: 0.86-0.92), respectively, for the non-U6 group sensitivity, specificity, PLR, NLR, DOR and AUC, respectively, were 0.88 (95% CI: 0.76-0.94), 0.81 (95% CI: 0.71-0.88), 4.5 (95% CI: 2.8-7.3), 0.15 (95% CI: 0.07 -0.33), 29 (95% CI: 9-91) and 0.90 (95% CI: 0.87-0.92), while studies without an explicitly given internal reference had higher diagnostic value, with sensitivity, specificity, PLR, NLR, DOR and AUC were 0.90 (95% CI: 0.70-0.97), 0.86 (95% CI: 0.72-0.94), 6.4 (95% CI: 3.3-12.6), 0.12 (95% CI: 0.04-0.36), 56 (95% CI: 19-164) and 0.93 (95% CI: 0.91-0.95). In addition, studies with optimal cut-off values had pooled results for sensitivity, specificity, PLR, NLR, DOR and AUC of 0.80 (95% CI: 0.75-0.83), 0.80 (95% CI: 0.76-0.84), 4.0 (95% CI: 3.2-4.9), 0.26 (95% CI: 0.21-0.32), 15 (95% CI: 11-23) and 0.87 (95% CI: 0.83-0.89), while studies without cut-off values showed better diagnostic value with sensitivity of 0.84 (95%CI: 0.79–0.88), specificity of 0.87 (95%CI: 0.83–0.90), PLR of 6.4 (95%CI: 5.0–8.1), NLR of 0.18 (95%CI: 0.14–0.24), DOR of 35 (95%CI: 23–53), and AUC of 0.92 (95%CI: 0.89–0.94), respectively.
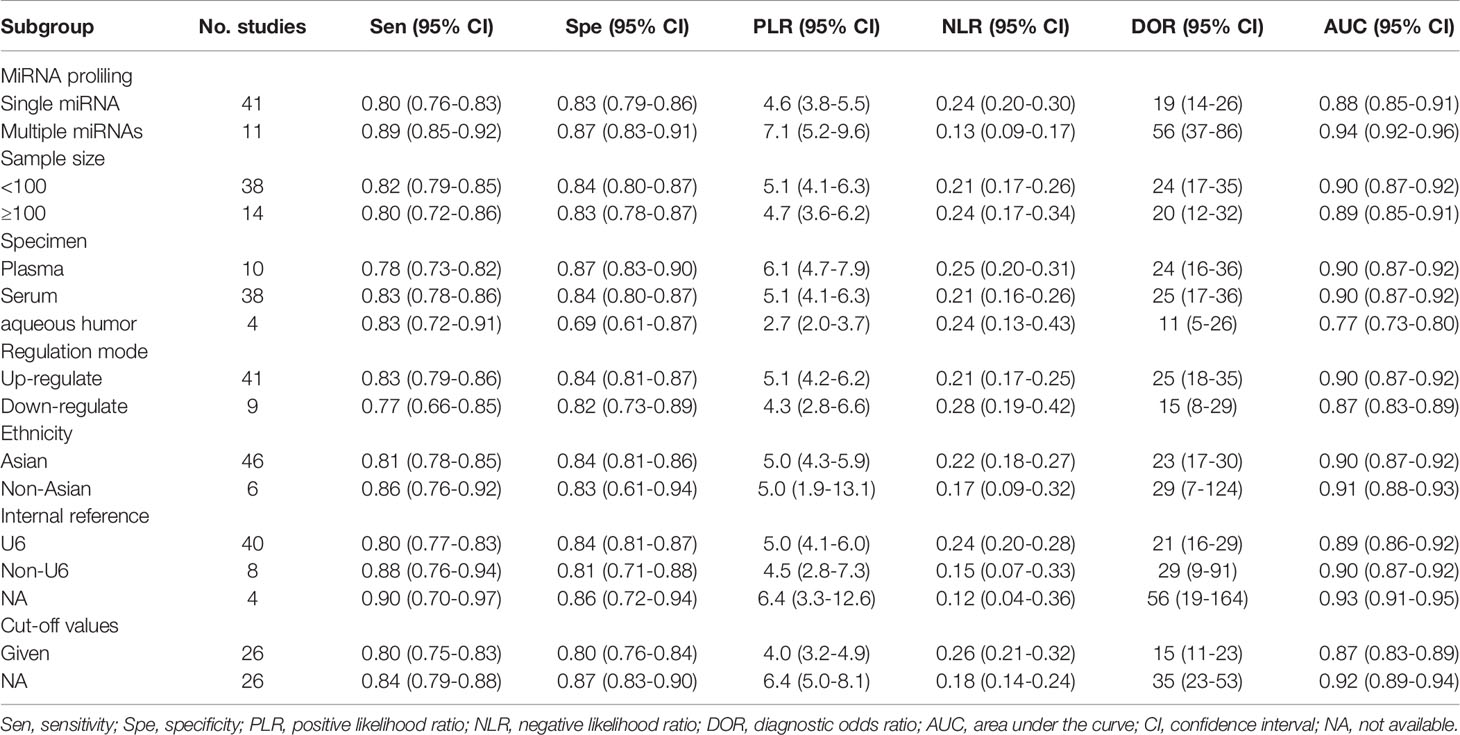
Table 2 Summary estimates of diagnostic power and their 95% confidence intervals.
The results of the sensitivity analysis are shown in Figure 6. The goodness of fit (Figure 6A) and bivariate normality (Figure 6B) showed that the random effects model was suitable. Influence analysis identified that studies of Yu et al, Shaker et al, Yin et al, Wan et al, and Salem et al. were the most dominant studies in weight (Figure 6C). Outlier detection implied that heterogeneity may be attributed to the data corresponding to studies of Yu et al, Wan et al, and Salem et al. (Figure 6D). After excluding four outlier studies, the I2 value for heterogeneity decreased to 3.98% for sensitivity and 7.48% for specificity. There was no significant change in the pooled results for diagnostic efficacy (Table 3).
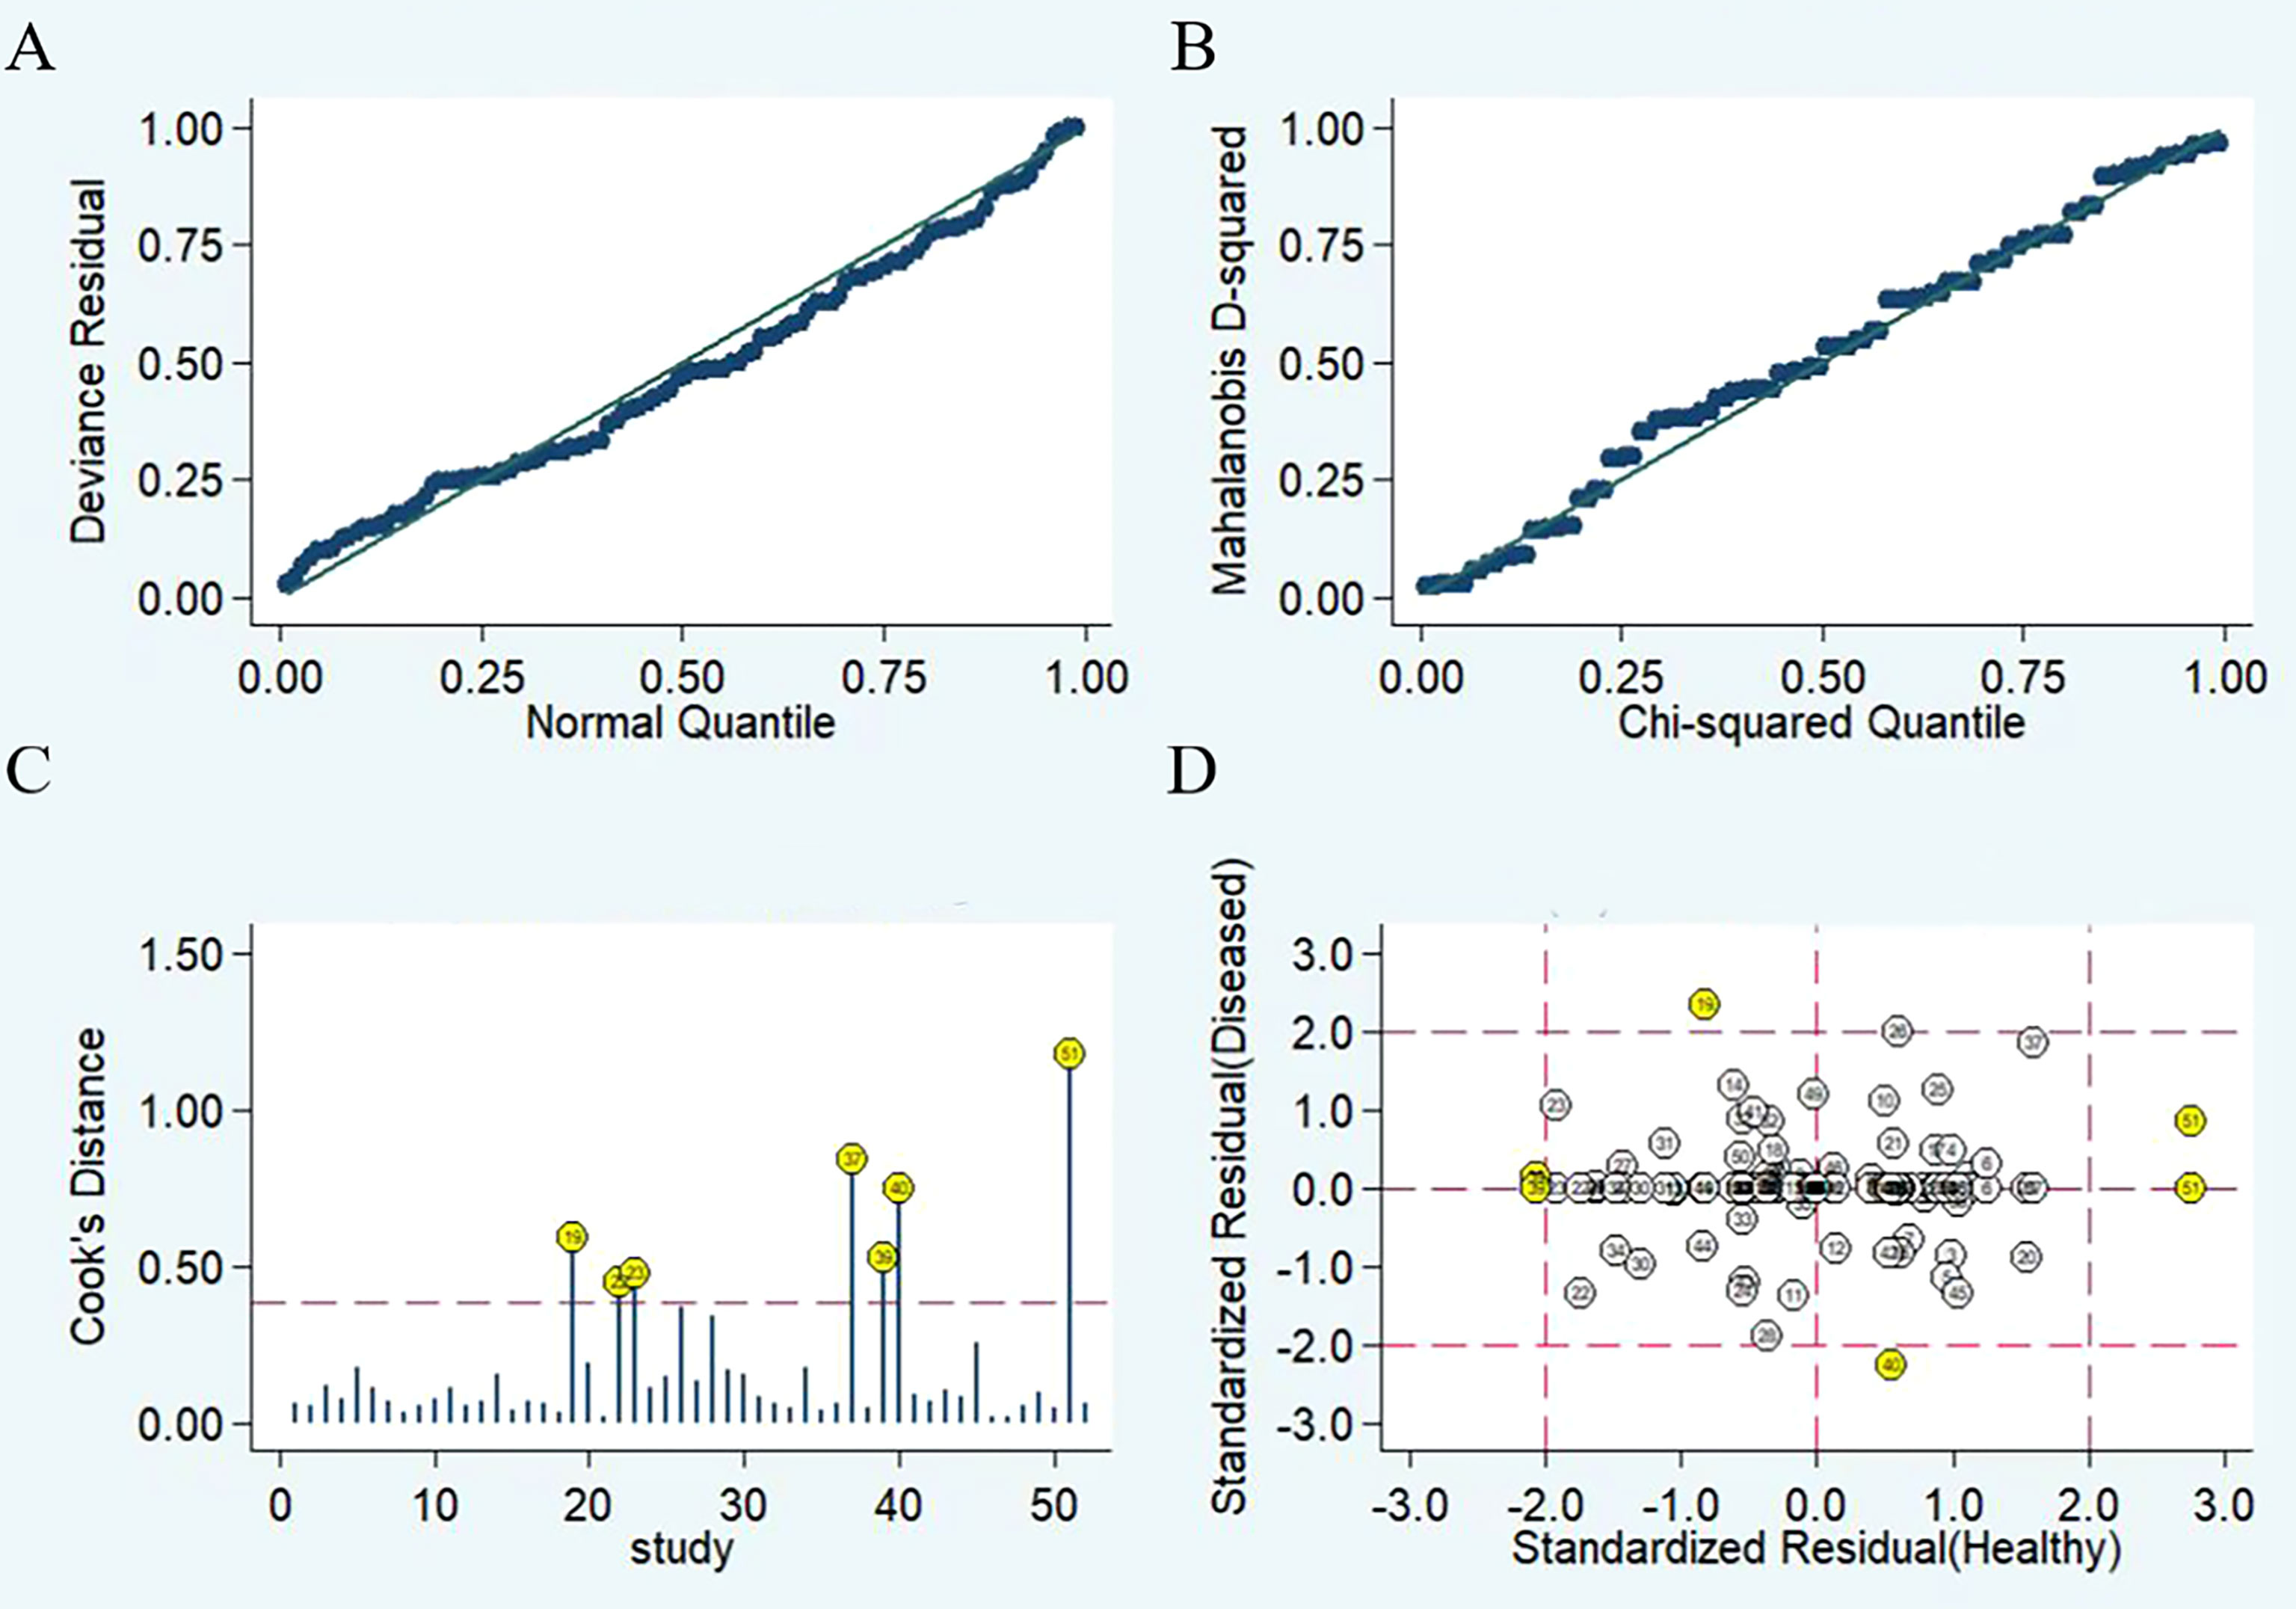
Figure 6 Diagram of sensitivity analysis showing (A) goodness-of-fit; (B) bivariate normality; (C) influence analysis; (D) outlier detection.
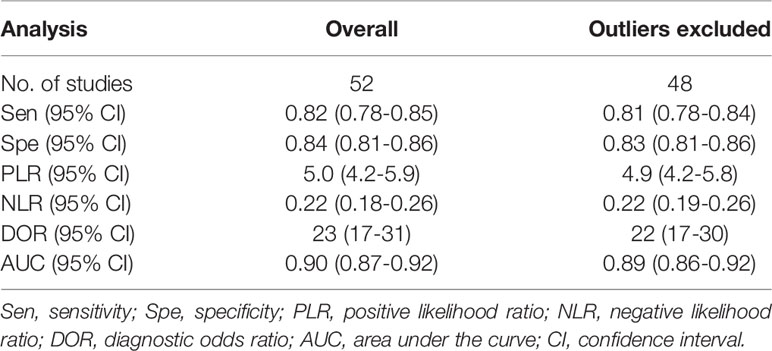
Table 3 Diagnostic performance of miRNAs in DR.
We performed meta-regression analysis with ethnicity, miRNA profiling, sample source, sample size, miRNA expression, internal reference and cut-off values as independent variables to explore the sources of heterogeneity. The results are shown in Figure 7. For sensitivity and specificity, all seven independent variables were statistically significant, indicating that ethnicity, miRNA profiling, sample source, sample size, miRNA expression, internal reference and cut-off values were sources of heterogeneity.
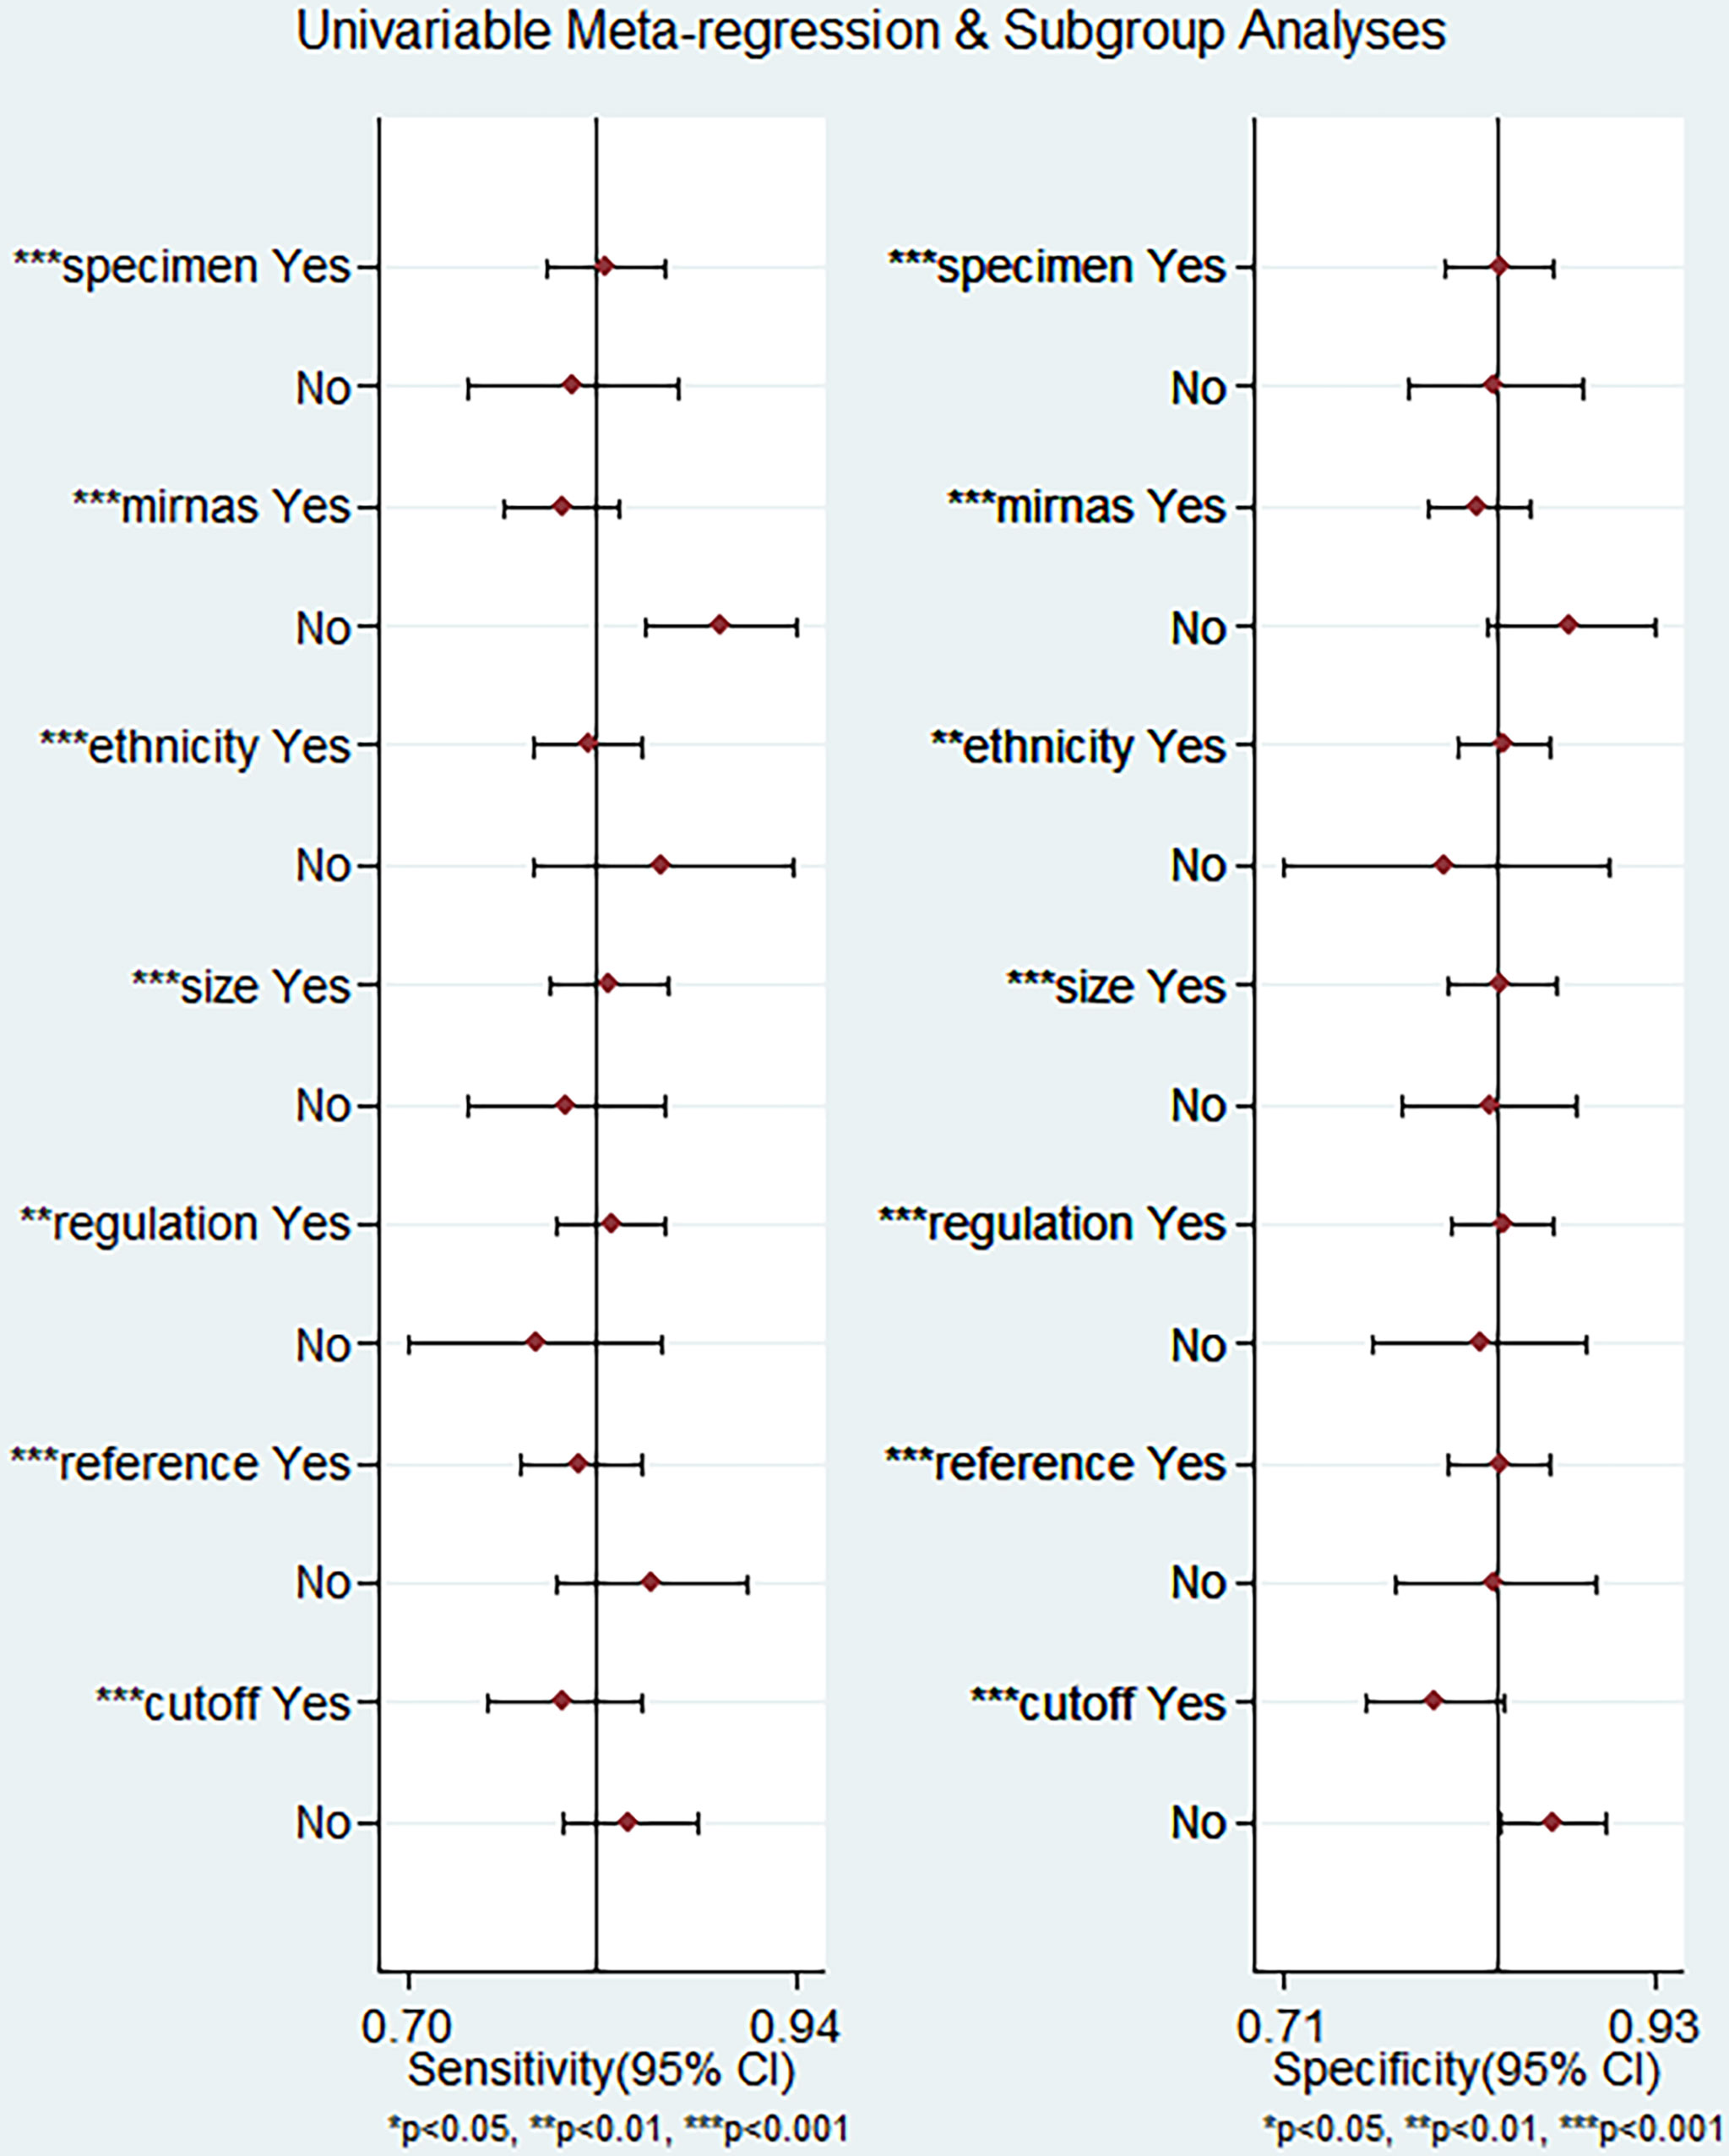
Figure 7 Meta-regression analysis for examining sensitivity and specificity of miRNAs for the diagnosis of diabetic retinopathy.
Publication Bias
Deek’s funnel plot was plotted for the 25 included papers (Figure 8). The studies were relatively symmetrically distributed on both sides of the regression line with P=0.41, and the differences were not statistically significant, indicating that there was no publication bias in the included data.

Figure 8 Funnel plot for determining publication bias.
Discussion
This meta-analysis of 25 articles including 1987 patients with DR and 1771 non-DR controls showed that miRNAs demonstrate high sensitivity (0.82, 95% CI: 0.78-0.85) and specificity (0.84, 95% CI: 0.81-0.86) in the diagnosis of DR. The pooled PLR of 5.0 indicates a 5.0-fold increase in the probability of an individual being diagnosed with DR. In addition, the NLR was 0.22, implying that the probability of subjects being diagnosed with DR was only 22%. DOR is an indicator of discriminatory test performance (47), and a DOR value greater than 1 indicates a better diagnostic test, with a DOR of 23, representing the ability of the miRNA to effectively discriminate between DR patients and non-DR control populations. However, due to heterogeneity among the included studies, we explored confounding factors by subgroup analysis and meta-regression analysis. Subgroup analysis revealed miRNA profiling, sample size, sample source, miRNA expression, ethnicity, internal reference and cut-off values setting as sources of heterogeneity.The combined detection of pooled miRNAs demonstrated better diagnostic accuracy than single miRNAs, with an AUC value of 0.94 for the miRNA group and 0.88 for single miRNAs. These results are consistent with previous findings by Zhou et al. on differential expression of miRNA in patients with DR (48), which may be explained by multiple gene mutations and epigenetic genetic abnormalities that are involved in the development of DR (49). Therefore, miRNA panel may be more suitable as a diagnostic biomarker for DR, which is the future development trend. One subgroup analysis that requires specific consideration showed that the sensitivity of miRNAs for diagnosis was higher in the non-Asian population (0.86) than in the Asian population (0.81). However, data from only six studies were available for the non-Asian group compared with 46 studies for the Asian group. Hence, we suggest that this difference may be attributed to the smaller number of studies performed with non-Asian populations. In addition, we found that the AUC values of miRNAs in serum, plasma, and aqueous humor were 0.90, 0.90, and 0.77, respectively, indicating that the detection of miRNAs in serum and plasma samples has high accuracy. Since the studies we included all used qRT-PCR to detect miRNAs levels, it was necessary to select appropriate internal reference genes for standardization, and we were surprised to find that although most studies used U6 as an internal reference gene, miRNAs showed higher diagnostic power with the analysis of other materials referred to as non-U6 references. qRT-PCR is the most widely used method for circulating miRNA expression profiling, and the accurate and reliable interpretation of its results depends heavily on the use of suitable reference genes for normalization, but the selection of suitable internal reference genes is still controversial (50), and the future selection of uniform and highly stable internal reference is essential to eliminate or minimize abiotic variation between test samples. Furthermore, in terms of clinical applicability, Fagan′s nomogram demonstrate promising results, with post-test probabilities of 0.56 and 0.5 for PLR and NLR, respectively, when the pre-test probability was set at 20%. This finding indicated that when the samples tested positive for the presence of miRNAs, patients had a 56% probability of developing DR, while the post-test probability of disease was reduced to 5% when the samples were tested negative for miRNAs. Among these studies, the expression of circulating miRNA-21 was reported to be upregulated in five articles. The sensitivity of miR-21 alone for the diagnosis of DR ranged from 0.661 to 0.818, and the specificity ranged from 0.867 to 0.908. Four studies analyzed miRNA-21 alone, and our meta-analysis of the diagnostic efficacy of miRNA-21 showed sensitivity, specificity, PLR, NLR, DOR, and AUC values of 0.70, 0.90, 6.9, 0.33, 21, and 0.89, respectively. Chen et al. demonstrated the protective effect of miR-21 silencing on neovascularization and inflammation in DR through a “knockdown” experiment (51). miR-21 may be an important regulator of reactive oxygen species homeostasis and antioxidant pathways, interfering with superoxide dismutase 2 expression and thereby affecting the antioxidant response system, which is one of the major causes of cellular damage (52, 53). Therefore, miRNA-21 is considered an early predictor of reactive oxygen species-mediated injury in individuals at high risk for diabetes and has the potential to be an excellent marker for the diagnosis of DR.
These are several strengths of this meta-analysis. This is the first meta-analysis to perform a detailed assessment of the diagnostic value of miRNAs in DR. A more comprehensive list of miRNAs was analyzed in this study. The study also delineated miRNA subtypes that require further examination. Secondly, subgroup analysis and meta-regression analysis were performed to explore the heterogeneity of the studies included based on the high degree of heterogeneity.
Some limitations of this meta-analysis should be highlighted. First, the cutoff values of miRNAs in the included studies differed, which could lead to heterogeneity. Second, we did not assess differences in the accuracy of miRNA detection at different stages of DR for the diagnosis of DR due to a lack of sufficient data. Third, most of the included studies were based on Asian populations, which may contribute to ethnic bias. Fourth, this meta-analysis only included articles published in English and Chinese, which may also contribute to unavoidable bias. Fifth, most studies are retrospective case-control studies, increasing the risk of bias in the quality assessment of patient selection domains, in addition to the fact that there is no consensus on the selection of uniform and stable internal reference genes, which may lead to inconsistent results in the relative quantitative analysis of miRNAs. In addition, the relatively small sample size of each study may have limited the statistical power. Regrettably, due to the lack of a large number of similar miRNAs to pool the results, it is not yet possible to identify specific single miRNA or miRNAs panel as the best diagnostic biomarkers for DR. Therefore, based on the above limitations, these findings need to be interpreted with caution, and the results of our meta-analysis need to be further confirmed by well-designed studies with larger sample sizes in the future.
In conclusion, the current evidence suggests that miRNAs have significant diagnostic value in predicting DR and may be employed as effective non-invasive biomarkers for DR. Furthermore, miRNA panels have higher diagnostic potency than individual miRNAs. However, quality studies with large samples sizes should be conducted to validate our results and confirm the clinical value of miRNAs for patients with DR.
Data Availability Statement
The original contributions presented in the study are included in the article/Supplementary Material. Further inquiries can be directed to the corresponding author.
Author Contributions
LM and YW wrote the manuscript, responsible for literature retrieval and statistical analysis, ZL participate in editing manuscripts, and QW participate in discussion and review manuscripts. All authors read and approved the final version of the manuscript.
Funding
This project was supported by the major project of Chinese Medical Association Fund (No.TW-2018P003).
Conflict of Interest
The authors declare that the research was conducted in the absence of any commercial or financial relationships that could be construed as a potential conflict of interest.
Publisher’s Note
All claims expressed in this article are solely those of the authors and do not necessarily represent those of their affiliated organizations, or those of the publisher, the editors and the reviewers. Any product that may be evaluated in this article, or claim that may be made by its manufacturer, is not guaranteed or endorsed by the publisher.
Acknowledgments
The authors thank all those who collaborated in the analysis, interpretation of data and writing the article.
Supplementary Material
The Supplementary Material for this article can be found online at: https://www.frontiersin.org/articles/10.3389/fendo.2022.929924/full#supplementary-material
References
1. Nebbioso M, Lambiase A, Armentano M, Tucciarone G, Sacchetti M, Greco A, et al. Diabetic Retinopathy, Oxidative Stress, and Sirtuins: An in Depth Look in Enzymatic Patterns and New Therapeutic Horizons. Surv Ophthalmol (2022) 67(1):168–83. doi: 10.1016/j.survophthal.2021.04.003
2. Stitt AW, Curtis TM, Chen M, Medina RJ, McKay GJ, Jenkins A, et al. The Progress in Understanding and Treatment of Diabetic Retinopathy. Prog Retinal Eye Res (2016) 51:156–86. doi: 10.1016/j.preteyeres.2015.08.001
3. Teo ZL, Tham YC, Yu M, Chee ML, Rim TH, Cheung N, et al. Global Prevalence of Diabetic Retinopathy and Projection of Burden Through 2045: Systematic Review and Meta-Analysis. Ophthalmology (2021) 128(11):1580–91. doi: 10.1016/j.ophtha.2021.04.027
4. Pu S, Xu Y, Li X, Yu Z, Zhang Y, Tong X, et al. Lncrnas-Modulators of Neurovascular Units in Diabetic Retinopathy. Eur J Pharmacol (2022) 925:174937. doi: 10.1016/j.ejphar.2022.174937
5. Lopez-Contreras AK, Martinez-Ruiz MG, Olvera-Montano C, Robles-Rivera RR, Arevalo-Simental DE, Castellanos-Gonzalez JA, et al. Importance of the Use of Oxidative Stress Biomarkers and Inflammatory Profile in Aqueous and Vitreous Humor in Diabetic Retinopathy. Antioxidants-Basel (2020) 9(9):891. doi: 10.3390/antiox9090891
6. Antonetti DA, Silva PS, Stitt AW. Current Understanding of the Molecular and Cellular Pathology of Diabetic Retinopathy. Nat Rev Endocrinol (2021) 17(4):195–206. doi: 10.1038/s41574-020-00451-4
7. Mustafi D, Saraf SS, Shang Q, Olmos de Koo LC. New Developments in Angiography for the Diagnosis and Management of Diabetic Retinopathy. Diabetes Res Clin Pract (2020) 167:108361. doi: 10.1016/j.diabres.2020.108361
8. Schreur V, Larsen MB, Sobrin L, Bhavsar AR, den Hollander AI, Klevering BJ, et al. Imaging Diabetic Retinal Disease: Clinical Imaging Requirements. Acta Ophthalmol (2022). doi: 10.1111/aos.15110
9. Cai S, Liu TYA. The Role of Ultra-Widefield Fundus Imaging and Fluorescein Angiography in Diagnosis and Treatment of Diabetic Retinopathy. Curr Diabetes Rep (2021) 21(9):30. doi: 10.1007/s11892-021-01398-0
10. Pirola L, Balcerczyk A, Okabe J, El-Osta A. Epigenetic Phenomena Linked to Diabetic Complications. Nat Rev Endocrinol (2010) 6(12):665–75. doi: 10.1038/nrendo.2010.188
11. Salem TI, Eldin NB, Alhusseini NF, Abdullah OA, Ahmed NE. Expression Profile of Micrornas May Be Promising in Diagnosis of Proliferative Diabetic Retinopathy: An Egyptian Study. Int J Diabetes Developing Countries (2022). doi: 10.1007/s13410-022-01044-9
12. Zhang J, Cui C, Xu H. Downregulation of Mir-145-5p Elevates Retinal Ganglion Cell Survival to Delay Diabetic Retinopathy Progress by Targeting Fgf5. Biosci Biotechnol Biochem (2019) 83(9):1655–62. doi: 10.1080/09168451.2019.1630251
13. Greco M, Chiefari E, Accattato F, Corigliano DM, Arcidiacono B, Mirabelli M, et al. Microrna-1281 as a Novel Circulating Biomarker in Patients With Diabetic Retinopathy. Front Endocrinol (2020) 11:528. doi: 10.3389/fendo.2020.00528
14. Ye Z, Li ZH, He SZ. Mirna-1273g-3p Involvement in Development of Diabetic Retinopathy by Modulating the Autophagy-Lysosome Pathway. Med Sci Monit (2017) 23:5744–51. doi: 10.12659/msm.905336
15. Mori MA, Ludwig RG, Garcia-Martin R, Brandao BB, Kahn CR. Extracellular Mirnas: From Biomarkers to Mediators of Physiology and Disease. Cell Metab (2019) 30(4):656–73. doi: 10.1016/j.cmet.2019.07.011
16. Hill M, Tran N. Mirna Interplay: Mechanisms and Consequences in Cancer. Dis Model Mech (2021) 14(4):dmm047662. doi: 10.1242/dmm.047662
17. Stevens MT, Saunders BM. Targets and Regulation of Microrna-652-3p in Homoeostasis and Disease. J Mol Med (Berl) (2021) 99(6):755–69. doi: 10.1007/s00109-021-02060-8
18. Yu H, Liu H, Chen X, Wu N. Preliminary Study on Serum Microrna Expression Profile in Patients With Diabetic Retinopathy. Chin J Ophthalmol Med (2019) 9(04):246–51. doi: 10.3877/cma.j.issn.2095-2007.2019.04.009
19. Chen X, Rechavi O. Plant and Animal Small Rna Communications Between Cells and Organisms. Nat Rev Mol Cell Biol (2022) 23(3):185–203. doi: 10.1038/s41580-021-00425-y
20. Shaker OG, Abdelaleem OO, Mahmoud RH, Abdelghaffar NK, Ahmed TI, Said OM, et al. Diagnostic and Prognostic Role of Serum Mir-20b, Mir-17-3p, Hotair, and Malat1 in Diabetic Retinopathy. IUBMB Life (2019) 71(3):310–20. doi: 10.1002/iub.1970
21. Xu YX, Pu SD, Li X, Yu ZW, Zhang YT, Tong XW, et al. Exosomal Ncrnas: Novel Therapeutic Target and Biomarker for Diabetic Complications. Pharmacol Res (2022) 178:106135. doi: 10.1016/j.phrs.2022.106135
22. Whiting PF, Rutjes AW, Westwood ME, Mallett S, Deeks JJ, Reitsma JB, et al. Quadas-2: A Revised Tool for the Quality Assessment of Diagnostic Accuracy Studies. Ann Intern Med (2011) 155(8):529–36. doi: 10.7326/0003-4819-155-8-201110180-00009
23. Higgins JP, Thompson SG, Deeks JJ, Altman DG. Measuring Inconsistency in Meta-Analyses. BMJ (2003) 327(7414):557–60. doi: 10.1136/bmj.327.7414.557
24. Jackson D, White IR, Thompson SG. Extending Dersimonian and Laird's Methodology to Perform Multivariate Random Effects Meta-Analyses. Stat Med (2010) 29(12):1282–97. doi: 10.1002/sim.3602
25. Qing S, Yuan S, Yun C, Hui H, Mao P, Wen F, et al. Serum Mirna Biomarkers Serve as a Fingerprint for Proliferative Diabetic Retinopathy. Cell Physiol Biochem Int J Exp Cell Physiol Biochem Pharmacol (2014) 34(5):1733–40. doi: 10.1159/000366374
26. Fu C. Expression of Mir-93 and Mir-21 in Patients With Diabetic Retinopathy and Its Clinical Values. Rec Adv Ophthalmol (2017) 37(12):1161–4. doi: 10.13389/j.cnki.rao.2017.0293
27. Qin LL, An MX, Liu YL, Xu HC, Lu ZQ. Microrna-126: A Promising Novel Biomarker in Peripheral Blood for Diabetic Retinopathy. Int J Ophthalmol (2017) 10(4):530–4. doi: 10.18240/ijo.2017.04.05
28. Jiang Q, Lyu XM, Yuan Y, Wang L. Plasma Mir-21 Expression: An Indicator for the Severity of Type 2 Diabetes With Diabetic Retinopathy. Biosci Rep (2017) 37(2):BSR20160589. doi: 10.1042/BSR20160589
29. Zou HL, Wang Y, Gang Q, Zhang Y, Sun Y. Plasma Level of Mir-93 Is Associated With Higher Risk to Develop Type 2 Diabetic Retinopathy. Graefe's Arch Clin Exp Ophthalmol Albrecht Von Graefes Archiv Fur Klin Und Experimentelle Ophthalmol (2017) 255(6):1159–66. doi: 10.1007/s00417-017-3638-5
30. Sun J, Cai R, Gao Z, Zhou T, Yin W, Hu H, et al. Correlation of Plasma Microrna-21 Expression With Type 2 Diabetes Mellitus With Retinopathy. Guizhou Med J (2018) 42(12):1471–3. doi: CNKI:SUN:GZYI.0.2018-12-033
31. Zheng H, Yu J, Tian N, Wu J. Expression and Significances of Mir-126 and Vegf in Proliferative Diabetic Retinopathy. J Chin Physician (2018) 20(10):1477–81. doi: 10.3760/cma.j.issn.1008-1372.2018.10.010
32. Liang Z, Gao KP, Wang YX, Liu ZC, Tian L, Yang XZ, et al. Rna Sequencing Identified Specific Circulating Mirna Biomarkers for Early Detection of Diabetes Retinopathy. Am J Physiol Endocrinol Metab (2018) 315(3):E374–e85. doi: 10.1152/ajpendo.00021.2018
33. Dai B, Dai Y. Clinical Value of Serum Mirna in Patients With Diabetic Retinopathy. Rec Adv Ophthalmol (2019) 39(08):780–4. doi: 10.13389/j.cnki.rao.2019.0178
34. Ma Y, Zhou LX, Liu Y, Wu W. Prediction of Retinopathy in Type 2 Diabetes Mellitus by Combined Detection of Microrna93 and Microrna21. Int Eye Sci (2019) 19(9):1550–3. doi: 10.3980/j.issn.1672-5123.2019.9.24
35. Li Z, Dong Y, He C, Pan X, Liu D, Yang J, et al. Rna-Seq Revealed Novel Non-Proliferative Retinopathy Specific Circulating Mirnas in T2dm Patients. Front Genet (2019) 10:531. doi: 10.3389/fgene.2019.00531
36. Ji HH, Yi QY, Chen LS, Wong LP, Liu YF, Xu GD, et al. Circulating Mir-3197 and Mir-2116-5p as Novel Biomarkers for Diabetic Retinopathy. Clin Chim Acta (2019) 501:147–53. doi: 10.1016/j.cca.2019.10.036
37. Lin Y, Li Q, Lin X. Expression and Clinical Significances of Mir-15 and Mir-29a in Serum of Patients With Diabetic Retinopathy. J Chin Physician (2020) 22(03):399–403. doi: 10.3760/cma.j.cn.431274-20181220-02388
38. Liu L, Wu B, Ni L, Zhang L, Hu X, Wang Z, et al. Changes of Mir-15a,Mir-16 and Mir-20b in Patients With Type 2 Diabetes Mellitus and Their Relationship With Diabetic Retinopathy. Chin J Gen Pract (2020) 18(06):954–8. doi: 10.16766/j.cnki.issn.1674-4152.001401
39. Yin C, Lin X, Sun Y, Ji X. Dysregulation of Mir-210 Is Involved in the Development of Diabetic Retinopathy and Serves a Regulatory Role in Retinal Vascular Endothelial Cell Proliferation. Eur J Med Res (2020) 25(1):20. doi: 10.1186/s40001-020-00416-3
40. Wan Q, Lei J, Ma T. Risk Factors of Depression and Anxiety and Nursing Intervention in Diabetics During Perioperative Period. Acta Med Mediterr (2020) 36(5):3221–7. doi: 10.19193/0393-6384_2020_5_496
41. Hu Q, Luan L, Liu Z. The Relationship Between Serum Mir-29c, Bfgf Levels and Diabetic Retinopathy. Chin J Atheroscl (2021) 29(12):1053–8. doi: 10.3969/j.issn.1007-3949.2021.12.008
42. Liu Q, Wang S, Ding L, Qin Y, Maidina N. Diagnostic Value of Serum Mir-211 in Diabetic Retinopathy and Its Influencing Factors. Chin J Clin Lab Sci (2021) 39(06):445–8. doi: 10.13602/j.cnki.jcls.2021.06.10
43. Sun Z, Yang J. Correlation Between the Expression of Serum Mir⁃320 and Diabetic Retinopathy in Type 2 Diabetic Patients. Chin J Diabetes (2021) 29(05):344–8. doi: 10.3969/j.issn.10066187.2021.05.005
44. Santovito D, Toto L, De Nardis V, Marcantonio P, D'Aloisio R, Mastropasqua A, et al. Plasma Microrna Signature Associated With Retinopathy in Patients With Type 2 Diabetes. Sci Rep (2021) 11(1):4136. doi: 10.1038/s41598-021-83047-w
45. Wang Z, Zhang X, Wang Y, Xiao D. Dysregulation of Mir-374a Is Involved in the Progression of Diabetic Retinopathy and Regulates the Proliferation and Migration of Retinal Microvascular Endothelial Cells. Clin Exp Optometry (2021) 105:1–6. doi: 10.1080/08164622.2021.1913043
46. Liu X, Zhou Y, Liu Y, Wang Q, Pan L. Microrna-425-5p Is Involved in the Development of Diabetic Retinopathy and Regulates the Proliferation and Migration of Retinal Microvascular Endothelial Cells. Ophthalmic Res (2022) 65(1):60–7. doi: 10.1159/000516906
47. Glas AS, Lijmer JG, Prins MH, Bonsel GJ, Bossuyt PM. The Diagnostic Odds Ratio: A Single Indicator of Test Performance. J Clin Epidemiol (2003) 56(11):1129–35. doi: 10.1016/s0895-4356(03)00177-x
48. Zhou H, Peng C, Huang DS, Liu L, Guan P. Microrna Expression Profiling Based on Microarray Approach in Human Diabetic Retinopathy: A Systematic Review and Meta-Analysis. DNA Cell Biol (2020) 39(3):441–50. doi: 10.1089/dna.2019.4942
49. Stavast CJ, Erkeland SJ. The Non-Canonical Aspects of Micrornas: Many Roads to Gene Regulation. Cells (2019) 8(11):1465. doi: 10.3390/cells8111465
50. Donati S, Ciuffi S, Brandi ML. Human Circulating Mirnas Real-Time Qrt-Pcr-Based Analysis: An Overview of Endogenous Reference Genes Used for Data Normalization. Int J Mol Sci (2019) 20(18):4353. doi: 10.3390/ijms20184353
51. Chen Q, Qiu F, Zhou K, Matlock HG, Takahashi Y, Rajala RVS, et al. Pathogenic Role of Microrna-21 in Diabetic Retinopathy Through Downregulation of Pparalpha. Diabetes (2017) 66(6):1671–82. doi: 10.2337/db16-1246
52. La Sala L, Cattaneo M, De Nigris V, Pujadas G, Testa R, Bonfigli AR, et al. Oscillating Glucose Induces Microrna-185 and Impairs an Efficient Antioxidant Response in Human Endothelial Cells. Cardiovasc Diabetol (2016) 15:71. doi: 10.1186/s12933-016-0390-9
53. La Sala L, Mrakic-Sposta S, Tagliabue E, Prattichizzo F, Micheloni S, Sangalli E, et al. Circulating Mirorna-21 Is an Early Predictor of Ros-Mediated Damage in Subjects With High Risk of Developing Diabetes and in Drug-Naive T2d. Cardiovasc Diabetol (2019) 18(1):18. doi: 10.1186/s12933-019-0824-2
Keywords: miRNA, diabetic retinopathy, diagnosis, biomarkers, meta-analysis
Citation: Ma L, Wen Y, Li Z, Wu N and Wang Q (2022) Circulating MicroRNAs as Potential Diagnostic Biomarkers for Diabetic Retinopathy: A Meta-Analysis. Front. Endocrinol. 13:929924. doi: 10.3389/fendo.2022.929924
Received: 27 April 2022; Accepted: 13 June 2022;
Published: 08 July 2022.
Edited by:
Pranav Kumar Prabhakar, Lovely Professional University, IndiaReviewed by:
Pranay Pankaj, Jaipur National University, IndiaYao Jiang, The Affiliated Hospital of Southwest Medical University, China
Copyright © 2022 Ma, Wen, Li, Wu and Wang. This is an open-access article distributed under the terms of the Creative Commons Attribution License (CC BY). The use, distribution or reproduction in other forums is permitted, provided the original author(s) and the copyright owner(s) are credited and that the original publication in this journal is cited, in accordance with accepted academic practice. No use, distribution or reproduction is permitted which does not comply with these terms.
*Correspondence: Qing Wang, wang_qing@jlu.edu.cn