 Ming Zhang
 Zhihui Li2
 Hanqi Wang
 Tongtong Chen
 Yong Lu
 Fuhua Yan
 Yuyao Zhang
 Hongjiang Wei
- 1School of Biomedical Engineering, Shanghai Jiao Tong University, Shanghai, China
- 2Department of Radiology, Ruijin Hospital, School of Medicine, Shanghai Jiao Tong University, Shanghai, China
- 3School of Information and Science and Technology, ShanghaiTech University, Shanghai, China
Background: It is of great clinical importance to assess the microstructure of the articular cartilage and cortical bone of the human knee joint. While quantitative susceptibility mapping (QSM) is a promising tool for investigating the knee joint, however, previous QSM studies using conventional gradient recalled echo sequences or ultrashort echo time (UTE) sequences only focused on mapping the magnetic susceptibility of the articular cartilage or cortical bone, respectively. Simultaneously mapping the underlying susceptibilities of the articular cartilage and cortical bone of human in vivo has not been explored and reported.
Method: Three-dimensional multi-echo radial UTE sequences with the shortest TE of 0.07 msec and computed tomography (CT) were performed on the bilateral knee joints of five healthy volunteers for this prospective study. UTE-QSM was reconstructed from the local field map after water-fat separation and background field removal. Spearman’s correlation analysis was used to explore the relationship between the magnetic susceptibility and CT values in 158 representative regions of interest of cortical bone.
Result: The susceptibility properties of the articular cartilage and cortical bone were successfully quantified by UTE-QSM. The laminar structure of articular cartilage was characterized by the difference of susceptibility value in each layer. Susceptibility was mostly diamagnetic in cortical bone. A significant negative correlation (r=−0.43, p<0.001) between the susceptibility value and CT value in cortical bone was observed.
Conclusion: UTE-QSM enables simultaneous susceptibility mapping of the articular cartilage and cortical bone of human in vivo. Good association between susceptibility and CT values in cortical bone suggests the potential of UTE-QSM for bone mapping for further clinical application.
Introduction
Cartilage and bone, providing stiffness and strength, are two fundamental knee joint structures. Articular cartilage degradation is regarded as a typical feature involved in the development of osteoarthritis (OA) (1). Bone tissues consist of two types, cortical bone and cancellous bone. Cortical bone plays a key role in the mechanical competence of bone, which occupies approximately 80% of the total bone mass (2) and accounts for 80% of all sites where bone fractures occur (3, 4). Therefore, a useful tool to noninvasively investigate the microstructure of the articular cartilage and cortical bone is of great importance for clinical evaluation.
Computed tomography (CT) has been widely used in clinical practice for bone mapping. However, CT involves ionizing radiation and exhibits poor contrast for soft tissue structures, e.g., the cartilage. Magnetic resonance imaging (MRI) can overcome the disadvantages of the X-ray-based technique and offers superior image contrast in soft tissues. However, there are signal voids in regions (e.g., the cortical bone) (5) with rapid signal decay (0.1~1 msec) (6) on MRI images using conventional sequences with echo time (TE) of a few msec or longer. The MRI-based ultrashort echo time (UTE) sequences, which collect signals immediately after pulse excitation resulting in a very short TE (typically less than 0.1 msec), provide the feasibility for direct cortical bone imaging (7–9).
Quantitative susceptibility mapping (QSM) is a post-processing MRI technique that quantitatively estimates the underlying magnetic susceptibilities of tissues, typically using gradient recalled echo (GRE) sequences (10, 11). Since magnetic susceptibility is an intrinsic physical property of tissue, this unique contrast mechanism has made QSM a promising tool for tissue quantification and disease detection, such as for early brain development (12), brain aging (13, 14) and diseased brain (15, 16). Recently, researchers have applied QSM in the musculoskeletal system (17–20). However, studies using GRE sequences (GRE-QSM) failed in mapping the susceptibility of cortical bone due to signal void and low signal-to-noise ratio (SNR) at a typical TE longer than one msec. Therefore, the cortical bone regions were usually masked out for QSM processing due to unreliable susceptibility values measured from the local field map (17). Luckily, benefiting from the ability of the UTE sequence for detecting rapidly decayed signals, UTE-based QSM (UTE-QSM) could be capable of quantifying the susceptibility property of cortical bone. However, related studies mainly focused on imaging the cortical bone and didn’t quantify soft tissue susceptibility. UTE-QSM has not been applied to explore the articular cartilage of human in vivo (21, 22). Simultaneous susceptibility mapping of the articular cartilage and cortical bone with a single MRI scan is still lacking and highly needed.
In this study, we aimed to simultaneously quantify the magnetic susceptibilities of the articular cartilage and cortical bone of the human knee joint using UTE-QSM. To explore the clinical potentials of UTE-QSM, the relationship between the susceptibility and CT values in cortical bone was also assessed.
Materials and Methods
Subjects
This study was approved by the Human Ethics Committee of Shanghai Jiao Tong University. Five healthy young volunteers (4 males, mean age of 23.6 years old) were included in this study with both MRI and low dose CT examinations on bilateral knee joints. No history of knee injury from the participants was reported. All participants were informed of the experiment protocol and informed consent was provided from each subject. The time interval between MRI and CT examinations was within a month.
CT Examination
The low dose CT scan (volume CT dose: 6.74 mGy, dose length product: 132.8 mGy*cm) for each participant was performed using a clinical CT scanner (SOMATOM Definition AS, Siemens Healthcare, Erlangen, Germany). The scanning parameters were: X-ray tube voltage of 120 kV, tube current of 100 mA; slice thickness of 0.7 mm, 252 slices; matrix size of 512×512, spatial resolution of 0.85×0.85 mm2.
MRI Examination
Each subject has their right and left knee joints scanned on a 3 Tesla MRI scanner (uMR 790, United Image Healthcare, Shanghai, China). For the three-dimensional UTE sequence, a non-selective hard pulse was used to excite the whole knee joint. The free induced decay (FID) signal (i.e., ultrashort TE signal) and gradient recalled echoes (i.e., normal TE signals) were collected in the center-out and center-in radial trajectories, respectively (23). Two continuous UTE sessions, each with one ultrashort TE and two normal TEs, were taken for imaging each limb of the participants without repositioning, resulting in 6 TEs in total. TEs of the first UTE scan, 0.07/2.24/3.55 msec; TEs of the second UTE scan, 0.1/2.8/4.6 msec. Other parameters for UTE were: axial view; repetition time, 10 msec; flip angle, 8°; field of view (FOV), 180×160×144 mm3; image matrix, 208×184×160; spatial resolution, 0.9×0.9×0.9 mm3; spoke number, 40960; scan time, 7 min 6 sec per scan.
UTE Processing
The UTE raw data from the MRI scanner was sent to a high-performance workstation for processing. The density function was calculated to compensate for the measured signals due to the nonuniform radial sampling pattern (24). Nonuniform fast Fourier transform was applied for gridding to interpolate the data from radial spokes into Cartesian grids (25). Each channel of the UTE image was combined to generate four-dimensional complex-valued data. Subsequently, image registration was performed on the magnitude images to reduce the possible error induced by slight inter-scan motion during two separate UTE scans. The FMRIB’s Linear Image Registration Tool (26, 27) with 6 degrees of freedom and a maximum rotation angle of 10° was used for registration. The transformation matrices were automatically saved and applied to the real and imaginary parts of UTE data to bring two separate UTE complex-valued images into an identical space.
UTE-QSM Reconstruction
The water-fat separation method was applied to UTE images to eliminate the chemical shift effect due to the presence of fat in the knee joint, which could further hamper the susceptibility quantification due to the inaccurate field map estimation (28). The B0 field map was derived during this procedure using the graph cut-based water-fat separation algorithm (29) with the conventional six fat peaks model on a slice-by-slice basis.
A binary mask was generated by thresholding the sum-of-squares of the UTE magnitude image (15% of the maximum intensity) to exclude the background. The V-SHARP (variable-kernel sophisticated harmonic artifact reduction for phase data) algorithm (30) was used to recover the local field map from the total field map. The susceptibility map was quantitatively reconstructed using STAR-QSM (streaking artifact reduction for QSM) (31).
To compare with UTE-QSM, QSM from normal TEs (normal TE-QSM) was also calculated without the use of 2 ultrashort TEs following the same pipeline for QSM reconstruction.
The magnetic susceptibility value was not referenced to any areas in this study. The magnetic susceptibility value was reported in parts per million (ppm).
CT Processing
For the CT image, the left and right knee joints were separated by dividing the whole CT image into two parts for following usages. The CT value was reported in Hounsfield units (HU). The background signal of the CT image was set to zero.
Regions of Interest (ROIs) of Cortical Bone
The multi-modal registration between UTE and CT images was achieved using Advanced Normalization Tools (32) with the rigid plus affine transformation, plus symmetric image normalization manner. The sum-of-squares of the UTE magnitude image served as the reference.
The ROIs of cortical bone were extracted from the UTE magnitude images on 12~26 consecutive slices of each limb using threshold binarization since there was a relatively low signal intensity in cortical bone. The ROIs were placed both on UTE magnitude images and corresponding aligned CT images to visually check the isolation accuracy using the open-source ITK-SNAP software (33). A total of 158 ROIs were obtained. The mean magnetic susceptibility and CT values were calculated for each ROI. Detailed values could be found in the Supplementary Materials.
Statistical Analysis
Spearman’s correlation coefficient (r) was used to investigate the relationship between the mean susceptibility value and CT value in cortical bone using data from 158 ROIs. The threshold of p-value for statistical significance was set as 0.05. The correlation analysis was conducted using MATLAB (version 2019b, MathWorks, Natick, MA) with the “corr” function.
Results
Figure 1 illustrates the segmented ROIs of cortical bone overlaid on their corresponding UTE magnitude images and warped CT images. The ROIs could finely match the anatomical structures of cortical bone, both on UTE and CT images.
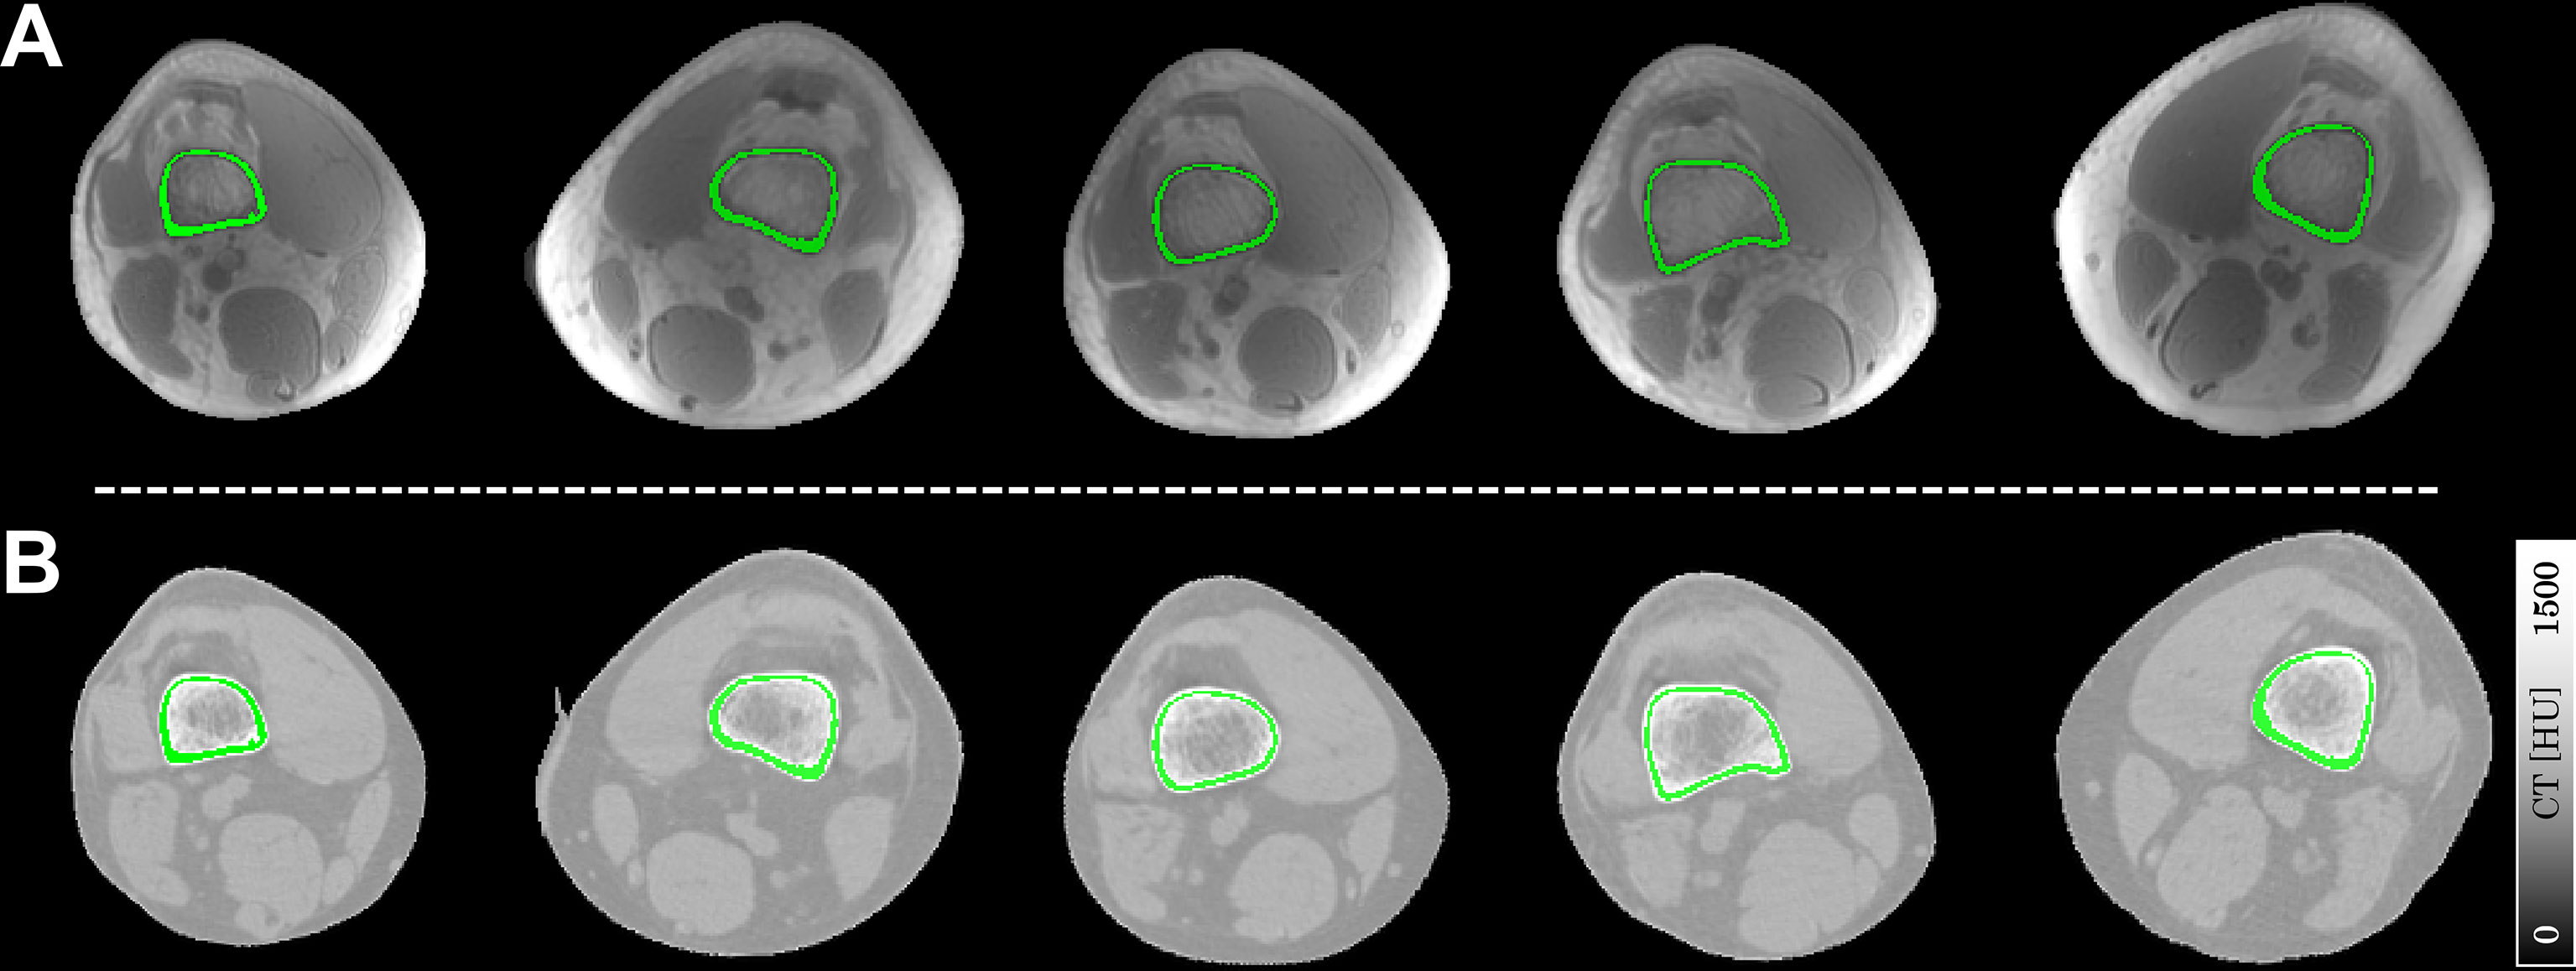
Figure 1 Representative slices of ROIs of cortical bone (in green) overlaid on the UTE magnitude images (A) and registered CT images (B). Each column represents a typical ROI from an individual subject in this study.
Figure 2 shows the representative slices of UTE-QSM in articular cartilage and cortical bone in the sagittal and axial views of two subjects. Gradual magnetic susceptibility change from diamagnetic to paramagnetic was visible from the deep layer (near the subchondral bone) to the superficial layer of the articular cartilage. There was a clear susceptibility difference between the deep layer of articular cartilage (light blue, less diamagnetic) and the subchondral bone (dark blue, more diamagnetic), although the deep layer of articular cartilage was relatively thin (1~2 pixels) on UTE-QSM. UTE-QSM was generally diamagnetic in cortical bone.
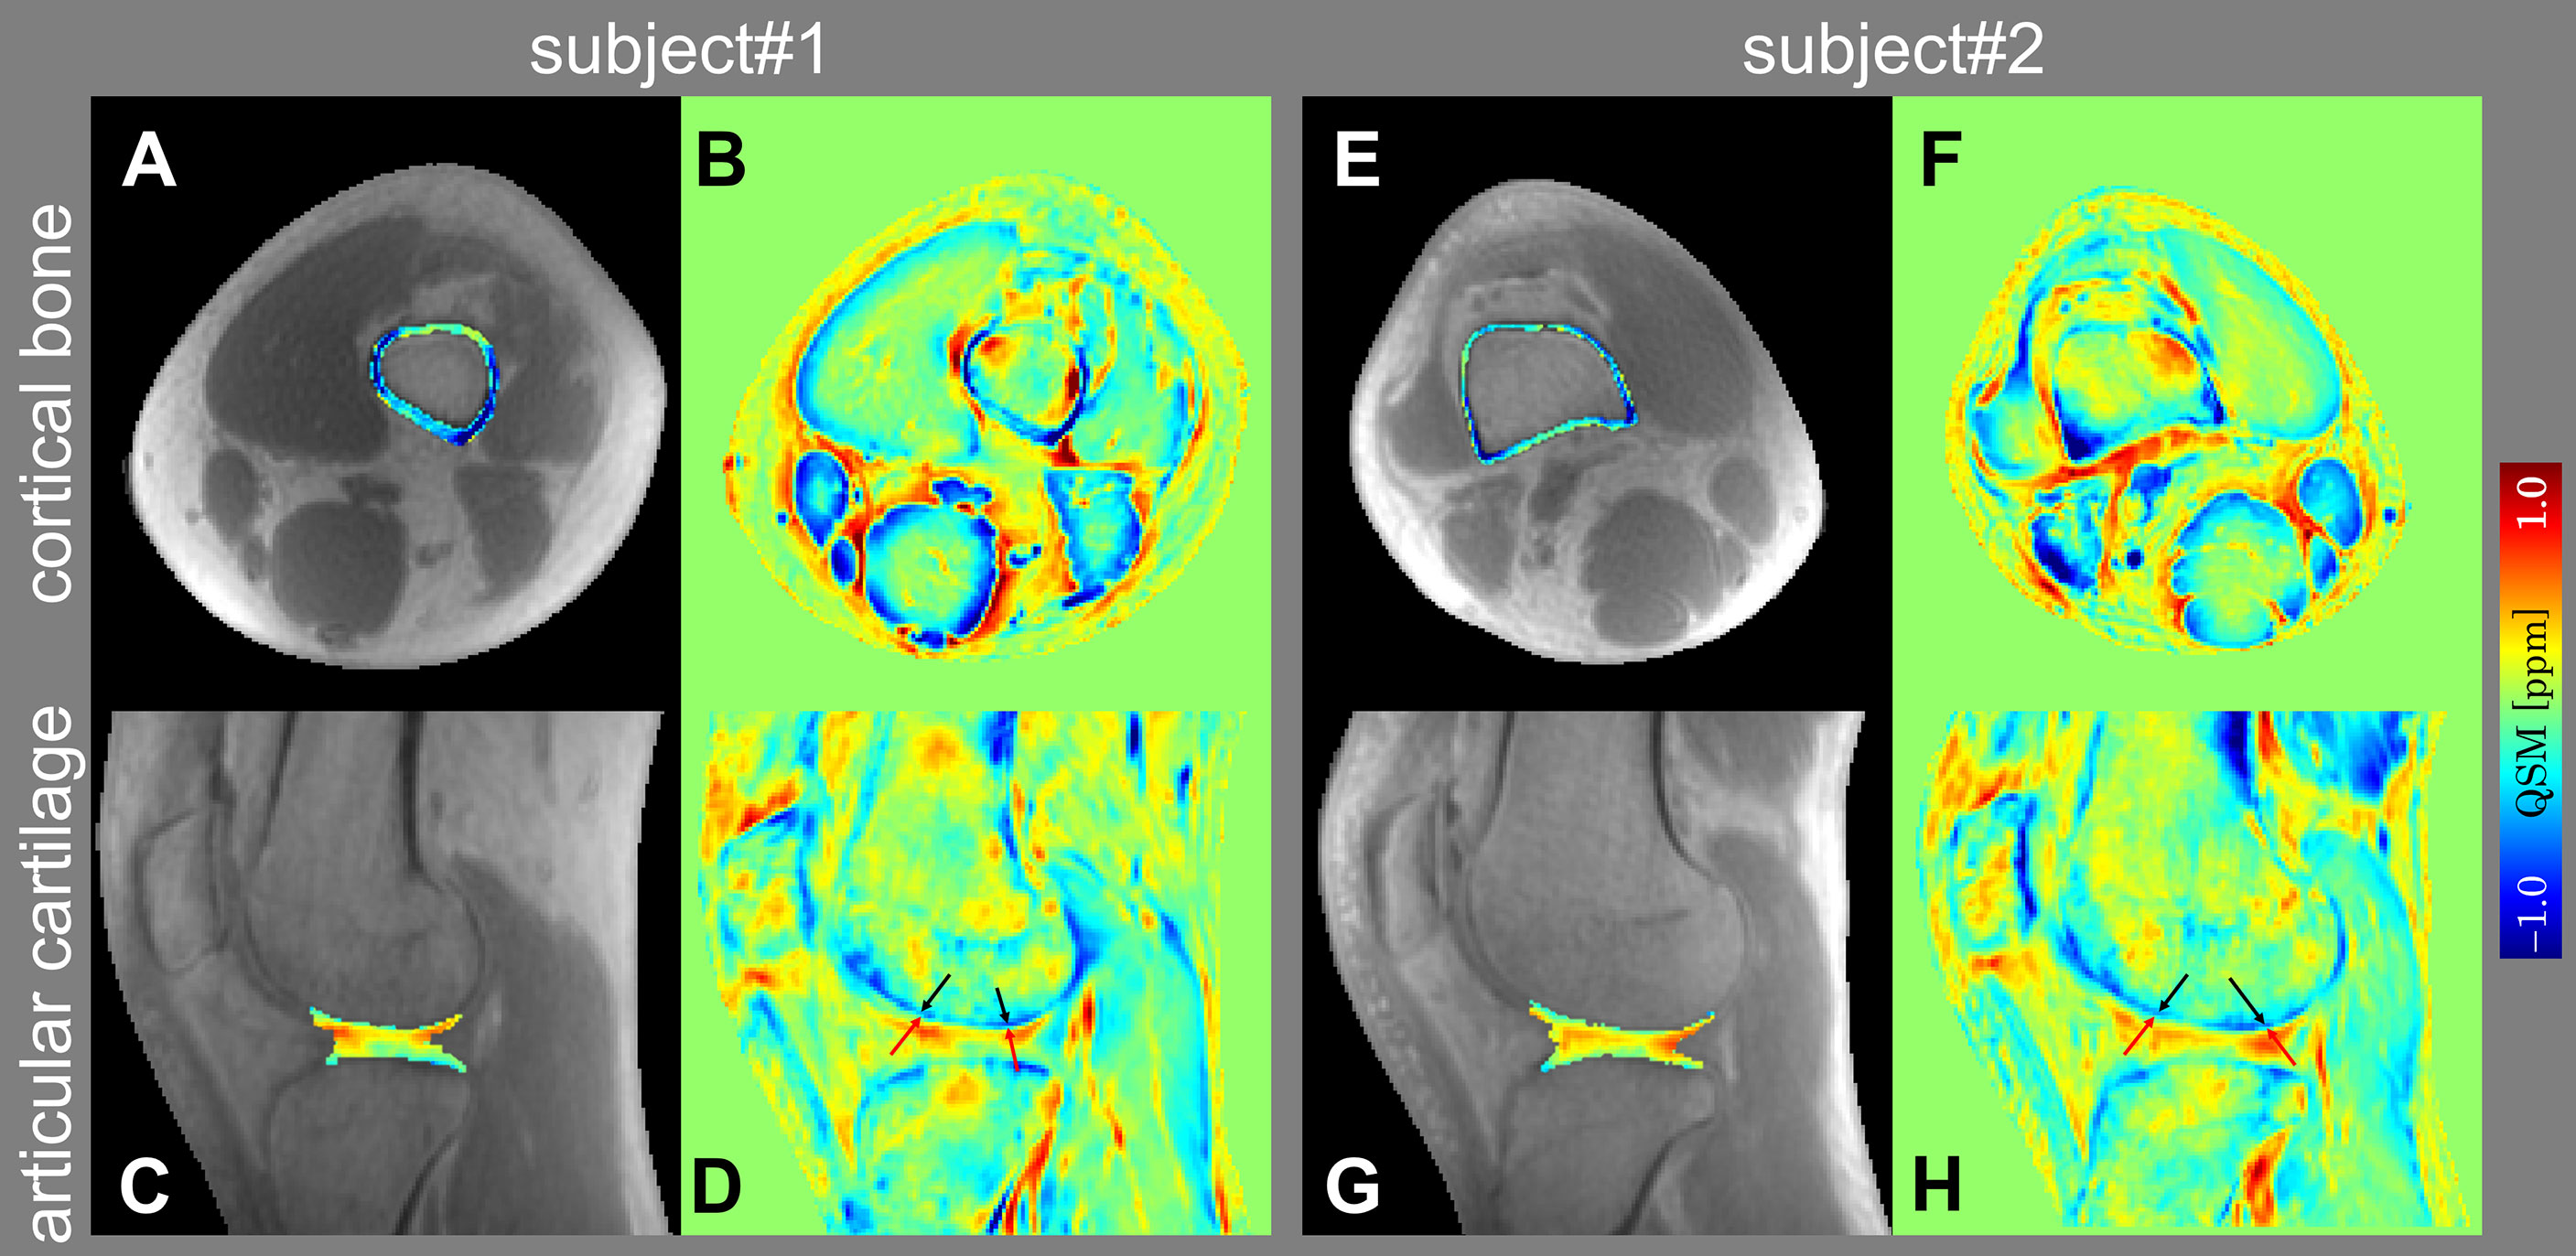
Figure 2 Representative slices of UTE-QSM in cortical bone (A, E) and articular cartilage (C, G) overlaid on the UTE magnitude images in axial and sagittal views of two subjects. (B, F) and (D, H) are the color-coded magnetic susceptibility maps within the whole FOV corresponding to (A, E) and (C, G). The black and red arrows in (D, H) point to the subchondral bone and deep layer of articular cartilage, respectively.
Figure 3 compares the reconstructed susceptibility maps from UTE-QSM and normal TE-QSM in cortical bone and articular cartilage. As could be seen, UTE-QSM exhibited an overall more homogeneous diamagnetic susceptibility in cortical bone. In contrast, certain regions exhibit paramagnetic susceptibilities in cortical bone on normal TE-QSM, resulting from inaccurate bone susceptibility quantification due to the uncertain phase measurement using relatively long TE. In articular cartilage, the susceptibility contrasts between UTE-QSM and normal TE-QSM were similar, based on the typical image slices and quantitative susceptibility profiles.
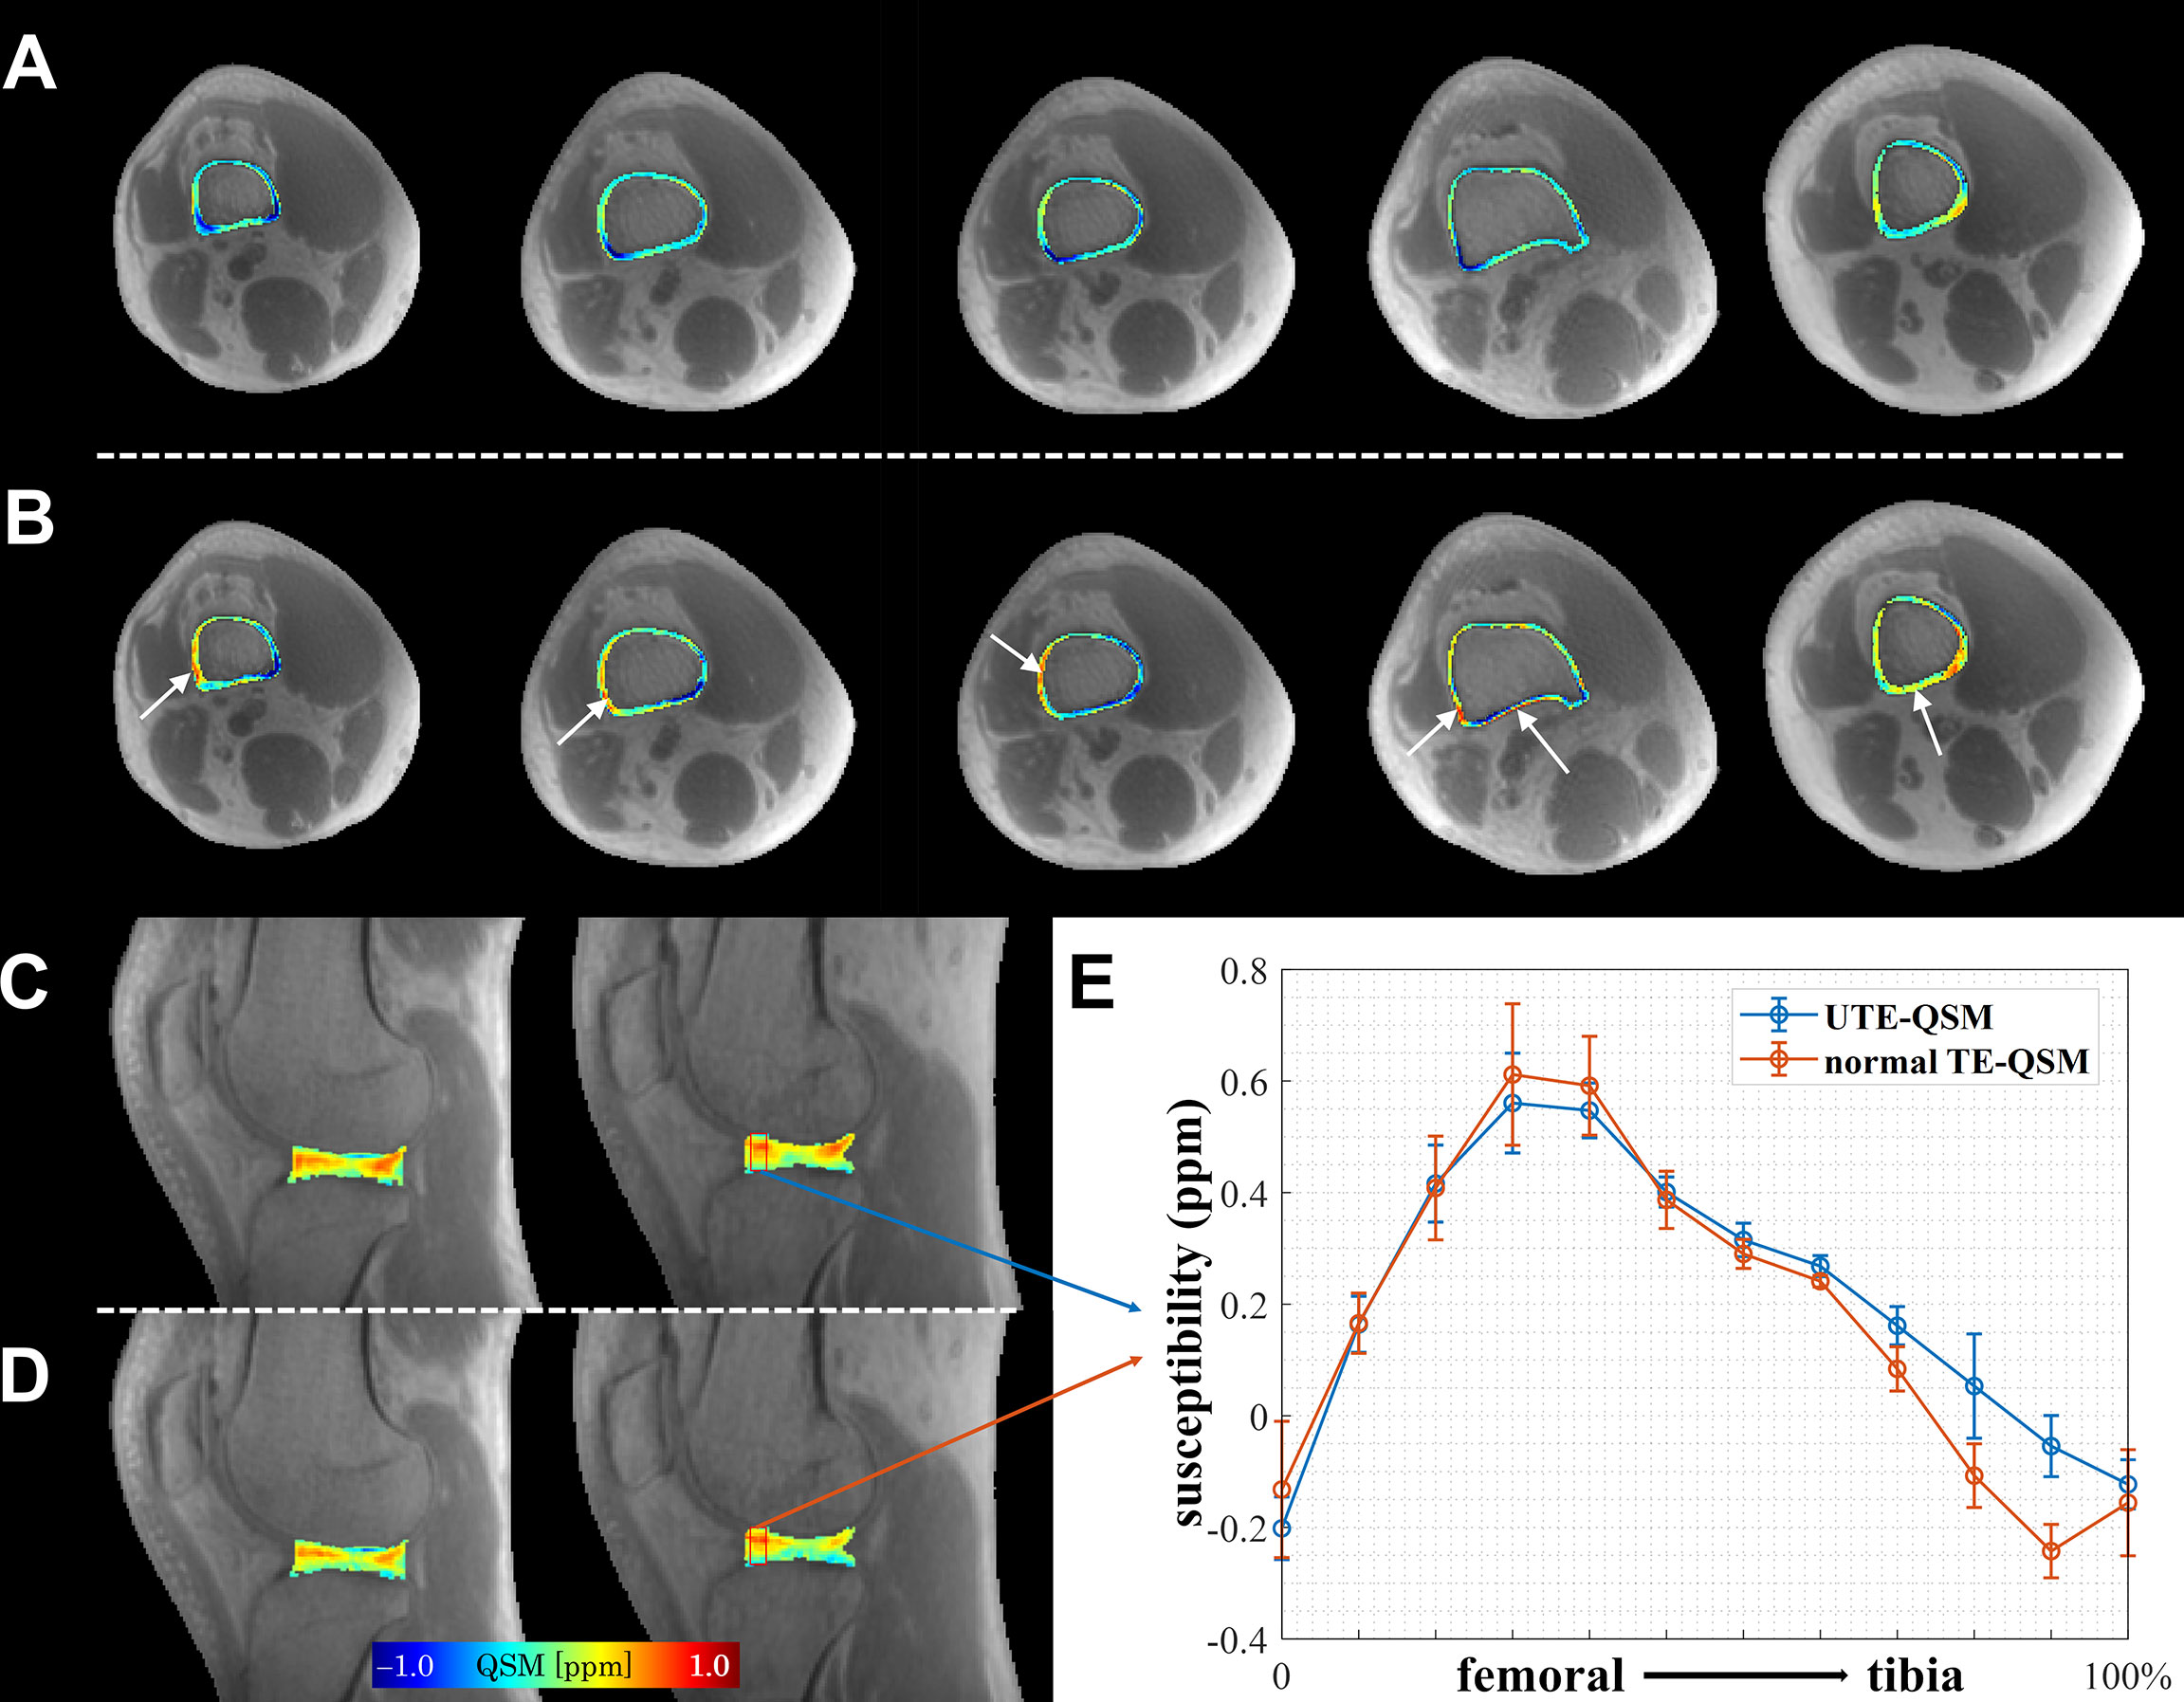
Figure 3 Comparison of UTE-QSM and normal TE-QSM in cortical bone and articular cartilage. In cortical bone, UTE-QSM (A) was more homogenously diamagnetic than normal TE-QSM (B) (regions indicated by white arrows). In articular cartilage, the susceptibility contrasts between UTE-QSM (C) and normal TE-QSM (D) were similar. (E) shows the susceptibility profiles of UTE-QSM and normal TE-QSM from femoral to tibia cartilages in the selected red box (5×12 pixels) on one healthy volunteer. Data are presented as mean±standard deviation. Each column of cortical bone in (A, B) or articular cartilage in (C, D) represents a typical image slice from an individual subject in this study.
Figure 4 shows the result of correlation analysis of UTE-QSM versus CT values in cortical bone. A significant negative correlation (r=−0.43, p<0.001) between the mean susceptibility and CT values in cortical bone was observed.
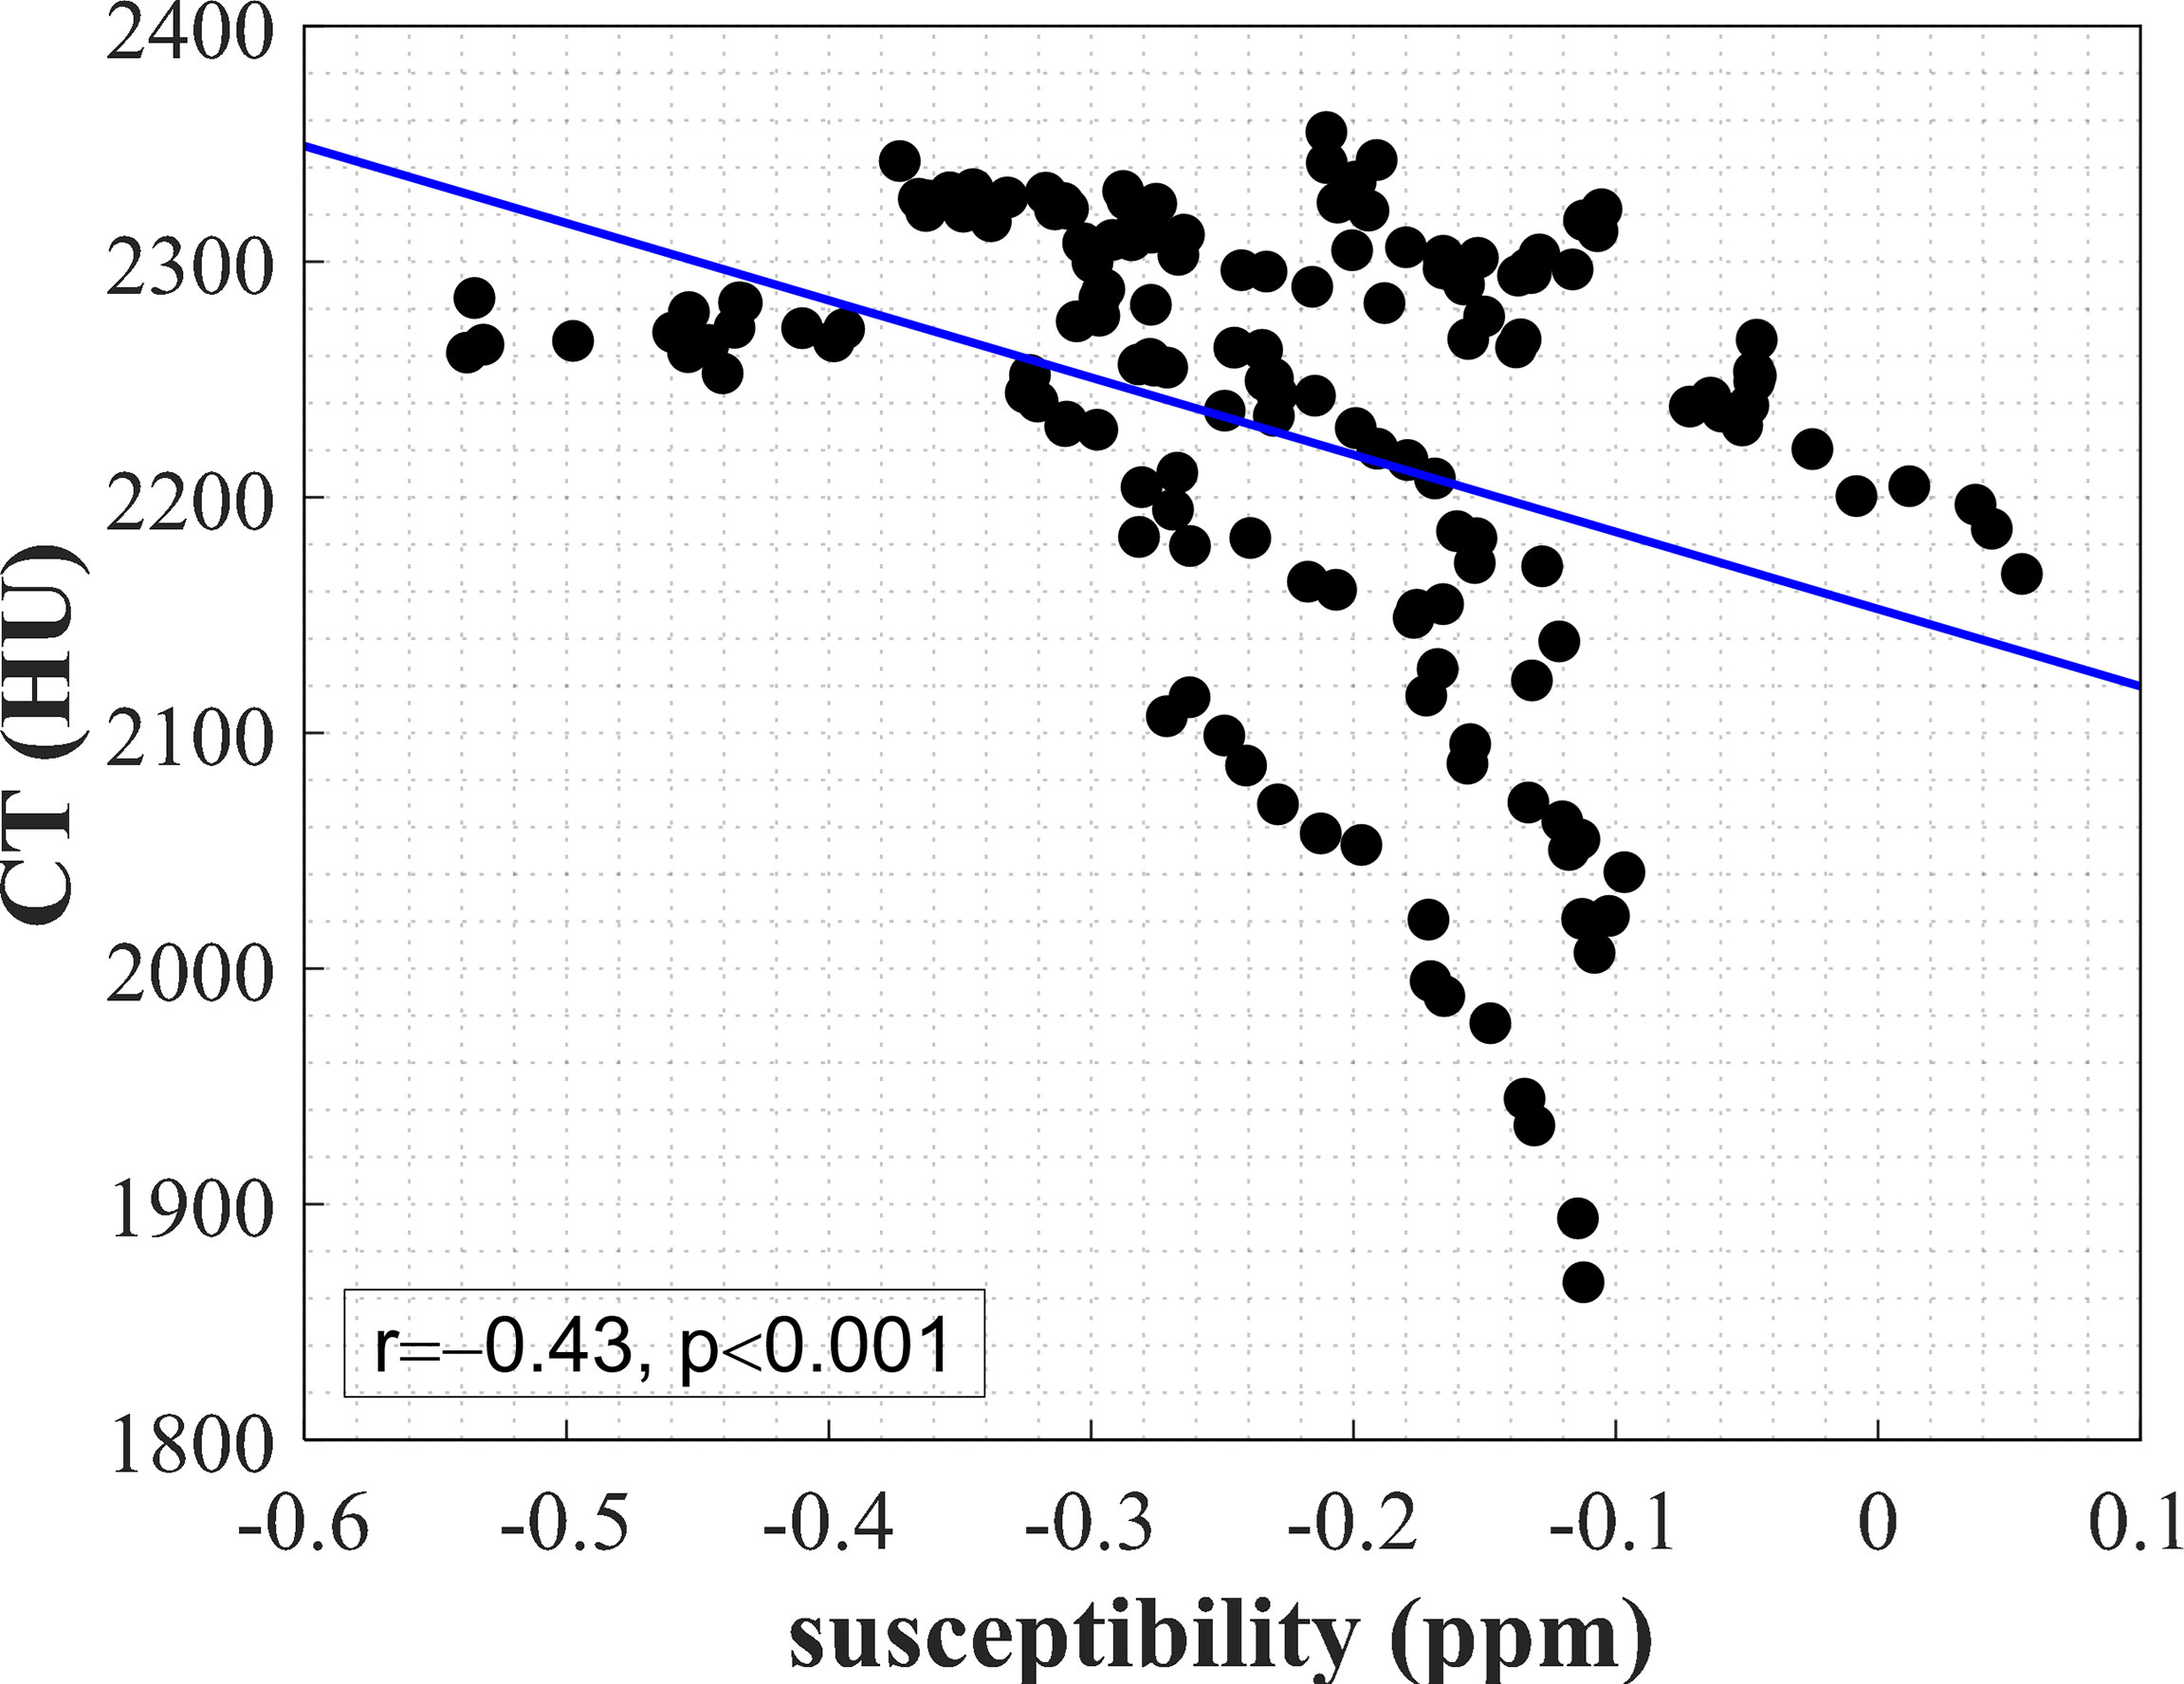
Figure 4 A significant negative correlation (r=−0.43, p<0.001) between the mean susceptibility value and mean CT value in 158 ROIs of cortical bone from the bilateral knee joints of 5 subjects. The blue line was obtained from linear regression.
Discussion
In this study, we described the feasibility of UTE-QSM for simultaneous susceptibility mapping of the articular cartilage and cortical bone of the human knee joint in vivo. The laminar structure of articular cartilage was revealed on UTE-QSM, similar to conventional GRE-based QSM with long TE. Meanwhile, the susceptibility map in cortical bone could be accurately estimated from the collected phase data by UTE-QSM. The correlation study further demonstrated the potential of UTE-QSM to assess the cortical bone without radiation from CT.
We achieved simultaneous susceptibility mapping of the articular cartilage and cortical bone based on UTE-QSM. In previous studies using the GRE sequences, the bone regions were usually masked out to eliminate the unreliable phase measurement with low SNR. With the help of the UTE sequence, it was possible to use a larger FOV to include the whole knee joint into QSM reconstruction. The necessity of UTE sequence for cortical bone susceptibility mapping was evaluated from the comparison between UTE-QSM and normal TE-QSM. In previous studies, a high in-plane resolution with relatively thick slice thickness was often adopted (17, 21). The spatial resolution of UTE was set as 0.9 mm isotropic in this research because the cortical bone and articular cartilage were usually viewed in two different planes, the axial and the sagittal. Therefore, an isotropic spatial resolution was more preferred for simultaneous visualization.
The articular cartilage contains complex organizations. Generally, the articular cartilage can be divided into three layers, the deep, middle and superficial layers, with parallel, random and perpendicular collagen fiber orientations with respect to the subchondral bone (34). The varied collagen fiber arrangement in each layer was considered as the main susceptibility source on QSM images (17, 35). Wei et al. demonstrated the ability of GRE-QSM to reflect the collagen fiber organization in each layer of articular cartilage since the susceptibility of collagen fiber was orientation-dependent (17). A quantitative study demonstrated that the variation of magnetic susceptibility was associated with the stage of OA (36). Recent work further validated the feasibility of GRE-QSM for detecting the early microstructural change in degenerated cartilage by performing GRE-QSM on marathon runners after repetitive running (37). However, the susceptibility property using UTE-QSM in articular cartilage was not fully explored (38). We demonstrated that UTE-QSM also exhibited similar susceptibility differences at different depths of articular cartilage compared with GRE-QSM. This was mainly because that the susceptibility was expected to be TE-independent with adequate phase accumulation and SNR. However, slight differences were observed since there were intermediate steps for QSM reconstruction and possible errors could exist during these procedures due to imperfect mathematical or physical modeling (39). In this study, the deep layer of articular cartilage was relatively thinner on UTE-QSM compared with previous GRE-QSM studies, due to the limited image resolution.
In cortical bone, calcium is the primary biological source of magnetic susceptibility (40). Therefore, the susceptibility of cortical bone should be mostly diamagnetic, which was in agreement with our UTE-QSM result. The potential clinical application of UTE-QSM has been shown in several papers. For example, UTE-QSM was used for detecting hemosiderin deposition in patients with hemophilic arthropathy (22). The susceptibility was presented as high intensity in affected regions with high iron concentrations. Jerban et al. found a significant correlation between the UTE-QSM value and bone mineral density (BMD) measured by micro-CT on human cortical bone specimens, indicating that UTE-QSM could serve as an effective approach for BMD assessment (21). Although UTE-QSM could be a more general tool for knee joint mapping than GRE-QSM, more studies were still needed to fully explore the clinical value of UTE-QSM in the skeletal system, including but not limited to the knee joint (41, 42).
We found a significant correlation between the mean susceptibility and CT values in cortical bone. UTE-QSM may be considered as a potential substitution in imaging the cortical bone. There were a few studies that have attempted to explore the relationship between QSM and CT values. Dimov et al. found that UTE-QSM negatively correlated with CT value in diamagnetic susceptibility regions, such as in the trabecular and cortical areas on a porcine specimen (38). Oshima et al. conducted comprehensive experiments for assessing the general association between susceptibility and CT values with both phantom and human studies using GRE-QSM (43). The phantom experiment demonstrated that the CT value and susceptibility value positively and negatively correlated with CaCO3 concentration, respectively (43). These studies above could support our result of the negative correlation between magnetic susceptibility and CT values in cortical bone.
This work has several limitations. First, the sample size was relatively small, which could lead to statistical bias in correlation analysis. Second, this study only conducted experiments on young and healthy subjects, making the study cohort fairly homogeneous in age and healthy conditions. The feasibility of UTE-QSM on patients with OA or osteoporosis should be further involved to explore the potential applications of UTE-QSM for clinical purposes. Third, a higher isotropic image resolution could be better for visualizing the cortical bone and articular cartilage. Fourth, although the registration performances between two continuous UTE scans and between CT and UTE images were both visually checked and were reasonable, future studies should use quantitative metrics to evaluate the registration accuracy.
In conclusion, we demonstrated the feasibility of UTE-QSM for simultaneous susceptibility mapping of cortical bone and articular cartilage in vivo. UTE-QSM may serve as a valuable imaging tool for investigating the knee joint.
Data Availability Statement
The original contributions presented in the study are included in the article/Supplementary Material. Further inquiries can be directed to the corresponding author.
Ethics Statement
The studies involving human participants were reviewed and approved by the Human Ethics Committee of Shanghai Jiao Tong University. The patients/participants provided their written informed consent to participate in this study.
Author Contributions
MZ: methodology, data acquisition, data analysis, interpretation of findings, and manuscript drafting. ZL, HQW, and TC: methodology and data acquisition. YL, FY, and YZ: conceptualization, methodology, supervision, and manuscript editing. HJW: conceptualization, methodology, supervision, interpretation of findings, funding acquisition, and manuscript editing. All authors contributed to the article and approved the submitted version.
Funding
This study was supported by the National Natural Science Foundation of China (91949120).
Conflict of Interest
The authors declare that the research was conducted in the absence of any commercial or financial relationships that could be construed as a potential conflict of interest.
Publisher’s Note
All claims expressed in this article are solely those of the authors and do not necessarily represent those of their affiliated organizations, or those of the publisher, the editors and the reviewers. Any product that may be evaluated in this article, or claim that may be made by its manufacturer, is not guaranteed or endorsed by the publisher.
Acknowledgments
We would like to thank all the volunteers in this study.
Supplementary Material
The Supplementary Material for this article can be found online at: https://www.frontiersin.org/articles/10.3389/fendo.2022.844351/full#supplementary-material
References
1. Goldring MB. Articular Cartilage Degradation in Osteoarthritis. HSS J (2012) 8(1):7–9. doi: 10.1007/s11420-011-9250-z
2. Jee W. Integrated Bone Tissue Physiology: Anatomy and Physiology. In: Cowin SC, editor. Bone Mechanics Handbook. Boca Raton: CRC Press (2001). p. 1–68.
3. Harrison KD, Hiebert BD, Panahifar A, Andronowski JM, Ashique AM, King GA, et al. Cortical Bone Porosity in Rabbit Models of Osteoporosis. J Bone Mineral Res (2020) 35(11):2211–28. doi: 10.1002/jbmr.4124
4. Zebaze R, Seeman E. Cortical Bone: A Challenging Geography. J Bone Mineral Res (2015) 30(1):24–9. doi: 10.1002/jbmr.2419
5. Reichert IL, Robson MD, Gatehouse PD, He T, Chappell KE, Holmes J, et al. Magnetic Resonance Imaging of Cortical Bone With Ultrashort TE Pulse Sequences. Magnetic Resonance Imaging (2005) 23(5):611–8. doi: 10.1016/j.mri.2005.02.017
6. Bydder G. The Agfa Mayneord Lecture: MRI of Short and Ultrashort T 2 and T 2* Components of Tissues, Fluids and Materials Using Clinical Systems. Br J Radiol (2011) 84(1008):1067–82. doi: 10.1259/bjr/74368403
7. Du J, Bydder GM. Qualitative and Quantitative Ultrashort-TE MRI of Cortical Bone. NMR Biomedicine (2013) 26(5):489–506. doi: 10.1002/nbm.2906
8. Ma YJ, Jerban S, Jang H, Chang D, Chang EY, Du J. Quantitative Ultrashort Echo Time (UTE) Magnetic Resonance Imaging of Bone: An Update. Front Endocrinol (2020) 11:567417. doi: 10.3389/fendo.2020.567417
9. Talebi M, Abbasi-Rad S, Malekzadeh M, Shahgholi M, Ardakani AA, Foudeh K, et al. Cortical Bone Mechanical Assessment via Free Water Relaxometry at 3 T. J Magn Reson Imaging (2021) 54(6):1744–51. doi: 10.1002/jmri.27765
10. Liu C, Li W, Tong KA, Yeom KW, Kuzminski S. Susceptibility-Weighted Imaging and Quantitative Susceptibility Mapping in the Brain. J Magn Reson Imaging (2015) 42(1):23–41. doi: 10.1002/jmri.24768
11. Wang Y, Liu T. Quantitative Susceptibility Mapping (QSM): Decoding MRI Data for a Tissue Magnetic Biomarker. Magn Reson Med (2015) 73(1):82–101. doi: 10.1002/mrm.25358
12. Zhang Y, Shi J, Wei H, Han V, Zhu W-Z, Liu C. Neonate and Infant Brain Development From Birth to 2 Years Assessed Using MRI-Based Quantitative Susceptibility Mapping. NeuroImage (2019) 185:349–60. doi: 10.1016/j.neuroimage.2018.10.031
13. Treit S, Naji N, Seres P, Rickard J, Stolz E, Wilman AH, et al. R2* and Quantitative Susceptibility Mapping in Deep Gray Matter of 498 Healthy Controls From 5 to 90 Years. Hum Brain Mapp (2021) 42(14):4597–610. doi: 10.1002/hbm.25569
14. Zhang Y, Wei H, Cronin MJ, He N, Yan F, Liu C. Longitudinal Atlas for Normative Human Brain Development and Aging Over the Lifespan Using Quantitative Susceptibility Mapping. NeuroImage (2018) 171:176–89. doi: 10.1016/j.neuroimage.2018.01.008
15. Zivadinov R, Tavazzi E, Bergsland N, Hagemeier J, Lin F, Dwyer MG, et al. Brain Iron at Quantitative MRI Is Associated With Disability in Multiple Sclerosis. Radiology (2018) 289(2):487–96. doi: 10.1148/radiol.2018180136
16. Acosta-Cabronero J, Cardenas-Blanco A, Betts MJ, Butryn M, Valdes-Herrera JP, Galazky I, et al. The Whole-Brain Pattern of Magnetic Susceptibility Perturbations in Parkinson’s Disease. Brain (2017) 140(1):118–31. doi: 10.1093/brain/aww278
17. Wei H, Dibb R, Decker K, Wang N, Zhang Y, Zong X, et al. Investigating Magnetic Susceptibility of Human Knee Joint at 7 Tesla. Magn Reson Med (2017) 78(5):1933–43. doi: 10.1002/mrm.26596
18. Wang L, Nissi MJ, Toth F, Johnson CP, Garwood M, Carlson CS, et al. Quantitative Susceptibility Mapping Detects Abnormalities in Cartilage Canals in a Goat Model of Preclinical Osteochondritis Dissecans. Magn Reson Med (2017) 77(3):1276–83. doi: 10.1002/mrm.26214
19. Nykanen O, Rieppo L, Toyras J, Kolehmainen V, Saarakkala S, Shmueli K, et al. Quantitative Susceptibility Mapping of Articular Cartilage: Ex Vivo Findings at Multiple Orientations and Following Different Degradation Treatments. Magn Reson Med (2018) 80(6):2702–16. doi: 10.1002/mrm.27216
20. Nykänen O, Sarin JK, Ketola JH, Leskinen H, te Moller NCR, Tiitu V, et al. T2* and Quantitative Susceptibility Mapping in an Equine Model of Post-Traumatic Osteoarthritis: Assessment of Mechanical and Structural Properties of Articular Cartilage. Osteoarthr Cartil (2019) 27(10):1481–90. doi: 10.1016/j.joca.2019.06.009
21. Jerban S, Lu X, Jang H, Ma Y, Namiranian B, Le N, et al. Significant Correlations Between Human Cortical Bone Mineral Density and Quantitative Susceptibility Mapping (QSM) Obtained With 3D Cones Ultrashort Echo Time Magnetic Resonance Imaging (UTE-MRI). Magn Reson Imaging (2019) 62:104–10. doi: 10.1016/j.mri.2019.06.016
22. Jang H, von Drygalski A, Wong J, Zhou JY, Aguero P, Lu X, et al. Ultrashort Echo Time Quantitative Susceptibility Mapping (UTE-QSM) for Detection of Hemosiderin Deposition in Hemophilic Arthropathy: A Feasibility Study. Magn Reson Med (2020) 84(6):3246–55. doi: 10.1002/mrm.28388
23. Yang S, Zhang Y, Shen J, Dai Y, Ling Y, Lu H, et al. Clinical Potential of UTE-MRI for Assessing COVID-19: Patient- and Lesion-Based Comparative Analysis. J Magnetic Reson Imaging (2020) 52(2):397–406. doi: 10.1002/jmri.27208
24. Rasche V, Proksa R, Sinkus R, Bornert P, Eggers H. Resampling of Data Between Arbitrary Grids Using Convolution Interpolation. IEEE Trans Med Imaging (1999) 18(5):385–92. doi: 10.1109/42.774166
25. Fessler JA. On NUFFT-Based Gridding for Non-Cartesian MRI. J Magnetic Resonance (2007) 188(2):191–5. doi: 10.1016/j.jmr.2007.06.012
26. Jenkinson M, Smith S. A Global Optimisation Method for Robust Affine Registration of Brain Images. Med Image Anal (2001) 5(2):143–56. doi: 10.1016/S1361-8415(01)00036-6
27. Jenkinson M, Bannister P, Brady M, Smith S. Improved Optimization for the Robust and Accurate Linear Registration and Motion Correction of Brain Images. Neuroimage (2002) 17(2):825–41. doi: 10.1016/s1053-8119(02)91132-8
28. Diefenbach MN, Meineke J, Ruschke S, Baum T, Gersing A, Karampinos DC. On the Sensitivity of Quantitative Susceptibility Mapping for Measuring Trabecular Bone Density. Magn Reson Med (2019) 81(3):1739–54. doi: 10.1002/mrm.27531
29. Hernando D, Kellman P, Haldar JP, Liang Z-P. Robust Water/Fat Separation in the Presence of Large Field Inhomogeneities Using a Graph Cut Algorithm. Magn Reson Med (2010) 63(1):79–90. doi: 10.1002/mrm.22177
30. Wu B, Li W, Guidon A, Liu C. Whole Brain Susceptibility Mapping Using Compressed Sensing. Magn Reson Med (2012) 67(1):137–47. doi: 10.1002/mrm.23000
31. Wei H, Dibb R, Zhou Y, Sun Y, Xu J, Wang N, et al. Streaking Artifact Reduction for Quantitative Susceptibility Mapping of Sources With Large Dynamic Range. NMR BioMed (2015) 28(10):1294–303. doi: 10.1002/nbm.3383
32. Avants BB, Epstein CL, Grossman M, Gee JC. Symmetric Diffeomorphic Image Registration With Cross-Correlation: Evaluating Automated Labeling of Elderly and Neurodegenerative Brain. Med Image Anal (2008) 12(1):26–41. doi: 10.1016/j.media.2007.06.004
33. Yushkevich PA, Piven J, Hazlett HC, Smith RG, Ho S, Gee JC, et al. User-Guided 3D Active Contour Segmentation of Anatomical Structures: Significantly Improved Efficiency and Reliability. NeuroImage (2006) 31(3):1116–28. doi: 10.1016/j.neuroimage.2006.01.015
34. Hunziker EB, Quinn TM, Häuselmann HJ. Quantitative Structural Organization of Normal Adult Human Articular Cartilage. Osteoarthritis Cartilage (2002) 10(7):564–72. doi: 10.1053/joca.2002.0814
35. Wei H, Gibbs E, Zhao P, Wang N, Cofer GP, Zhang Y, et al. Susceptibility Tensor Imaging and Tractography of Collagen Fibrils in the Articular Cartilage. Magn Reson Med (2017) 78(5):1683–90. doi: 10.1002/mrm.26882
36. Wei H, Lin H, Qin L, Cao S, Zhang Y, He N, et al. Quantitative Susceptibility Mapping of Articular Cartilage in Patients With Osteoarthritis at 3T. J Magn Reson Imaging (2019) 49(6):1665–75. doi: 10.1002/jmri.26535
37. Zhang M, Li Y, Feng R, Wang Z, Wang W, Zheng N, et al. Change in Susceptibility Values in Knee Cartilage After Marathon Running Measured Using Quantitative Susceptibility Mapping. J Magn Reson Imaging (2021) 54(5):1585–93. doi: 10.1002/jmri.27745
38. Dimov AV, Liu Z, Spincemaille P, Prince MR, Du J, Wang Y. Bone Quantitative Susceptibility Mapping Using a Chemical Species-Specific R2* Signal Model With Ultrashort and Conventional Echo Data. Magn Reson Med (2018) 79(1):121–8. doi: 10.1002/mrm.26648
39. Cronin MJ, Wang N, Decker KS, Wei H, Zhu WZ, Liu C. Exploring the Origins of Echo-Time-Dependent Quantitative Susceptibility Mapping (QSM) Measurements in Healthy Tissue and Cerebral Microbleeds. Neuroimage (2017) 149:98–113. doi: 10.1016/j.neuroimage.2017.01.053
40. Hwang SN, Wehrli FW. The Calculation of the Susceptibility-Induced Magnetic Field From 3D NMR Images With Applications to Trabecular Bone. J Magn Reson Ser B (1995) 109(2):126–45. doi: 10.1006/jmrb.1995.0002
41. Guo Y, Chen Y, Zhang X, Mei Y, Yi P, Wang Y, et al. Magnetic Susceptibility and Fat Content in the Lumbar Spine of Postmenopausal Women With Varying Bone Mineral Density. J Magn Reson Imaging (2019) 49(4):1020–8. doi: 10.1002/jmri.26279
42. Chen Y, Guo Y, Zhang X, Mei Y, Feng Y, Zhang X. Bone Susceptibility Mapping With MRI Is an Alternative and Reliable Biomarker of Osteoporosis in Postmenopausal Women. Eur Radiol (2018) 28(12):5027–34. doi: 10.1007/s00330-018-5419-x
Keywords: quantitative susceptibility mapping, ultrashort echo time, articular cartilage, cortical bone, computed tomography
Citation: Zhang M, Li Z, Wang H, Chen T, Lu Y, Yan F, Zhang Y and Wei H (2022) Simultaneous Quantitative Susceptibility Mapping of Articular Cartilage and Cortical Bone of Human Knee Joint Using Ultrashort Echo Time Sequences. Front. Endocrinol. 13:844351. doi: 10.3389/fendo.2022.844351
Received: 28 December 2021; Accepted: 31 January 2022;
Published: 22 February 2022.
Edited by:
Bing Wu, GE Healthcare, ChinaReviewed by:
Aixia Sun, Michigan State University, United StatesLihui Wang, Guizhou University, China
Copyright © 2022 Zhang, Li, Wang, Chen, Lu, Yan, Zhang and Wei. This is an open-access article distributed under the terms of the Creative Commons Attribution License (CC BY). The use, distribution or reproduction in other forums is permitted, provided the original author(s) and the copyright owner(s) are credited and that the original publication in this journal is cited, in accordance with accepted academic practice. No use, distribution or reproduction is permitted which does not comply with these terms.
*Correspondence: Hongjiang Wei, hongjiang.wei@sjtu.edu.cn