 Lingling Ding1
 Tom Houben1Yvonne Oligschlaeger1Albert V. Bitorina1
 Bart J. Verwer2Maarten E. Tushuizen2*†
 Ronit Shiri-Sverdlov1*†
- 1Department of Molecular Genetics, School of Nutrition and Translational Research in Metabolism (NUTRIM), Maastricht Universtiy, Maastricht, Netherlands
- 2Department of Gastroenterology and Hepatology, Leiden University Medical Center, Leiden, Netherlands
Objective: Type 2 diabetes mellitus is a metabolic disorder characterized by insulin resistance. Previous studies in patients demonstrated that plasma levels of cathepsin D (CTSD), which is optimally active in the acidic environment of lysosomes, correlate with insulin resistance. As plasma pH is slightly reduced in type 2 diabetic patients and we have previously shown that plasma CTSD activity is causally linked to insulin levels in vivo, it is likely that the activity of CTSD in plasma will be increased in type 2 diabetes compared to healthy individuals. However, so far the interaction between CTSD activity and levels to postprandial metabolic derangements in type 2 diabetes is not known.
Methods: Eighteen type 2 diabetes and 16 age-matched healthy males were given 2 consecutive standardized mixed meals, after which blood samples were collected. Plasma metabolic parameters as well as CTSD levels and activity were measured, and changes in plasma pH was assessed.
Results: In line with the elevation of plasma free fatty acids (FFA) levels in male type 2 diabetics patients, plasma pH in type 2 diabetic individuals was decreased compared to male healthy individuals. While plasma CTSD levels were similar, plasma CTSD activity was increased in male type 2 diabetic compared to male healthy individuals. Besides, plasma CTSD activity rather than levels significantly correlated with indicators of type 2 diabetes (HbA1c, HOMA-IR and glucose). Furthermore, FFA was also independently associated with plasma CTSD activity (standardized β = 0.493, p = 0.007).
Conclusions: Despite similar plasma CTSD levels, type 2 diabetic male individuals showed increased plasma CTSD activity compared to healthy males, which was independently linked to plasma FFA levels. Our data therefore point toward plasma CTSD as a metabolic regulator in male type 2 diabetes.
Introduction
Diabetes mellitus is a global public health concern currently affecting more than 425 million people worldwide (1). Type 2 diabetes mellitus, accounting for approximately 90% of all diabetes mellitus cases, is hallmarked by insulin resistance, a pathological phenomenon where cells fail to respond to insulin to increase glucose uptake and utilization (2, 3). However, though certain metabolic cascades have been unraveled, insight into the complete metabolic picture of insulin resistance is still lacking as it is unclear why certain patients do and others do not develop insulin resistance. In order to identify those patients at increased risk for type 2 diabetes development, it is of utmost importance to improve our understanding of the metabolic mechanisms involved with insulin resistance.
A key mechanism involved with the development of insulin resistance is lipotoxicity, an umbrella term used to identify the deleterious effects of access lipid storage in non-adipose tissue (4). Lysosomes are essential cell organelles mediating lipid degradation, implying that under lipotoxic conditions (for example during increased cellular lipid influx) lysosomal function is compromised. Indeed, lipid-mediated damage to lysosomal membranes resulted in the unintended translocation of lysosomal enzymes into the cytosol and/or the extracellular environment (5–9). In line with these observations, we and others previously showed that accumulation of specifically oxidized lipids in lysosomes leads to the extracellular secretion of aspartic lysosomal enzyme cathepsin D (CTSD) (10, 11). Likewise, plasma CTSD levels have been previously correlated with insulin resistance in newly diagnosed type 2 diabetes (12) and two large community cohorts without diabetes (with more than 70% of participants being healthy residents) (13) and were even implicated as non-invasive markers for different stages of NAFLD, a metabolic condition linked to type 2 diabetes (10, 14). Relevantly, the enzymatic activity of CTSD is optimally active in an acidic environment, which is maintained via pH regulation (15). pH reductions in the interstitial fluid of diabetic patients (16) therefore imply changes in plasma CTSD activity in type 2 diabetes, which might result in metabolic changes. Furthermore, while insulin-treated diabetic rats showed increased CTSD activity in liver, kidney, heart and brain (17), inhibition of plasma CTSD activity in a steatotic rat model reduced plasma insulin levels (18). Thus, these evidences provide support for a potential functional metabolic link between insulin resistance and plasma CTSD activity.
To validate this view, in the current study we investigated whether type 2 diabetic patients have increased plasma CTSD activity compared to healthy individuals and whether plasma CTSD levels and activity link to postprandial metabolic parameters of type 2 diabetes. For this aim, plasma pH, plasma CTSD levels and activity as well as type 2 diabetes-related plasma parameters were measured in eighteen male type 2 diabetic patients and sixteen age-matched healthy males in the postprandial state. Our study demonstrated that plasma pH decreased in male type 2 diabetic individuals as compared to male healthy individuals, which can be partly explained by increased plasma FFA levels in type 2 diabetic patients. Additionally, compared to male healthy individuals, type 2 diabetic males demonstrated increased plasma CTSD activity. Furthermore, we observed that plasma CTSD activity, and not levels, significantly correlated with indicators of type 2 diabetes (plasma HbA1c, HOMA-IR and glucose) in males. Moreover, plasma CTSD activity also independently associated with a metabolic parameter of type 2 diabetes (plasma free fatty acids (FFA) in males). Altogether, our observations show that, despite similar plasma CTSD levels, type 2 diabetic male individuals showed increased plasma CTSD activity compared to healthy males, which was independently linked to plasma FFA levels. As FFA reduced the pH and pH was reduced in type 2 diabetic males, pH potentially played a central role in the activity of CTSD. Our data therefore point for the first time toward plasma CTSD as a metabolic regulator in male type 2 diabetes.
Materials and Methods
Subject Characteristics
The study populations comprised of 34 Caucasian males, aged between 40 and 65 years, which were classified as age-matched healthy controls (n = 16) and type 2 diabetes (n = 18). All subjects were recruited by advertisement and gave written informed consent. Before and during recruitment, type 2 diabetic patients were only allowed to follow a diet or to take the glucose-lowering agents sulphonylurea and/or metformin. Exclusion criteria were excess alcohol intake (>20 units/wk), history of hepatitis and/or pancreatitis, abnormal liver and renal function tests (>2 times upper limits of normal), recent (<3 months) changes in weight (≥5%) and/or medication, history or current use of glucocorticosteroids, insulin and/or thiazolidinediones, statins or other lipid-lowering drugs. Twenty-four hours prior to examination, the subjects were refrained from heavy physical activities, and during the examination, subjects were instructed to omit their medication. The present study was approved by the ethical committee of VU University and the study protocol was in accordance with the ethical guidelines of the declaration of Helsinki (1975).
Study Design
After an overnight fast, all subjects consumed two consecutive standardized mixed meals as breakfast and lunch (4 h later), within 15 min. The meals were isocaloric (900 kcal), containing 75 g carbohydrates, 50 g fat (60% saturated) and 35 g protein. Subsequently, blood samples were collected from the antecubital vein 2 h following lunch as previously described (19).
Biochemical Measurements of Plasma Parameters
Plasma glucose concentrations were measured by a hexokinase-based technique (Roche Diagnostics, Mannheim, Germany) and insulin concentrations by an immunoradiometric assay (Centaur, Bayer Diagnostics, Mijdrecht, The Netherlands). Plasma total cholesterol, high-density lipoproteins (HDL), triglycerides (TG), free fatty acids (FFA), gamma glutamyl transferase (GGT) and alanine transaminase (ALT) were determined by enzymatic methods (Modular, Hitachi, Japan). Low-density lipoproteins (LDL) were calculated by the Friedewald formula. Glycated hemoglobin (HbA1c) was measured by means of cation exchange chromatography (Menarini Diagnostics, Florence, Italy; reference values: 4.3–6.1%). Plasma remnants-like particle cholesterol (RLP cholesterol) was analyzed using an immuno-separation assay (Otsuka Pharmaceutical Co., Tokyo, Japan). The homeostasis model assessment of insulin resistance (HOMA-IR) was calculated as fasting insulin (μU/ml) × glucose (mmol/l)/22.5 as described by Matthews et al. (20). Plasma apoB-48 and apoB-100 were measured using a sandwich ELISA method as previously described (21). Plasma lactate concentration was measured via the lactate assay kit according to the protocol (Sigma-Aldrich, Netherlands). Plasma CTSD levels were determined by an enzyme-linked immunosorbent assay (USCN Life Science, Wuhan, China) and plasma CTSD activity was measured using a CTSD activity assay kit (MBL International, Woburn, USA), according to the manufacturer’s protocols.
Plasma pH Measurements
The impact of plasma pH on plasma CTSD activity was assessed by using pH-adjusted reaction buffer, i.e., pH 4.0 (mimicking lysosomal pH) and pH 7.0 (mimicking plasma pH), respectively. Further, the pH of pooled plasma derived from healthy individuals versus type 2 diabetes patients was determined using a Seahorse Bioscience XF96 Extracellular Flux Analyzer (Aligent, USA). While pH measurements should ideally have been performed on individual plasma samples, we performed the pH measurement on pooled plasma samples from healthy controls and type 2 diabetic patients due to the low available plasma volumes. Additionally, to investigate a change of CTSD activity within a relevant plasma pH change, we measured plasma CTSD activity after adjusting the pH from pH 7.4 to pH 7.1. Furthermore, the effect of FFA (600 μM palmitate; Sigma Aldrich, Netherlands) on plasma pH was assessed in-vitro using plasma derived from random healthy volunteers. The palmitate stock (1,800 μM, the ration of palmitic acid: bovine serum albumin (BSA) = 6:1; BSA from MP Biomedicals, Netherlands) was prepared in 1.25× MKR (Modified Krebs Ringer Buffer in MQ water) with adjusted pH of 7.5. To get 600 μM FFA, 100 μl FFA stock was added into 200 μl plasma. Additionally, due to the influence of coagulant-EDTA, storage time and processing of blood samples (i.e., centrifuge) on plasma pH (20, 21), the absolute pH value are higher than 7.4.
Statistical Analyses
Statistical analyses were performed using SPSS 24.0 (IBM, Armonk, NY, USA) and Graphpad Prism 6.0 for Microsoft Windows. All data were expressed as means ± SEM. The differences in subjects’ characteristics were tested using independent sample t-test in SPSS. The differences between two groups for the plasma pH experiment were tested using unpaired t-test in Graphpad Prism 6.0. Spearman’s correlations determined simple correlations between plasma CTSD levels/activity and parameters related to type 2 diabetes. Subsequently, multiple linear regression analyses were performed, in which plasma CTSD levels/activity served as dependent variable in model 1 (simple regression), model 2 (model 1 + adjustment for age), model 3 (model 2 + adjustment for BMI) and model 4 (model 3 + adjustment for waist). p-value <0.05 was considered statistically significant.
Results
General Characteristics of Healthy Controls and Type 2 Diabetic Subjects
Thirty-four males were enrolled in the study, consisting of 16 healthy controls and 18 type 2 diabetes with a mean age of 56.8 and 55.1 years, respectively. General characteristics (Table 1) show that BMI, waist, systolic (SBP) and diastolic blood pressure (DBP) were significantly higher in male patients with type 2 diabetes compared to healthy males. Plasma levels of glucose, HbA1c and insulin as well as HOMA-IR were significantly higher in male type 2 diabetic patients compared to male healthy controls, pointing toward disturbed glucose metabolism in male type 2 diabetic patients. Plasma lactate in type 2 diabetic male patients was also significantly higher than healthy males. No significant differences were found in postprandial plasma TG, RLP-cholesterol, ApoB48 and ApoB100 between the male healthy controls and type 2 diabetes. Plasma FFA levels significantly increased, while plasma HDL significantly decreased in type 2 diabetes compared to healthy individuals, indicating disturbed lipid metabolism in male type 2 diabetic patients. In line, plasma levels of ALT, GGT and hs-CRP were significantly higher in male type 2 diabetic patients than healthy males.
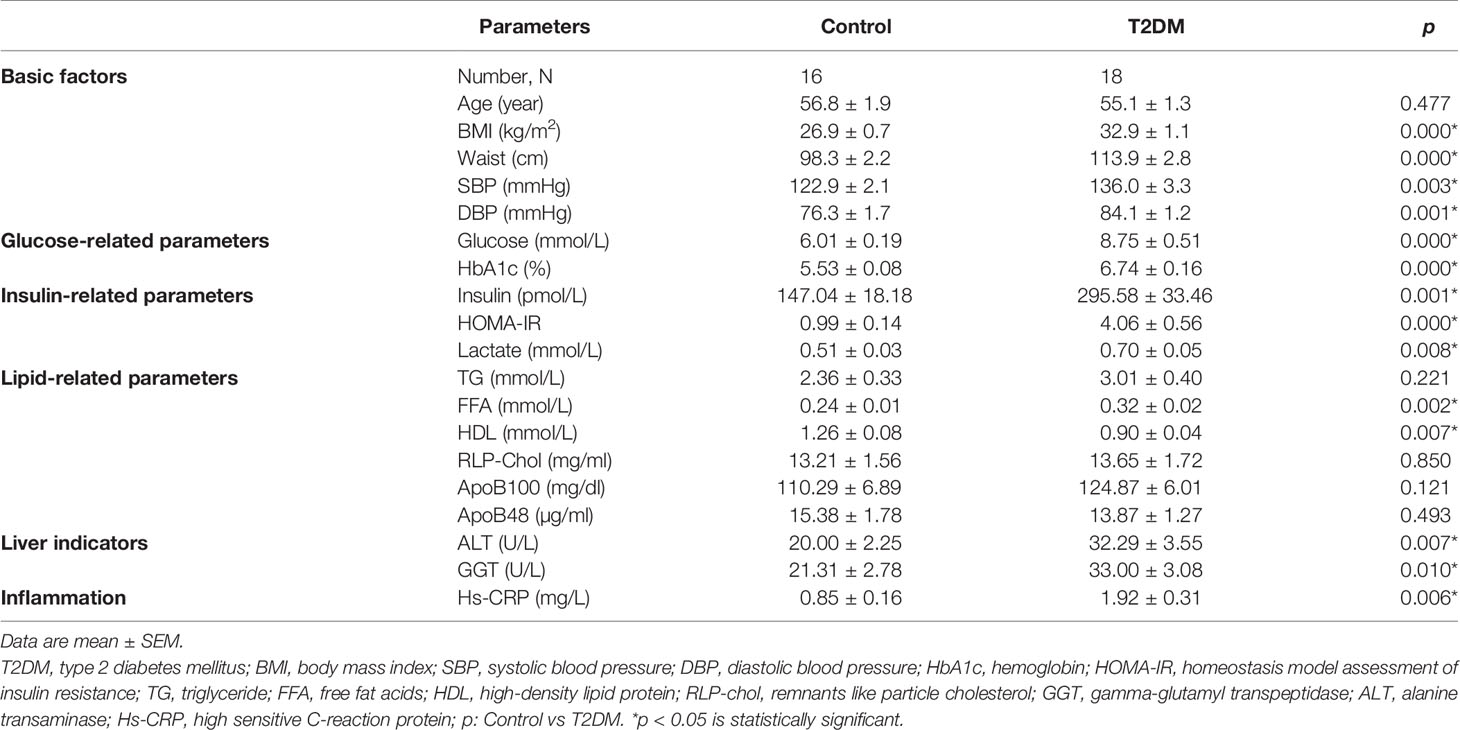
Table 1 General characteristics of healthy controls and type 2 diabetic subjects.
Reduced Plasma pH in Male Type 2 Diabetic Patients Due to Elevated FFA Levels
To confirm whether type 2 diabetes have lower plasma pH compared with healthy individuals, we measured the pH of pooled plasma from male healthy individuals versus male type 2 diabetes. Our data showed a significant reduction in plasma pH of male type 2 diabetes compared to healthy males (Figure 1A; pH reduction = −0.19, p < 0.001), though the pH values were outside of the physiological range. Next, ex-vivo settings were tested using plasma derived from healthy volunteers to investigate whether the slight decline in plasma pH in type 2 diabetic patients is related to increased levels of FFA, which is known to play a key role in the pathology of type 2 diabetes (22). As expected, treatment with FFA (600 μM) resulted in a significant reduction in plasma pH (Figure 1B). Altogether, these data show the potential of FFA to significantly impact the plasma pH, which might influence plasma CTSD activity in type 2 diabetes.
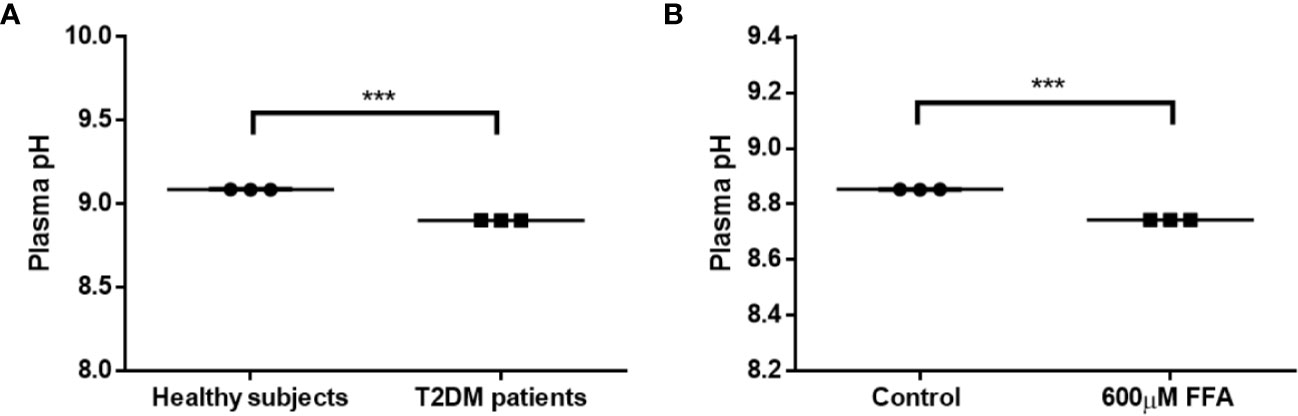
Figure 1 Reduced plasma pH in male type 2 diabetes due to elevated FFA levels. (A) Plasma pH in T2DM male individuals compared to male healthy subjects, (B) the effect of high concentrations of FFA (600 µM) on plasma pH. Data are mean ± SEM. ***p < 0.001. T2DM, type 2 diabetes mellitus.
Plasma CTSD Activity Is Superior to Levels in Distinguishing Type 2 Diabetes From Healthy Controls in Male Individuals
To confirm that plasma CTSD indeed maintains reduced activity outside of the lysosomes, the activity of plasma CTSD was measured at pH 7 (physiological pH) and at pH 4 (lysosomal pH). Our data demonstrated that plasma CTSD maintained ~50% of its proteolytic activity at neutral pH compared to acidic pH (Figure S1). Next, based on the above observations, plasma CTSD activity and levels were measured to compare the difference between type 2 diabetes and healthy subjects in males. No significant differences in plasma CTSD levels were observed between male type 2 diabetes and healthy individuals (Figure 2A). In line with the reduced plasma pH, plasma CTSD activity was significantly higher in male type 2 diabetic patients compared to male healthy individuals (Figure 2B, p<0.001), suggesting that plasma CTSD activity is linked to type 2 diabetes progression. Likewise, as shown in Figure S2, we observed that plasma CTSD activity at pH 7.1 increased compared to pH 7.4, supporting a change of CTSD activity within a relevant plasma pH change. Additionally, while lactate levels were significantly higher in type 2 diabetic males, these levels did not correlate with plasma CTSD activity, suggesting that lactate likely did not influence plasma CTSD activity (data not shown).
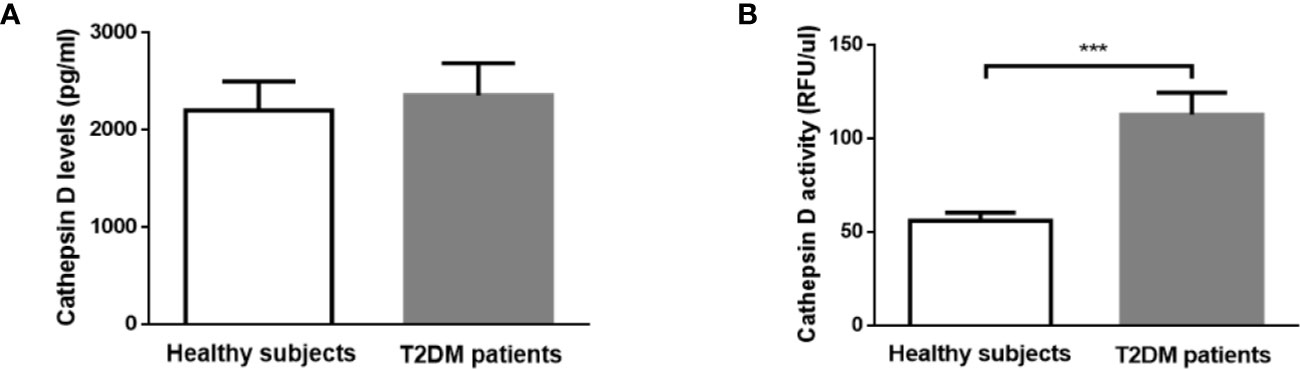
Figure 2 In contrast to CTSD level, CTSD activity distinguishes between healthy controls and T2DM in male individuals. (A) CTSD levels, (B) CTSD activity. Data are mean ± SEM. ***p < 0.001. T2DM, type 2 diabetes mellitus.
Plasma CTSD Activity Rather Than Levels Significantly Correlates With type 2 Diabetes Indicators in Male Individuals
To investigate whether plasma CTSD activity is correlated with type 2 diabetes indicators (i.e., HbA1c (%), HOMA-IR and glucose) compared with plasma CTSD levels, Spearman’s correlations were performed. In line with the finding that plasma CTSD activity was significantly higher in male type 2 diabetes compared with healthy males, we found that plasma CTSD activity positively correlated with HbA1c (%) (Figure 3B; r = 0.577, p = 0.002), HOMA-IR (Figure 3D; r = 0.398, p = 0.027) and plasma glucose (Figure 3F; r = 0.465, p = 0.015). In contrast, levels of plasma CTSD did not correlate with indicators of type 2 diabetes, including HbA1c (%), HOMA-IR and glucose (Figures 3A, C, E). Additionally, linear regression analyses were performed to evaluate whether the correlation between plasma CTSD activity and type 2 diabetic indicators (HbA1c (%), HOMA-IR and glucose) were dependent or independent of age, BMI and waist. As shown in Table S1, no significant associations were observed between plasma CTSD activity and HbA1c (%), HOMA-IR as well as glucose after adjustment of age, BMI and waist, indicating dependency of these parameters on the link between plasma CTSD activity and HbA1c (%)/HOMA-IR/glucose. Likewise, HbA1c (%), HOMA-IR and glucose were also not independently associated with plasma CTSD levels (data not shown). Taken together, our data indicate that plasma CTSD activity rather than levels correlates with type 2 diabetic indicators (plasma HbA1c, HOMA-IR and glucose), but their associations are dependent of age, BMI and waist.
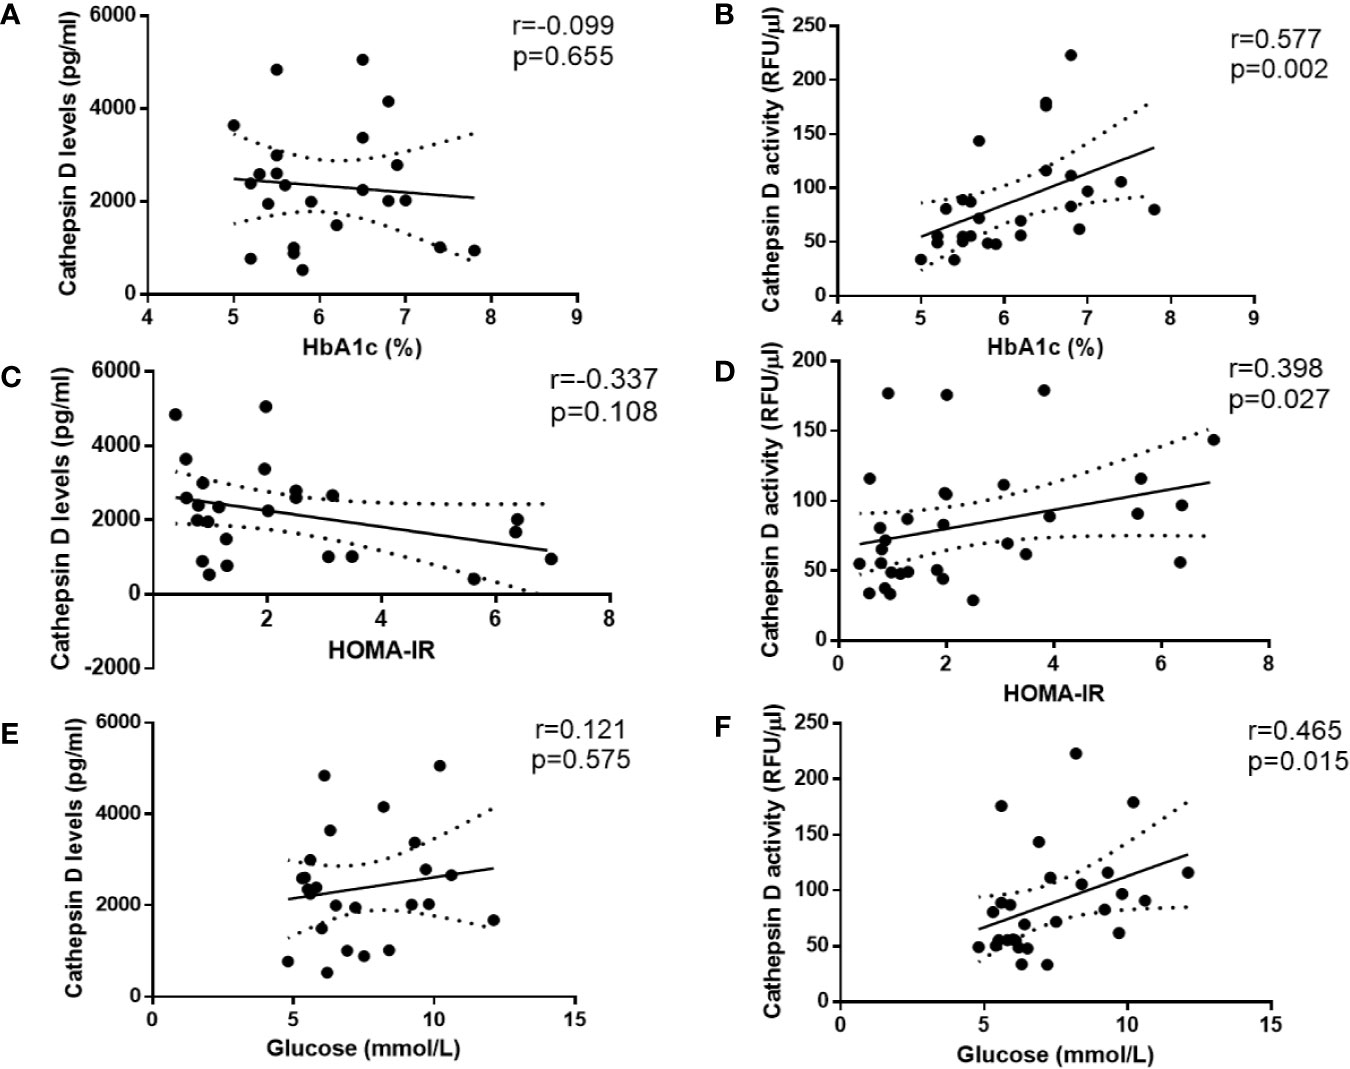
Figure 3 Spearman correlations between CTSD levels and activity versus type 2 diabetes-indicators in male individuals. CTSD levels (A, C, E) or activity (B, D, F) vs. HbA1c (%), HOMA-IR and glucose (mmol/L), respectively. Spearman’s correlations were performed. p < 0.05 is considered statistically significant.
Metabolic Parameter Related to Type 2 Diabetes (FFA) Is Independently Associated With Plasma CTSD Activity in Male Individuals
Insulin and FFA play a central role in metabolic disturbances related to insulin resistance and type 2 diabetes. For this reason, we investigated whether plasma FFA and insulin are associated with plasma CTSD levels and activity. Firstly, Spearman’s correlation was performed to analyze the simple correlation between plasma CTSD levels/activity and metabolic parameters of type 2 diabetes (plasma FFA and insulin). As shown in Figures 4A, B, plasma CTSD activity, but not levels, correlated with plasma FFA (r = 0.424, p = 0.022). Both plasma CTSD levels and activity were not correlated with insulin (Figures 4C, D). To further evaluate whether these correlations were dependent or independent of age, BMI and waist, linear regression analyses were performed. As displayed in Table 2, plasma FFA positively associated with CTSD activity (standardized β = 0.494, p = 0.006), even after adjustment for age (Model 2: standardized ß = 0.492, p = 0.008), BMI (Model 3: standardized ß = 0.471, p = 0.008) and further correction for waist (Model 4: standardized ß = 0.493, p = 0.007). However, plasma insulin levels were not positively associated with CTSD activity even adjustment of age, BMI and waist (as shown in Table S1). Altogether, these data demonstrate that the metabolic parameter of type 2 diabetes (plasma FFA) is independently associated with plasma CTSD activity, linking plasma CTSD activity to insulin resistance via changes in FFA metabolism.
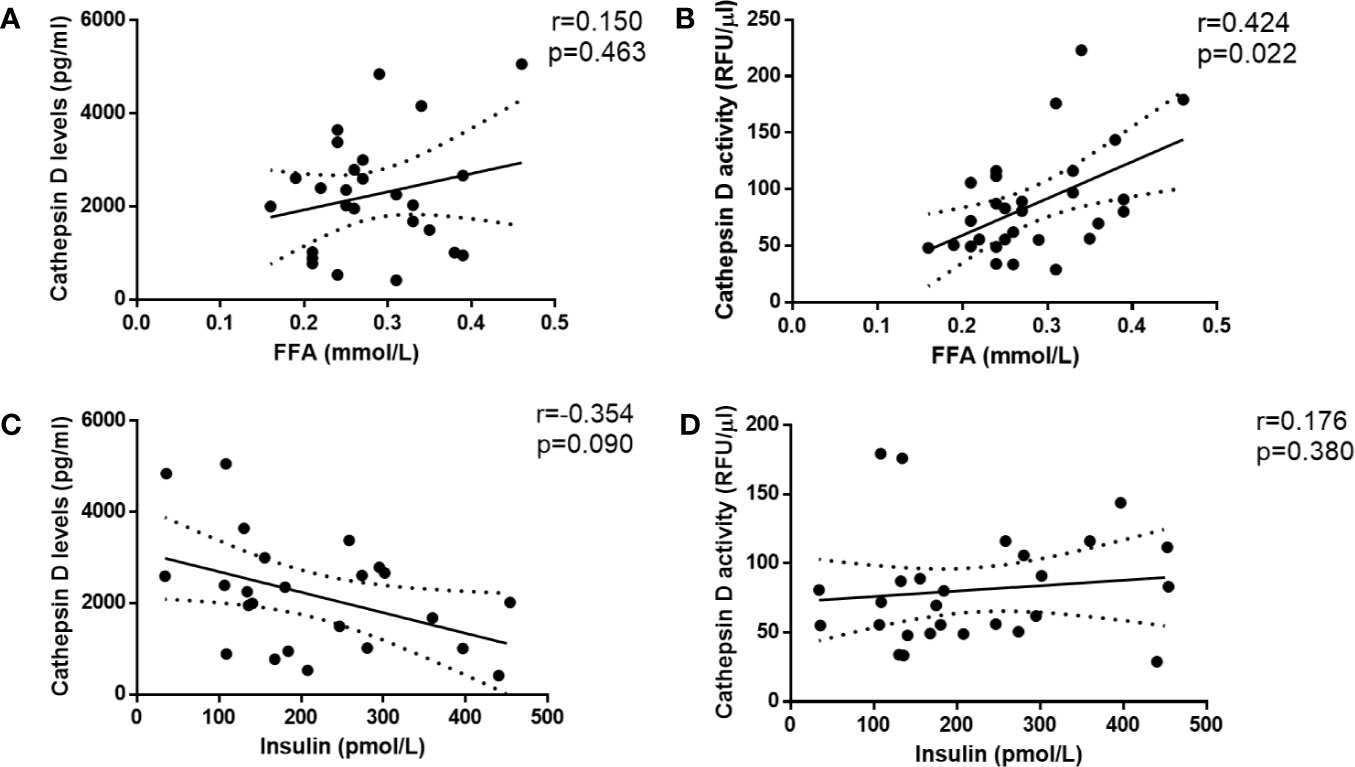
Figure 4 Plasma CTSD activity rather than levels significantly correlates with metabolic parameter of type 2 diabetes (FFA) in male individuals. CTSD levels (A, C) or activity (B, D) vs. FFA and insulin, respectively. Spearman’s correlations were performed. p < 0.05 is considered statistically significant.
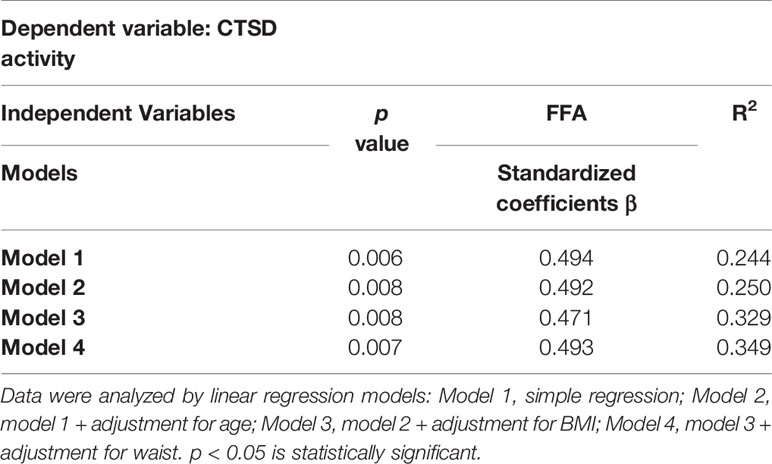
Table 2 Plasma FFA is independently (positively) associated with plasma CTSD activity in male individuals.
Discussion
In the current study, we show that a metabolically-induced reduction of plasma pH in male type 2 diabetes patients correlates with increased plasma CTSD activity, which on its turn is linked to elevated plasma lipid and glucose levels. Our data therefore point toward plasma CTSD as a novel metabolic regulator in type 2 diabetes. These findings are in line with our previous studies that demonstrated a role for plasma CTSD activity in lipid metabolism and insulin resistance (18, 23, 24).
Under healthy conditions, CTSD has been demonstrated to play important roles in maintaining numerous physiological functions, including degradation of intracellular proteins, activation of hormones, growth factors and enzymatic precursors, hydrolysis of LDL cholesterol, and regulating programmed cell death (15). Besides physiology, CTSD has also been reported to be involved with the pathogenesis of a whole array of disorders such as in cancer, Alzheimer and metabolic syndrome related diseases (14, 25, 26). Indeed, emerging studies currently have focused on the role of CTSD in metabolic syndrome, linking CTSD to NAFLD (14) and type 2 diabetes (24). More specifically, increasing reports link CTSD activity to disturbances in lipid metabolism (18, 23), a finding which we could also confirm in here in our study. Therefore, with lipotoxicity as one of the key drivers for type 2 diabetes, CTSD might be an auspicious new player in the complex network contributing to insulin resistance by mechanisms that need to be further explored.
Our finding that plasma pH is influenced by changes in plasma FFA suggests an essential role for pH in regulating physiological processes related to metabolism. Indeed, enzyme activity is known to be highly dependent on the pH, a phenomenon that has been best described within the intralysosomal environment (27). Building further on this modulatory role of pH on enzyme activity, in this study, our findings imply that pH also influences enzyme activity in the plasma, suggesting the impact of pH also beyond the intralysosomal environment. However, as our pH measurements were outside of the physiological range, the link between FFA, pH and enzyme activity should be considered with caution at this stage as more research is necessary to confirm this claim. Nevertheless, a reduction of 0.05 units from the normal blood pH (being 7.40) in diabetic patients indeed results in acidosis (28), a condition which accelerates the progression of pathological features of diabetes by hampering the activity of metabolic enzymes such as phosphofructokinase (29). Furthermore, subtle reductions in pH also increase cathepsin activity in-vivo or ex-vivo in the context of cancer (30–33). Taken this modulatory function of pH on enzyme activity into account, it is possible that the plasma pH reduction in diabetic patients (16, 34, 35) also influenced CTSD activity in our study. Regardless, plasma pH has an essential modulatory function on metabolic processes by influencing enzyme activity and for this reason future studies should be done to clarify this role of pH on metabolic processes in more detail.
The observation that metabolic parameter (plasma FFA) related to type 2 diabetes associated with plasma CTSD activity (as dependent variable) in males implies an influence of this metabolic parameter on plasma CTSD activity. Indeed, considering pH as a key indicator for maintenance of enzyme activity, we here describe that plasma FFA changes plasma pH likely via the acidic characteristics associated with FFA (36), thereby influencing plasma CTSD activity. These findings raise the question whether this pH-mediated metabolic influence on plasma CTSD activity has functional consequences. Our findings that (1) type 2 diabetic patients have higher plasma CTSD activity compared to healthy controls and (2) plasma CTSD activity positively correlates with indicators of type 2 diabetes (HbA1c, HOMA-IR and glucose) point toward the link between plasma CTSD activity and disturbed glucose metabolism (or insulin resistance) in type 2 diabetes. Moreover, we recently found that inhibition of extracellular CTSD activity reduced plasma insulin levels and hepatic lipids in rats with hepatic steatosis (18). Likewise, our group also previously observed that inhibiting CTSD activity via pepstatin A (an aspartic lysosomal enzymes inhibitor) reduces the gene expression of CD36 (a transporter of FFA) (23) that also mediates the suppression of FFA on insulin signaling (37). This data thereby suggests that CTSD activity is likely involved with insulin signaling via regulating FFA metabolic pathways (i.e., CD36 transporter). Furthermore, previous reports have proven the ability of CTSD to proteolysis and influence the bioavailability of insulin-like growth factors (IGFs), factors that have been extensively linked to insulin resistance (38, 39). These observations place plasma CTSD activity at the center of metabolic programming as in this way, CTSD receives “signals” from metabolic factors such as FFA on one hand and regulates glucose metabolism via insulin or IGFs on the other hand. Therefore, CTSD should be further investigated as a central metabolic regulator in the context of type 2 diabetes and potentially other metabolic diseases.
While in contrast to a previous study (12), we did not observe changes in plasma CTSD levels in type 2 diabetes patients, we observed that type 2 diabetes showed increased plasma CTSD activity, which also correlated metabolic parameters of type 2 diabetes. As starvation influences the secretion of lysosomal enzymes, one potential explanation for the lack of correlation with CTSD levels might be related to the fact that subjects in our study did not undergo overnight fasting prior to blood sampling (40, 41), and as such the differences in plasma CTSD levels were below detection levels. Another explanation for the lack of correlation between plasma CTSD levels and type 2 diabetes in the current study could be related to the known effect of estrogen in increasing CTSD expression (42) as the previous report included both males and females (12), whereas all the subjects in our study are males. It is also noteworthy to mention that in our cohort, it cannot be completely excluded that the increase in CTSD activity is due to the presence of other diseases that coincide with type 2 diabetes (such as NAFLD). As plasma ALT levels, however, did not correlate with plasma CTSD activity (data not shown), it seems unlikely that the presence of NAFLD influenced our results.
In the current study, the identification of CTSD as a metabolic regulator might have implications for improving type 2 diabetes treatment. While a variety of drugs have currently been developed to treat type 2 diabetes (43–45), they are often featured by high costs and/or serious sides effects (43). Considering its functions as a metabolic regulator, CTSD-related strategies to treat type 2 diabetes may provide a relevant alternative for these existing anti-diabetic agents. A previous study by our group demonstrated that inhibiting circulating CTSD activity reduces plasma insulin levels in steatotic rats (18), confirming the potential therapeutic value of directly targeting CTSD to improve insulin sensitivity. However, to fully disclose CTSD and related pathways as a new therapeutic alternative to treat type 2 diabetes, additional and larger cohorts are essential to verify these results, and more in depth investigation into the mechanisms of CTSD are necessary. Nevertheless, our observations implying the functional role of CTSD as a metabolic regulator holds clinical value as it can lead to new ways to treat type 2 diabetes.
Data Availability Statement
The raw data supporting the conclusions of this article will be made available by the authors, without undue reservation.
Ethics Statement
The studies involving human participants were reviewed and approved by: The ethical committee of VU University Medical Center. The patients/participants provided their written informed consent to participate in this study.
Author Contributions
RS-S and MT were responsible for concept and design of study and final review of manuscript. LD, TH, and YO were responsible for drafting of manuscript, data collection, statistical analysis, and critical review of manuscript. AB and BV were responsible for helping data collection and analysis. All authors contributed to the article and approved the submitted version.
Funding
This study is funded by the Dutch Organization for Scientific Research (NWO) (Vidi grant no. 016.126.327), ASPASIA (grant no. 015.008.043), TKI-LSH (grant no. 40-41200-98-9306) and VCK (grant no. Swu16.0057-VT), and by a grant from the Dutch Diabetes Foundation (Grant number 2000.00.025). LD is supported by the Chinese Scholarship Council with file number 201709110146.
Conflict of Interest
The authors declare that the research was conducted in the absence of any commercial or financial relationships that could be construed as a potential conflict of interest.
Acknowledgments
The authors would like to thank Jeannette Boerop for her data collection support and all subjects for their participation in the study.
Supplementary Material
The Supplementary Material for this article can be found online at: https://www.frontiersin.org/articles/10.3389/fendo.2020.575070/full#supplementary-material
Abbreviations
ALT, alanine transaminase; CTSD, Cathepsin D; FFA, free fatty acids; GGT, gamma glutamyl transferase; HDL, high-density lipoproteins; LDL, lowdensity lipoproteins; TG, triglycerides.
References
1. Piemonte L. Type 2 diabetes. International Diabetes Federation (2019) Available at: https://idf.org/52-about-diabetes.html.
2. DeFronzo RA, Ferrannini E, Groop L, Henry RR, Herman WH, Holst JJ, et al Type 2 diabetes mellitus. Nat Rev Dis Primers (2015) 1:1–22. doi: 10.1038/nrdp.2015.39
3. Lebovitz HE. Insulin resistance: definition and consequences. Exp Clin Endocrinol Diabetes (2001) 109 Suppl 2:S135–48. doi: 10.1055/s-2001-18576
4. Engin A. The Pathogenesis of Obesity-Associated Adipose Tissue Inflammation. Adv Exp Med Biol (2017) 960:221–45. doi: 10.1007/978-3-319-48382-5_9
5. Petty HR. Frontiers of Complex Disease Mechanisms: Membrane Surface Tension May Link Genotype to Phenotype in Glaucoma. Front Cell Dev Biol (2018) 6:32. doi: 10.3389/fcell.2018.00032
6. Magtanong L, Ko PJ, Dixon SJ. Emerging roles for lipids in non-apoptotic cell death. Cell Death Differ (2016) 23(7):1099–109. doi: 10.1038/cdd.2016.25
7. Kornfeld S. Trafficking of lysosomal enzymes in normal and disease states. J Clin Invest (1986) 77(1):1–6. doi: 10.1172/JCI112262
8. Shen D, Wang X, Li X, Zhang X, Yao Z, Dibble S, et al. Lipid storage disorders block lysosomal trafficking by inhibiting a TRP channel and lysosomal calcium release. Nat Commun (2012) 3:731. doi: 10.1038/ncomms1735
9. Li W, Yuan XM, Olsson AG, Brunk UT. Uptake of oxidized LDL by macrophages results in partial lysosomal enzyme inactivation and relocation. Arterioscler Thromb Vasc Biol (1998) 18(2):177–84. doi: 10.1161/01.ATV.18.2.177
10. Walenbergh SM, Houben T, Rensen SS, Bieghs V, Hendrikx T, Van Gorp PJ, et al. Plasma cathepsin D correlates with histological classifications of fatty liver disease in adults and responds to intervention. Sci Rep (2016) 6:38278. doi: 10.1038/srep38278
11. Hoppe G, O'Neil J, Hoff HF, Sears J. Products of lipid peroxidation induce missorting of the principal lysosomal protease in retinal pigment epithelium. Biochim Biophys Acta (2004) 1689(1):33–41. doi: 10.1016/j.bbadis.2004.01.004
12. Liu L, Chen B, Zhang X, Tan L, Wang DW. Increased Cathepsin D Correlates with Clinical Parameters in Newly Diagnosed Type 2 Diabetes. Dis Markers (2017) 2017:5286408. doi: 10.1155/2017/5286408
13. Nowak C, Sundström J, Gustafsson S, Giedraitis V, Lind L, Ingelsson E, et al. Protein Biomarkers for Insulin Resistance and Type 2 Diabetes Risk in Two Large Community Cohorts. Diabetes (2016) 65(1):276–84. doi: 10.2337/db15-0881
14. Walenbergh SM, Houben T, Hendrikx T, Jeurissen ML, van Gorp PJ, Vreugdenhil AC, et al. Plasma cathepsin D levels: a novel tool to predict pediatric hepatic inflammation. Am J Gastroenterol (2015) 110(3):462–70. doi: 10.1038/ajg.2015.29
15. Benes P, Vetvicka V, Fusek M. Cathepsin D–many functions of one aspartic protease. Crit Rev Oncol Hematol (2008) 68(1):12–28. doi: 10.1016/j.critrevonc.2008.02.008
16. Marunaka Y. Roles of interstitial fluid pH in diabetes mellitus: Glycolysis and mitochondrial function. World J Diabetes (2015) 6(1):125–35. doi: 10.4239/wjd.v6.i1.125
17. Nerurkar MA, Satav JG, Katyare SS. Insulin-dependent changes in lysosomal cathepsin D activity in rat liver, kidney, brain and heart. Diabetologia (1988) 31(2):119–22. doi: 10.1007/BF00395559
18. Princy Khurana TY, Goyal S, Dolas A, Houben T, Oligschlaeger Y, Agarwal AK, et al. Inhibiting Extracellular Cathepsin D Reduces Hepatic Steatosis in Sprague–Dawley Rats. Biomolecules (2019) 9(5):171. doi: 10.3390/biom9050171
19. Tushuizen ME, Pouwels PJ, Bontemps S, Rustemeijer C, Matikainen N, Heine RJ, et al. Postprandial lipid and apolipoprotein responses following three consecutive meals associate with liver fat content in type 2 diabetes and the metabolic syndrome. Atherosclerosis (2010) 211(1):308–14. doi: 10.1016/j.atherosclerosis.2010.02.002
20. Fura A, Harper TW, Zhang H, Fung L, Shyu WC. Shift in pH of biological fluids during storage and processing: effect on bioanalysis. J Pharm BioMed Anal (2003) 32(3):513–22. doi: 10.1016/S0731-7085(03)00159-6
21. Gonzalez-Covarrubias V, Thomas Hankemeier AD, Vreeken RJ. The influence of citrate, EDTA, and heparin anticoagulants to human plasma LC–MS lipidomic profiling. Metabolomics (2013) 9:337–48. doi: 10.1007/s11306-012-0450-4
22. Delarue J, Magnan C. Free fatty acids and insulin resistance. Curr Opin Clin Nutr Metab Care (2007) 10(2):142–8. doi: 10.1097/MCO.0b013e328042ba90
23. Houben T, Oligschlaeger Y, Hendrikx T, Bitorina AV, Walenbergh SM, van Gorp PJ, et al. Cathepsin D regulates lipid metabolism in murine steatohepatitis. Sci Rep (2017) 7(1):3494. doi: 10.1038/s41598-017-03796-5
24. Ding L, Goossens GH, Oligschlaeger Y, Houben T, Blaak EE, Shiri-Sverdlov R. Plasma cathepsin D activity is negatively associated with hepatic insulin sensitivity in overweight and obese humans. Diabetologia (2020) 63(2):374–84. doi: 10.1007/s00125-019-05025-2
25. Rochefort H, Garcia M, Glondu M, Laurent V, Liaudet E, Rey JM, et al. Cathepsin D in breast cancer: mechanisms and clinical applications, a 1999 overview. Clin Chim Acta (2000) 291(2):157–70. doi: 10.1016/S0009-8981(99)00226-0
26. Di Domenico F, Tramutola A, Perluigi M. Cathepsin D as a therapeutic target in Alzheimer’s disease. Expert Opin Ther Targets (2016) 20(12):1393–5. doi: 10.1080/14728222.2016.1252334
27. DiCiccio JE, Steinberg BE. Lysosomal pH and analysis of the counter ion pathways that support acidification. J Gen Physiol (2011) 137(4):385–90. doi: 10.1085/jgp.201110596
28. Aoi W, Marunaka Y. Importance of pH homeostasis in metabolic health and diseases: crucial role of membrane proton transport. BioMed Res Int (2014) 2014:598986. doi: 10.1155/2014/598986
29. Sumi S, Mineo I, Kono N, Shimizu T, Nonaka K, Tarui S. Decreases in hepatic fructose-2,6-bisphosphate level and fructose-6-phosphate,2-kinase activity in diabetic mice: a close relationship to the development of ketosis. Biochem Biophys Res Commun (1984) 120(1):103–8. doi: 10.1016/0006-291X(84)91419-0
30. Glunde K, Guggino SE, Solaiyappan M, Pathak AP, Ichikawa Y, Bhujwalla ZM. Extracellular acidification alters lysosomal trafficking in human breast cancer cells. Neoplasia (2003) 5(6):533–45. doi: 10.1016/S1476-5586(03)80037-4
31. Halaby R. Role of lysosomes in cancer therapy. Res Rep Biol (2015) 6:147–55. doi: 10.2147/RRB.S83999
32. Halcrow P, Datta G, Ohm JE, Soliman ML, Chen X, Geiger JD. Role of endolysosomes and pH in the pathogenesis and treatment of glioblastoma. Cancer Rep (2019) 2(6):1–7. doi: 10.1002/cnr2.1177
33. Achour O, Bridiau N, Kacem M, Delatouche R, Bordenave-Juchereau S, Sannier F, et al. Cathepsin D activity and selectivity in the acidic conditions of a tumor microenvironment: Utilization in the development of a novel Cathepsin D substrate for simultaneous cancer diagnosis and therapy. Biochimie (2013) 95(11):2010–7. doi: 10.1016/j.biochi.2013.07.010
34. Zhao N, Ma L, Bai S, Wang C. Correlation of blood glucose level and blood pH value with cardiac enzyme, amylase and other markers in patients with diabetic ketoacidosis. Int J Clin Exp Med (2018) 11(9):10208–14.
35. Yasuda K, Hayashi M, Murayama M, Yamakita N. Acidosis-Induced Hypochloremic Alkalosis in Diabetic Ketoacidosis Confirmed by The Modified Base Excess Method. J Clin Endocrinol Metab (2016) 101(6):2390–5. doi: 10.1210/jc.2016-1324
36. Meisner H, Tenney K. pH as an indicator of free fatty acid release from adipocytes. J Lipid Res (1977) 18(6):774–6.
37. Samovski D, Dhule P, Pietka T, Jacome-Sosa M, Penrose E, Son NH, et al. Regulation of Insulin Receptor Pathway and Glucose Metabolism by CD36 Signaling. Diabetes (2018) 67(7):1272–84. doi: 10.2337/db17-1226
38. Friedrich N, Thuesen B, Jørgensen T, Juul A, Spielhagen C, Wallaschofksi H, et al. The association between IGF-I and insulin resistance: a general population study in Danish adults. Diabetes Care (2012) 35(4):768–73. doi: 10.2337/dc11-1833
39. Casellas A, Mallol C, Salavert A, Jimenez V, Garcia M, Agudo J, et al. Insulin-like Growth Factor 2 Overexpression Induces beta-Cell Dysfunction and Increases Beta-cell Susceptibility to Damage. J Biol Chem (2015) 290(27):16772–85. doi: 10.1074/jbc.M115.642041
40. Dimond RL, Burns RA, Jordan KB. Secretion of Lysosomal enzymes in the cellular slime mold, Dictyostelium discoideum. J Biol Chem (1981) 256(13):6565–72.
41. Settembre C, Fraldi A, Medina DL, Ballabio A. Signals from the lysosome: a control centre for cellular clearance and energy metabolism. Nat Rev Mol Cell Biol (2013) 14(5):283–96. doi: 10.1038/nrm3565
42. Ruibal A, Herranz M, Arias JI. Clinical and Biological Significance of Cathepsin D Levels in Breast Cancer Cytosol in Women Over 70 years. Biomark Cancer (2012) 4:1–6. doi: 10.4137/BIC.S9096
43. Marín-Peñalver JJ, Martín-Timón I, Sevillano-Collantes C, Del Cañizo-Gómez FC. Update on the treatment of type 2 diabetes mellitus. World J Diabetes (2016) 7(17):354–95. doi: 10.4239/wjd.v7.i17.354
44. Kahn CR, Chen L, Cohen SE. Unraveling the mechanism of action of thiazolidinediones. J Clin Invest (2000) 106(11):1305–7. doi: 10.1172/JCI11705
Keywords: insulin resistance, metabolism, plasma cathepsin D activity, plasma levels of cathepsin D, plasma pH, type 2 diabetes
Citation: Ding L, Houben T, Oligschlaeger Y, Bitorina AV, Verwer BJ, Tushuizen ME and Shiri-Sverdlov R (2020) Plasma Cathepsin D Activity Rather Than Levels Correlates With Metabolic Parameters of Type 2 Diabetes in Male Individuals. Front. Endocrinol. 11:575070. doi: 10.3389/fendo.2020.575070
Received: 22 June 2020; Accepted: 11 September 2020;
Published: 30 September 2020.
Edited by:
Ondřej Šeda, Charles University, CzechiaReviewed by:
Marcia Hiriart, National Autonomous University of Mexico, MexicoBrian T. O’Neill, The University of Iowa, United States
Copyright © 2020 Ding, Houben, Oligschlaeger, Bitorina, Verwer, Tushuizen and Shiri-Sverdlov. This is an open-access article distributed under the terms of the Creative Commons Attribution License (CC BY). The use, distribution or reproduction in other forums is permitted, provided the original author(s) and the copyright owner(s) are credited and that the original publication in this journal is cited, in accordance with accepted academic practice. No use, distribution or reproduction is permitted which does not comply with these terms.
*Correspondence: Ronit Shiri-Sverdlov, r.sverdlov@maastrichtuniversity.nl; Maarten E. Tushuizen, M.E.Tushuizen@lumc.nl
†These authors share last authorship