Mapping urban heatwaves and islands: the reverse effect of Salento’s “white cities”
 Stefano De Razza
 Carlo Zanetti
 Massimo De Marchi
 Salvatore Eugenio Pappalardo
- 1Laboratory GIScience and Drones for Good, Department of Civil, Environmental and Architectural Engineering (ICEA), University of Padua, Padua, Italy
- 2Department of Civil, Architectural and Environmental Engineering, School of Engineering, University of Padua, Padua, Italy
- 3Antonio Papisca Human Rights Centre, University of Padua, Padua, Italy
Extreme events related to climate change are increasing in intensity, frequency, and duration worldwide. Europe is identified as a heatwave hotspot, with trends three-to-four time faster than the northern mid-latitudes; effects of heatwaves are combined in urban contexts with the heat island phenomenon, making cities critical for climate risk prevention and management. Land surface temperature represents an essential parameter for assessing the intensity of thermal impact on urban ecosystems and on public health. This parameter is widely used to map and assess urban heat islands in light to support climate-resilient adaptation planning. The general aim of this study is to assess urban heat island intensity, during a significant heatwave, in a critical heat-related risk region in Southern Italy (Salento). Specific objectives are 1) assessing climate change trends for heat-related extremes (hot days and heatwaves), 2) calculating urban heat islands intensity at regional and urban scale, 3) assessing spatial relationships among thermal intensity and urban characteristics (soil sealing and surface albedo). Identification of heatwaves is based on climatological data and statistical analyses; spatial thermal analyses and correlations are based on Landsat-8 imagery while land cover data are derived from ortho-photos. Climate analyses show a notable increase of the maximum annual temperature of 0.5°C per decade, with an increase of eight hot days per decade. Spatial analyses on thermal impact highlight that urban heat island intensity is much lower within cities and towns than in rural areas, showing a “reverse effect” compared to the typical microclimatic characteristics of urban contexts. In fact, thermal intensity in the city of Lecce ranges from −11°C to 5.6°C. Also, by NDVI analyses, we found that permeable surfaces were 2°C higher than impermeable surfaces, with statistically significant differences. Results from albedo analysis suggest that the characteristics of building material in historical sectors of cities may play a crucial role in this “reverse effect” of urban heat islands. Further studies are required to better investigate the contribution of different factors in this context.
1 Introduction
1.1 Climate extremes in urban areas: heatwaves and urban heat islands
Heatwave events are commonly described as a series of unusual continuative hot days relative to local meteorological conditions, which usually last over a region from few days to few weeks, with thermal conditions above established thresholds (Robinson, 2001; Meehl and Tebaldi, 2004; Kuchcik, 2006; WMO, 2020; Sharma et al., 2022). Due to the incessant emission of greenhouse gases in atmosphere, human-induced global warming is increasing in magnitude, frequency, and duration of heatwaves (HWs) (Wehrli et al., 2019; Perkins-Kirkpatrick and Lewis, 2020). In fact, climate extremes during HWs globally increased in recent decades showing differentiated trends in different geographical areas. During the summer season, HWs drive relevant socio-environmental and economic impacts, jeopardizing local hydrological cycles, urban vegetation, and agro-ecosystems as well as energy supply systems (Christidis et al., 2015; Singh et al., 2019). Furthermore, it is widely documented the negative effects of HWs on public health with a significant increase in mortality and morbidity, especially of the more vulnerable people (Oudin Åström et al., 2015; Romanello et al., 2021; The Lancet, 2021). According to the World Health Organization (WHO) from 1997 to 2017, 166,000 people died due to extreme temperature (WHO, 2018). During summer 2022 a series of extreme heatwaves hit Europe, resulting in more than 60,000 excess deaths, among which 18,000 occurred in Italy (Ballester et al., 2023; Li et al., 2023).
Urban Heat Waves (HWs) can intensify significantly in cities due to factors like land use, morphology, albedo, and local meteorological conditions. Urban environments combine impermeable surfaces (like concrete and asphalt) with permeable ones (vegetated or bare soils). Impermeable surfaces, with varying thermal capacities, are generally more prone to absorbing solar radiation and maintaining heat, making densely populated cities from 5°C to 10°C warmer than surrounding rural areas (Spano et al., 2020). This temperature difference, known as the Urban Heat Island (UHI) effect, affects urban climates through thermodynamic processes on urban boundary layers (Oke, 1978; Kim and Brown, 2021). The UHI effect is linked to factors such as: 1) the inner city’s size and building types; 2) the size, typology, and distribution of green spaces; 3) the percentage of impermeable surfaces, urban morphology, and population density; 4) the city’s geographical location, climatic conditions, and seasonal variations; 5) topographical features (Oke, 1982; Mohajerani et al., 2017; Sangiorgio et al., 2020; Todeschi et al., 2022a; Pappalardo et al., 2023).
As cities are the most affected territories from UHI and HWs combined and approximately three-quarters of the European population live in cities, mitigation measures are essential to minimize the impacts of these climate extremes (Naumann et al., 2020). Mitigation measures have been studied and implemented over the years, with many research focused on the albedo, permeability, building density, and water retention of urban pavements, as these properties have a significant impact on surface temperature (Mohajerani et al., 2017). Studies underscore the efficacy of increasing the albedo of urban surfaces, like rooftops and pavements, to markedly reduce temperatures (Santamouris and Fiorito, 2021). Specifically, Hamoodi et al. (2019) identified a correlation between surface temperature and surface albedo, indicating a noteworthy inverse relationship across various urban Land Use/Land Cover (LULC) surfaces. High albedo materials, reflecting radiation back to the atmosphere, have been approved as an effective strategy to reduce heat intensity in UHIs (Hayes et al., 2022). This cooling effect is especially important in cities with hot summers at mid-latitudes. However, the magnitude of the temperature decrease generated by albedo change varies significantly between cities and is dependent on several parameters (Sadiq Khan et al., 2023). In addition, urban green spaces such as grasslands and trees play a vital role by controlling soil temperature through evapotranspiration, reflection and shading (Souch and Souch, 1993; Armson et al., 2012). Evaporative cooling holds promise for future sustainable urban expansion, contributing to carbon-neutrality and providing many benefits to city dwellers (World Bank, 2022).
Land Surface Temperature (LST) is a fundamental parameter for studying climate change impacts on the territory and for monitoring temperature anomalies across various scales. LST has been extensively used as indicator for UHI research since it permits a more detailed level of study compared to observations made by meteorological stations that monitor the temperature close to the surface. Since thermal remote sensing from space has advanced, satellite data provide the sole way to examine UHI with high temporal and spatial resolution (Weng, 2009). The satellite technology appears to be widely applied supporting techniques in studying the LST, since it can be measured by remotely sensed thermal infrared data (Quattrochi and Luvall, 1999; Jimenez-Munoz et al., 2014; Wang et al., 2015). The most applied satellite platforms to study LST are Landsat, Sentinel, MODIS, and ASTER (Wulder et al., 2016). In particular, the Landsat Program was the first to use a global image acquisition strategy (de Almeida et al., 2021). The first Surface Urban Heat Islands observations (from satellite-based sensors) were reported by Rao (1972). Many other authors have documented the use of satellite remote sensing to assess LST and UHI spatial and temporal variability, proposing different algorithms and methods. Researchers have delved into the unique characteristics of large cities, examining the factors influencing temperature fluctuations within their urban environments (Tran et al., 2006; Imhoff et al., 2010; Yue et al., 2019). Simultaneously, attention has been extended to medium and small cities, acknowledging that UHI effects may manifest differently in urban areas of varying sizes (Du et al., 2021). However, there remains a notable gap in the existing body of research, particularly in the context of medium-sized cities within the Mediterranean region. The general aim of this study is to assess UHI intensity during a significant HW, in a critical heat-related risk region in Salento (Southeast Italy), by modelling Landsat-8 satellite imagery in GIS environment. Specific objectives are the following: 1) assessing climate change trends for heat-related extremes (hot days and HWs), 2) calculating UHI intensity at regional and urban scale, 3) assessing spatial relationships among thermal intensity and urban characteristics such as soil sealing and surface albedo.
2 Data and methods
2.1 Study area
The study is framed on two scales of analyses: on the whole Province of Lecce and within the Municipality of Lecce which is located in the middle of the Salento peninsula, in south-eastern Italy. With an area of over 2.798,8 km2, the Province of Lecce is one of the most populous and densely populated provinces in Southern Italy, with a settlement system characterised by the presence of numerous small towns with unique architectural features, including the use of local limestone, which has a light colour that reflects sunlight and contributes to the perception of these cities as “white cities” (Figure 1A). This region was chosen as a case study located within a hot-summer Mediterranean climate (Csa), according to the Köppen classification (Kottek et al., 2006). With an annual precipitation average of 650 mm, most of the rainfall occurs between January and March, as well as in the autumn months (Martano et al., 2015). Conversely, July and August are typically the hottest and driest months of the year. The seasonal distribution of precipitation significantly influences land use and land cover: the Combined Drought Indicator (CDI) as implemented in the Copernicus European Drought Observatory (EDO) consistently classified the majority of the area as “alert” throughout the summer of 2022. This classification indicates that vegetation and crops were affected by both precipitation and soil moisture deficits, resulting in a deficit in photosynthetic activity (Toreti et al., 2022). At the city scale, the research focuses on a circular buffer zone with a diameter of 9 km centred at the geographical centre of Lecce (Figure 1B). A climate investigation for a medium-sized Mediterranean city is essential since urban climate studies are limited in such cities. According to a recent study from Ballester et al. (2023), the cumulative relative risk of death during the series of HWs of summer 2022 was > 1.18 (unitless), the highest value ranked in Europe.
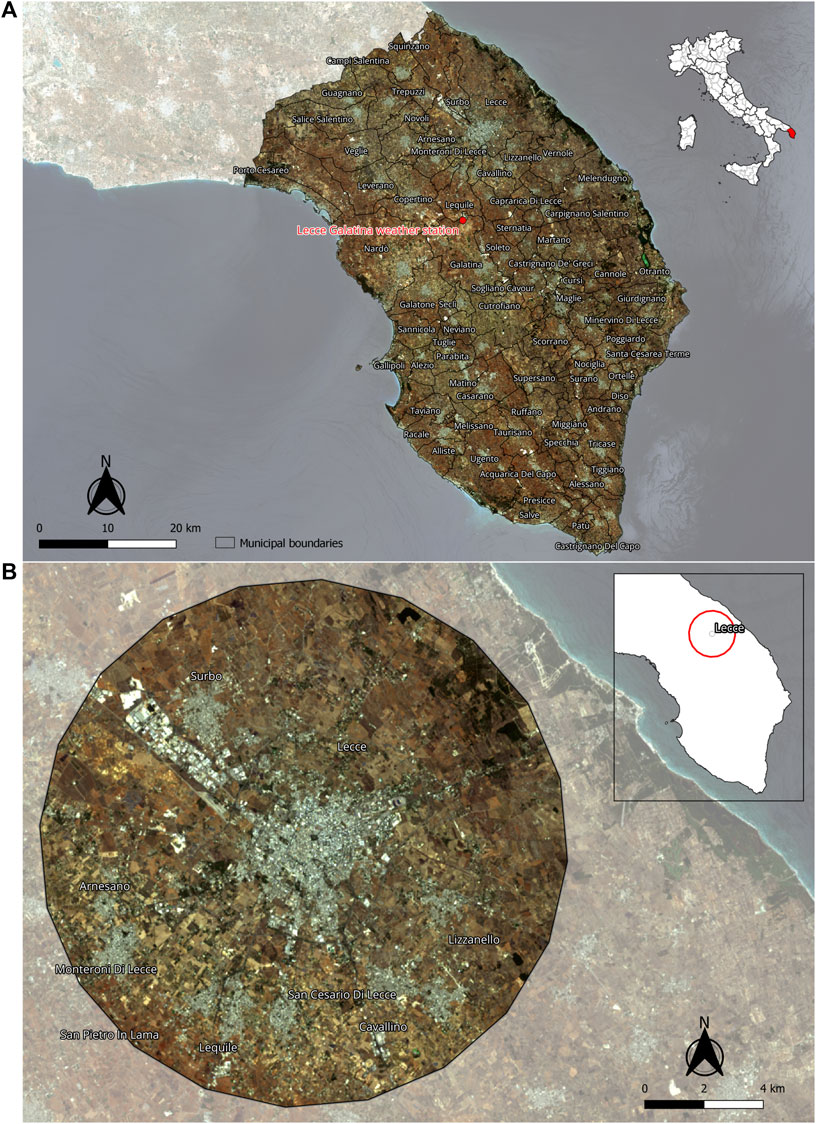
Figure 1. Study Area. (A) The Province of Lecce. (B) Buffer zone.
2.2 Weather data and urban heat island analysis
To assess climate change trends and to identify HWs periods we used the daily maximum temperatures from 1992 to 2022. The meteorological data were collected from the official Lecce Galatina weather station and made available online by the National Center for Environmental Information (NCEI) of NOAA. HWs can be defined in a variety of ways. In this study, they were statistically defined by the formula from Russo et al. (2014) using the mentioned reference period of 31 years. This methodology identifies a period of HW if the daily maximum air temperature of the day exceeds the threshold for at least 3 consecutive days, where the threshold is the 90th percentile of the daily maximum temperature, centred on a 31-day window, as defined in Eq. 1:
Where:
−
−
−
2.3 Land cover data
The Corine Land Cover (CLC) land use geodatabase is derived from orthophotos acquired in 2011 with a minimum mapping unit of 0.25 ha, downloaded from the Apulia Region website (Regione Puglia). The CLC geodatabase includes different land use and land cover classes: artificial areas, agricultural areas, forest and seminatural areas, wetlands, and water bodies. Additionally, the 2021 National Land Use raster Map provided by the “Istituto Superiore per la Protezione e la Ricerca Ambientale” (ISPRA) is used to identify permeable and impermeable surfaces. By using this data we performed the correlation analysis among typology of surfaces, LST and SA values.
2.4 Landsat-8 image processing: from digital number to land surface temperature calculation
Landsat-8 was launched on 11 February 2013 with two Earth imaging sensors on-board: the Operational Land Imager (OLI) and the Thermal Infrared Sensor (TIRS). The OLI measures in the visible, near infrared, and shortwave infrared portions (VNIR, NIR, and SWIR) of the spectrum. The TIRS measures land surface temperature in two high resolution (near to 100 m) thermal bands (band 10, 11) (USGS). Multispectral remote sensing imagery of the Salento Peninsula was provided by the United States Geological Survey (USGS) and downloaded from the official geoplatform EarthExplorer (USGS). In this work, Landsat-8 scene was acquired from USGS database for 24th July 2022, at 9:29 UTC, when the maximum air temperature recorded at the Lecce Galatina weather station was 37.6°C. This day coincided with a heat wave period and presented a clear sky, an essential condition that must be fulfilled to avoid anomalies in the measurement of surface temperature. In order to determine the Land Surface Temperature (LST), several parameters must first be obtained. The first step is to convert Digital Number (DN) values to Top Of Atmosphere (TOA) Reflectance (for bands 2, 3, 4, 5, 6, 7) by using the semi-automatic classification plugin on QGIS, and to TOA Radiance (for band 10) using the RS&GIS plugin. The Brightness Temperature (BT) (Eq. 2), the Normalized Difference Vegetation Index (NDVI) (Eq. 3), the Proportional Vegetation (P
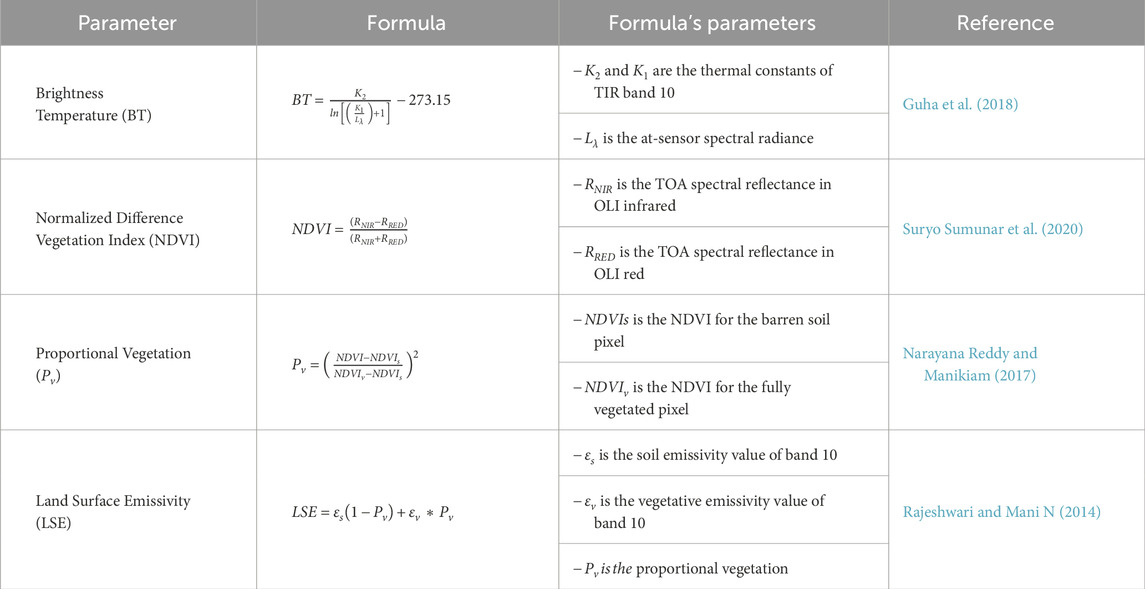
Table 1. Necessary parameters for the land surface temperature calculation.
Where:
− BT is at-sensor brightness temperature (°C);
− 𝜆 is the wavelength of emitted radiance (𝜆 = 10.895 μm);
− LSE is the emissivity;
− 𝜌 = (h *
LST is expressed in degree centigrade.
2.5 Urban heat island intensity analysis
The thermal anomaly analysis was carried out focusing on Lecce and its adjacent areas. To calculate the thermal anomaly among urban and rural areas we adopted the Oke (1978) methodology combined with a GIS-based approach. From the surface data described in paragraph 2.3, this research focused on the area contained between two circumferences of radius 3 km and 6 km and centred in the geographical centre of Lecce. Within this region, the area was further refined to the only non-urbanised surfaces with their centre point at a minimum of 100 m away from every artificial surface (Todeschi et al., 2022b). The areas that satisfy this condition are then sampled at their centre point by calculating the temperature difference (∆LST) as the difference between the LST value from (Eq. 2) and the average temperature value of pixels located in non-urban areas.
2.6 Image processing: surface albedo
Albedo represents the ability to reflect solar radiation (Sangiorgio et al., 2020) varies between 0 and 1 (the more reflective a surface is the higher the albedo value). The surface albedo (SA) can be estimated using Eq. 3 (Cunha et al., 2020):
Where:ρ are the surface bidirectional reflectance values; b are the corresponding conversion coefficients (Table 2).

Table 2. Band conversion coefficients of Landsat-8.
To perform the SA analysis, a threshold for neglecting the effects of vegetation was applied to the NDVI values, and only pixels with values < 0.3 were selected (Bonafoni et al., 2017). This is done to ignore the opposite effect of evapotranspiration of vegetation on the albedo values.
2.7 Processing data
In this study, climate analyses for HWs detection were conducted using R 4.2.2 software and RStudio interface. Simultaneously, satellite data were modelled and geovisualised in an open-source GIS ecosystem (QGIS, v. 3.28.2), while processing of satellite imagery was processed through the same R 4.2.2 software and RStudio interface. The methodological approach employed in this work is easily reproducible and applicable for analysing similar contexts, given its reliance on an open-source and open data workflow (Figure 2).
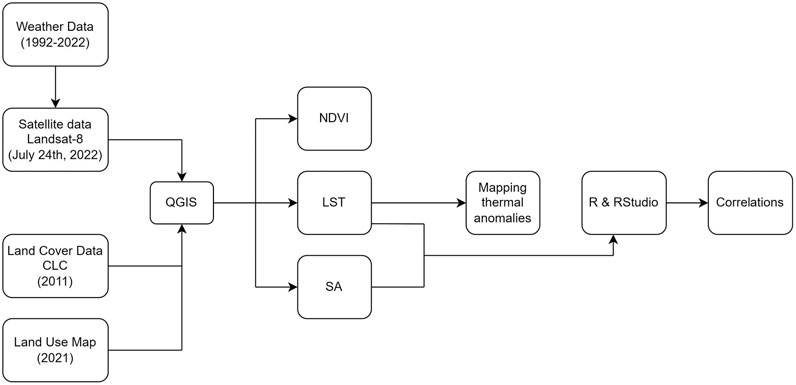
Figure 2. Flowchart of the methodology.
3 Results and discussion
This section consists of different subsections: firstly, HWs were identified by climate analysis; later, by following steps and phases from the illustrated workflow (Figure 2), LST analyses were performed to identify thermal hotspots and exploring potential relationships among thermal intensity with impermeable surfaces and albedo properties.
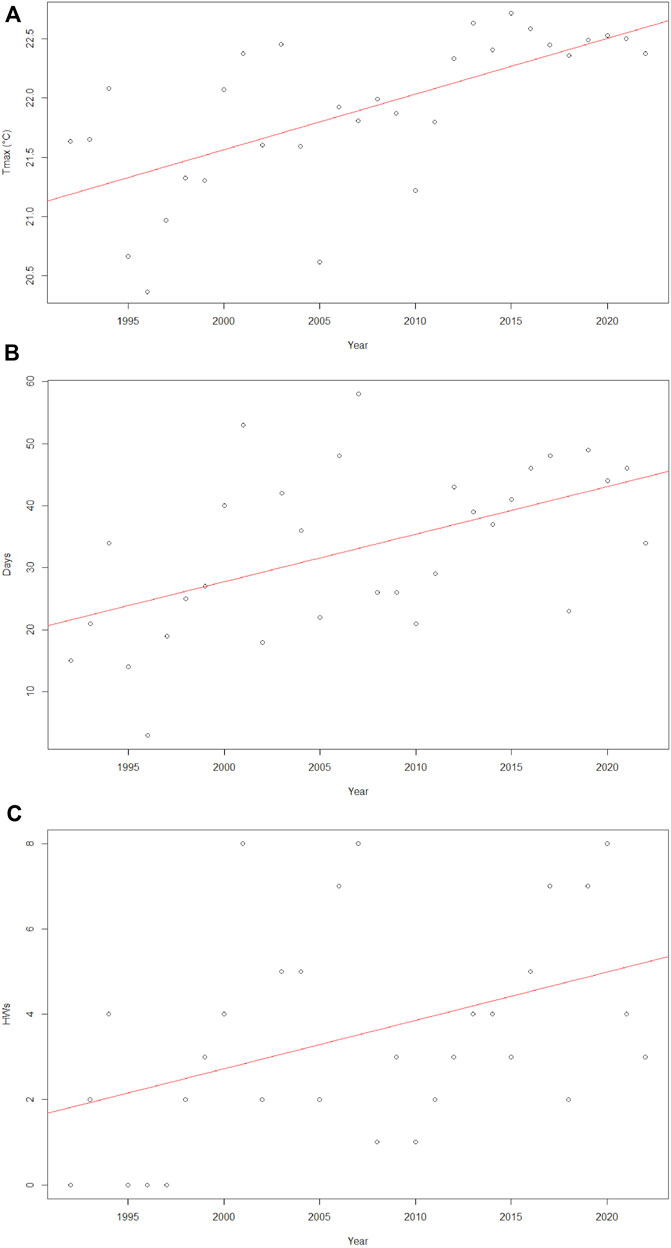
Figure 3. Climate analysis, temperatures were recorded at the Lecce Galatina weather station from 1992 to 2022. (A) Average of the maximum annual temperatures. (B) Number of days per year on which the temperature exceeds the defined threshold. (C) Number of annual HWs lasting more than 3 days.
3.1 Climate analysis
The return time for heatwave events has been estimated to shift from twice a century in the early 2000s to twice a decade (Christidis et al., 2015). According to Rousi et al. (2022), Europe is a HW hotspot, experiencing a frequency acceleration three-to-four times faster than the rest of the northern mid-latitudes over the past 42 years.
The ordinary least square (OLS) regression of the average annual maximum temperatures recorded at the Lecce Galatina weather station from 1992 to 2022 shows a significant increase in the average maximum temperatures over the period considered (y = 0.0469x - 72.335, R2 = 0.4392, p-value = 4.868e-05, min = 20.36°C, max = 22.71°C), by a slope of +0.47°C per decade (Figure 3A). From 2012 to 2022, the annual average maximum temperature always exceeds the value of 22°C. The number of days per year on which the threshold value defined in Formula 1 is exceeded is presented in Figure 3B and a statistically significant increasing trend can be observed (y = 0.7681x - 1508.5, R2 = 0.2774, p-value = 0.002336, min = 3, max = 58). This analysis quantifies the increase of hot days of about 8 days per decade. The number of HWs lasting at least 3 days is shown in Figure 3C and a statistically significant trend can be found also in this case (y = 0.1133x - 223.89, R2 = 0.1752, p-value = 0.01911, min = 0, max = 8). According to the recorded values, three HWs hit this area in 2022, from 4th January to the 6th, from 4th June to the 7th and from 23rd July to the 26th.
3.2 Normalized difference vegetation index
In general, NDVI values range from −1 to 0 for water bodies, −0.1 to 0.1 for bare or sandy land, 0.2 to 0.5 for mixed vegetation or degraded soil, shrubs or grass crops and from 0.6 to 1.0 for dense vegetation (Kshetri, 2018). The map of NDVI in the Salento area is presented in Figure 4A. NDVI values range between −0.58 and 0.80. Poorly densely green areas such as urban areas or bare soil regions are characterised by low NDVI values (NDVI < 0.2). They can be identified as brown in the image by a true colour band composition while highly vegetated regions (NDVI > 0.6) are green. NDVI value is lower in the north-western part of the region, as it is characterised by sparse vegetation in summer months. In many areas it is difficult to distinguish between built-up and vegetated areas as they both have similar values. Vegetation seems to be prevalently present in coastal areas, where the climatic conditions are more appealing to the flourishing growth of flora. The sparse presence of vegetation in the area indicates a hot and extremely dry summer. Drought affects vegetative state by reducing the photosynthetic activity of plants (Yang et al., 2021), leading to a decline in crop productivity. In addition, forest ecologists have recognised that extreme drought conditions weaken and stress trees, making them more susceptible to insect attacks and diseases (Schlesinger et al., 2016); some studies show how the severe drought events that have hit the Salento area in recent years have contributed to a faster spread of the bacterium Xylella fastidiosa, which is responsible for the decline of olive tree plantations in the province of Lecce (Scortichini, 2022). As a result, many fields are expected to become uncultivated or openly exposed to direct solar radiation, therefore absorbing more solar radiation than vegetated areas (Ghosh and Das, 2018) and having a higher surface temperature (Ni et al., 2019).
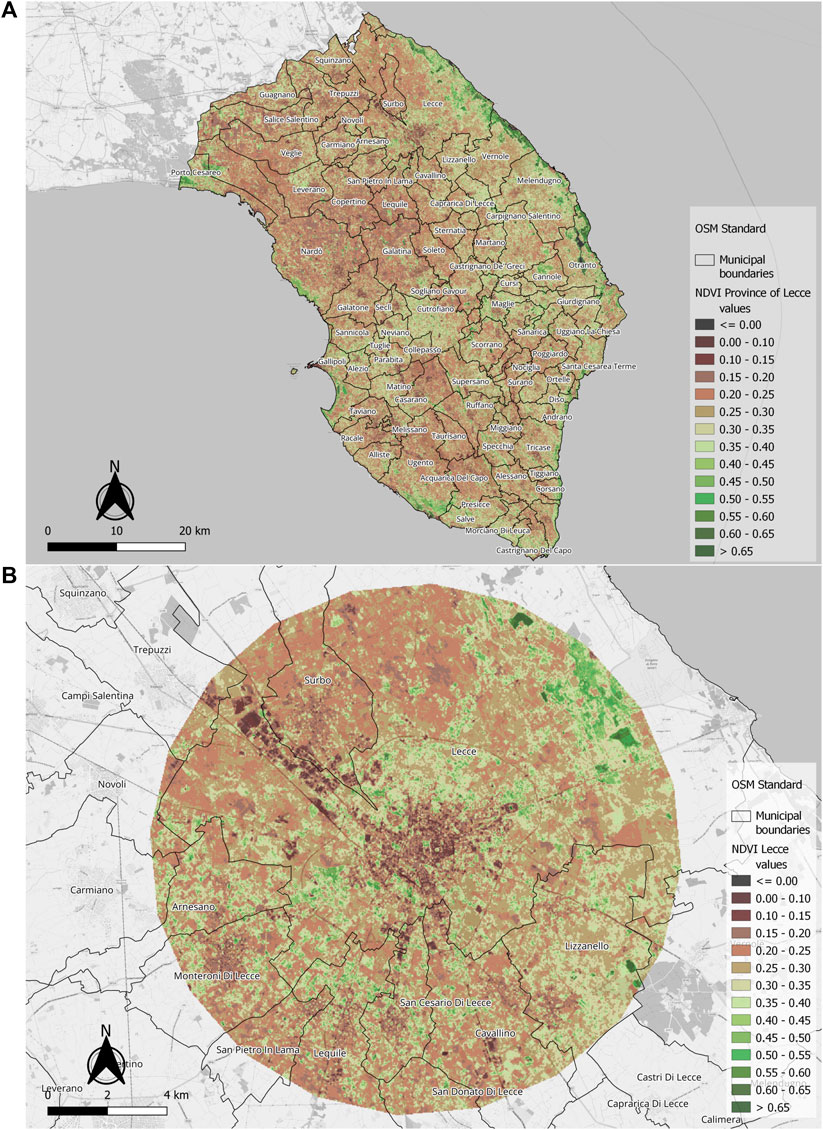
Figure 4. NDVI value detected on 24th July 2022. (A) NDVI value in the Province of Lecce. (B) NDVI value in Lecce.
At the city scale, NDVI values range from −0.11 to 0.74 (Figure 4B). The lowest values are found in urban areas, especially in the industrial north-west of the city, while the highest values are found in the heavily vegetated area on the north-eastern coastline.
3.3 Land surface temperature analysis
LST analysis, at the province scale, shows that urban areas and anthropic impermeable surfaces generally present colder values compared to rural areas (Figure 5) during the HW on 24th July. This result is unexpected compared to most studies on UHI spatial variability reported in scientific literature (Pongrácz et al., 2010; Morabito et al., 2015; Halder et al., 2021; Mentaschi et al., 2022). In most cases, densely populated urban areas are significantly warmer than surrounding non-urbanised areas. In contrast, some studies showed that cities built in arid or desert-like environments may experience lower temperatures than surrounding areas, as the urban cores are greener than their surroundings (Parlow et al., 2012; Bounoua et al., 2015; Rasul et al., 2017). Numerous investigations have explored “Urban Cool Islands” across cities of varying climates and sizes, as detailed in Sadiq Khan et al. (2023). These studies unveiled a reverse UHI pattern in the BWh climate zone during summer daytime. Although research on Mediterranean cities has been relatively scarce, some instances of this phenomenon have been documented in Valencia, Spain (Lehoczky et al., 2017), and Thessaloniki, Greece (Giannaros and Melas, 2012). It is essential to underscore that the presence of a “cool island” is more commonly observed around midday, when solar radiation dominates the surface energy budget. The estimated temperature values in the entire provincial area range from 27.54°C to 50.98°C. Low values are found mainly in densely vegetated areas, on the coast and in urban centres, while the central area of the province, with lesser influence from maritime winds, experiences higher temperatures, with maximum temperature values corresponding to bare soils. Landscape metrics provide a way to understand the negative relationships between LST and both forested and high-albedo areas. Simultaneously, a positive correlation was observed between barren land and LST. Dry and bare soils have been associated to higher LST due to their low thermal inertia, as shown in Gago et al. (2020) in Seville, Spain, which indicated a positive relationship between mean LST and bare soil land. Thus, in areas with partial plant cover, thermal surface characteristics can have significant effects on LST measurements.
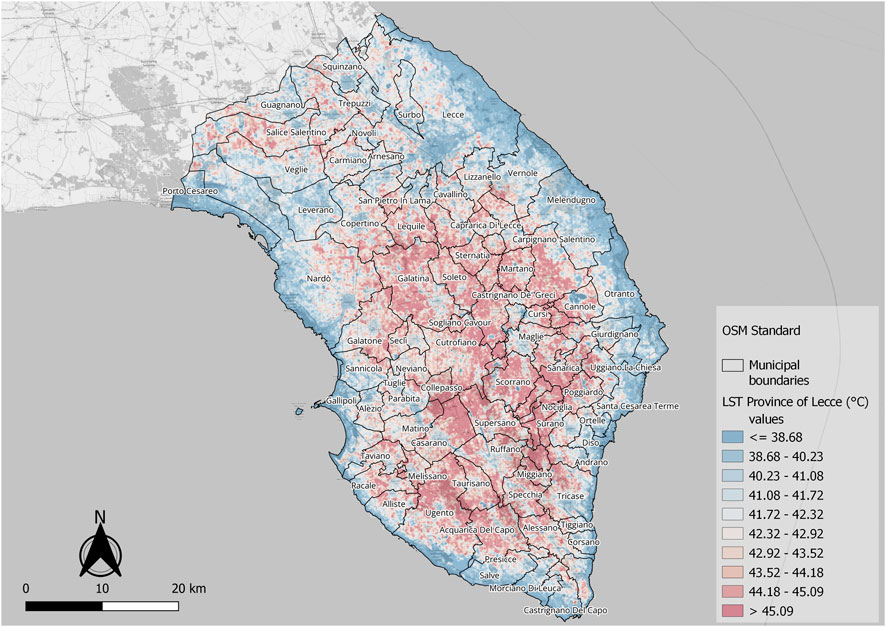
Figure 5. Spatial distribution of LST in the Province of Lecce detected on 24th July 2022.
The urban area around Lecce was therefore deeply investigated (Figure 6). The lowest LST value is 31.44°C, while the highest is 48.07°C. The lowest temperatures are detected in urban areas, especially in the historical centre of the city, in correspondence with urban parks and vegetated areas and along the vegetation in the north-western part of the examined area. Surprisingly, all the industrial areas of the city have low temperatures, with just few exceptions for metal or dark roofs.
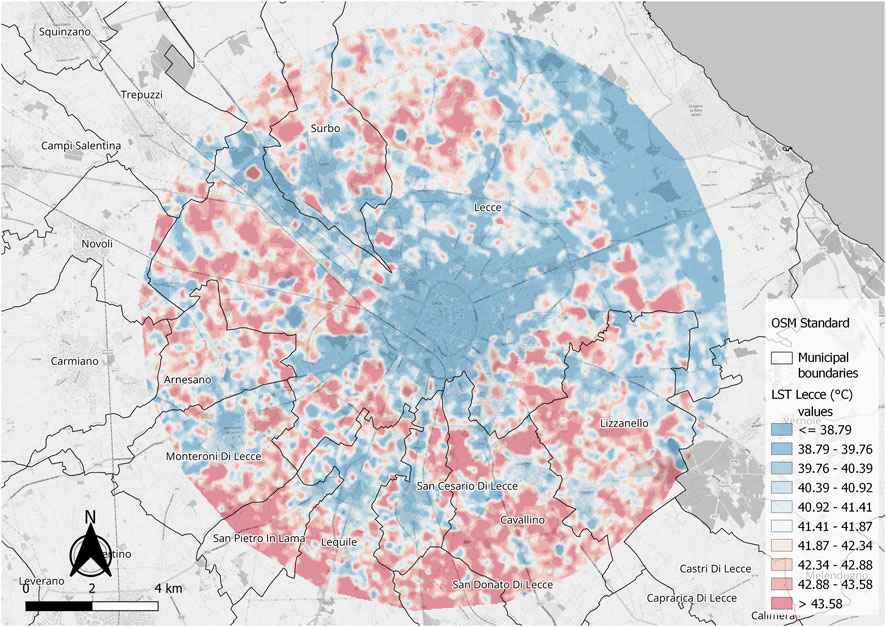
Figure 6. LST in Lecce detected on 24th July 2022.
We studied the behaviour of temperature as a function of the typology of land cover, considering the difference between impermeable and permeable surfaces. The box plot shown in Figure 7A shows that the average temperature measured on impermeable surfaces was 40.32°C, 1.23°C lower than the 41.55°C value figured on permeable surfaces. It can clearly be seen that the LST corresponding to the impermeable surfaces tend to have low values. A Welch’s t-test confirmed a statistically significant difference between the two average values (p-value < 2.2e-16). To better analyse the relationships between LST and land cover, it was decided to exclude the pixels belonging to the permeable areas with NDVI values of less than 0.3, in order to avoid the cooling effect of these areas due to evapotranspiration. Below this threshold, the effects that vegetation has on temperature are considered negligible. It was found that about 63.3% of the non-urbanised soils have a NDVI value lower than the established threshold. This means that a large part of the ground is bare or sparsely vegetated. The box plot presented in Figure 7B shows that the average surface temperature determined in these areas is 42.25°C, which is almost 2°C higher than the average temperature determined for the urbanised areas. Also in this case, the two means show a statistically significant difference (Welch Two Samples t-test, p-value < 2.2e-16).
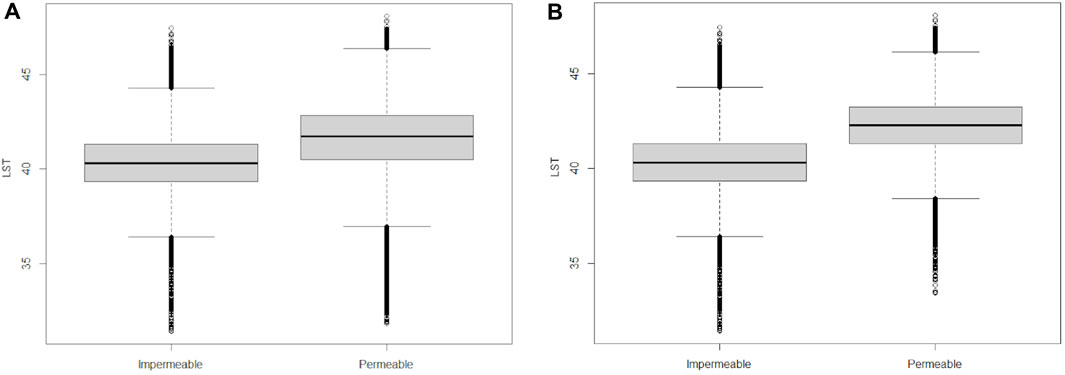
Figure 7. Box plot of type of surface and LST (°C). (A) Permeable surfaces include vegetation. (B) Permeable surfaces do not include vegetation.
3.4 Urban heat island intensity
To obtain a homogeneous distribution of pins within the circular crown around the urban area of Lecce, it was necessary to use a distance threshold of 100 m from urbanised areas, as mentioned in Section 2.5. 103 pins satisfied the conditions and are presented in Figure 8. Most of them fall in areas with very high values of LST (Figure 9). The average temperature at these points is 42.48°C, with a minimum of 36.39°C and a maximum of 46.85°C. The analysis of the pins allows the mapping of the thermal anomaly in the study area with a 100 m raster resolution (Figure 10). This analysis confirms the previously derived anomalous temperature behaviour. The thermal anomaly in some urbanised areas is truly remarkable, reaching up to 11°C difference. The highest difference value was found in a white limestone quarry. Figure 11A shows how the temperature seems to be lower in correspondence with bright and highly reflective surfaces such as the quarry, whose rocks constitute the main component of the Salento building material. It is therefore clear that this type of material and the albedo play a role in regulating the surface temperature. In contrast, it is noticeable that the use of metals as roofing material is strongly discouraged because, being excellent conductors of heat, they can easily reach excessively high temperatures. The thermal profile shown in Figure 11B shows how the minimum temperature at the centre of the quarry was 31.44°C, lower when compared to the 46.26°C estimated at the centre of the roof. The choice of material in the design of urban areas is therefore of great importance; this can be a deciding factor in the success of future sustainable urban areas planning. This research shows how these building materials shaped the environmental effect on urban areas in and around the cities in Salento, where most buildings are not covered with tiles but with limestone rocks, with great benefits in counteracting the phenomenon of urban heat islands.
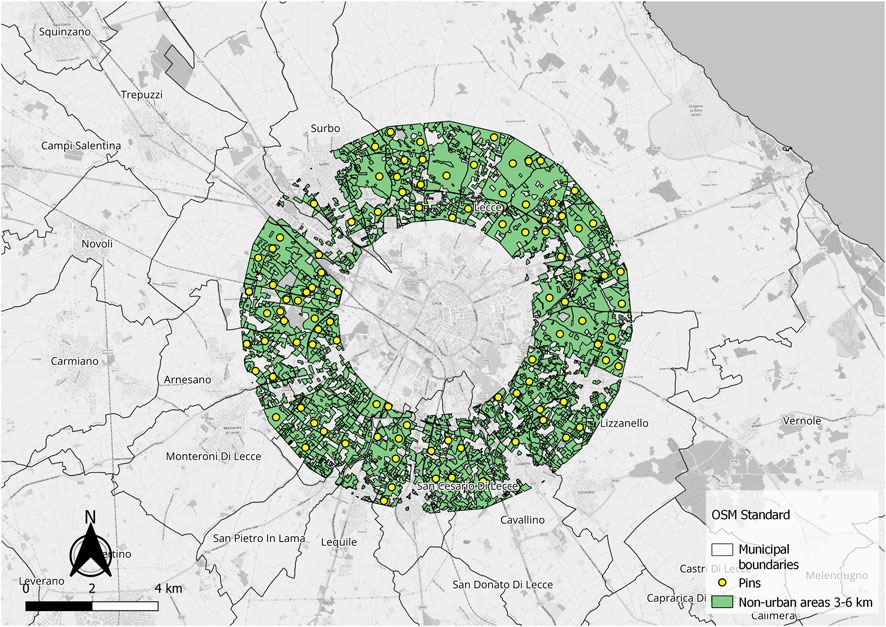
Figure 8. Distribution of pins in non-urban areas 3–6 km away from the centre of Lecce.
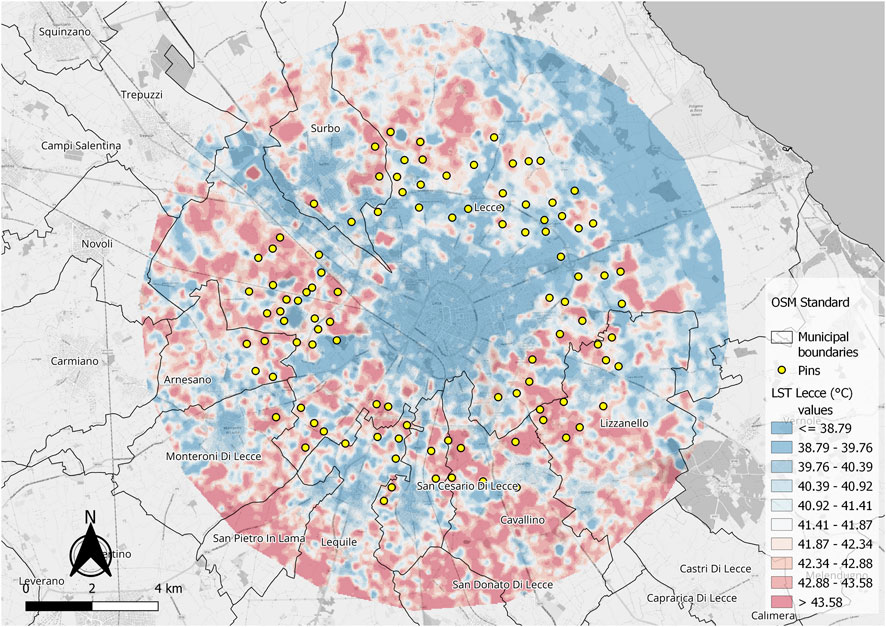
Figure 9. Distribution of pins on the land surface temperature map.
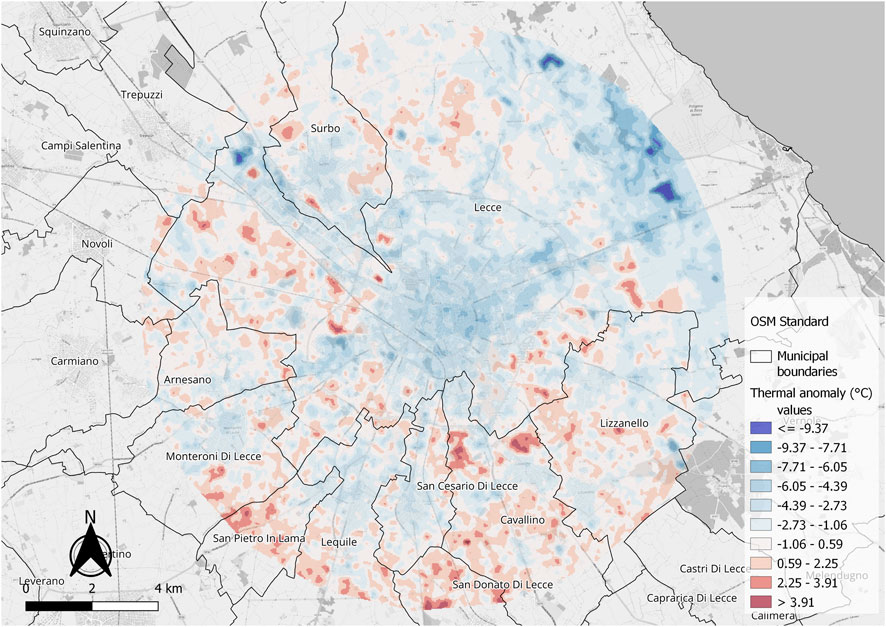
Figure 10. Thermal anomaly map in the city of Lecce on 24th July 2022. Urbanised surfaces have a negative difference of temperature since they are cooler than the average temperature of pins.
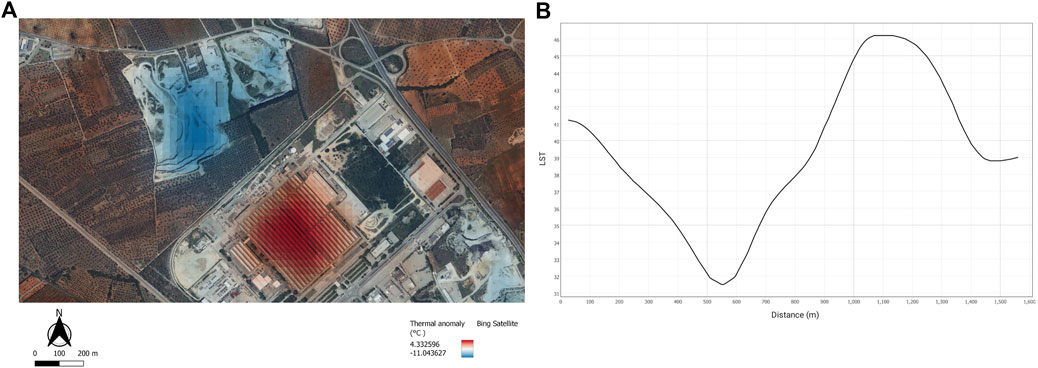
Figure 11. (A) Details of thermal anomaly in the industrial area of Lecce. (B) Thermal profile. LST is expressed in degree centigrade.
3.5 Surface albedo
The albedo values obtained by applying ranged from 0.0924 to 0.922, but only 11 of the calculated pixels had values exceeding the threshold of 0.60. These outliers were identified and subsequently eliminated. The new maximum value adopted by the albedo is 0.582. Figure 12 shows how the albedo in vegetated areas assume very low values. These high values are mainly due to the building material, the so-called “pietra leccese,” a locally mined Miocene calcarenite. This factor may be responsible for the thermal anomaly in the towns of Salento, since specific internal qualities of any surface material, including heat capacity, thermal conductivity, and inertia, play an important role in keeping a body’s temperature in balance with its external environment (Campbell, 2002). A research of Taha et al. (1988) demonstrated that changing the surface albedo from 0.25 to 0.40 may reduce localised afternoon air temperatures by approximately 4°C in a typical mid-latitude warm climate on summer. Taha et al. (1992) found that a white surface with an albedo of 0.61 was only 5°C warmer than ambient air in the early afternoon of a clear summer day, while conventional gravel with an albedo of 0.09 was 30°C warmer than air.
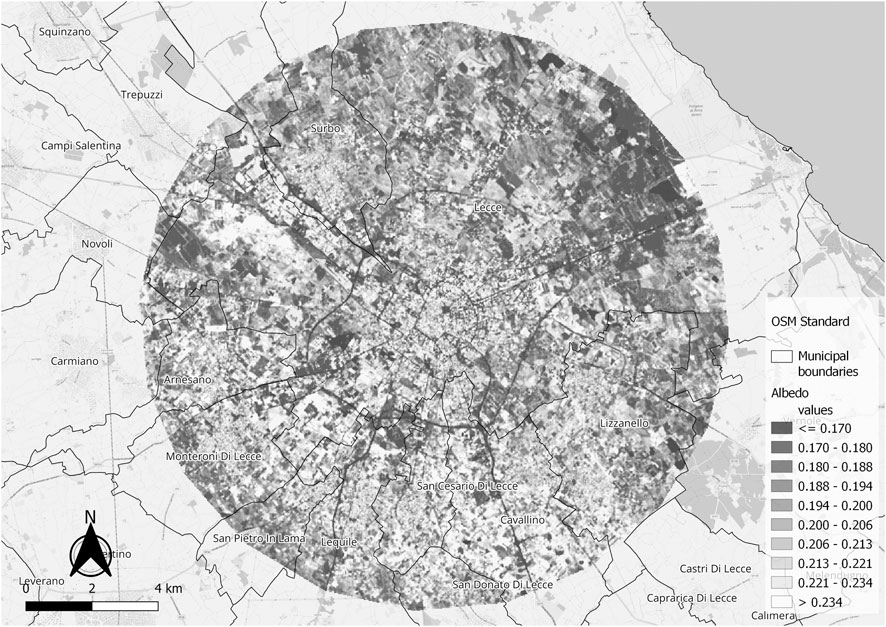
Figure 12. Albedo in Lecce.
It could be determined that the average albedo value of non-vegetated permeable surfaces is 0.205, while the average albedo value of impermeable surfaces is 0.218. The box plot in Figure 13A shows that the albedo of permeable surfaces does not exceed values above 0.445, in contrast to the values of impermeable surfaces, which can reach higher values up to 0.582. Although the values assumed by the two means are similar, their difference is statistically significant (Welch Two Samples t-test, p-value < 2.2e-16). The fact that the albedo of non-vegetated areas is about the same as that of urban areas might suggest that albedo does not have much effect on temperature regulation. However, it must be considered that impermeable surfaces also include areas with relatively low albedo values, such as large areas of photovoltaic installations in the Salento landscape, which could influence and lower the average value. It is precisely for this reason that the albedo in certain urban areas was examined in more detail. The urban area around the city of Lecce was divided into different subzones, such as: city centres, residential areas, road areas, photovoltaic areas, mining areas and industrial areas. Results are shown in Figure 13B and Table 3. In particular, it can be clearly seen that the highest average value is found in the mining areas of the territory, while the lowest values are attributable to extensive photovoltaic areas and road areas. In addition, the urban centres of the area have slightly higher average albedo values than the newer outlying districts. The albedo values in Salento urban areas far exceed the average albedo of most cities in the world, and this most likely has an important and clearly visible influence on the surface temperature. The average albedo values of these surfaces align closely with aerial measurements taken in arid cities, such as Los Angeles, California. Albedo values for urbanised areas typically range from 0.10 to 0.20. Some exceptions can be found in some towns in North Africa, where albedo values can range from 0.30 to 0.45 (Taha, 1997).
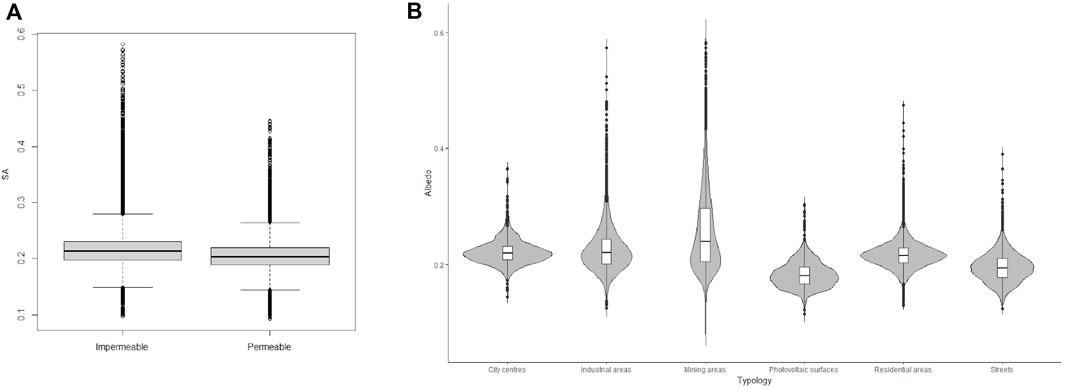
Figure 13. (A) Box plot of type of surface and albedo. (B) Violin plot of albedo values in impermeable subzones.
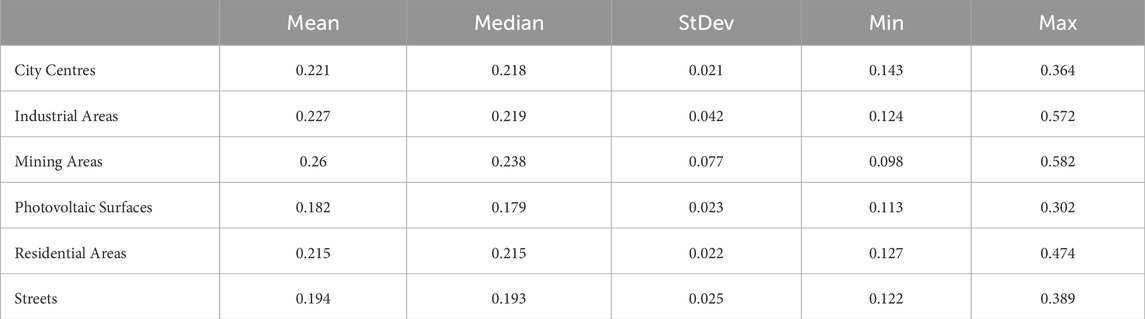
Table 3. Results of the analysis of the albedo in the specific impermeable subzones.
The scatter plot and its associated linear regression in Figure 14 show the expected inverse relationship between LST and the surface albedo (statistically significant, p-value < 2.2e-16). Results are presented in Table 4 and are consistent with previous studies that have described the relationship between the LST and surface albedo, such as the one conducted by Hamoodi et al. (2019). A different spatial distribution of temperature would have resulted in significantly lower albedo values of about 0.1–0.15, as it is the case in most cities. In this last case, impermeable surfaces would reflect on average 5%–10% less solar radiation than permeable surfaces, absorbing more energy and thus heat. Moreover, the temperature difference between built-up areas and the landscape is also due to the sparse, dry or absent vegetation on the ground. All these combined factors lead to what was found and studied in this article.
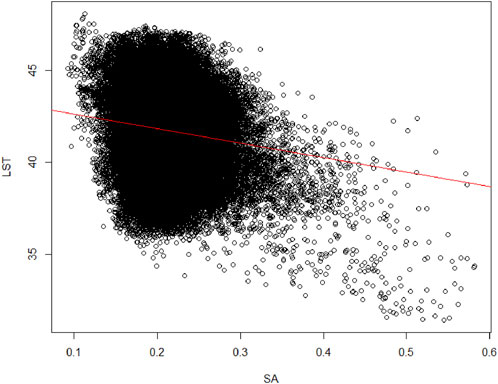
Figure 14. Scatter plot of LST-SA and linear regression.

Table 4. Linear regression results between LST and SA.
4 Conclusion
In the present research, UHI and the LST anomalies on 24th July 2022 were mapped, during one of the two summer HWs occurred in Salento. It was found that most urban centres and urbanised areas, including industrial areas, have a “reverse effect” of UHI, showing lower temperature values than the surrounding rural areas. In the Province of Lecce, the spatial distribution of temperatures is probably influenced by vegetation, proximity to the sea and soil characteristics. Along the coast, where NDVI analysis showed higher values, indicating the presence of more abundant vegetation, temperatures are much lower. The maximum values obtained, with peaks of LST around 50°C, are mainly located in the central areas of the region and in correspondence with the areas of abandoned and bare agricultural land. Considering the city of Lecce and the surrounding areas within a 9 km radius of the geographic centre of the city as a reference area, about 63.3% of the permeable surfaces have NDVI values below 0.3, which means that more than half of the non-urbanised areas have very little vegetation. This probably has a relevant impact on LST, as the lack of vegetation in these areas does not allow for cooling by plant evapotranspiration. The average temperature in these areas with sparse vegetation is 42.25°C, which is a very high value if compared to the average temperature of 40.32°C experienced on impermeable surfaces. The analysis of thermal anomalies in the Lecce surrounding confirmed this temperature anomaly, highlighting that temperatures in urban areas can be up to 11°C lower than in surrounding rural areas. The lowest temperature value of 31.44°C was found near a quarry of white limestone, highlighting the role of material type and albedo in LST values. Analysing the surface albedo, high values were found in the urban areas of Lecce, with values certainly above the average of world cities. A negative relationship between surface albedo and temperature was found. Thus, we can conclude that albedo plays a significant role in the regulation of surface temperature in Salento cities. Of great importance for this study was the almost total absence of vegetation in the countryside of Salento during the summer months, exposing the soil to more solar radiation and heat. It would be advisable to find strategic solutions to keep temperatures in these areas lower than they currently are, for example, by increasing the areas used for agriculture or, in some cases, to cultivate these areas with simple grass.
When evaluating the possible exportability of the methodological approach described and performed in this study, it is essential to consider the related advantages and disadvantages. The methodology employed in the study to identify an UHI can be applied across different contexts. However, the obtained results may vary depending on the geographical context and other influencing factors. The identification of a “reverse effect” of UHI in most urban centres, including industrial areas, offers an uncommon perspective. Understanding that these urbanised areas experience cooler temperatures than surrounding rural areas contradicts conventional UHI assumptions and provides new perspectives that may be extended to other areas. The analytical approach’s success may be impacted by Salento’s unique characteristics such as climate, geography, and land use patterns. Moreover, the research specifically focused on a specific date and season. Applying the results to unrelated areas without considering specific nuances could result in inaccuracies. The results obtained by emphasizing the existing relationship between surface albedo and LST could provide guidance for urban planners and politicians in other regions. Moreover, recognising surface albedo as a crucial factor may help minimize heat-related issues.
Data availability statement
The original contributions presented in the study are included in the article/supplementary material, further inquiries can be directed to the corresponding author.
Author contributions
SD: Data curation, Methodology, Software, Writing–original draft. CZ: Conceptualization, Validation, Writing–original draft, Supervision, Visualization. MD: Funding acquisition, Supervision, Writing–review and editing. SP: Conceptualization, Supervision, Validation, Visualization, Writing–review and editing.
Funding
The authors declare financial support was received for the research, authorship, and/or publication of this article. This research is funded by the resources allocated to the “2nd Level Master in GIScience and Unmanned System for the integrated management of the territory and natural resources” at the University of Padua. Additionally, the PhD program scholarship of the corresponding author is supported by the Italian PNRR (NextGenerationEU). Furthermore, computing resources for data analysis were generously provided by GIShub ODV association.
Conflict of interest
The authors declare that the research was conducted in the absence of any commercial or financial relationships that could be construed as a potential conflict of interest.
Publisher’s note
All claims expressed in this article are solely those of the authors and do not necessarily represent those of their affiliated organizations, or those of the publisher, the editors and the reviewers. Any product that may be evaluated in this article, or claim that may be made by its manufacturer, is not guaranteed or endorsed by the publisher.
References
Armson, D., Stringer, P., and Ennos, A. R. (2012). The effect of tree shade and grass on surface and globe temperatures in an urban area. Urban For. Urban Green. 11 (3), 245–255. doi:10.1016/J.UFUG.2012.05.002
Avdan, U., and Jovanovska, G. (2016). Algorithm for automated mapping of land surface temperature using LANDSAT 8 satellite data. J. Sensors 2016, 1–8. doi:10.1155/2016/1480307
Ballester, J., Quijal-Zamorano, M., Fernando, R., Turrubiates, M., Pegenaute, F., Herrmann, F. R., et al. (2023). Heat related mortality burden during the record-breaking summer 2022 in Europe: an integrated continental analysis. Nat. Med. 2023, 1–10. doi:10.1289/isee.2023.fp-033
Bonafoni, S., Baldinelli, G., Rotili, A., and Verducci, P. (2017). “Albedo and surface temperature relation in urban areas: analysis with different sensors,” in 2017 joint urban remote sensing event, JURSE 2017. doi:10.1109/JURSE.2017.7924612
Bounoua, L., Zhang, P., Mostovoy, G., Thome, K., Masek, J., Imhoff, M., et al. (2015). Impact of urbanization on US surface climate. Environ. Res. Lett. 10 (8), 084010. doi:10.1088/1748-9326/10/8/084010
Christidis, N., Jones, G. S., and Stott, P. A. (2015). Dramatically increasing chance of extremely hot summers since the 2003 European heatwave. Nat. Clim. Change 5, 46–50. doi:10.1038/NCLIMATE2468
Cunha, J., Nóbrega, R. L. B., Rufino, I., Erasmi, S., Galvão, C., and Valente, F. (2020). Surface albedo as a proxy for land-cover clearing in seasonally dry forests: evidence from the Brazilian Caatinga. Remote Sens. Environ. 238, 111250. doi:10.1016/j.rse.2019.111250
de Almeida, C. R., Teodoro, A. C., and Gonçalves, A. (2021). Study of the urban heat island (Uhi) using remote sensing data/techniques: a systematic review. Environ. - MDPI 8 (10), 105. doi:10.3390/environments8100105
Du, H., Zhan, W., Liu, Z., Li, J., Li, L., Lai, J., et al. (2021). Simultaneous investigation of surface and canopy urban heat islands over global cities. ISPRS J. Photogrammetry Remote Sens. 181, 67–83. doi:10.1016/j.isprsjprs.2021.09.003
Gago, E. J., Berrizbeitia, S. E., Torres, R. P., and Muneer, T. (2020). Effect of land use/cover changes on urban cool island phenomenon in Seville, Spain. Energies 13 (12), 3040. doi:10.3390/en13123040
Ghosh, S., and Das, A. (2018). Modelling urban cooling island impact of green space and water bodies on surface urban heat island in a continuously developing urban area. Model. Earth Syst. Environ. 4 (2), 501–515. doi:10.1007/s40808-018-0456-7
Giannaros, T. M., and Melas, D. (2012). Study of the urban heat island in a coastal Mediterranean City: the case study of Thessaloniki, Greece. Atmos. Res. 118, 103–120. doi:10.1016/j.atmosres.2012.06.006
Guha, S., Govil, H., Dey, A., and Gill, N. (2018). Analytical study of land surface temperature with NDVI and NDBI using Landsat 8 OLI and TIRS data in Florence and Naples city, Italy. Himanshu Govil, Anindita Dey Neetu Gill 51, 667–678. doi:10.1080/22797254.2018.1474494
Halder, B., Bandyopadhyay, J., and Banik, P. (2021). Monitoring the effect of urban development on urban heat island based on remote sensing and geo-spatial approach in Kolkata and adjacent areas, India. Sustain. Cities Soc. 74, 103186. doi:10.1016/j.scs.2021.103186
Hamoodi, M. N., Corner, R., and Dewan, A. (2019). Thermophysical behaviour of LULC surfaces and their effect on the urban thermal environment. J. Spatial Sci. 64 (1), 111–130. Mapping Sciences Institute Australia. doi:10.1080/14498596.2017.1386598
Hayes, A. T., Jandaghian, Z., Lacasse, M. A., Gaur, A., Lu, H., Laouadi, A., et al. (2022). Nature-based solutions (NBSs) to mitigate urban heat island (UHI) effects in Canadian cities. Buildings 12 (7), 925. doi:10.3390/buildings12070925
Imhoff, M. L., Zhang, P., Wolfe, R. E., and Bounoua, L. (2010). Remote sensing of the urban heat island effect across biomes in the continental USA. Remote Sens. Environ. 114 (3), 504–513. doi:10.1016/j.rse.2009.10.008
ISPRA copertura-del-suolo. Retrieved January 14, 2024, from https://www.isprambiente.gov.it/it/attivita/suolo-e-territorio/suolo/copertura-del-suolo.
Jimenez-Munoz, J. C., Sobrino, J. A., Skokovic, D., Mattar, C., and Cristobal, J. (2014). Land surface temperature retrieval methods from landsat-8 thermal infrared sensor data. IEEE Geoscience Remote Sens. Lett. 11 (10), 1840–1843. doi:10.1109/LGRS.2014.2312032
Kim, S. W., and Brown, R. D. (2021). Urban heat island (UHI) variations within a city boundary: a systematic literature review. Renew. Sustain. Energy Rev. 148, 111256. doi:10.1016/J.RSER.2021.111256
Kottek, M., Grieser, J., Beck, C., Rudolf, B., and Rubel, F. (2006). World map of the Köppen-Geiger climate classification updated. Meteorol. Z. 15 (3), 259–263. doi:10.1127/0941-2948/2006/0130
Kshetri, T. B. (2018). NDVI, NDBI AND NDWI CALCULATION USING LANDSAT 7 AND 8. Geomatics Sustain. Dev., 32–34. https://www.researchgate.net/publication/327971920.
Kuchcik, M. (2006). Defining heat waves-Different approaches. Pol. Acad. Sci. Inst. Geogr. Spatial Organ. 79 (2). GEOGRAPHIA POLONICA https://www.researchgate.net/publication/287477931.
Lehoczky, A., Sobrino, J., Skoković, D., and Aguilar, E. (2017). The urban heat island effect in the city of Valencia: a case study for hot summer days. Urban Sci. 1 (1), 9. doi:10.3390/urbansci1010009
Li, X., Hu, Z. Z., Liu, Y., Liang, P., and Jha, B. (2023). Causes and predictions of 2022 extremely hot summer in east asia. J. Geophys. Res. Atmos. 128 (13), e2022JD038442. doi:10.1029/2022JD038442
Martano, P., Elefante, C., and Grasso, F. (2015). Ten years water and energy surface balance from the CNR-ISAC micrometeorological station in Salento peninsula (southern Italy). Adv. Sci. Res. 12 (1), 121–125. doi:10.5194/asr-12-121-2015
Meehl, G. A., and Tebaldi, C. (2004). More intense, more frequent, and longer lasting heat waves in the 21st century. Science 305 (5686), 994–997. doi:10.1126/science.1098704
Mentaschi, L., Duveiller, G., Zulian, G., Corbane, C., Pesaresi, M., Maes, J., et al. (2022). Global long-term mapping of surface temperature shows intensified intra-city urban heat island extremes. Glob. Environ. Change 72, 102441. doi:10.1016/j.gloenvcha.2021.102441
Mohajerani, A., Bakaric, J., and Jeffrey-Bailey, T. (2017). The urban heat island effect, its causes, and mitigation, with reference to the thermal properties of asphalt concrete. J. Environ. Manag. 197, 522–538. doi:10.1016/J.JENVMAN.2017.03.095
Morabito, M., Crisci, A., Gioli, B., Gualtieri, G., Toscano, P., Di Stefano, V., et al. (2015). Urban-hazard risk analysis: mapping of heat-related risks in the elderly in major Italian cities. Plos One 10 (5), e0127277. doi:10.1371/journal.pone.0127277
Narayana Reddy, S., and Manikiam, B. (2017). Land surface temperature retrieval from LANDSAT data using emissivity estimation, Int. J. Appl. Eng. Res. 12. http://www.ripublication.com.
Naumann, G., Russo, S., Formetta, G., Forzieri, G., Girardello, M., and Feyen, L. (2020). Global warming and human impacts of heat and cold extremes in the EU Resilience of large investments and critical infrastructures in Europe to climate change (CCMFF). JRC Tech. Rep. 29. doi:10.2760/47878
Ni, J., Cheng, Y., Wang, Q., Ng, C. W. W., and Garg, A. (2019). Effects of vegetation on soil temperature and water content: field monitoring and numerical modelling. J. Hydrology 571, 494–502. doi:10.1016/J.JHYDROL.2019.02.009
NOAA. Retrieved January 14, 2024, from https://www.ncei.noaa. gov/access/search/data-search/global-summary-of-the-day?stations= 16332099999&dataTypes=MAX&dataTypes=MIN&dataTypes=TEMP.
Oke, T. R. (1982). The energetic basis of the urban heat island. Quart. J. R. Mater. Soc. 108 (455), 1–24. doi:10.1002/qj.49710845502
Oudin Åström, D., Schifano, P., Asta, F., Lallo, A., Michelozzi, P., Rocklöv, J., et al. (2015). The effect of heat waves on mortality in susceptible groups: a cohort study of a mediterranean and a northern European City. Environ. Health A Glob. Access Sci. Source 14 (1), 30. doi:10.1186/s12940-015-0012-0
Pappalardo, S. E., Zanetti, C., and Todeschi, V. (2023). Mapping urban heat islands and heat-related risk during heat waves from a climate justice perspective: a case study in the municipality of Padua (Italy) for inclusive adaptation policies. Landsc. Urban Plan. 238, 104831. doi:10.1016/j.landurbplan.2023.104831
Parlow, E., Frey, C. M., Rigo, G., and Parlow, E. (2012). INVESTIGATION OF THE DAILY URBAN COOLING ISLAND (UCI) IN TWO COASTAL CITIES IN AN ARID ENVIRONMENT: DUBAI AND ABU DHABI (U.A.E). https://www.researchgate.net/publication/242551628.
Perkins-Kirkpatrick, S. E., and Lewis, S. C. (2020). Increasing trends in regional heatwaves. Nat. Commun. 11 (3357), 3357. doi:10.1038/s41467-020-16970-7
Pongrácz, R., Bartholy, J., and Dezso, Z. (2010). Application of remotely sensed thermal information to urban climatology of Central European cities. Phys. Chem. Earth 35 (1–2), 95–99. doi:10.1016/j.pce.2010.03.004
Quattrochi, D. A., and Luvall, J. C. (1999). Thermal infrared remote sensing for analysis of landscape ecological processes: methods and applications. Landsc. Ecol. 14, 577–598. doi:10.1023/a:1008168910634
Rajeshwari, A., and Mani, N. D. (2014). ESTIMATION OF LAND SURFACE TEMPERATURE OF DINDIGUL DISTRICT USING LANDSAT 8 DATA. IJRET Int. J. Res. Eng. Technol. 3, 122–126. http://www.ijret.org. doi:10.15623/ijret.2014.0305025
Rao, P. K. (1972). Remote sensing of urban heat islands from an environmental satellite. Bull. Am. Meteorological Soc. 53, 647–648. doi:10.1175/1520-0477-53.7.648
Rasul, A., Balzter, H., Smith, C., Remedios, J., Adamu, B., Sobrino, J., et al. (2017). A review on remote sensing of urban heat and cool islands. Land 6 (2), 38. doi:10.3390/land6020038
Regione Puglia Regione puglia. Retrieved January 14, 2024, from https://dati.puglia.it/ckan/dataset/uso-del-suolo-2011-uds.
Robinson, P. J. (2001). On the definition of a heat wave. J. Appl. METEOROLOGY 40, 762–775. doi:10.1175/1520-0450(2001)040<0762:otdoah>2.0.co;2
Romanello, M., McGushin, A., Di Napoli, C., Drummond, P., Hughes, N., Jamart, L., et al. (2021). The 2021 report of the Lancet Countdown on health and climate change: code red for a healthy future. Lancet 398 (10311), 1619–1662. doi:10.1016/S0140-6736(21)01787-6
Rousi, E., Kornhuber, K., Beobide-Arsuaga, G., Luo, F., and Coumou, D. (2022). Accelerated western European heatwave trends linked to more-persistent double jets over Eurasia. Nat. Commun. 13 (1), 3851. doi:10.1038/s41467-022-31432-y
Russo, S., Dosio, A., Graversen, R. G., Sillmann, J., Carrao, H., Dunbar, M. B., et al. (2014). Magnitude of extreme heat waves in present climate and their projection in a warming world. J. Geophys. Res. Atmos. 119 (22), 12500–12512. doi:10.1002/2014JD022098
Sadiq Khan, M., Ullah, S., and Liding, C. (2023). Variations in surface urban heat island and urban cool is-land intensity: a review across major climate zones. Chin. Geogr. Sci. 33 (6), 983–1000. doi:10.1007/s11769-023-1375-8
Sangiorgio, V., Fiorito, F., and Santamouris, M. (2020). Development of a holistic urban heat island evaluation methodology. Sci. Rep. 10 (1), 17913–13. doi:10.1038/s41598-020-75018-4
Santamouris, M., and Fiorito, F. (2021). On the impact of modified urban albedo on ambient temperature and heat related mortality. Sol. Energy 216, 493–507. doi:10.1016/j.solener.2021.01.031
Schlesinger, W. H., Dietze, M. C., Jackson, R. B., Phillips, R. P., Rhoades, C. C., Rustad, L. E., et al. (2016). Forest biogeochemistry in response to drought. Glob. Change Biol. 22 (7), 2318–2328. doi:10.1111/GCB.13105
Scortichini, M. (2022). The epidemiology and control of “olive quick decline syndrome” in Salento (Apulia, Italy). Agronomy 12 (10), 2475. MDPI. doi:10.3390/agronomy12102475
Sharma, A., Andhikaputra, G., and Wang, Y. C. (2022). Heatwaves in south asia: characterization, consequences on human health, and adaptation strategies. Atmosphere 13 (5), 734. MDPI. doi:10.3390/atmos13050734
Singh, R., Arrighi, J., Jjemba, E., Strachan, K., Spires, M., and Kadihasanoglu, A. (2019). Heatwave guide for cities red CrossRed crescent climate centre. http://www.climatecentre.org/downloads/files/IFRCGeneva/RCCCHeatwaveGuide2019A4RRONLINEcopy. pdf.
Souch, C. A., and Souch, C. (1993). The effect of trees on summertime below canopy urban climates: a case study Bloomington, Indiana. J. Arboric. 19 (5), 303–312. doi:10.48044/jauf.1993.049
Spano, D., Mereu, V., Bacciu, V., Marras, S., Trabucco, A., Adinolfi, M., et al. (2020). “Analisi del rischio,” in I cambiamenti climatici in Italia. doi:10.25424/CMCC/ANALISI_DEL_RISCHIO
Stathopoulou, M., and Cartalis, C. (2007). Daytime urban heat islands from Landsat ETM+ and Corine land cover data: an application to major cities in Greece. Sol. Energy 81 (3), 358–368. doi:10.1016/J.SOLENER.2006.06.014
Suryo Sumunar, D. R., Arif, N., Hadi, B. S., and Sariyono, K. E. (2020). URBAN ENERGY MODELING USING REMOTE SENSING APPROACHES. Int. J. Geomate 19 (75), 203–208. doi:10.21660/2020.75.23161
Taha, H. (1997). Urban climates and heat islands: albedo, evapotranspiration, and anthropogenic heat. Energy Build. 25, 99–103. doi:10.1016/s0378-7788(96)00999-1
Taha, H., Akbari, H., Rosenfeld, A., and Huang, J. (1988). Residential cooling loads and the urban heat island: the effects of albedo. Build. Environ. 23, 271–283. doi:10.1016/0360-1323(88)90033-9
The Lancet (2021). Health in a world of extreme heat. Lancet 398 (10301), 641. doi:10.1016/S0140-6736(21)01860-2
Todeschi, V., Pappalardo, S. E., Zanetti, C., Peroni, F., and De Marchi, M. (2022a). Climate justice in the city: mapping heat-related risk for climate change mitigation of the urban and peri-urban area of padua (Italy). ISPRS Int. J. Geo-Inform. 11, 490. doi:10.3390/IJGI11090490
Todeschi, V., Pappalardo, S. E., Zanetti, C., Peroni, F., and De Marchi, M. (2022b). Climate justice in the city: mapping heat-related risk for climate change mitigation of the urban and peri-urban area of padua (Italy). ISPRS Int. J. Geo-Inform 11 (9), 490. doi:10.3390/ijgi11090490
Toreti, A., Masante, D., Acosta Navarro, J., Bavera, D., Cammalleri, C., De Jager, A., et al. (2022). Drought in Europe july 2022. Luxembourg: Publications Office of the European Union. ISBN 978-92-76-54953-6 doi:10.2760/014884, JRC130253
Tran, H., Uchihama, D., Ochi, S., and Yasuoka, Y. (2006). Assessment with satellite data of the urban heat island effects in Asian mega cities. Int. J. Appl. Earth Obs. Geoinf. 8 (1), 34–48. doi:10.1016/j.jag.2005.05.003
USGS (2024a). Earthexplorer. Retrieved January 14, 2024, from https://earthexplorer.usgs.gov.
USGS (2024b). landsat-8. Retrieved January 14, 2024, from https://www.usgs.gov/landsat-missions/landsat-8.
Wang, F., Qin, Z., Song, C., Tu, L., Karnieli, A., and Zhao, S. (2015). An improved mono-window algorithm for land surface temperature retrieval from landsat 8 thermal infrared sensor data. Remote Sens. 7 (4), 4268–4289. doi:10.3390/rs70404268
Wehrli, K., Guillod, B. P., Hauser, M., Leclair, M., and Seneviratne, S. I. (2019). Identifying key driving processes of major recent heat waves. J. Geophys. Res. Atmos. 124 (22), 11746–11765. doi:10.1029/2019JD030635
Weng, Q. (2009). Thermal infrared remote sensing for urban climate and environmental studies: methods, applications, and trends. ISPRS J. Photogram. Remote Sens. 64 (4), 335–344. doi:10.1016/J.ISPRSJPRS.2009.03.007
WHO (2018). Heatwaves. https://www.who.int/health-topics/heatwaves#tab=tab_1.
WMO (2020). WMO statement on the state of the global climate in 2019. Geneva: World Meteorological Organization.
Wulder, M. A., White, J. C., Loveland, T. R., Woodcock, C. E., Belward, A. S., Cohen, W. B., et al. (2016). The global Landsat archive: status, consolidation, and direction. Remote Sens. Environ. 185, 271–283. doi:10.1016/j.rse.2015.11.032
Yang, X., Lu, M., Wang, Y., Wang, Y., Liu, Z., Chen, S., et al. (2021). Horticulturae response mechanism of plants to drought stress. doi:10.3390/horticulturae7030050
Keywords: urban heat islands, climate change, LST, albedo, Landsat-8
Citation: De Razza S, Zanetti C, De Marchi M and Pappalardo SE (2024) Mapping urban heatwaves and islands: the reverse effect of Salento’s “white cities”. Front. Earth Sci. 12:1375827. doi: 10.3389/feart.2024.1375827
Received: 24 January 2024; Accepted: 20 March 2024;
Published: 19 April 2024.
Edited by:
Veysel Turan, Bingöl University, TürkiyeReviewed by:
Subhanil Guha, National Institute of Technology Raipur, IndiaCorrado Zoppi, University of Cagliari, Italy
Copyright © 2024 De Razza, Zanetti, De Marchi and Pappalardo. This is an open-access article distributed under the terms of the Creative Commons Attribution License (CC BY). The use, distribution or reproduction in other forums is permitted, provided the original author(s) and the copyright owner(s) are credited and that the original publication in this journal is cited, in accordance with accepted academic practice. No use, distribution or reproduction is permitted which does not comply with these terms.
*Correspondence: Carlo Zanetti, carlo.zanetti@unipd.it