Origins of sediments and fluids in submarine mud volcanoes off Tanegashima Island, northern Ryukyu Trench, Japan
 Akira Ijiri1,2*
  Ryoma Setoguchi3 Yuki Mitsutome4
  Tomohiro Toki5,6 Masafumi Murayama7
  Kyoko Hagino8
  Yohei Hamada2 Takeyasu Yamagata9 Hiroyuki Matsuzaki9
  Wataru Tanikawa2 Osamu Tadai10
  Kazuya Kitada11
  Tatsuhiko Hoshino2
  Takuro Noguchi7 Juichiro Ashi12
  Fumio Inagaki13,14
- 1Graduate School of Maritime Sciences, Kobe University, Kobe, Japan
- 2Kochi Institute for Core Sample Research, Institute for Extra-Cutting-Edge Science and Technology Avant-Garde Research (X-Star), Japan Agency for Marine-Earth Science and Technology (JAMSTEC), Nankoku, Kochi, Japan
- 3Department of Agriculture and Marine Science, Graduate School of Integrated Arts and Sciences, Kochi University, Nankoku, Kochi, Japan
- 4Department of Chemistry Biology and Marine Science, Graduate School of Engineering and Science, University of the Ryukyus, Nishihara, Okinawa, Japan
- 5Department of Chemistry, Biology and Marine Science, Faculty of Science, University of the Ryukyus, Nishihara, Okinawa, Japan
- 6Research Institute for Humanity and Nature, Kita-ku, Kyoto, Japan
- 7Interdisciplinary Science Unit, Multidisciplinary Science Cluster, Research and Education Faculty, Kochi University, Nankoku, Kochi, Japan
- 8Marine Core Research Institute, Kochi University, Nankoku, Kochi, Japan
- 9The University Museum, The University of Tokyo, Bunkyo, Tokyo, Japan
- 10Marine Works Japan Ltd., Yokosuka, Japan
- 11Super-Cutting-Edge Grand and Advanced Research (SUGAR) Program, Institute for Extra-Cutting-Edge Science and Technology Avant-Garde Research (X-star), Japan Agency for Marine-Earth Science and Technology (JAMSTEC), Yokosuka, Japan
- 12Atmosphere and Ocean Research Institute, The University of Tokyo, Kashiwa, Chiba, Japan
- 13Institute for Marine-Earth Exploration and Engineering (MarE3), Japan Agency for Marine-Earth Science and Technology (JAMSTEC), Yokohama, Japan
- 14Department of Earth Sciences, Graduate School of Science, Tohoku University, Sendai, Japan
Mud volcanoes are topographic features through which over-pressurized sediments are intruded upward and erupted, transporting fluids and sediments from the deep subsurface to the surface/seafloor. To understand material and biogeochemical cycling through mud volcanoes, we investigated the origins of sediments and fluids erupted by four submarine mud volcanoes off Tanegashima Island, along the northern Ryukyu Trench: MV#1–3 and MV#14. We estimated the ages of the source sequences of the mud volcano sediments to be middle to late Miocene based on nannofossils and 10Be ages. The sediments were characteristically enriched in illite. The similar mineral compositions and vitrinite reflectance values (0.42%–0.45%) of sediments erupted by the mud volcanoes strongly suggest that each is rooted in the same source sequence. Pore waters had Cl− concentrations ∼40% that of seawater and were proportionally enriched in 18O and depleted in D, indicating the addition of freshwater from the dehydration of clay minerals. However, the smectite and illite contents (<40%) in the clay size fraction ruled out in situ smectite dewatering as the cause of the pore water Cl− dilution. Thus, fluids derived from clay dewatering must have originated from deeper than the source sequence of the mud volcano sediments. Vertical Cl− profiles indicate that the upward fluid advection rate and eruption frequency decrease from MV#3 to MV#2, MV#1, and MV#14 (MV#14 being dormant). At the active mud volcanoes, the C1/C2 ratios (<100) and methane δ13C values (−56‰ to −42‰) indicate that hydrocarbon gases are mostly derived from the thermal decomposition of organic matter in deep sediments where the in situ temperature exceeds 80°C. At the dormant MV#14, high C1/C2 ratios (700–4,000) and low methane δ13C values (ca. −75‰) suggest the limited supply of thermogenic methane and the subsequent shallow methanogenesis. Because vitrinite reflectance values indicate that the source sediments are too immature to produce thermogenic hydrocarbons, the hydrocarbon gases, like the fluids derived from clay dewatering, were probably supplied from deeper than the source strata. The supply of deep fluids into the source sequence might be a universal phenomenon in subduction zones, and may play an important role in mud volcanism and associated biogeochemical cycling.
1 Introduction
Submarine mud volcanoes, which occur along the margins of convergent plate, are vertical intrusions of low-density, deformable sediments from the deep subsurface to the seafloor (Milkov, 2000; Kopf, 2002). Pore fluids in the sediments erupted by submarine mud volcanoes are characteristically diagenetically altered by clay-mineral dehydration and the presence of hydrocarbon gases derived from the thermocatalyte decomposition of sedimentary organic matter (e.g., Martin et al., 1996; Dahlmann and de Lange, 2003; Hensen et al., 2004). These characteristics suggest that mud volcano fluids originate from deep depths in which these chemical reactions typically occur (>60°C). Therefore, mud volcanoes are an important pathway by which deeply sourced materials (especially methane, a greenhouse gas) reach the hydrosphere and atmosphere (Milkov, 2000; Dimitrov, 2002; Kopf, 2002; Wallmann et al., 2006).
Recent studies have revealed the biogeochemical and microbiological characteristics of deeply sourced mud volcano sediments, as well as their ecological roles (e.g., Hoshino et al., 2017; Ijiri et al., 2018a). In the Kumano fore arc basin, Nankai Trough, the mud volcano’s source layer is assumed to be located at the basin bottom where fluids in the accretionary prism are supplied via mega-splay faults, probably resulting high pore pressure. In this environment, water through clay dehydration, hydrogen, and other organic substrates are provided to the overlying fore arc sedimentary basin, coincidently stimulating in situ microbial activities such as hydrogenotrophic methanogenesis (Ijiri et al., 2018a). The observation indicates that the material and biogeochemical cycles through mud volcanoes are strongly related to the mechanism of the mud volcano eruption.
To understand biogeochemical cycling through mud volcanoes, it is therefore important to investigate the origins of both sediments and fluids. Excess fluid pressured is one of the key factors to explain the mud eruption (Tanikawa et al., 2010). When a fluid pressure is higher than estimated from the normal hydrostatic fluid gradient for a given depth, it is called overpressure (Duan and Flemings, 2000). The overpressure generated by the rapid sediment deposition and the lateral transfer of the pressure may cause slope failure and drive cold seeps on passive margins (Duan and Flemings, 2000). The eruption of mud volcanoes is also triggered by such overpressure. It has been debated whether the overpressure that causes the mud volcanic eruption is due to the sediments themselves, such as clay mineral dehydration in the sediments and fast sedimentation rates, or the supply of fluids to the source sequence of erupted sediments from deeper sedimentary layer (Kopf, 2002). The origin and composition of mud volcano fluids have been the subject of many studies (e.g., Martin et al., 1996; Dahlmann and de Lange, 2003; Hensen et al., 2004). However, fewer studies have included chemical and mineralogical analyses of mud volcano sediments (e.g., Schulz et al., 1997; Jurado-Rodriguez and Martinez-Ruiz, 1998; Ujiié, 2000; Alaoui Mhammedi et al., 2008; Ijiri et al., 2018b), despite the fact that the lithologies of erupted sediments are strongly related to the formation of mud volcanoes and their sediment sources.
In this study, we investigated the origins of sediments and fluids in four submarine mud volcanoes off Tanegashima Island, along the northern Ryukyu Trench, using sediment core samples retrieved from the mud volcano field. To investigate sediment origins, we determined the ages of the mud volcanoes’ source sequences based on nannofossil observations and beryllium isotopic analysis. We estimated the mineral compositions of the bulk sediments and the clay size fraction by X-ray diffraction (XRD). To examine organic matter maturity and the temperatures experienced by mud volcano sediments, we analyzed vitrinite reflectance. Finally, to investigate the origins of fluids, we analyzed the chemical and isotopic compositions of pore water and hydrocarbon gases extracted from the mud volcanoes.
2 Geological setting and previous studies
Known submarine mud volcano fields around Japan include the Kumano fore arc basin of the Nankai Trough and the area off Tanegashima Island along the Ryukyu Trench, where the Philippine Sea Plate is being subducted beneath the Eurasian Plate (Ujiié, 2000; Nakayama et al., 2010; Pape et al., 2014; Menapace et al., 2017; Ijiri et al., 2018a; Ijiri et al., 2018b). The field off Tanegashima Island comprises more than 30 mud volcano-like mounds on the landward slope of the Ryukyu Trench (Figure 1A; Ujiié, 2000). The Ryukyu Trench is formed by the subduction of Phlippine Sea Plate to the Eurasian plate. The geological structure of deep subsurface in landward slope of the Ryukyu Trench is unclear (Ujiié, 2000). The sediments at Tanegashima Island located close to the northern Ryukyu Trench, is composed of the Paleogene Kumage Group generally correlated with the Shimanto Belt of Southwest Japan (Hayasaka, 1988). The Shimanto Belt is an old accretionary prism divided into two major tectonostratigraphic units, the Northern Belt (Lower Shimanto Group) and the Southern Belt (Upper Shimanto Group). The former is characterized by uppermost Jurassic to Cretaceous strata, and the latter by Paleogene and lower Miocene rocks (Taira et al., 1982). Between 2012 and 2014, submarine topography surveys were conducted to clarify the spatial distribution of mud volcanoes off Tanegashima, and 15 mounds (numbered MV#1–15) were identified as potential mud volcanoes (Figure 1A) (Kitada et al., 2018). Single-channel seismic reflection data indicate that the mud volcanoes are located on the mud diapir structures, which have been identified by an acoustically transparent zone (Kitada et al., 2018). However, there is currently a lack of detailed seismic data to determine the presence of subducting structures in deeper subsurface of this area.
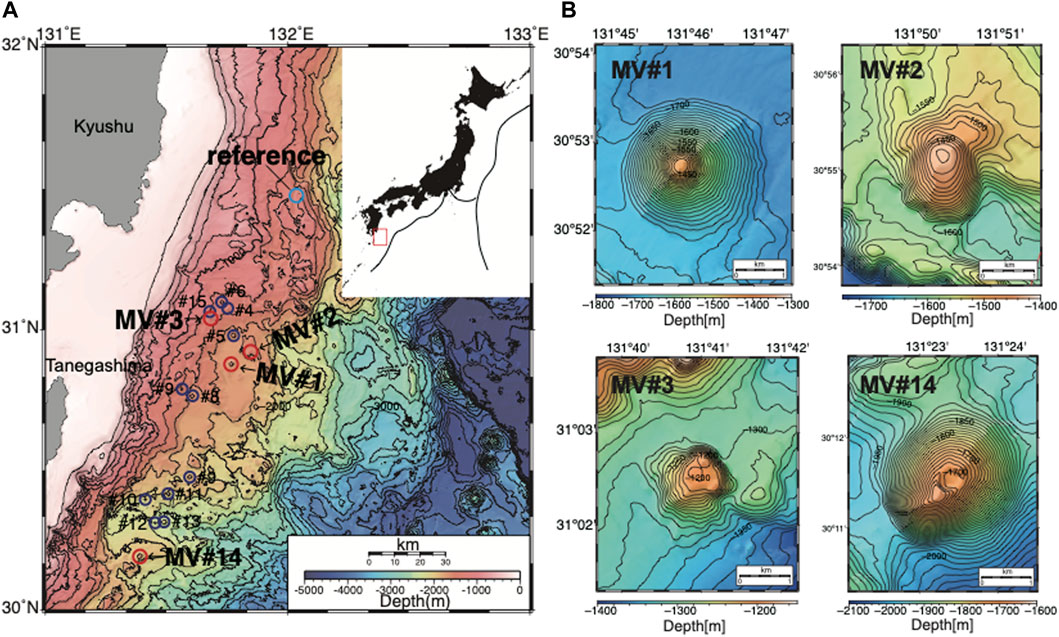
FIGURE 1. (A) The locations of mud volcanoes off Tanegashima Island, Japan, and (B) the detailed topography of mud volcanoes MV#1, MV#2, MV#3, and MV#14.
Ujiié (2000) investigated foraminifera and nannofossils in mud volcano sediments obtained from MV#2 and MV#13 during 1994 survey and reported the sediments to have various ages from late Eocene to Pleistocene. They interpreted the microfossils to have been incorporated from the strata surrounding mud diapirs during their intrusion. The chemical compositions of pore waters in sediments collected from MV#1 during 2002 survey indicate that water derived from the dehydration of clay minerals is supplied to near the surface (Nakayama et al., 2010).
Recent studies have revealed the biogeochemical and microbiological characteristics and ecological roles of mud volcano sediments at depth. At MV#1 and MV#14, sedimentary Atribacteria were found in methane plumes in the overlying water column (Hoshino et al., 2017). This observation suggests that submarine mud volcanism disperses microbes from the deep sedimentary biosphere into the overlying hydrosphere.
Recently, Mitsutome et al. (2023) investigated the helium isotopic and noble gas compositions of mud volcano sediments from MV#1–3 and #14 to estimate their depths of origin. They reported that approximately 90% of the He is of crustal origin, and the experienced temperature of heavy noble gases is consistent with the range of temperature conditions required for the dehydration of clay minerals.
3 Materials and methods
3.1 Visual survey and sediment core sampling
Details of the obtained sediment cores are summarized in Supplementary Table S1.
3.1.1 MV#1
MV#1 is in the northern area of the mud volcano field off Tanegashima Island (30° 52.7′N, 131° 46.0′E, 1,400 m water depth; Figures 1A, B); it is ∼2.5 km in diameter and ∼280 m height. During cruise NT15-15 of R/V Natsushima in 2015, we surveyed the summit of MV#1 during two dives (#1866 and #1867) of ROV HYPER-DOLPHIN (Figure 1B). We observed a small colony of Calyptogena (Figures 2A, B). Around the summit, we observed several consolidated sandy mudstone clasts (several to several tens of centimeters in size; Figures 2C, D) that were probably mixed with sediments fractured by diapiric mud intrusion. The presence of these clasts suggests that sediments around the summit comprise erupted mud and not hemipelagic sediments. During cruise KH-15-02 of R/V Hakuho Maru in 2015, two sediment cores were retrieved from MV#1 using a piston coring system: one was used for pore water analysis; the other for sediment analysis.
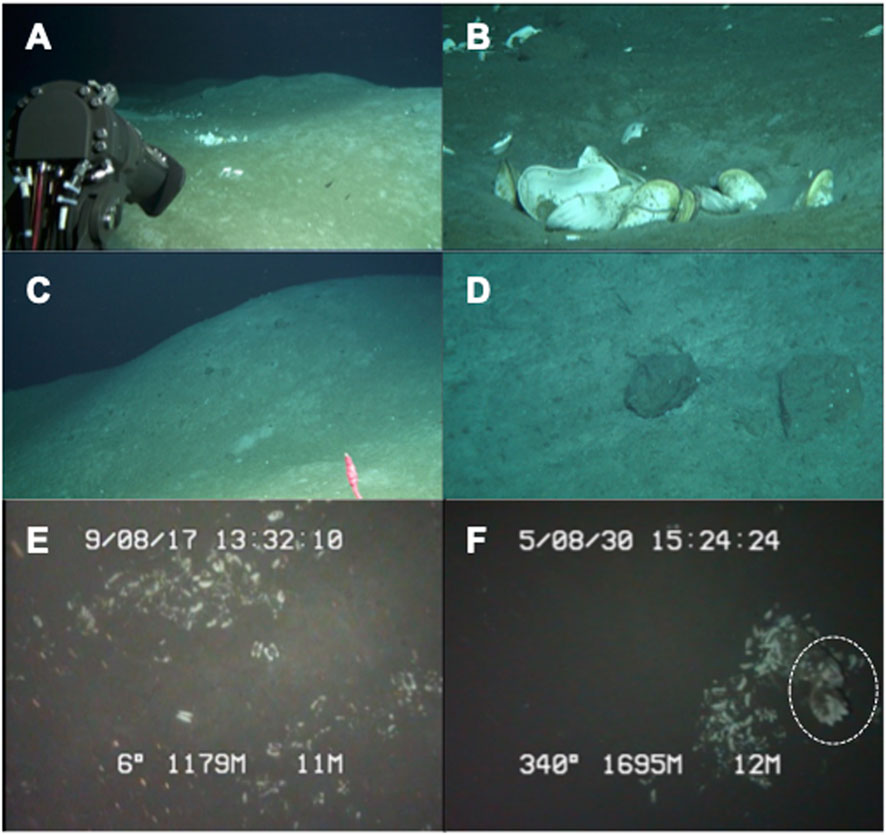
FIGURE 2. Photographs taken near the summits of MV#1, MV#3, and MV#14. (A,B) Calyptogena spp. and (C,D) consolidated mud clasts on the summit of MV#1. Calyptogena spp. were also observed on the summits of (E) MV#3 and (F) MV#14. In (F), the dashed circle outlines a chimney-like white object.
3.1.2 MV#2
MV#2 is near MV#1 (30° 55.1′N, 131° 50.6′E, 1,430 m water depth; Figures 1A, B); it is ∼1.2–1.5 km in diameter and ∼120–170 m height. At MV#2, two piston cores and two multiple cores were retrieved for pore water and sediment analyses during cruise KH-19-5 of R/V Hakuho Maru in 2019. Since only conventional piston coring was conducted, a visual survey for MV#2 could not be performed.
3.1.3 MV#3
MV#3 is in the northern area of the mud volcano field (31° 02.5′N, 131° 41.0′E, 1,200 m water depth; Figures 1A, B); it is ∼1.5 km in diameter and ∼100 m height, making it the smallest of the studied mud volcanoes. During cruise KH-19-5, two piston cores and two multiple cores were retrieved. One of the piston cores was retrieved using the Navigable Sampling System (NSS), which allows observation of the target seafloor area during piston coring via an underwater camera coupled to the piston coring system; the other piston core (for sediment analysis) was retrieved using the normal piston coring system. These camera observations revealed a Calyptogena colony near the summit coring site of MV#3 (Figure 2E), suggesting that this mud volcano was quite active.
3.1.4 MV#14
MV#14 is situated in the southern area of the mud volcano field (30° 11.5′N, 131° 23.5′E, 1,680 m water depth; Figures 1A, B); it is ∼3 km in diameter and ∼270 m height, making it the largest of the studied mud volcanoes, and it has developed a summit caldera (Figure 1B). During cruise KH-15-2, one NSS piston core was retrieved; in the camera footage, we observed a Calyptogena colony on the eastern edge of the caldera (Figure 2F). Next to the colony, we observed a white, chimney-like object; it may have been a carbonate chimney, but the low resolution of the image precludes a precise interpretation (Figure 2F).
3.1.5 Reference site
A multiple core was retrieved from a reference site near the mud volcano field during cruise KS-21-18 of R/V Shinsei-Maru in 2021 (31° 29′N; 132° 02′E, 1,220 m water depth; Figure 1A).
3.2 Sediment samples
3.2.1 Sediment sampling
Piston core samples retrieved for sediment analyses [Length: 3.11–5.21 m, inner diameter: 75 cm (Supplementary Table S1)] were cut into 1-m-long sections and stored onboard at 4°C. Onshore laboratory, the sections were cut in half lengthwise and the sediments were subsampled from the cut surface after the scan for X-ray computed tomography. For the MV#14 core, sediments for pore water and microbial analyses were collected from the piston core onboard, and sediment analysis samples were later subsampled from the microbial analysis samples in onshore laboratory. For nannofossil observations and beryllium isotopic (10Be) and mineral compositional analyses, sediments were subsampled from the muddy matrix representing the mud volcano sediments; we avoided mud breccias because they were probably incorporated during mud diapir intrusion (Ujiié, 2000).
3.2.2 X-ray computed tomography
To observe the internal structure of the core sample, we obtained X-ray computed tomography (X-ray CT) image using Aquilion PRIME/Focus (Canon Medical Systems Corporation, Japan). For the MV#3 core, the most sediments were collected for geochemical and microbial analyses onboard. Therefore, the residual sediments on the core-liner were scanned. For the MV#14 core, all sediments were sub-sampled on board, so we were unable to scan the core.
3.2.3 Calcareous nannofossil observation
To examine the origin of the source sequence of the mud volcano sediments, the age of the mud volcano sediments was estimated based on the calcareous nannofossils in the sediments. The samples were prepared as smear slides using standard techniques (Bown and Young, 1998), and then examined with a Nikon E600 polarizing light microscope at 1,500× magnification. Species identification and their occurrence age range of each species followed Backman et al. (2012) and Nannotax3 (https://www.mikrotax.org/Nannotax3/index.html). Semi-quantitative data were collected from the samples, which contained sufficient number of calcareous nannofossils, by identifying at least 200 upper photic zone specimens in a varying number of fields of view per sample. Lower photic zone species Florisphaera profunda was counted separately in the same fields of view when encountered. Upper photic-zone species were classified into six groups (Emiliania huxleyi, Pliocene–Pleistocene taxa except E. huxleyi, Miocene–Pleistocene taxa, Paleogene–Neogene taxa, Miocene taxa, and miscellaneous) based on their occurrence age range (Supplementary Table S2), and the relative abundance of each group was calculated (Supplementary Table S3).
3.2.4 Beryllium isotopic analysis
The age of the source sequence of the mud volcano sediments was also estimated using the beryllium isotope analysis. Meteoric 10Be is formed in the atmosphere through cosmic ray interactions with oxygen and nitrogen nuclei, eventually reaching the ocean via precipitation and aerosols (e.g., Brown, 1987). In the ocean, it is incorporated into seafloor sediments through scavenging by biogenic opal, clay, carbonate, and organic materials (e.g., McHargue and Damon, 1991). It undergoes radioactive decay with a half-life of 1.36 million years, transforming into stable 10B [Nishiizumi et al. (2007)]. Therefore, unless sediments are exposed at the surface after the deposition, their age can be can be estimated by the concentration of 10Be in sediments (Amin et al., 1975).
The 0.3 g of sediment samples were decomposed at 110°C for 12 h in a tightly sealed vessel with 1 mL of HF, 6 mL of HNO3, and 1 mL of HClO4. After decomposition, 0.3 mg of Be carrier was added to the sample, which was then dried on a hotplate and converted to Cl manner by repeated drying with 2 mL of 35% HCl. To mask other interfering elements such as aluminum for the accelerator mass spectrometer (AMS) measurement, 25 mL of 21% EDTA solution with pH 6.0 was added to the sample, followed by the addition of 2 mL of acetylacetone to form the beryllium acetylacetonate complex. The Be complex was then extracted into 5 mL of CCl4 using solvent extraction, and back-extracted into 10 mL of 1 M HCl. The extracted Be solution was purified using cation exchange with a 5 mL Dowex 50 W-X8 column (inner diameter 9 mm, length 10 mm, 1 column volume = 5 mL) with 1.0 M HCl. The Be fraction, eluted between 5 and 9 column volumes, was concentrated to 1 mL and transferred to a 15 mL polycarbonate spitch centrifuge tube. The purified Be solution was then precipitated as Be (OH)2 by adding an ammonium solution. To remove 10B, which causes isobaric interference in AMS measurement, the precipitation was washed three times with Milli-Q water (>18 MΩ), and re-precipitated using ultra-pure HCl and ammonium solution. After washing, the solution was dissolved in a few drops of ultra-pure HCl and transferred to a quartz tube for drying. The purified Be (OH)2 was converted to BeO by igniting at temperatures above 800°C. The resulting BeO was mixed with Nb powder and pressed into an OFCu cathode with an inner diameter of 1 mm. The reactive 10Be abundances were measured using a National Electrostatic Corporation (NEC) accelerator mass spectrometer (AMS) with a 4.8 MV terminal voltage at the Micro Analysis Laboratory, Tandem accelerator (MALT) of the University of Tokyo (U Tokyo), following the method described by Matsuzaki et al. (2020). Absolute values were obtained using the KNB5-2 standard (10Be/9Be = 8.56 × 10⁻¹²; Nishiizumi et al., 2007) with a typical beam current of 4 micro A (9Be16O; Yokoyama et al., 2019). The ratios of 10Be/9Be in the samples ranged from (7–20) × 10−14, while the carrier blank had a ratio of 1.4 × 10⁻¹⁴.
3.2.5 Whole-rock and clay-fraction mineral compositions
To reveal the mineralogical characteristics of the mud volcano sediments, whole-rock and clay-fraction mineral compositions were determined by XRD using an X’Pert PRO MPD X-ray diffractometer system (Malvern Panalytical, Ltd., Malvern, United Kingdom) with CuKα radiation at 45 kV and 40 mA, 0.0083° divergence, anti-scattering slits, and a 0.15 mm receiving slit. The diffracted X-rays were counted for 10.2 s at steps of 0.0083° 2θ. For whole-rock and clay-fraction mineral compositions, we scanned 3°–75° 2θ and 3°–35° 2θ, respectively.
The whole rock mineral compositions were quantified based on relative peak intensities of XRD pattern and the Rock jock program (Eberl., 2003). The analysis procedure followed Tanikawa and Tadai (2018). Sediment samples were dried at 50°C, and then powdered using an agate mortar. Then, 1 g of powdered sample was mixed with 0.25 g of high-purity Al2O3 (AX-5HM, Hinomoto Kenmazai CO., Ltd., Tokyo, Japan), which is the internal standard for Rock jock analysis, using an agate mortar. The 0.1 g of the mixed sample was placed on a slide glass and subjected to XRD analysis.
For clay-fraction analyses, the clay size fraction (<2 μm) was separated from the bulk sediment samples by centrifugation. Clay suspensions were dropped onto glass slides and dried in an oven at 50°C to prepare oriented samples for XRD analysis. After a first round of XRD analysis, the samples were saturated with ethylene glycol vapor at 50°C for more than 5 h and reanalyzed. We also semiquantitatively estimated the proportion of major clay minerals in the clay size fraction using the method of Biscaye (1965). The proportions of illite and smectite crystallites in illite/smectite (I/S) mixed-layer clays were calculated using the angular separation (Δ° 2θ) between the composite illite-(001)/smectite-(002) reflection at 2θ ≈ 10.5° and the composite illite-(002)/smectite-(003) reflection at 2θ ≈ 16° (Moore and Reynolds, 1997).
The percentage of the clay size fraction in the bulk rock was determined by particle size analysis using a Mastersizer et al., 2020 (Malvern Panalytical, Ltd., Malvern, United Kingdom). The sediment samples were first washed through a 2-mm sieve with Milli-Q water, stirred in a dispersant (0.05% sodium hexametaphosphate solution) for 24 h, and then analyzed.
3.2.6 Vitrinite reflectance
The vitrinite reflection was analysed to examine the thermal maturity of organic matter. The vitrinite reflectance value (RO) increases exponentially with temperature and records the highest temperature experienced by organic matter (Burnham and Sweeney, 1989). We collected samples of organic matter from MV#1, #2, #3, and #14. To collect enough samples for the vitrinite analysis, sediment samples were collected from three depths in each core, and the data was combined for each mud volcano. For each sample, coal fragments were separated and concentrated using heavy liquids (a sodium polytungstate solution with a specific gravity of 1.8). The separated grains were then mounted in resin and polished using 0.06-μm alumina powder. The measurements were conducted with a silicone-diode microphotometer using 546 nm non-polarized light, in line with the regulations of the International Organization for Standardization (ISO 7404-5), the American Society for Testing and Materials (ASTMD 2798-99), and the Japan Industrial Standard (JIS M 8816). A concentrated spot beam of 1.6-μm diameter was used to measure the reflectance. We measured mean random reflectance (Rm) following ASTMD 2798-05. A linear function between mean random reflectance and mean maximum reflectance has been reported in case of lower vitrinite reflectance (<3.0%: Chijiwa, 1990; <1.7%: ASTM Standard D2798-05). Therefore, the effect of anisotropy of vitrinite reflectance should be small when it was low. A total of >41 grains per each sample were measured in the immersion oil which has a refractive index of 1.516, where a sufficient number of polished grains were present on the sample surface. The equations for calculating the maximum temperature experienced by the sample using measured Rm values were defined by Sweeney and Burnham (1990).
3.3 Pore water samples and analyses
Pore water chemistry is crucial to examine the origin of fluids within the mud volcano sediments, as well as the biogeochemical processes occurring within these sediments. After piston core recovery, wet sediments were immediately sampled at 20- to 50-cm intervals and pore water samples were extracted onboard using a stainless-steel squeezer (Manheim and Sales, 1974). For sediment samples retrieved by a multiple corer, the porous tube of a Rhizon sampler (2.5-mm diameter, 0.15-µm mean pore size) was inserted and buried in the sediment to extract pore water.
In an onshore laboratory, Cl− and SO42− concentrations in the pore water samples were analyzed using an ion chromatograph (Dionex DX-500) with an isocratic carbonate/bicarbonate eluent coupled with suppressed conductivity detection and an IonPac AS12A carbonate eluent anion-exchange column (200 mm long, 4 mm inner diameter; Dionex, United States) equipped with a guard column (IonPac AG12A, 50 mm long, 4 mm inner diameter; Dionex, United States). Based on repeated measurements of the same samples, we estimate that our analytical precision was within 0.3% and 0.4% for Cl− and SO42−, respectively. The hydrogen and oxygen isotopic compositions (δD and δ18O, respectively) of pore water samples were analyzed by laser absorption spectroscopy (LWIA-24-EP, Los Gatos Research Inc., United States). Based on repeated analyses of our laboratory standard (Indian Ocean deep seawater), standard deviations were 0.3‰ and 0.1‰ for δD and δ18O, respectively. Pore water dissolved inorganic carbon (DIC) concentrations and carbon isotopic compositions (δ13C-DIC) were analyzed by isotope ratio monitoring gas chromatography/mass spectrometry using a Thermo Finnigan Delta Plus XP isotope-ratio mass spectrometer connected to a TRACE GC as described by Ijiri et al. (2012). Values of δD and δ18O are reported relative to Vienna Standard Mean Ocean Water (VSMOW); δ13C results are reported relative to the Vienna Peedee Belemnite (VPDB) standard.
3.4 Hydrocarbon gas analysis
To examine the origin of hydrocarbon gases, we analyzed chemical and isotopic compositions of the hydrocarbon gases. Sediment samples for methane and ethane concentration measurements were collected using tip-cut plastic syringes immediately after core recovery. Syringe ends were tightly capped with silicone-rubber stoppers. The sediment samples were transferred from the syringes into glass vials in a N2-flushed glove bag, and the vials were capped with Teflon-coated rubber septa and aluminum seals, then frozen at 20°C and stored for subsequent geochemical analyses.
In an onshore laboratory, methane (CH4) and ethane (C2H6) concentrations, stable carbon isotopic compositions (δ13C-CH4), and stable hydrogen isotopic compositions (δD-CH4) were determined by isotope ratio monitoring-gas chromatography and combustion mass spectrometry using a Thermo-Finnigan Delta Plus XP isotope-ratio mass spectrometer connected to a TRACE GC via a GC COMBUSTION III combustion furnace and via a High Temperature Conversion Interface, respectively, following the method of Tsunogai et al. (2002).
4 Results and discussion
4.1 Analyses of sediments
4.1.1 X-ray computed tomography images
X-ray computed tomography (CT) images of the cores from MV#1–3 showed that mud-supported breccias are included in the muddy sediments (X-ray intensity being proportional to density; Figure 3). The observed lack of sedimentary structure suggests that clasts of surrounding rocks were ripped away from their source strata and incorporated into the intruding mud diapir via hydraulic fracturing (Ujiié, 2000). Sediments from MV#2 in particular contain relatively hard, centimeter-scale clasts, especially at greater depths. However, these clasts in Section 5, Section 6 are loosely consolidated, so that they crumbled easily in hand. Note that MV#3 core was only imaged for less than half of its width due to scanning residual sediments after on-board sub-sampling. In contrast to the mud volcano sediments, the reference core did not contain any evidence of a mud breccia.
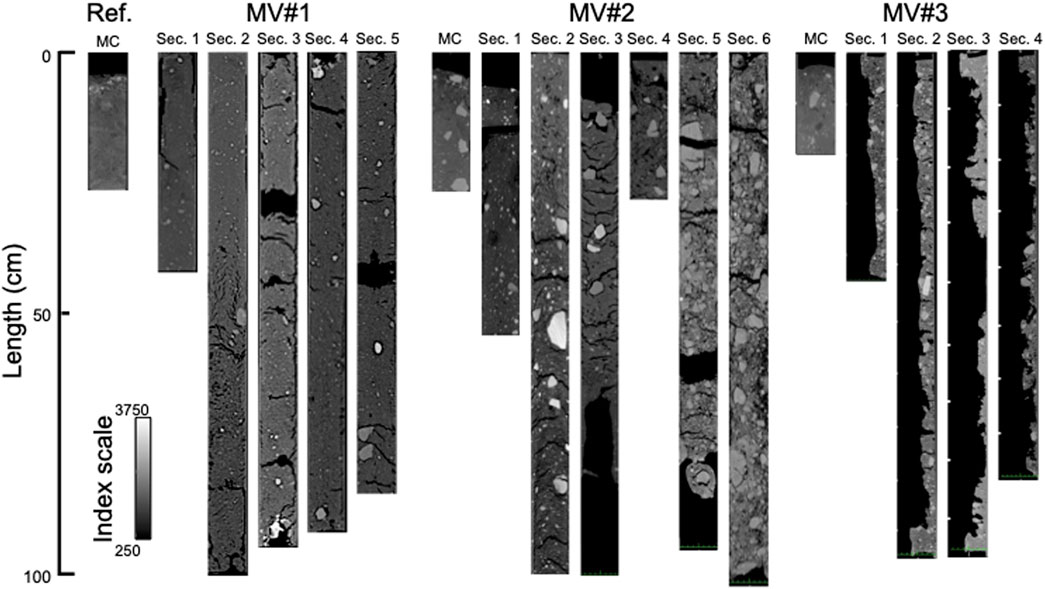
FIGURE 3. X-ray CT scans of the sediment cores obtained from MV#1–3 and the reference site. The gray scale is the index scale showing CT number.
4.1.2 Sediment ages
All studied samples from the cores MV#1, MV#2, and MV#14 yielded sufficient number of calcareous nannofossils for sub-quantitative study. Samples from the core MV#3, however, varied in abundance of calcareous nannofossils. The samples from 47.5, 153.5, and 314.5 cm below seafloor (cmbsf) contained calcareous nannofossils abundantly, while the samples from 126.5 and from 263 cmbsf rarely yielded calcareous nannofossils (Supplementary Table S2).
The calcareous nannofossil assemblages of all studied samples contained long-ranged species such as the Eocene–Pleistocene species Reticulofenestra minuta and/or the Miocene–Pleistocene medium-sized Reticulofenestra species (Reticulofenestra minuta, Reticulofenestra minuta/haquii, Reticulofenestra pseudoumbilicus (5–7 µm), or Reticulofenestra producta) common-abundantly, as well as various Paleocene–modern species such as Coccolithus pelagicus in relatively low abundance. Twelve Miocene–specific species were recognized in low abundance in many samples, but the Paleocene–specific species were not recognized (Figure 4; Supplementary Table S2). These results suggest that the age of sediments of source sequence of mud volcanos is in the Miocene. Calcareous nannofossil assemblages from the uppermost sample (22 cmbsf) at MV#14 was dominated by Emiliania huxleyi, and lacked Miocene-specific species, suggesting that MV#14 is currently inactive and the uppermost sample (22 cmbsf) of the site was deposited after the end of mud–eruption activity in/before the E. huxleyi acme period (0.082 Ma–present, Raffi et al., 2006). Coexistence of E. huxleyi and Miocene–Pleistocene species in upper 40 cmbsf at MV#1 and around 120 cmbsf at MV#14 implies the incorporation of the Quaternary sediments by the movement of mud associated with the occasional mud eruption (Fesker et al., 2014). Ujiié (2000) reported that the Quaternary hemipelagic sediments, approximately 3.5 m thick, overlay the mud volcano sediments in MV#2, indicating that mud volcanism might have been inactive at the time of their 1994 survey. However, the absence of E. huxleyi in the surface sediments from MV#2 collected during 2019 survey suggests that mud eruptions may have occurred after 1994 or that the 1994 coring missed the location where mud was erupting.
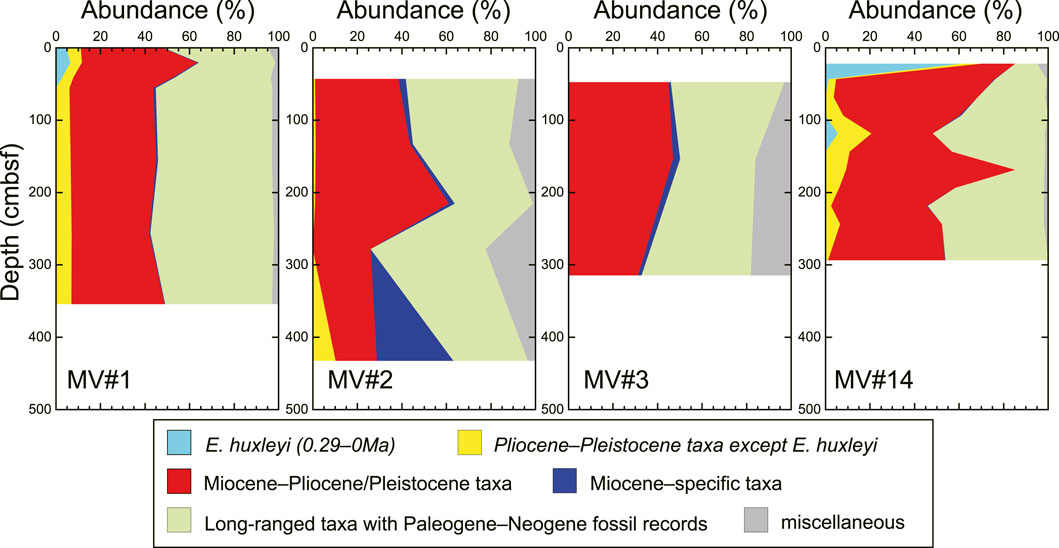
FIGURE 4. Relative abundances of calcareous nannofossils, grouped as E. huxleyi, Gephyrocapsa spp., early to late Miocene species, and other species.
The contents of 10Be varied over a wide range across the four studied mud volcanoes (6–318 × 105 atoms g−1; Figure 5A; Supplementary Table S4). At MV#1, 10Be contents were relatively constant at ∼115 × 105 atoms g−1 regardless of depth. At MV#3, 10Be contents were ∼25–50 × 105 atoms g−1. At MV#14, 10Be contents were 144–318 × 105 atoms g−1, higher than those at the other mud volcanoes, and were greatest in the shallowest sample (22 cmbsf). At MV#2, we analyzed 10Be contents in the mud breccia (>2 mm), mud matrix (2 μm–2 mm), and clay (<2 µm) fractions separately to test for any size-dependence of 10Be contents (ages). Ujiié (2000) reported that the exotic fossils and clast shapes in the mud volcano sediments were torn off and taken into the mud diapir via hydraulic fracturing through an intrusive process. Therefore, we expected the 10Be contents are different among the mud breccia, mud matrix, and clay. However, the 10Be contents were not consistent across all particle sizes at each depth. Breccia, matrix, and clay 10Be contents at 43 cmbsf were 22 × 105, 6 × 10⁵, and 19 × 105 atoms g−1, respectively (lowest content in the matrix, highest in the breccia); those at 216 cmbsf were 16 × 105, 34 × 105, and 30 × 105 atoms g−1, respectively (lowest in the breccia, highest in the clay); and those at 433 cmbsf were 147 × 105, 272 × 105, and 261 × 105 atoms g−1, respectively (lowest in the breccia and highest in the clay). More data would be required to investigate the 10Be age differences depend on sediment type.
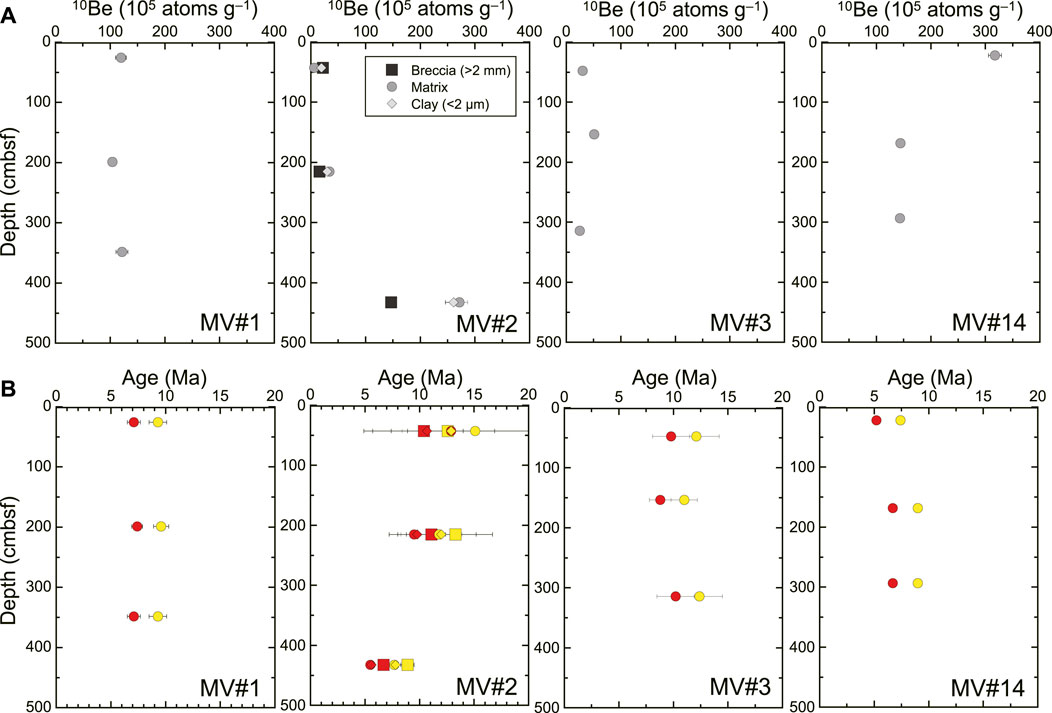
FIGURE 5. Vertical (A) 10Be content and (B) estimated 10Be age profiles at MV#1–3 and MV#14. In (B), the red and yellow symbols represent the ages calculated using the initial concentrations of 10Be assumed from the 10Be concentrations in the surface sediments at the Sagami Bay and the reference site, respectively.
To calculate 10Be ages, we used 10Be data for surface sediments from two sites as initial concentrations: our reference site, off Tanegashima Island (4.4 × 10⁸ atoms g−1), and one in Sagami Bay, south of Honshu, central Japan (14.0 × 10⁸ atoms g−1), because of the wide variation in 10Be contents in surface sediments ranging from 1.2 × 10⁸ and 16.0 × 10⁸ atoms g−1 (Bourles et al., 1989). The calculated 10Be ages using the 10Be content at the reference site ranged from 7 to 15 Ma, and those using the Sagami Bay data ranged from 5 to 13 Ma (Figure 5B). Although the estimated ages deviated by 2 Myr because of the difference in the assumed initial concentration, they are all middle to late Miocene.
This 10Be age is consistent with the nannofossil assemblages which suggest that the age of the source sequence is the Miocene. Because the nannofossil observations indicate that the sediments comprise a mixture of sediments deposited at different ages, the 10Be ages should be mixed values and the observed age variations are likely due to differences in the mixing ratio. Indeed, we obtained the youngest 10Be age (7–5 Ma) for the highest 10Be content observed at 22 cmbsf in MV#14, consistent with the dominance of E. huxleyi in the nannofossil assemblage at that depth. Furthermore, the estimated 10Be ages for MV#1 and MV#14 (<10 Ma) were younger than those for MV#2 and MV#3 (>10 Ma), consistent with the higher abundances of Pliocene–Pleistocene taxa except E. huxleyi at MV#1 and MV#14 than at MV#2 and MV#3 (Figure 4). Thus, we attribute the young 10Be ages at MV#1 and MV#14 to increased mixing with younger sediments. We note that, at 432.5 cmbsf in MV#2, the 10Be age was relatively young (8–6 Ma). However, Minylitha convallis (Zones NN9–NN11A; ∼9.8–7.7 Ma) was abundant in the same sample (Supplementary Table S2), indicating good agreement between the 10Be and nannofossil ages. Based on the nannofossil and 10Be data, we conclude that each studied mud volcano has a middle to late Miocene source sequence. Note that depending on the proportion of younger sediments, there is a possibility that the sediments could attributed to the Early Miocene.
4.1.3 Whole-rock mineral compositions
The mud volcano sediments comprised 17–33 wt% quartz (avg. 26 wt%), 14–33 wt% illite (avg., 23 wt%), 12–19 wt% plagioclase (avg., 16 wt%), and other minerals (Figure 6A; Supplementary Table S5). Overall clay mineral contents were 32–52 wt% (illite, smectite, chlorite, and kaolinite; avg., 43 wt%), MV#1 sediments contained less pyroxene (<2 wt%) than other mud volcano sediments (3–7 wt%). MV#1 and MV#14 contained slightly more quartz (25–33 wt%) and slightly less clay minerals (32–47 wt%) than MV#2 and MV#3 (17–24 wt% quartz, 41–52 wt% clay minerals). The generally similar mineral contents of the sediments at each mud volcano (i.e., dominated by clay minerals, especially illite) implies that the mud volcanoes off Tanegashima Island are rooted in the same source sequence.
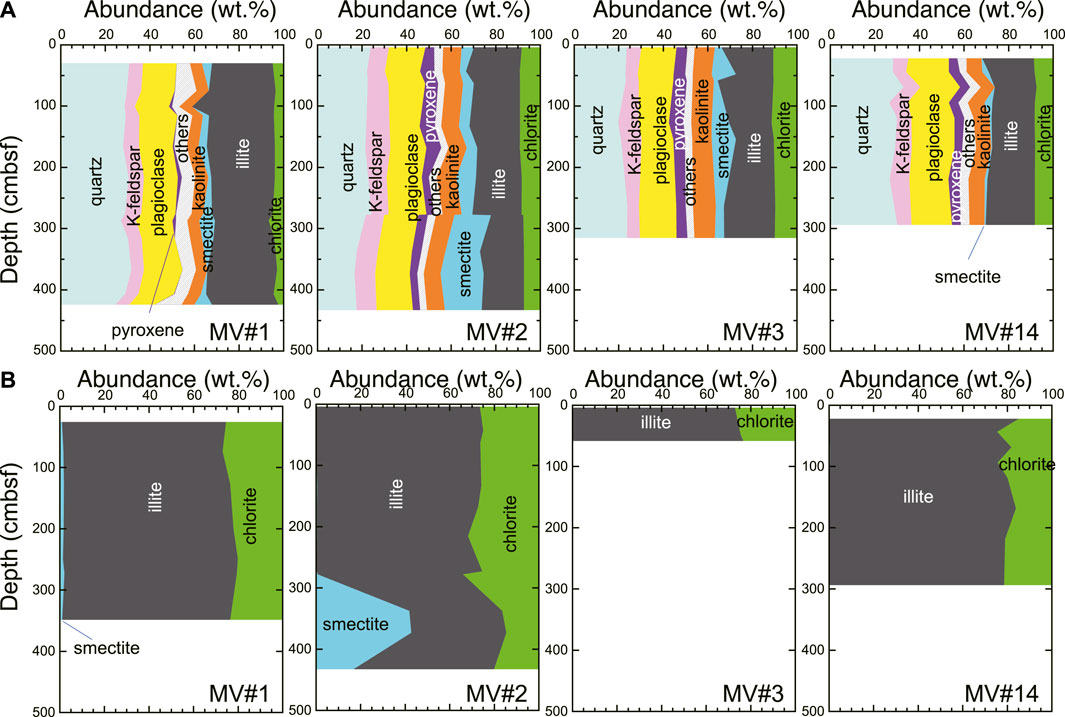
FIGURE 6. (A) Vertical profiles of whole-rock mineral compositions and (B) clay mineral compositions in the clay size fraction at MV#1–3 and MV#14.
4.1.4 Mineral composition of the clay size fraction
Figure 7 shows X-ray diffractograms for ethylene-glycolated samples from MV#1–3, MV#14, and the reference site; those of the clay size fraction showed similar patterns. The X-ray diffractograms of the mud volcano sediments showed high peak intensities at 2θ ≈ 9°, which represents illite (001). A small peak at 2θ ≈ 5.5°, attributed to a mixture of discrete smectite and I/S mixed-layer clay, was hidden behind the chlorite (001) peak at 2θ ≈ 6°. The overlapping peaks of chlorite (002) and kaolinite (001) at 2θ ≈ 13.5° were high. In the samples from deeper than 337 cmbsf in MV#2, the peak of discrete smectite and I/S mixed-layer clay was high. In that same sample, we could also identify the composite reflections of illite (001)/smectite (002) at 2θ ≈ 10° and of illite (002)/smectite (003) at 2θ ≈ 16°. These observations indicate that illite dominates the mineralogy of the clay fraction, whereas smectite represents only a small proportion. Peak intensities in the X-ray diffractogram of the reference site sample were much lower than those of the mud volcano sediments (Figure 7); in particular, the smectite peak at 2θ ≈ 5.5° was subtle.
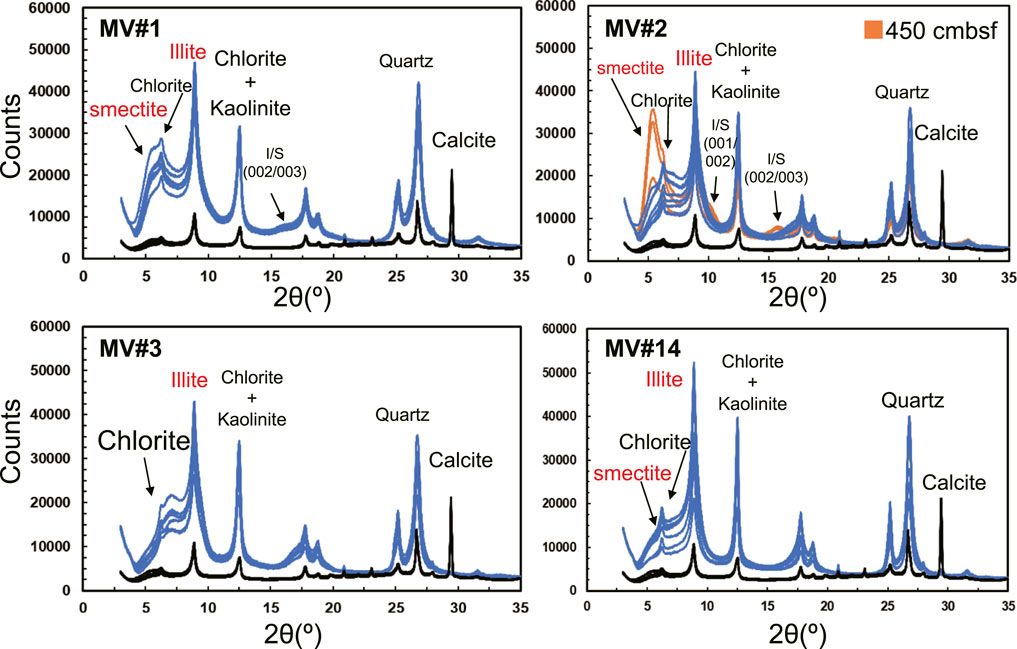
FIGURE 7. X-ray diffractograms of the clay size fraction in sediments from MV#1–3 and MV#14.
Particle size analysis showed that the clay size fraction (<2 µm) comprises 19%–28% of the mud volcano sediments and 4%–11% of the reference sediment (Supplementary Table S6).
The relative proportions of clay minerals in the clay size fraction, estimated following Biscaye (1965), are shown in Figure 6B and listed in Supplementary Table S6. Below 58 cmbsf at MV#3, the smectite peak could not be detected; therefore, we did not estimate relative clay mineral abundances at greater depths there. In most samples from MV#2 (<337 cmbsf), MV#3, and MV#14, the clay mineralogy of the clay fraction comprised <2% smectite, 65%–79% illite (avg., 74%), and 20%–34% chlorite + kaolinite (avg., 26%). At >337 cmbsf in MV#2, the smectite content increased to as high as 43%. Sediment at the reference site comprised ≲1% smectite, ∼76% illite, and ∼23% chlorite + kaolinite. In MV#3, the integrated peak areas for illite and chlorite + kaolinite peaks below 58 cmbsf are similar to those above 58 cmbsf (Figure 7; Supplementary Table S6). Therefore, it can be inferred that the abundance ratios of illite to chlorite + kaolinite below 58 cmbsf are similar to those above 58 cmbsf.
Overall, the clay fraction at each mud volcano was characterized by similar illite-dominated clay mineralogies. Alongside the similar whole-rock mineral compositions of sediments at each mud volcano, this finding further suggests that the mud volcanoes off Tanegashima Island are rooted in the same source sequence.
4.1.5 Vitrinite reflectance
Histograms of vitrinite reflectance at each mud volcano peaked at 0%–0.5%, with consistent median values at MV#1, MV#2, MV#3, and MV#14 of 0.42%, 0.43%, 0.44%, and 0.42%, respectively (Figure 8). Considering the thresholds for oil, wet gas, and dry gas production (0.5%–0.6%, >1.3%, and >1.7%, respectively; e.g., Tissot et al., 1987), these low reflectance values indicate that the organic matter transported to the surface at these mud volcanoes is too immature to produce oil or gas. The similar reflectance values and distributions at each mud volcano also indicate that the organic matter is derived from the same source sequence. Assuming the age of the sediment to be 15 Ma (i.e., our oldest 10Be age), the experienced temperatures of organic matters for MV#1, MV#2, MV#3, and MV#14 were calculated to 81, 83, 85, and 81°C, respectively (Supplementary Table S7).
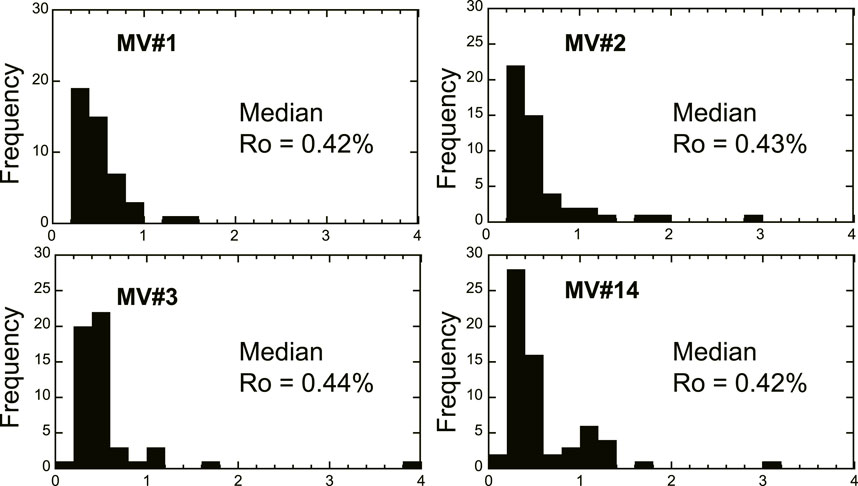
FIGURE 8. Vitrinite reflectance histograms in sediments from MV#1–3 and MV#14.
4.1.6 Constraints on the source sequence
The calcareous nannofossil assemblages, 10Be ages, similar illite-dominated mineralogical compositions, and vitrinite reflectance values (∼0.4%) of the sediments at the studied mud volcanoes strongly suggest that the mud volcano field off Tanegashima Island is rooted in the same Miocene source sequence containing immature organic matter. Although sediments at MV#1 and MV#14 are characterized by lower abundances of Miocene nannofossils, younger 10Be ages, and lower clay mineral contents than MV#2 and MV#3, we attribute these differences to mixing with younger sediments.
Based on the analyzed sediment data, we can constrain the origin of the mud volcano sediments. The Upper Shimanto Group, characterized by Paleogene and lower Miocene rocks, is distributed along Tanegashima Island and the southern parts of Kyushu and Shikoku Islands (Taira et al., 1982). Thus, the group should also occur in the subseafloor in the mud volcano field off Tanegashima Island. If the age of the source sequence is early Miocene, i.e., older than our estimation, the source sediments might be accreted sediments of the Upper Shimanto Group. However, if the source sequence is middle to late Miocene as estimated here, the source sequence cannot be derived from the Shimanto Belt. Based on the experienced temperatures determined from the vitrinite reflectance values (81°C–85°C) and the local geothermal gradient of 25°C km−1 (Ohde et al., 2018), we estimate the depth of the source sequence to be 3.2–3.4 kmbsf.
The illite-rich sediments in the studied mud volcanoes off Tanegashima Island contrast with the smectite-rich sediments in mud volcanoes of the Kumano forearc basin (Ijiri et al., 2018b). The difference could be explained by the distribution of illite in the present surface sediments. Southeast of Kyushu Island, including our study area, illite contents are extremely high in the clay fraction of surface sediments (Aoki and Oinuma, 1988). The illite is detrital in origin, supplied to the East China Sea from mainland China by the Yangtze and Yellow Rivers (Nittrouer et al., 1984; Aoki and Oinuma, 1988) and transported from the East China Sea by the Kuroshio Current (Yin et al., 1987; Aoki and Oinuma, 1988). If the source sequence was deposited during the Miocene, the East China Sea was not yet fully open during their deposition (e.g., Fu et al., 2022), and the illite in those sediments may have been transported directly from mainland China. Nonetheless, this variation in supply paths cannot explain the high clay mineral contents of the studied mud volcano sediments.
4.2 Porewaters and hydrocarbon gases
4.2.1 Porewater chemistry
Cl− concentrations in pore waters at all studied mud volcanoes decreased from the seawater concentration (∼560 mM) with increasing depth (Figure 9A; Supplementary Table S8). The Cl− concentrations decreased asymptotically to ∼230 mM by 250 cmbsf at MV#1, ∼250 mM by 260 cmbsf at MV#2, and ∼220 mM by 80 cmbsf at MV#3. In contrast, the Cl− concentration only decreased to ∼480 mM at the core bottom (294 cmbsf) at MV#14. The general asymptotic decrease of Cl− concentrations with increasing depth at all studied mud volcanoes suggests the upward advection of low-Cl− fluids.
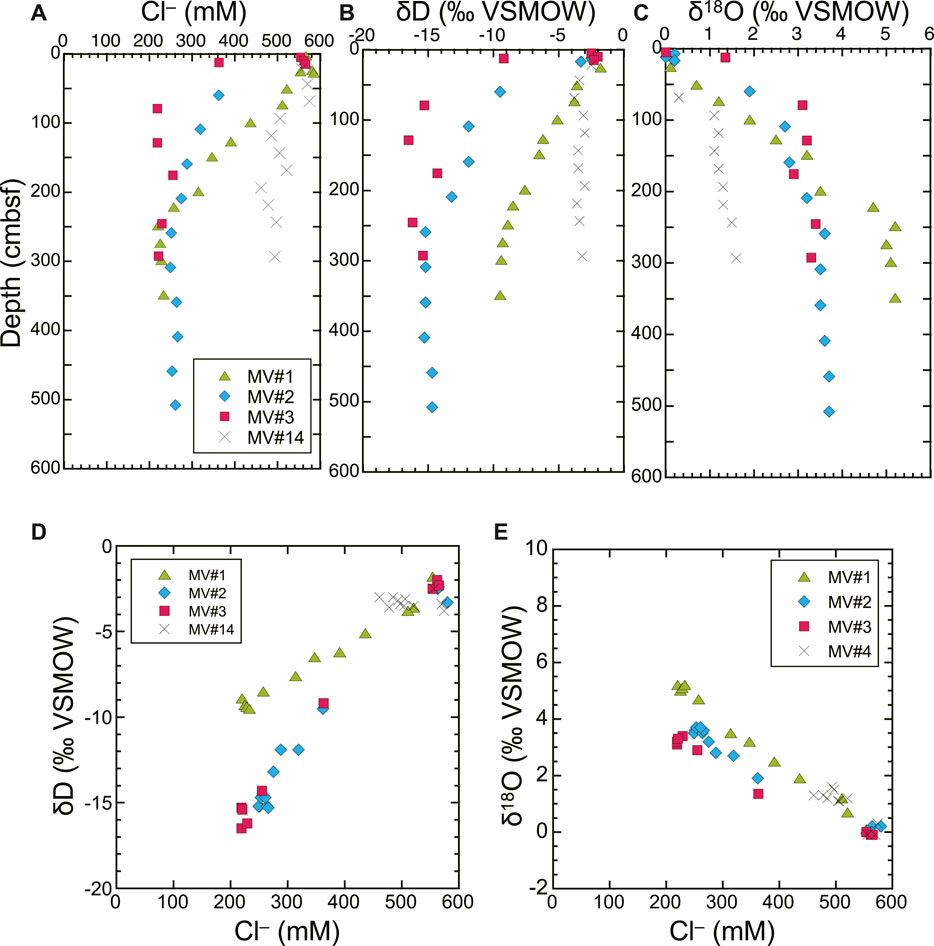
FIGURE 9. Vertical profiles of porewater (A) Cl− concentrations and (B,C) δD and δ18O values at MV#1–3 and MV#14. Plots of (D) Cl− vs. δD and (E) Cl− vs. δ18O.
Porewater δD and δ18O profiles were consistent with the Cl− profiles (Figures 9A–C; Supplementary Table S8). The δD values decreased asymptotically from ca. −2‰ near the seafloor to ca. −9‰ by 250 cmbsf at MV#1, ca. −15‰ by 260 cmbsf at MV#2, ca. −15‰ by 80 cmbsf at MV#3, and ca. −4‰ to −3‰ by 70 cmbsf at MV#14. The δ18O values increased asymptotically from ∼0‰ near the seafloor to ca. +5‰ by 250 cmbsf at MV#1, ca. +3.5‰ by 260 cmbsf at MV#2, ca. +3‰ by 80 cmbsf at MV#3, and +1.1‰ to +1.6‰ by 90 cmbsf at MV#14.
Plots of δD and δ18O values against Cl− concentrations reveal linear relationships at each mud volcano (Figures 9D, E), with the exception of δD vs. Cl− at MV#14 (R2 = 0.01). Enrichment in 18O and depletion in D alongside depletion in Cl− is attributed to the incorporation of freshwater due to clay-mineral dehydration, such as during the smectite-to-illite transformation that typically occurs at 60°C–160°C (Yeh, 1980; Kastner et al., 1991; You and Gieskes, 2001). Indeed, this process was previously reported at MV#1 by Nakayama et al. (2010).
Assuming that the porewater isotopic compositions result from simple mixing with freshwater [(Cl−) = 0 mM], the δ18O and δD values of the freshwater component can be estimated by extrapolating from [Cl−] = 0 mM to the observed porewater data. We obtained extrapolated freshwater δD values at MV#1, #2, and #3 of −14‰ ± 1‰, −24‰ ± 2‰, and −25‰ ± 1‰, respectively (95% confidence interval); we did not extrapolate the δD value for MV#14 because δD was not correlated with Cl−. We obtained extrapolated freshwater δ18O values at MV#1, #2, #3, and #14 of +8.5‰ ± 0.3‰, +6.3‰ ± 0.4‰, +5.3‰ ± 0.4‰, and +8.0‰ ±3.0‰, respectively (95% confidence interval). The δ18O values of the freshwater components are similar at MV#1 and MV#14 (+8.5‰ and +8.0‰, respectively) and at MV#2 and MV#3 (+6.3‰ and +5.3‰, respectively). These differences in the end member freshwater values may be due to differences in the δ18O values of the source clays and/or variations in the temperature at which they dehydrated.
To constrain the reason for the different end member freshwater δ18O values at each mud volcano, we calculated the formation temperature of the fluid following the method of Hensen et al. (2004). Using the estimated δD and δ18O values of the freshwater component and previously reported clay–water equilibrium fractionation factors for δD (Yeh, 1980; Capuano, 1992) and δ18O (Sheppard and Gilg, 1996), we estimated theoretical clay mineral δD and δ18O values capable of producing the estimated δD and δ18O values of the freshwater component at different temperatures (Figures 10A, B). Then, we compared previously reported H and O isotopic variations in marine clays (shaded ranges in Figure 10; Savin and Epstein, 1970; Suchecki and Land, 1983; Yeh, 1980) to the theoretical δD and δ18O values calculated for clay minerals at different temperatures to constrain the fluid formation temperature (Figures 10A, B). The equilibrium fractionation curves for MV#1–3 and MV#14 intersect the δ18O range of marine clays at 90, 70, 60, and 85°C, respectively, representing minimum values (Figure 10A). We could not estimate maximum values based on the δ18O range because the high-temperature intersections were around 400°C, at which temperature clay-mineral dehydration should be complete. Nonetheless, we constrained the maximum formation temperature at MV#1, #2, and #3 to 145, 185, and 190°C, respectively, using the δD fractionation factor of Capuano (1992) (Figure 10B). However, that fractionation factor gives low-temperature intersections below 60°C, at which temperature clay-mineral dehydration does not occur. Therefore, we estimate that the clay minerals dehydrated at 60°C–190°C, which is generally consistent with the smectite–illite transformation temperature (60°C–160°C; Yeh, 1980; Kastner et al., 1991) and estimated equilibrium temperatures of heavy noble gases at MV#1 and MV#14 (83°C–230°C; Mitsutome et al., 2023). Given the local geothermal gradient of 25°C km−1 (Ohde et al., 2018), we estimate that clay-mineral dehydration occurred at 2.4–7.6 kmbsf.
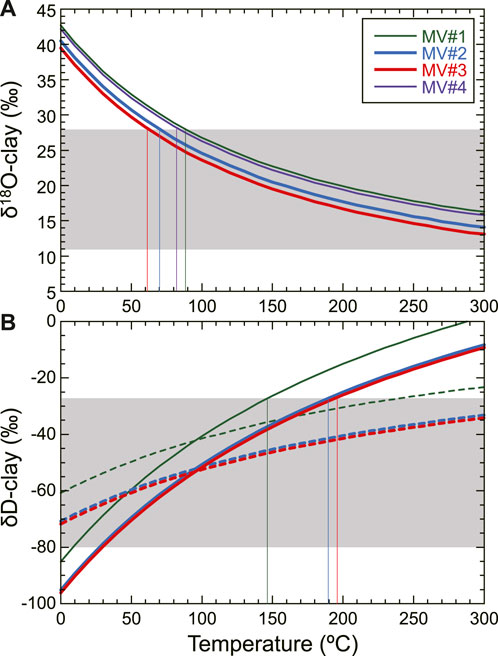
FIGURE 10. Calculation of theoretical temperatures of fluid formation assuming equilibrium fractionation between the pore fluid and clay minerals, after Hensen et al. (2004). (A) Theoretical δ18O values of clays were calculated using fractionation factors from Sheppard and Gilg (1996) at different temperatures based on fluid endmembers for MV#1–3 and MV#14, and (B) theoretical δD values were calculated using fractionation factors from [Yeh (1980); dashed lines] and [Capuano (1992); solid lines]. The shaded areas indicate previously reported ranges of δD and δ18O values for marine clays.
4.2.2 Quantitative evaluation of Cl− profiles
To quantitatively evaluate the observed differences in the vertical Cl− profiles, we modeled them down to 10,000 cmbsf in 10-cm increments by using the one-dimensional unsteady diffusion/advection tracer equation:
where C is the porewater Cl− concentration,
where D0 = 2 × 10⁻⁹ m2 s−1 is the diffusion coefficient of Cl− in water and m1 = 2.4, m2 = 1, and B = 10−11 are constants, to obtain Deff = 4.3 × 10⁻¹⁰ m2 s−1. As the initial state of the Cl− profile just after a mud eruption, we assumed the Cl− concentration at the bottom of the MV#1 and MV#3 cores (∼230 mM) to be the original value of the deep fluid, and that the Cl− concentrations were constant from depth to the surface immediately after the eruption (dashed lines in Figure 11). Then, we estimated fluid advection rates and the time since the most recent mud eruption by comparing the numerically simulated and observed Cl− profiles. We obtained respective advection rates and times since the most recent eruption of 10 mm y−1 and 100–500 years at MV#1, 1 mm y−1 and 100–200 years at MV#2, 100 mm y−1 and 4–20 years at MV#3, and 0.1 mm y−1 and 2,000–10,000 years at MV#4. At MV#3, the simulated Cl− profiles change little from 4 to 20 years, indicating that the fast advection rate there mainly determines the vertical profile at steady state. In contrast, the slow advection rate and downward diffusion of seawater from the seafloor mainly determine the profile at MV#14. These results indicate that the relative levels of activity at each mud volcano are, in order of decreasing activity, MV#3, MV#2, MV#1, and MV#14, which is dormant. This result is consistent with our nannofossil observations and the conclusions of Mitsutome et al. (2023). The Cl−profile in MV#1 sediment obtained during the 2002 survey (Nakayama et al., 2010) is similar to that obtained in this study during the 2015 survey, suggesting the activity of MV#1 has remained unchanged from 2002 to 2015.
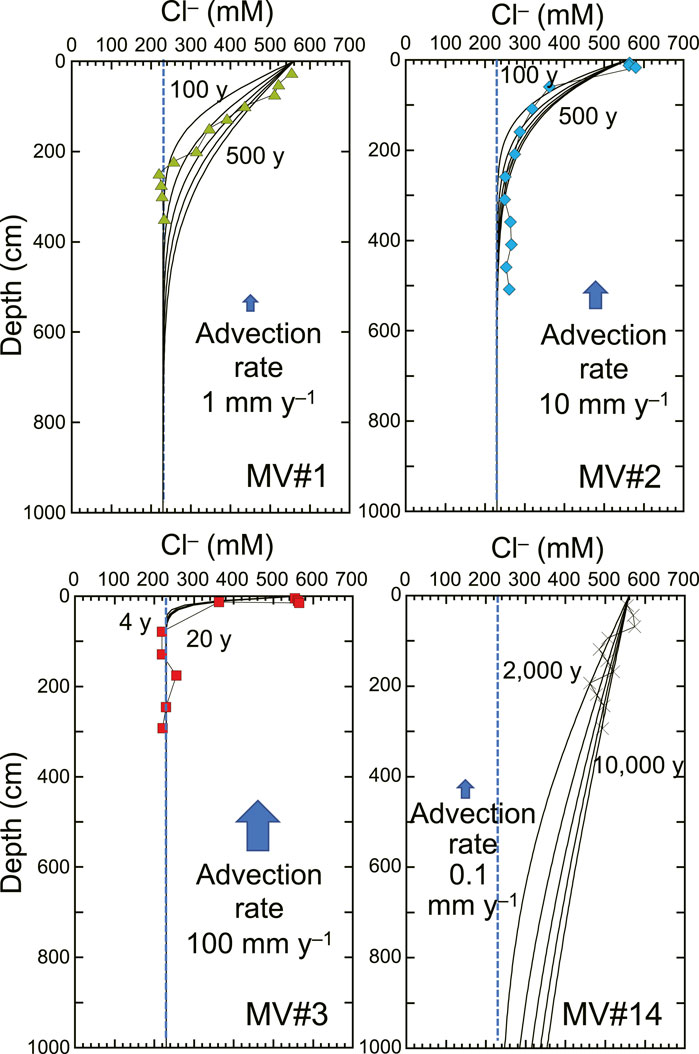
FIGURE 11. Modeled Cl− profiles after a mud volcano eruption calculated using the one-dimensional unsteady advective diffusion model for MV#1–3 and MV#14. Dashed blue lines indicate the initial, constant Cl− profiles just after a mud eruption.
4.2.3 Hydrocarbon gases, dissolved inorganic carbon, and sulfate
Porewater SO42−, CH4, and DIC concentrations and δ13C-CH4 and δ13C-DIC values are shown in Figures 12A–D and reported in Supplementary Tables S8, S9. At MV#1, pore water contained <1 mM CH4 at 40 cmbsf and >5 mM below 90 cmbsf. The δ13C-CH4 values increased from −58‰ at 40 cmbsf to −42‰ at 290 cmbsf. Porewater SO42− concentrations decreased from 25 mM at 25 cmbsf to 3 mM at 75 cmbsf and <2 mM below 125 cmbsf. Based on the CH4 and SO42− profiles, we interpret that the sulfate–methane transition zone (SMTZ), where most methane is consumed by microbial anoxic methane oxidation and microbial sulfate reduction) at MV#1 is at 70–90 cmbsf. DIC concentrations generally increased from 3 mM at 25 cmbsf to ∼45 mM below 270 cmbsf, and δ13C-DIC values increased asymptotically from ca. −20‰ near the surface to +1‰–2‰ below 220 cmbsf.
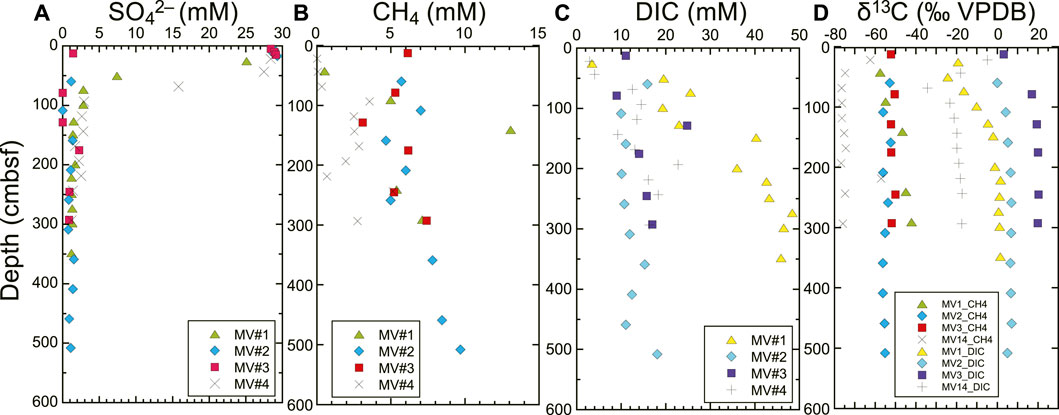
FIGURE 12. Vertical profiles of (A) SO42−, (B) CH4, and (C) DIC concentrations, and of (D) δ13C values of methane and DIC in MV#1–3 and MV#14.
At MV#2, CH4 concentrations were 5–10 mM and δ13C-CH4 values varied from −56‰ to −52‰, respectively, largely regardless of depth. SO42− concentrations were ∼28 mM near the seafloor and decreased to <1.5 mM below 60 cmbsf. The CH4 and SO42− profiles indicate that the SMTZ is within the upper 60 cmbsf. DIC concentrations varied within 10–18 mM and δ13C-DIC values increased asymptotically from 0‰ at 60 cmbsf to +7‰ below 210 cmbsf.
At MV#3, CH4 concentrations were 3–7 mM and δ13C-CH4 was stable at ca. −52‰ regardless of depth. SO42− concentrations were 28 mM near the seafloor, 1 mM at 13 cmbsf in the piston core, and 0–2 mM at greater depths, placing the SMTZ near the seafloor. DIC concentrations generally increased from ∼10 mM near the seafloor to 17 mM at the bottom of the core, except for an exceptionally high value of 25 mM at 130 cmbsf, and δ13C-DIC values increased asymptotically from +3‰ near the seafloor to ca. +20‰ below 130 cmbsf.
At MV#14, CH4 concentrations were <1 mM in the upper 70 cmbsf and increased to 2–5 mM below 90 cmbsf (except for a deviation to 0.7 mM at 219 cmbsf). δ13C-CH4 values decreased from −63‰ at 22 cmbsf to ca −76‰ at greater depths (again, except for a deviation to −57‰ at 219 cmbsf). SO42− concentrations decreased from 28 mM at 20 cmbsf to <3 mM below 95 cmbsf. The CH4 and SO42− profiles place the SMTZ at 70–90 cmbsf. DIC concentrations generally increased from 3 mM near the seafloor to ∼18 mM at the bottom of the core. The δ13C-DIC values decreased from −5‰ near the seafloor to −34‰ at 94 cmbsf, then increased to −17‰ at the bottom of the core.
Based on the methane/ethane concentration ratios (C1/C2) and δ13C-CH4 and δD-CH4 values below the SMTZ, hydrocarbon gases at MV#1 are mostly derived from the thermal decomposition of organic matter in deep sediments (Figures 13A, B). At MV#14, these data indicate that most methane is of biogenic origin, i.e., produced by hydrogenotrophic methanogenesis. Based on the C1/C2 ratios and δ13C-CH4 values at MV#1 and MV#14, we developed a two-end member mixing model between biogenic and thermogenic methane (Figure 13A). As the biogenic end member, we used the sample with the highest C1/C2 value (4,414) and the lowest δ13C-CH4 value (−76‰) from MV#14. We used two different thermogenic end members: the lowest C1/C2 ratio (8; associated δ13C-CH4 = −47‰) and the highest δ13C-CH4 value (−42‰; associated C1/C2 = 20) from MV#1. This mixing scenario constrains the thermogenic contribution to 60%–80% of the methane at MV#2. In contrast, methane at MV#3 plots above the mixing line because of its high C1/C2. Below the SMTZ at MV#3, the δ13C-DIC values are high (ca. +20‰), and the isotope separation between δ13C-CH4 and δ13C-DIC (expressed as the C isotopic separation factor εC ≈ δ13CDIC − δ13CCH4) was >70‰ (Figure 13C). Despite the relatively 13C-enriched CH4 at MV#3, the large εC value indicates hydrogenotrophic methanogenesis (Whiticar, 1999). The addition of methane produced by hydrogenotrophic methanogenesis in a high-δ13C-DIC source sediment to thermogenic methane derived from greater depths was observed at a mud volcano in the Kumano forearc basin (Ijiri et al., 2018a). Such “secondary methanogenesis” may have occurred in the MV#3 mud reservoir (Milkov, 2011; Milkov and Etiope, 2018). As at MV#1–3, thermogenic methane should have been supplied to MV#14. However, because MV#14 is inactive, the present supply of thermogenic methane from deep sediments should be limited, and methanogenesis in shallower sediments likely overprinted the thermogenic signals at MV#14. Consequently, we assume that thermogenic methane was supplied to all studied mud volcanoes during their active periods, indicating that the supply of thermogenic hydrocarbon gases from a deep and hot sedimentary layer is characteristic of mud volcanism off Tanegashima Island. At IODP Site C0002 in the Kumano fore arc basin of the Nankai Trough, drilling to ∼2 kmbsf reached temperatures of ∼81°C–85°C, but the mixed thermogenic gas at that horizon was delivered from deeper and thus hotter sediments, indicating that no in situ thermogenic gas production occurs at that level (Hammerschmidt et al., 2014). Therefore, we infer that thermogenic gas production below the studied mud volcanoes does not occur below 80°C.
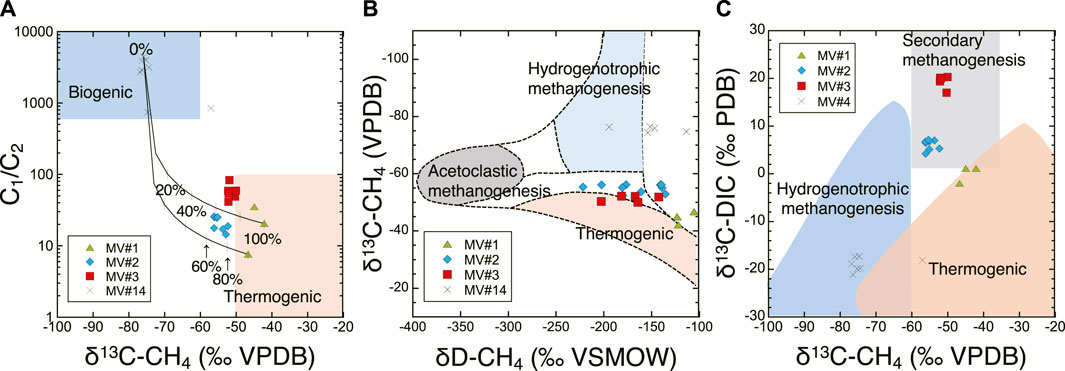
FIGURE 13. (A) C1/C2 ratios and δ13C-CH4 values below SMTZ compared to methane sources (Bernard et al., 1976) at MV#1–3 and MV#14. Black solid lines represent the two most plausible two-end member mixing scenarios between biogenic and thermogenic hydrocarbons; percentage labels represent the contribution of thermogenic methane to the total methane content. (B) δ13C-CH4 and δD-CH4 values below SMTZ compared to methane sources (Whiticar, 1999). (C) δ13C-CH4 and δ13C-DIC below SMTZ compared to methane sources (Milkov and Etiope, 2018). In MV#1 and MV#14, pore water sample and gas sample were collected different depths. Therefore, samples collected from similar depths were considered as the same sample, and plotted.
4.3 The difference between the depths of origin of sediments and fluids
We estimated the formation temperature for water derived from clay-mineral dehydration to be 60°C–190°C (2.4–7.6 kmbsf under the local geotherm). In contrast, the supply of thermogenic gases requires a hot temperature (>80°C), and vitrinite reflectance data and 10Be ages indicate the source sediments experienced temperatures of 81°C–85°C (3.2–3.4 kmbsf under the local geotherm). The estimated temperature and depth of the source sequence are near the shallow limit for those of the fluid. However, the vitrinite reflectance values (0.42%–0.45%) indicate the source sediments to be too immature to produce thermogenic gases. Therefore, the thermogenic methane observed at the mud volcanoes off Tanegashima Island must have originated in a hotter and deeper sedimentary layer than the source sequence.
The smectite–illite transformation should also have occurred deeper than the source sequence because the smectite and illite contents in the mud volcano sediments are too small to produce the observed dilution of Cl− in pore water by in situ clay diagenesis. The maximum observed porewater Cl− depletion (∼60%) in the mud volcano sediments requires the production of ∼0.3 g of water per cubic centimeter of sediment at a porosity of 50% (the mean porosity measured at MV#1). Smectite in marine sediments has been found to bind 17.7–27 wt% water (Saffer and Tobin, 2011; Hüpers and Kopf, 2012), depending on environmental conditions. Assuming 20% smectite-bound water (Menapace et al., 2017), 1.5 g of smectite per cubic centimeter of sediment is required to produce 0.3 g of water per cubic centimeter of sediment. Given the mean bulk density (1.8 g cm−3) and porosity (50%) of MV#1 sediments, such a smectic content exceeds the dry bulk density (1.3 g cm−3). Even if all smectite was transformed to illite, the illite contents (<33 wt%) at the studied mud volcanoes are too small to produce so much water. Based on these results, we conclude that both the water and the thermogenic methane erupted by the mud volcanoes originated from greater depths than the source sequence (Figure 14).
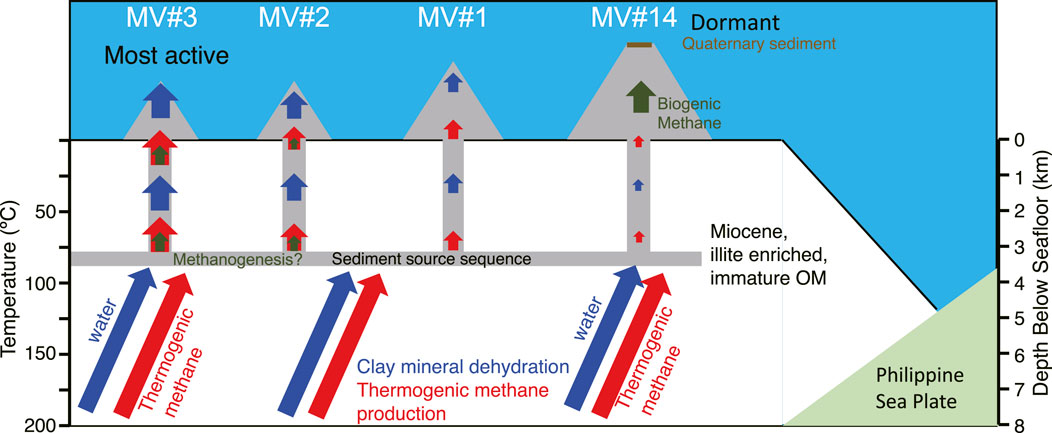
FIGURE 14. Schematic figure showing origins of sediments and fluids in MV#1–3 and MV#14.
Ijiri et al. (2018a); Ijiri et al. (2018b) reported the supply of abyssal fluids, such as water derived from clay-mineral dehydration and thermogenic gases, into the mud reservoir (i.e., the source sequence of the erupted mud) via a mega-splay fault in the accretionary prism at a mud volcano in the Kumano fore arc basin. Similarly, supply of fluids from deeper sedimentary layers to the mud reservoir was suggested in the mud volcanoes off Tanegashima Island by our study. Thus, fluids originating at greater depths than the source sediments might be typical of subduction-zone mud volcanoes. Indeed, the supply of abyssal fluids to clay mineral-rich sediments would promote mud intrusion and eruption by increasing pore water pressure. In addition, the supply of abyssal fluids has been demonstrated to stimulate microbial activity such as hydrogenotrophic methanogenesis in the mud volcano reservoir in the Kumano basin (Ijiri et al., 2018a). We also inferred such additional methanogenesis at MV#3, suggesting that fluid migration and subsequent mud volcanism in subduction zones broadly influences the deep subsurface biosphere.
5 Conclusion
We investigated the origins of sediments and fluids erupted by mud volcanoes off Tanegashima Island based on analyses of sediments and fluid obtained from four mud volcanoes, MV#1–3 and #14. Based on our results, we drew the following conclusions.
1) Using calcareous nannofossils and 10Be ages, we constrained the age of the source sequence of the mud volcanoes off Tanegashima Island to the middle to late Miocene. At MV#14, Quaternary nannofossil species dominated in the surface sediment, indicating that MV#14 is dormant. The similar mineral compositions and vitrinite reflectance values of sediments erupted by the mud volcanoes strongly suggest that each is rooted in the same source sequence. Vitrinite reflectances (0.42%–0.44%) indicated that the sediments had experienced temperatures of 81°C–85°C, placing the source sequence at 3.2–3.4 kmbsf under the local geotherm.
2) Porewaters extracted from the mud volcano sediments contained ∼40% the Cl− concentration of seawater and had proportional enrichments in 18O and depletions in D, indicating the addition of freshwater derived from clay-mineral dehydration. The estimated temperature, 60ºC–190°C using the δD and δ18O values of a freshwater end member and known equilibrium isotopic fractionation factors consistent with the optimal temperature range for the smectite–illite transformation. The smectite and illite contents (<40 wt%) in the clay size fraction rule out in situ smectite dewatering as the cause of the pore water Cl− dilution. Thus, fluids derived from clay dewatering must have originated from greater depths than the source sediment.
3) We examined the relative level of activity at MV#1–3 and MV#14 based on pore water Cl− concentration profiles and a one-dimensional unsteady advective diffusion model. In order of decreasing activity, they are MV#3, MV#2, and MV#1, whereas MV#14 is dormant (consistent with nannofossil observations).
4) At the active mud volcanoes MV#1–3, C1/C2 ratios (<100) and δ13C-CH4 values (−57‰ to −42‰) indicate that hydrocarbon gases are mostly derived from the thermal decomposition of organic matter in deep sediments at >80°C. At MV#3, the C1/C2 ratios were relatively high (40–100) and the δ13C-DIC was high (ca. +20‰), corresponding to εC > 70‰, indicating the addition of biogenic methane produced by hydrogenotrophic methanogenesis to the thermogenic methane. At the inactive MV#14, C1/C2 ratios were in the range 700–4,000 and δ13C-CH4 values were ca. −75‰, suggesting a limited supply of thermogenic methane and overprinting by subsequent shallow methanogenesis.
5) Combining these results, we concluded that that both the water and thermogenic methane in surface sediments of mud volcanoes off Tanegashima Island originate from deeper than the source sequence, as observed at mud volcanoes in the Kumano fore arc basin, Nankai Trough.
Data availability statement
The original contributions presented in the study are included in the article/Supplementary Material, further inquiries can be directed to the corresponding author.
Author contributions
AI proposed the topic, conceived and designed the study, and was responsible for the fluid analyses. RS conceived and designed the study, and conducted the entire sediments and hydrocarbon analyses. YM conducted the fluid analyses. TT was responsible for the fluid chemistry. MM was responsible for the sediment analyses. KH carried out nannofossil observation, and was responsible for nannofossil age determination. YH conducted numerical calculations for pore water diffusion-advection, and was responsible for vitrinite analysis. TY and HM conducted and were responsible for 10Be analysis. WT and OT provided technical advice and were responsible for XRD analyses. KK conducted the topographic survey. TH and TN conducted sediment and fluid sampling on board. JA conducted and were responsible for the visual observation using NSS. FI proposed the topic. All authors contributed to the article and approved the submitted version.
Funding
This study was supported in part by JSPS Grant-in-Aid for Scientific Research (20H04315 and 22H05308 to AI).
Acknowledgments
We acknowledge the officers, crew, and scientific party of cruises KH-15-2, KH-19-5 of R/V Hakuho Maru, NT15-15 of R/V Natsushima, and KS-21-18 of R/V Shinsei-Maru for sample retrieval and technical support. The authors are grateful to A. Imajyo for technical assistance.
Conflict of interest
OT was employed by Marine Works Japan Ltd.
The remaining authors declare that the research was conducted in the absence of any commercial or financial relationships that could be construed as a potential conflict of interest.
Publisher’s note
All claims expressed in this article are solely those of the authors and do not necessarily represent those of their affiliated organizations, or those of the publisher, the editors and the reviewers. Any product that may be evaluated in this article, or claim that may be made by its manufacturer, is not guaranteed or endorsed by the publisher.
Supplementary material
The Supplementary Material for this article can be found online at: https://www.frontiersin.org/articles/10.3389/feart.2023.1206810/full#supplementary-material
References
Alaoui Mhammedi, N., El Moumni, B., El Hmaidi, A., Raissouni, A., and El Arrim, A. (2008). Mineralogical and geochemical study of mud volcanoes in north Moroccan Atlantic margin. Afr. J. Environ. Sci. Technol. 2, 387–396. doi:10.5897/AJEST.9000077
Amin, B. S., Lal, D., and Somayajulu, B. L. K. (1975). Chronology of marine sediments using the 10Be method: Intercomparison with other methods. Geochim. Cosmochim. Acta 39, 1187–1192. doi:10.1016/0016-7037(75)90060-5
Aoki, S., and Oinema, K. (1988). The distribution of clay minerals in surface sediments of the Okhotsk Sea to the South China Sea along the Asiatic continent. Clay Sci. 7, 73–82.
Backman, J., Raffi, I., Rio, D., Fornaciari, E., and Pälike, H. (2012). Biozonation and biochronology of Miocene through Pleistocene calcareous nannofossils from low and middle latitudes. Newsletters Stratigr. 45, 221–244. doi:10.1127/0078-0421/2012/0022
Bernard, B. B., Brooks, J. M., and andSackett, W. M. (1976). Natural gas seepage in the Gulf of Mexico. Earth Planet. Sci. Lett. 31, 48–54. doi:10.1016/0012-821x(76)90095-9
Biscaye, P. E. (1965). Mineralogy and sedimentation of recent deep-sea clay in the Atlantic Ocean and adjacent seas and oceans. Geol. Soc. Am. Bull. 76, 803–832. doi:10.1130/0016-7606(1965)76[803:masord]2.0.co;2
Bourles, D., Raisbeck, G. M., and Yiou, F. (1989). 10Be and 9Be in marine sediments and their potential for dating. Geochem. Cosmochim. Acta 53, 443–452. doi:10.1016/0016-7037(89)90395-5
Bown, P. R., and Young, J. R. (1998). “Techniques,” in Calcareous nannofossil biostratigraphy: London. Editor P. R. Bown (Kluwer Academic Publishers), 16–28.
Brown, L. (1987). 10Be: Recent applications in Earth sciences. Philos. Trans. R. Soc. A 323, 75–86. doi:10.1098/rsta.1987.0073
Burnham, A. K., and Sweeney, J. J. (1989). A chemical kinetic model of vitrinite maturation and reflectance. Geochim. Cosmochim. Acta 53, 2649–2657. doi:10.1016/0016-7037(89)90136-1
Capuano, R. M. (1992). The temperature dependence of hydrogen isotope fractionation between clay minerals and water: Evidence from a geopressured system. Geochim. Cosmochim. Acta 56, 2547–2554. doi:10.1016/0016-7037(92)90208-z
Dahlmann, A., and de Lange, G. J. (2003). Fluid-sediment interactions at eastern mediterranean mud volcanoes: A stable isotope study from ODP leg 160. Earth Planet. Sci. Lett. 212, 377–391. doi:10.1016/s0012-821x(03)00227-9
Dimitrov, L. I. (2002). Mud volcanoes - the most important pathway for degassing deeply buried sediments. Earth-Sci. Rev. 59, 49–76. doi:10.1016/s0012-8252(02)00069-7
Dugan, B., and Flemings, P. B. (2000). Overpressure and fluid flow in the New Jersey Continental Slope: Implications for slope failure and cold seeps. Science 289, 288–291. doi:10.1126/science.289.5477.288
Eberl, D. D. (2003). User guide to RockJock: A program for determining quantitative mineralogy from X-ray diffraction data. U.S. Geol. Surv. Open File Rep.03-78, 40. doi:10.3133/ofr200378
Feseker, T., Boetius, A., Wenzhöfer, F., Balandin, J., Olu, K., Yoerger, D. R., et al. (2014). Eruption of a deep-sea mud volcano triggers rapid sediment movement. Nat. Commun. 5, 5385. doi:10.1038/ncomms6385
Fu, X., Hu, L., Zhu, W., Huang, X., Feng, K., and Zhou, Z. (2022). Miocene provenance changes in taiwan caused by southward input of sediments from East China sea basin. Front. Earth Sci. 10, 849181. doi:10.3389/feart.2022.849181
Hammerschmidt, S. B., Wiersberg, T., Heuer, V. B., Wendt, J., Erzinger, J., and Kopf, A. (2014). Real-time drilling mud gas monitoring for qualitative evaluation of hydrocarbon gas composition during deep sea drilling in the Nankai Trough Kumano Basin. Geochem. Trans. 15, 15. doi:10.1186/s12932-014-0015-8
Hensen, C., Wallman, K., Scmidt, M., Ranero, C. R., and Suess, E. (2004). Fluid expulsion related to mud extrusion off Costa Rica-A window to the subducting slab. Geology 32, 201–204. doi:10.1130/G20119.1
Hoshino, T., Toki, T., Ijiri, A., Morono, Y., Machiyama, H., Ashi, J., et al. (2017). Atribacteria from the subseafloor sedimentary biosphere disperse to the hydrosphere through submarine mud volcanoes. Front. Microbiol. 8, 1135. doi:10.3389/fmicb.2017.01135
Hüpers, A., and Kopf, A. J. (2012). Effect of smectite dehydration on pore water geochemistry in the shallow subduction zone: An experimental approach. Geochem. Geophys. Geosyst. 13, Q0AD26. doi:10.1029/2012GC004212
Ijiri, A., Harada, N., Hirota, A., Tsunogai, U., Ogawa, N. O., Itaki, T., et al. (2012). Biogeochemical processes involving acetate in sub-seafloor sediments from the Bering Sea shelf break. Org. Geochem. 48, 47–55. doi:10.1016/j.orggeochem.2012.04.004
Ijiri, A., Iijima, K., Tsunogai, U., Ashi, J., and Inagaki, F. (2018b). Clay mineral suites in submarine mud volcanoes in the Kumano forearc basin, Nankai Trough –Constraints on the origin of mud-volcano sediments. Geosciences 8, 220. doi:10.3390/geosciences8060220
Ijiri, A., Inagaki, F., Kubo, Y., Adhikari, R. R., Hattori, S., Hoshino, T., et al. (2018a). Deep-biosphere methane production stimulated by geofluids in the Nankai accretionary complex. Sci. Adv. 4, eaao4631. doi:10.1126/sciadv.aao4631
Jurado-Rodriguez, M. J., and Martinez-Ruiz, F. (1998). “Some clues about the Napoli and Milano mud volcanoes from an integrated log-core approach,” in Proceedings of the ocean drilling program scientific results. Editors A. H. F. Robertson, K.-C. Emeis, C. Richter, and A. Camerlenghi (College Station, TX: Drilling Program), 160, 607–624.
Kastner, M., Elderfield, H., and Martin, J. B. (1991). Fluids in convergent margins: What do we know about their composition, origin, role in diagenesis and important for oceanic chemical fluxes? Philos. Trans. R. Soc. Lond. A335, 243–259. doi:10.1098/rsta.1991.0045
Kitada, K., Machiyama, H., Ijiri, A., Morita, S., and Inagaki, F. (2018). “Distribution and characteristics of mud volcanoes revealed by the single-channel seismic reflection survey and the near-bottom acoustic surveys using AUV off the Tanegashima Island, southwestern Japan,” in European geosciences union editor. European geosciences union general assembly 2018 (Vienna, Austria: European Geosciences Union), 19605.
Kopf, A. J. (2002). Significance of mud volcanism. Rev. Geophys. 40, 2-1–2-52. doi:10.1029/2000rg000093
Manheim, F. T., and Sayles, F. L. (1974). “Composition and origin of interstitial waters of marine sediments, based on deep sea drill cores,” in The Sea, marine chemistry. Editor E. D. Goldberg (New York, NY: Wiley-Interscience), 5, 527–568.
Martin, J. B., Kastner, M., Henry, P., LePichon, X., and Lallement, S. (1996). Chemical and isotopic evidence for sources of fluids in a mud volcano field seaward of the Barbados accretionary wedge. J. Geophys. Res.-Solid 101 (B9), 20325–20345. doi:10.1029/96jb00140
Matsuzaki, H., Miyake, Y., Nakashoji, K., Tokuyama, H., Tsuchiya, S. Y., Kusuno, H., et al. (2020). Current status of MALT AMS facility: A report of updated performance and recent achievement. Nucl. Instrum. Methods Phys. Res. Sect. B Beam Interact. Mater. Atoms 463, 55–63. doi:10.1016/j.nimb.2019.11.010
McHargue, L., and Damon, P. (1991). The global beryllium 10 cycle. Rev. Geophys. 29, 141–158. doi:10.1029/91rg00072
Menapace, W., Völker, D., Kaul, N., Tryon, M. D., and Kopf, A. J. (2017). The role of mud volcanism and deep-seated dewatering processes in the Nankai Trough accretionary prism and Kumano Basin, Japan. Geochem. Geophys. Geosyst. 18, 2486–2509. doi:10.1002/2016GC006763
Milkokv, A. V. (2011). Worldwide distribution and significance of secondary microbial methane formed during petroleum biodegradation in conventional reservoirs. Org. Geochem. 42, 184–207. doi:10.1016/j.orggeochem.2010.12.003
Milkov, A. V., and Etiope, G. (2018) Revised genetic diagrams for natural gases based on a global dataset of >20,000 samples. Org. Geochem. 125, 109–120. doi:10.1016/j.orggeochem.2018.09.002
Milkov, A. V. (2000). Worldwide distribution of submarine mud volcanoes and associated gas hydrates. Mar. Geol. 167, 29–42. doi:10.1016/s0025-3227(00)00022-0
Mitsutome, Y., Toki, T., Kagoshima, T., Sano, Y., Tomonaga, Y., and Ijiri, A. (2023). Estimation of the depth of origin of fluids using noble gases in the surface sediments of submarine mud volcanoes off Tanegashima Island. Sci. Rep. 13, 5051. doi:10.1038/s41598-023-31582-z
Moore, D. M., and Reynolds, R. C. (1997). X-Ray diffraction and the identification and analysis of clay minerals. 2nd edition. New York: Oxford University Press, 270–276.
Nakayama, N., Ashi, J., Tsunogai, U., Gamo, T., and Tanahashi, M. (2010). Sources of pore water in a Tanegashima mud volcano inferred from chemical and stable isotopic studies. Geochem. Jour. 44, 561–569. doi:10.2343/geochemj.1.0094
Nishiizumi, K., Imamura, M., Caffee, M. W., Southon, J. R., Finkel, R. C., and McAninch, J. (2007). Absolute calibration of 10Be AMS standards. Nucl. Instrum. Methods Phys. Res. Sect. B Beam Interact. Mater. Atoms 258, 403–413. doi:10.1016/j.nimb.2007.01.297
Nittrouer, C. A., McKee, B. A., and DeMaster, D. J. (1984). Fine-scale stratigraphy in proximal and distal deposits of sediment dispersal systems in the East China Sea. Mar. Geol. 61, 13–24. doi:10.1016/0025-3227(84)90105-1
Ohde, A., Otsuka, H., Kioka, A., and Ashi, J. (2018). Distribution and depth of bottom simulating reflectors in the Nankai subduction margin. Earth Planets Space 70, 60. doi:10.1186/s40623-018-0833-5
Pape, T., Geprägs, P., Hammerschmidt, S., Wintersteller, P., Wei, J., Fleischmann, T., et al. (2014). Hydrocarbon seepage and its sources at mud volcanoes of the Kumano forearc basin, Nankai Trough subduction zone. Geochem. Geophys. Geosyst. 15, 2180–2194. doi:10.1002/2013GC005057
Raffi, I., Backman, J., Fornaciari, E., Palike, H., Rio, D., Lourens, L. J., et al. (2006). A review of calcareous nannofossil astrobiochronology encompassing the past 25 million years. Quat. Sci. Rev. 25, 3113–3137. doi:10.1016/j.quascirev.2006.07.007
Saffer, D. M., and Tobin, H. J. (2011). Hydrogeology and mechanics of subduction zone forearcs: Fluid flow and pore pressure. Annu. Rev. Earth. Planet. Sci. 39, 157–186. doi:10.1146/annurev-earth-040610-133408
Savin, S. M., and Epstein, S. (1970). The oxygen and hydrogen isotope geochemistry of clay minerals. Geochim. Cosmochim. Acta 34, 25–42. doi:10.1016/0016-7037(70)90149-3
Schulz, H. -M., Emeis, K.-C., and Volkmann, N. (1997). Organic carbon provenance and maturity in the mud breccia from the Napoli mud volcano: Indicators of origin and burial depth. Earth Planet. Sc. Lett. 147, 141–151. doi:10.1016/s0012-821x(97)00013-7
Sheppard, S. M. F., and Gilg, H. A. (1996). Stable isotope geochemistry of clay minerals. Clay Min. 31, 1–24. doi:10.1180/claymin.1996.031.1.01
Suchecki, R. K., and Land, L. S. (1983). Isotopic geochemistry of burial-metamorphosed volcanogenic sediments, great valley sequence, northern California. Geochim. Cosmochim. Acta 47, 1487–1499. doi:10.1016/0016-7037(83)90308-3
Sweeney, J. J., and Burnham, A. K. (1990). Evaluation of a simple model of vitrinite Reflectance based on chemical kinetics. Am. Assoc. Pet. Geol. Bull. 74, 1559–1570. doi:10.1306/0C9B251F-1710-11D7-8645000102C1865D
Taira, A., OkadaWhitaker, H. J. H. McD., and Smith, A. J. (1982). “The Shimanto belt of Japan: Cretaceous-Lower Miocene sedimentation in forearc basin to deep sea trench environments,” in Trench-forearc geology spec. Editor J. K. Leggett (London: Publs geol. Soc. Lond.), 10, 5–26.
Tanikawa, W., Sakaguchi, M., Wibowo, H. T., Shimamoto, T., and Tadai, O. (2010). Fluid transport properties and estimation of overpressure at the Lusi mud volcano, East Java Basin. Eng. Geol. 116 (1–2), 73–85. doi:10.1016/j.enggeo.2010.07.008
Tanikawa, W., and Tadai, O. (2018). Data Report for quantitative analysis of mineral composition using powdered X-ray diffraction method and RockJock program. JAMSTEC Rep. Res. Dev. 27, 57–67. doi:10.5918/jamstecr.27.57
Tissot, B. P., Pelet, R., and Ungerer, P. H. (1987). Thermal history of sedimentary basins, maturation indices, and kinetics of oil and gas generation. AAPG Bull. 71 (12), 1445–1466. doi:10.1306/703C80E7-1707-11D7-8645000102C1865D
Tsunogai, U., Yoshida, N., and Gamo, T. (2002). Carbon isotopic evidence of methane oxidation through sulfate reduction in sediment beneath cold seep vents on the seafloor at Nankai Trough. Mar. Geol. 187, 145–160. doi:10.1016/S0025-3227(02)00263-3
Ujiié, Y. (2000). Mud diapirs observed in two piston cores from the landward slope of the northern Ryukyu Trench, northwestern Pacific Ocean. Mar. Geol. 163, 149–167. doi:10.1016/S0025-3227(99)00113-9
Van Loon, L. R., and Mibus, J. (2015). A modified version of archie's law to estimate effective diffusion coefficients of radionuclides in argillaceous rocks and its application in safety analysis studies. doi:10.1016/j.apgeochem.2015.04.002
Wallmann, K., Drews, M., Aloisi, G., and Bohrmann, G. (2006). Methane discharge into the Black Sea and the global ocean via fluid flow through submarine mud volcanoes. Earth Planet. Sc. Lett. 248, 545–560. doi:10.1016/j.epsl.2006.06.026
Whiticar, M. J. (1999). Carbon and hydrogen isotope systematics of bacterial formation and oxidation of methane. Chem. Geol. 161, 291–314. doi:10.1016/s0009-2541(99)00092-3
Yeh, H. W. (1980). Ratios and late-stage dehydration of shales during burial. Geochim. Cosmochim. Acta 44, 341–352. doi:10.1016/0016-7037(80)90142-8
Yin, J., Okada, H., and Labeyrie, L. (1987). Clay mineralogy of slope sediments around the Japanese Islands. Geosci. Repts. Shizuoka Univ. 13, 41–65.
Yokoyama, Y., Yamane, M., Nakamura, A., Miyairi, Y., Horiuchi, K., Aze, T., et al. (2019). In-situ and meteoric 10Be and 26Al measurements: Improved preparation and application at the university of Tokyo. Nucl. Instrum. Methods Phys. Res. Sect. B Beam Interact. Mater. Atoms 455, 260–264. doi:10.1016/j.nimb.2019.01.026
Keywords: mud volcano, porewater, hydrocarbon gases, vitrinite, Ryukyu Trench
Citation: Ijiri A, Setoguchi R, Mitsutome Y, Toki T, Murayama M, Hagino K, Hamada Y, Yamagata T, Matsuzaki H, Tanikawa W, Tadai O, Kitada K, Hoshino T, Noguchi T, Ashi J and Inagaki F (2023) Origins of sediments and fluids in submarine mud volcanoes off Tanegashima Island, northern Ryukyu Trench, Japan. Front. Earth Sci. 11:1206810. doi: 10.3389/feart.2023.1206810
Received: 16 April 2023; Accepted: 13 June 2023;
Published: 28 July 2023.
Edited by:
Carolyn Ruppel, US Geological Survey (USGS), United StatesReviewed by:
Hitoshi Tomaru, Chiba University, JapanAkihiro Hachikubo, Kitami Institute of Technology, Japan
Copyright © 2023 Ijiri, Setoguchi, Mitsutome, Toki, Murayama, Hagino, Hamada, Yamagata, Matsuzaki, Tanikawa, Tadai, Kitada, Hoshino, Noguchi, Ashi and Inagaki. This is an open-access article distributed under the terms of the Creative Commons Attribution License (CC BY). The use, distribution or reproduction in other forums is permitted, provided the original author(s) and the copyright owner(s) are credited and that the original publication in this journal is cited, in accordance with accepted academic practice. No use, distribution or reproduction is permitted which does not comply with these terms.
*Correspondence: Akira Ijiri, ijiri@maritime.kobe-u.ac.jp