Analysis of the spillover characteristics of cooling effect in an urban park: A case study in Zhengzhou city
 Yu Gao
 Huifeng Pan3
  Li Tian
- 1National Critical Zone Observatory of Red Soil Hilly Region in Qianyanzhou, Key Laboratory of Ecosystem Network Observation and Modeling, Institute of Geographic Sciences and Natural Resources Research, Chinese Academy of Sciences, Beijing, China
- 2University of Chinese Academy of Sciences, Beijing, China
- 3College of History and Ethnic Culture,Guizhou University, Guiyang, Guizhou, China
Urban parks include water bodies, non-hardened ground, and a variety of vegetation, whose shading and evaporation effects form a “park cold island.” A park effectively cools the surrounding environment through heat exchange. This phenomenon is called spillover of park cooling effect (PCS) and plays an important role in regulating the microclimate of cities. Although PCS was extensively documented in previous studies, the effects of park landscape features on PCS still need to be further explored, especially in China with rapid urban expansion. The severe scarcity of urban land resources heightens the necessity to clarify the relationship between park patch size and cooling efficiency. Therefore, in this study, we chose Zhengzhou city (the capital of Henan province, in the central region of China) as an example, which has experienced rapid urban land expansion and urban population and high spatiotemporal aggregation of heatwaves–drought–rainstorms. We used Landsat 8 imagery and high score data in the summer of 2019 to retrieve the characteristics of land surface temperature (LST), and then we extracted 36 city parks and identified the spillover distance of the park cooling effect (PCSD), spillover strength of the park cooling effect (PCSS), spillover rate of the park cooling effect (PCSR), and 11 park landscape indexes. We calculated the area threshold when a park achieves the highest cooling efficiency, and the PCS characteristics of each park also were quantified. The results showed that the average LST of urban parks was 2.3°C lower than that of the entire study area; PCSS was 4.61°C at a maximum; PCSD was between 31 and 370 m, and the average value was 179 m; the average PCSR was 0.957°C/100 m. For the relationship of PCS with the 11 park landscape indexes, we found park area (AREA), park green space area (AREAg), and park perimeter (PERIM) contributed the most to PCS. Shape of impervious surface (LSIi) and percentage of water body (Pw) also significantly contributed to PCS. The ratio of perimeter to area (PARA), edge density (ED), edge density of the green space (EDg), and patch density (PD) were significantly and negatively correlated with PCS. For the relationship between park area and PCS, the result was that the park with an area of 6–8 ha and an internal green area of not less than 5–6 ha has the highest PCS effect. This study can expand our scientific understanding on the influences of park landscape characteristics on PCS and provide a scientific basis for formulating reasonable and effective urban parks and spatial layout planning to cope with the urban heat island effect.
1 Introduction
Urbanization has many consequences on local climate (Amani-Beni et al., 2021), with the urban heat island (UHI) phenomenon reported as the most widely spread one among global cities (Tian et al., 2013; Aram et al., 2019). Multiple processes, physically and socioeconomically, are responsible for the magnitude, spatial coverage, and temporal changes of UHI (Yuan and Bauer, 2007; Yu et al., 2021). A major challenge for both scientists and practitioners is to reduce or ease UHI through urban planning. Here, a plausible strategy for mitigating UHI is to increase the amount and coverage of green vegetation and water bodies across city landscapes (Wong et al., 2021; Song et al., 2022). Increasing urban parks is considered to be the optimal choice because they provide additional services (e.g., carbon sequestration, pollution reduction, and biodiversity enhancement) for ecosystems (McPherson et al., 2013; Wolch et al., 2014; Hewitt et al., 2020) and society (Bartesaghi-Koc et al., 2020; Blachowski and Hajnrych, 2021).
Urban parks effectively reduce their own temperature through evapotranspiration and shading (Kraemer and Kabisch, 2022), forming a significant cold island. Many studies have found that the maximum temperature difference between urban park interior and urban average can reach 6°C–8°C (Feyisa et al., 2014; Yao et al., 2022). Furthermore, urban parks provide cooling effects to the surrounding environment to a certain extent through at least four boundary-layer processes (Figure 1); this phenomenon is called the spillover of park cooling effect (PCS). In some cases, this expansion of cold air may be more important than the park cool island itself (Sugawara et al., 2016) because it could significantly improve the urban thermal environment and reduce energy consumption by buildings; the cooling effect is also a manifestation of macro-scale ecological benefits exerted by green spaces. Jaurgrui (1991) found that the extent of a 500-ha park’s PCS reached up to 2 km. Blachowski and Hajnrych (2021) also evaluated the cooling effect of four urban parks in Wroclaw and found that the maximum cooling distance was 925 m. Yan et al. (2018) used the measurement data in Beijing Olympic Forest Park (−680 ha) at different times (i.e., day vs. night and summer vs. winter) and found that the park cooling effect was variable but could extend almost 1.4 km beyond the park’s border. In 27 cities in eastern China, Geng et al. (2022) and colleagues considered local climate background in analyzing the influence of cooler air from the park extending several hundred meters from the park boundary. Many other studies have shown that the cooling distance of urban parks to the surrounding areas is mainly concentrated in the range of 600–1000 m, which can be considered key to countering UHI at regional and global scales (Qiu and Jia, 2020; Wang et al., 2021; Liu et al., 2022; Yao et al., 2022).
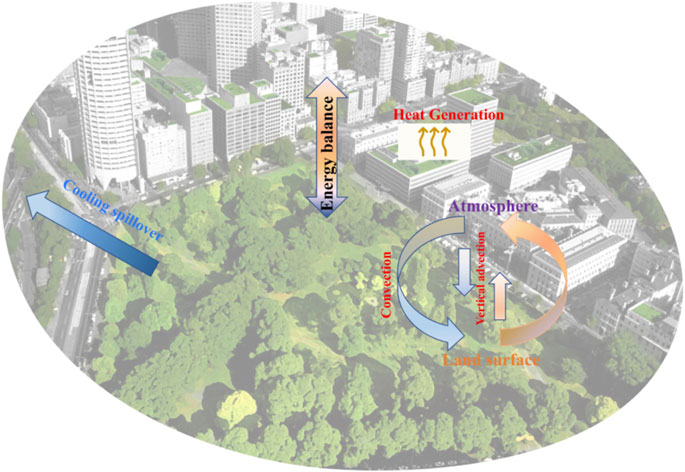
FIGURE 1. Four major boundary-layer processes responsible for the air (land surface) temperatures of urban green spaces as well as their spatial effects (e.g., cooling spillover) at neighboring landscapes: energy balance, vertical advections, horizontal advection, and heat generation.
One clear lesson from previous studies is that the parks’ cooling effect and its spillover characteristics are influenced by park size, type, shape, and position in the landscape, as well as their matrix (e.g., a park in a residential area versus that in a commercial matrix) (Upmanis et al., 1998; Doick et al., 2014; Norton et al., 2015; Xue et al., 2019; Li et al., 2020; Cheung et al., 2021; Sugawara et al., 2021). It is worth noting that some of these characteristics can be adjusted and changed through sound planning and design so that parks’ climate benefits and other services can be maximized. In recent years, the urbanization rate increased rapidly in developing countries (Xue et al., 2019). The impervious water surface in cities tends to be connected, and the resulting UHI effect also shows a spreading trend (Peng et al., 2022). Spatiotemporal clustering characteristics of heatwaves–drought–rainstorms result in the frequent occurrence of extreme weather events (Yao et al., 2022). For example, in China’s Zhengzhou (the capital of Henan province), a new first-tier city, the built-up area has increased from 224.8 to 1284.9 km2 in the past 20 years (an increase of 5.7 times) (Li et al., 2020), and the resident population increased from 6.88 million to 12.74 million. In the meantime, the annual number of hot days (>35°C) increased from 21 (2011) to 40 (2019). It reached 22 days in July 2019, which was very rare. The “7.20” extreme precipitation event on July 20, 2021, caused 398 deaths and more than 15 million capital loss in the city. The impacts of extreme weather caused by rapid urbanization on the lives and properties of residents are becoming increasingly severe. Therefore, it is urgent for us to combat this disaster by improving the spatial structure inside cities.
Urban parks can serve as buffer zones against extreme weather events (Baro et al., 2014). Reasonable urban park planning is of great significance to alleviating the UHI effect, improving the microclimate, increasing urban biodiversity and human wellbeing, and promoting urban sustainability. Regardless of the increasing literature on this topic, it remains difficult to generalize the intensity of the spillover of the cold effect in urban parks. Additionally, the area of urban parks is increasingly being squeezed in the context of urban expansion, and it is very vital to achieve the optimal cooling effect with the minimum park space, which can provide guidance for decision-makers and urban planners. To this end, we take Zhengzhou city as a study site to 1) quantify areas of PCS from all green spaces; 2) identify the relationship between PCS and park characteristics; 3) explore the threshold value of the park area to maximize the PCS. We expect our findings will be used as a scientific basis for designing of urban parks and spatial layout planning to reduce the UHI effect. If approved, similar methods can be extended to other urban areas.
2 Materials and methods
2.1 Study area and data source
Zhengzhou (34.16–34.58 N, 112.42–114.14 E) is located in the north temperate zone and has a temperate continental monsoon climate with four distinct seasons. The annual average temperature is 14.2°C, and the annual rainfall is 640.9 mm, which is concentrated in summer. As the capital city of Henan province, Zhengzhou is also a transportation hub in China. By 2021, the resident population of Zhengzhou was about 12.7 million, and the urbanization rate was 78.4%. The built-up area of the central urban area is 709.69 km2. Here, the central city of Zhengzhou is taken as the study area, with a total area of 1019.5 km2. A total of 36 parks within the urban center were selected (Figure 2, attached Table 1).
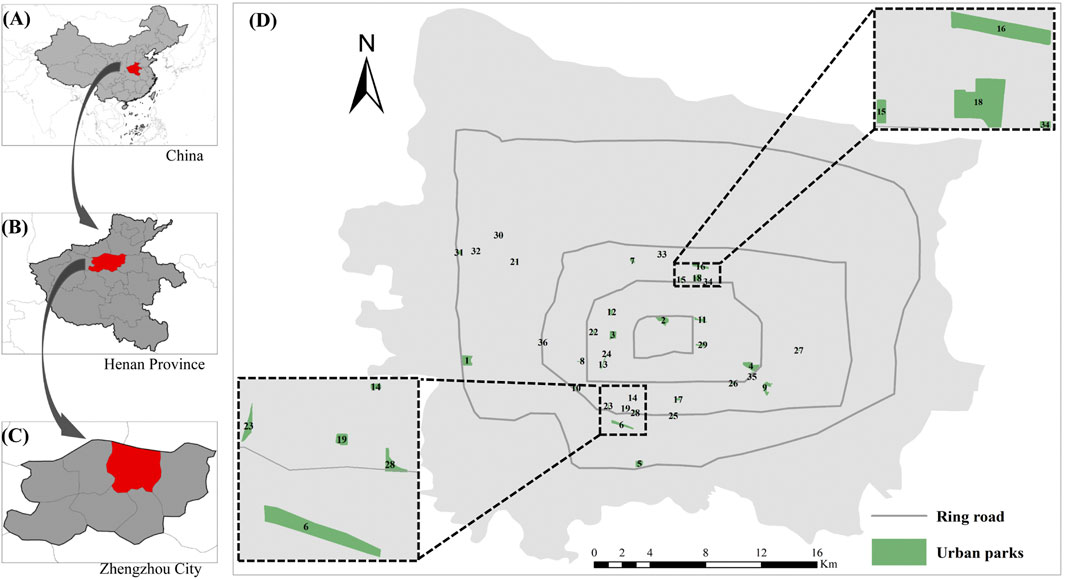
FIGURE 2. Location of the study area, (A) Henan province in China; (B) Zhengzhou in Henan province; (C) study area in Zhengzhou; (D) distribution of 36 urban parks (1–36 is the code name for the park).
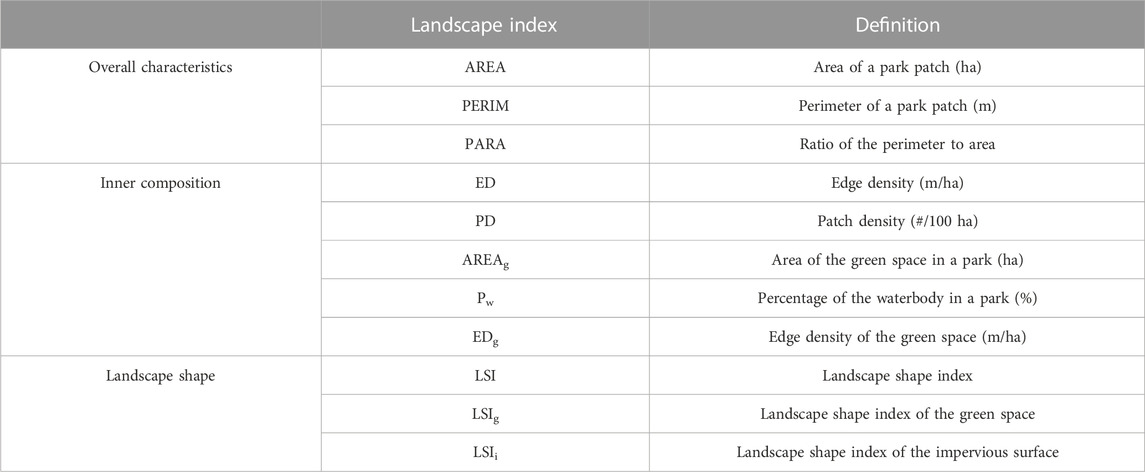
TABLE 1. Selection of 11 landscape indexes.
Landsat 8 remote sensing images taken at 11:01:13 on July 7, 2019, were utilized (http://www.gscloud.cn/), with good imaging quality and clear ground features and no clouds and band stripe. The remote sensing imager is equipped with Operational Land Imager (OLI) and Thermal Infrared Sensor (TIRS), including 11 bands, among which two thermal infrared bands can be used to retrieve land surface temperature (LST) data. The first few days of the study period were sunny and windless, and the weather conditions were good, excluding the influence of factors such as rainfall on the results.
In order to reduce or eliminate the influence of atmospheric environmental conditions on remote sensing image quality, radiometric calibration and atmospheric correction were carried out on multi-spectral bands. In addition, the corrected Landsat 8 remote sensing data were classified by the support vector machine method. According to the research needs, three categories of green space, water body, and impervious water surface were obtained. The classification accuracy was 99%, and the verified Kappa coefficient was 0.98, which met the application requirements. At the same time, parks in the city are extracted using vector boundary data for clipping (http://www.amap.com). Data processing was carried out in ENVI 5.3 and ArcGIS 10.8.
2.2 LST retrieval
The PCS from the park to its vicinity was gradually mitigated by the urban surface heat environment (Jansson et al., 2006). During daytime, the impervious surface has a fast heating rate, resulting in the air temperature and LST being similar in the park, where the green spaces have relatively small thermal inertia and a fast heating rate, which causes the cooling effect in the park to be less pronounced (Yan et al., 2018). Here, we used the LST retrieved from remote sensing data instead of the air temperature. Generally, air temperature and LST are mutually influential, and several studies have found evidence of a close statistical relationship and similar spatial patterns between them (Schwarz et al., 2012). LST has been applied as a proxy to study air temperature. Our study requires a large sample of parks to explore solutions to enhance PCS, and in this case, it is more convenient and reasonable to use the LST obtained from the satellite infrared band.
At present, LST inversion algorithms mainly include the atmospheric correction method, single-window algorithm, and split window algorithm (Yu et al., 2014; Qiu and Jia, 2020; Liao et al., 2021). Referring to other research studies and according to the characteristics of the study area (Cao et al., 2010; Li et al., 2012; Sun et al., 2012; Li et al., 2020), we used the atmospheric correction method to invert land surface temperature. The atmospheric correction method, also known as the radiative transfer equation (RTE), is a traditional algorithm based on the atmospheric radiation transfer model. The principle is to remove the errors caused by atmospheric heat radiation to the surface from the total heat radiation observed by satellite sensors (Li et al., 2012; Barsi et al., 2014). The thermal radiation intensity is then converted to the corresponding surface temperature. The formula is as follows (Wang et al., 2018; Xue et al., 2019):
Here,
Here,
2.3 Park cooling effect measurement
In order to quantify the PCS, we selected the spillover distance of the park cooling effect (PCSD), spillover strength of the park cooling effect (PCSS), and spillover rate of the park cooling effect (PCSR) to describe it. Previous studies have shown that PCSD is concentrated within 1000 m (Chang et al., 2007; Xie and Li, 2020; Zhu et al., 2021). To guarantee that PCSD is within the buffer distance, we set up multi-stage buffer zones in 30-m units along the park boundary within 1500 m outside the park and statistically obtained the average LST within each buffer zone T1, T2, and T3. The piecewise function was used for fitting analysis of these values, and the LST curve model around the park was established (Figure 3).
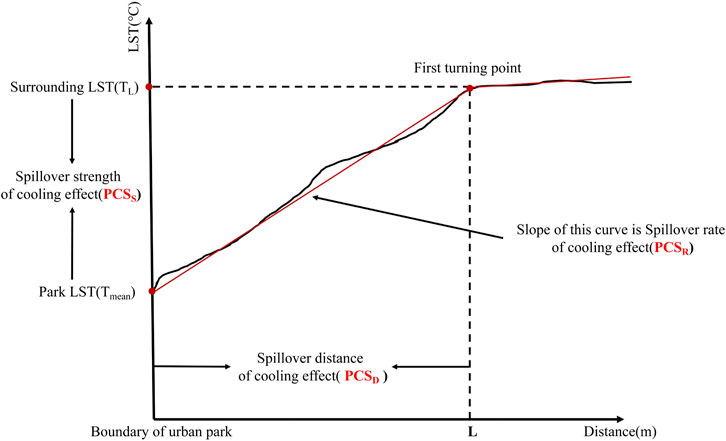
FIGURE 3. Illustration of the cooling effect of a park.
L, PCSD, is the horizontal distance between the park boundary and the first inflection point of the LST curve (Qiu and Jia, 2020), which is located at the position where the slope of the LST curve changes sharply or tends to be stable (Figure 3) (Sun et al., 2012; Du et al., 2016). PCSS is the difference between the LST at the cooling boundary of the park and the average LST inside the park, and the calculation formula is as follows:
Here,
The fitting of the piecewise function and the determination of the inflection point were completed in R 4.1.3’s segmented package.
2.4 Selection of landscape index
In order to analyze the relationship between the landscape pattern inside the park and PCS, this study selected 11 indicators (Table 1) for analysis from the overall characteristics, internal composition, and landscape shape of the park. The index calculation was completed in FRAGSTATS 4.2 and ArcGIS 10.8, and the significance and calculation method of each index can be referred to Wu (2013).
2.5 Calculation of the threshold value of park area
PCS is a non-linear process. In the context of scarce urban land resources, it is essential to quantify the threshold of park cooling efficiency and determine the optimal park size. The maximization method was adopted to standardize the park area and PCS index, and the logarithmic function was used for fitting. The formula is as follows:
Here,
3 Results
3.1 LST features of Zhengzhou and the parks
Based on formula (1) ∼ (4), the average LST in the study area is 37.8°C, which is consistent with field observation for noon temperature in summer. The LST in the city center is apparently higher than that in the suburbs (Figure 4A). The average LST in the First Ring Road is 1.4°C higher than that outside the Fourth Ring Road, indicating an obvious UHI effect (Figure 4B). Due to the different characteristics of the underlying surface, the fluctuation of LST in UHI is significant. The main reason is that some urban parks, rivers, and lakes have low LST, forming obvious low-temperature patches, such as Longhu Park and Xiliuhu Park, which play the role of a “cold island” in the city.
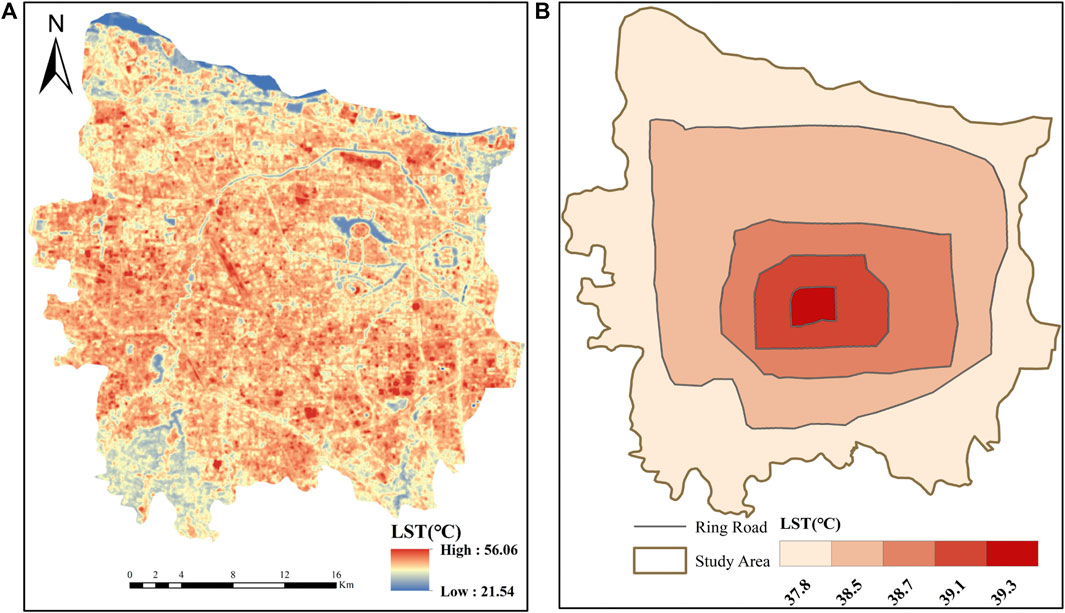
FIGURE 4. (A) Spatial distribution of land surface temperature (LST) in Zhengzhou city; (B) mean LST between each ring road.
The spatial superposition analysis of park patches and LST showed that the average LST in 36 parks is 35.5°C, which is 2.3°C lower than the average LST in Zhengzhou, indicating that there is a clear cooling effect in urban parks. However, the average LST in different parks varies significantly (Figure 5). There are 28 parks having LST lower than the average LST in Zhengzhou, among which Park 2 and Park 3 have the lowest LST (33.9°C). The LST of Park 34 is the highest, reaching 40.7°C. In addition, the LST values of Park 31 and Park 36 are both higher than 38.8°C, exceeding the average LST of Zhengzhou.
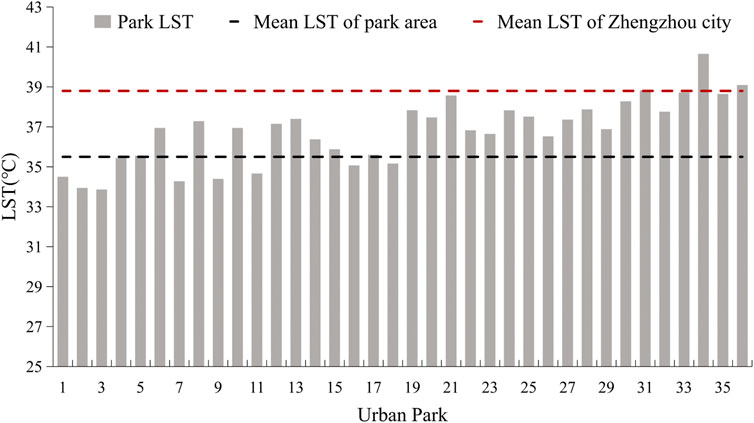
FIGURE 5. Land surface temperature (LST) inside 36 urban parks.
3.2 Cooling effects of urban parks
The average LST of the multi-stage buffer zone in each park was extracted, and the LST varied with distance in four types (Figure 6). The changes of LST in the buffer zone of 33 parks are similar to those given in Figures 6A–C, such as Park 3, Park 18, and Park 26. The LST–distance fitting curve of such parks shows a trend of increasing first and then a flat trend, which indicates that the LST decreases significantly within a certain distance around them. PCS gradually weakens as the distance increases. When the distance exceeds its PCSD, LST change is no longer obvious or fluctuates slightly due to the change in underlying surface properties (Li et al., 2013; Peng et al., 2020). On the contrary, in three parks (Park 34, Park 35, and Park 36), the LST in the buffer zone is lower than that in the park (Figure 6D), indicating that the park has a “thermal effect” spillover. We used piecewise function to perform fitting analysis on temperature values of multi-stage buffer and obtain PCSD. The results showed that the fitting effect is good and all R2 values are greater than 0.9.
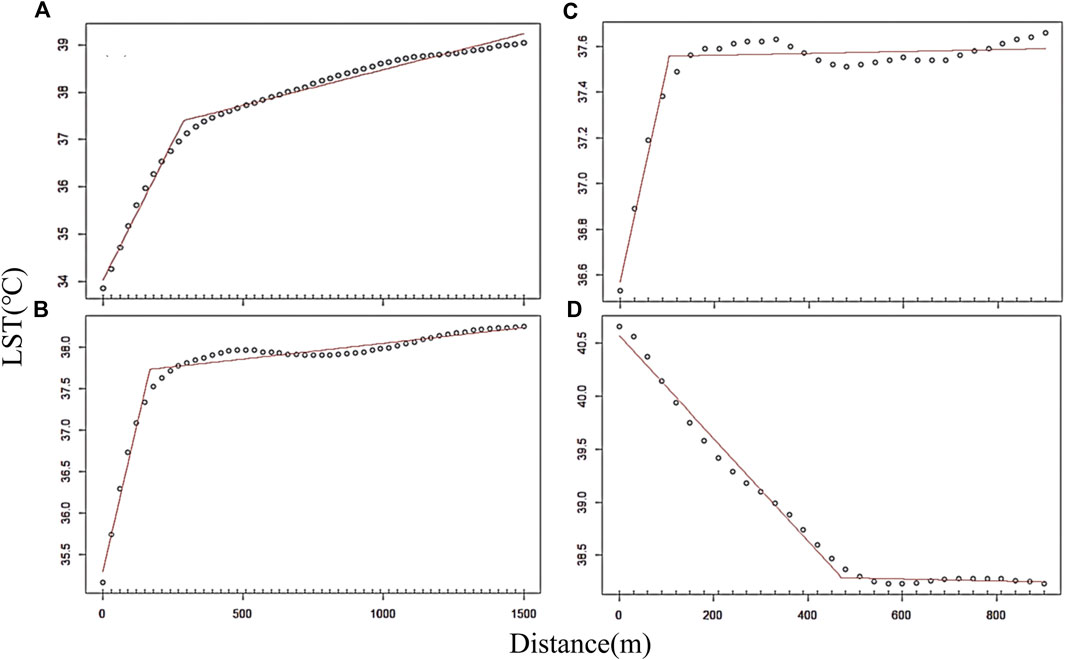
FIGURE 6. Four typical curves for LST (°C) along the buffer zone at the edge of the 36 parks.
Figure 7 shows the impact of the park on the surrounding environment. The average PCSS of 33 parks with PCS in the study area is 1.8°C, where the PCSS values of Park 1 and Park 2 are the highest, with both exceeding 4°C. PCSS values of Park 32 and Park 33 are the lowest, being only 0.04°C and 0.05°C, respectively. Meanwhile, the difference in PCSD is significant, with an average of 179 m (Table A2). The number of parks with PCSD between 100 and 200 m forms the majority, accounting for 39.4% of the total number of samples. There are only six parks with PCSD more than 300 m, accounting for 18.2%. PCSD values in Park 1 and Park 4 are larger, at 370 m and 345 m, respectively. The smallest PCSD is of Park 32, which is only 31 m. Overall, parks have the greatest cooling effect on the surrounding area within 200 m. The average PCSR of 33 parks with PCS is 0.96°C/100 m, which means that for every 100-m increase in distance from the park, the LST will increase by about 0.96°C. The PCSR of Park 27 and Park 22 exceeded 1.70°C/100 m. The smaller PCSR is of Park 33, with a cooling intensity of only 0.13°C per 100 m.
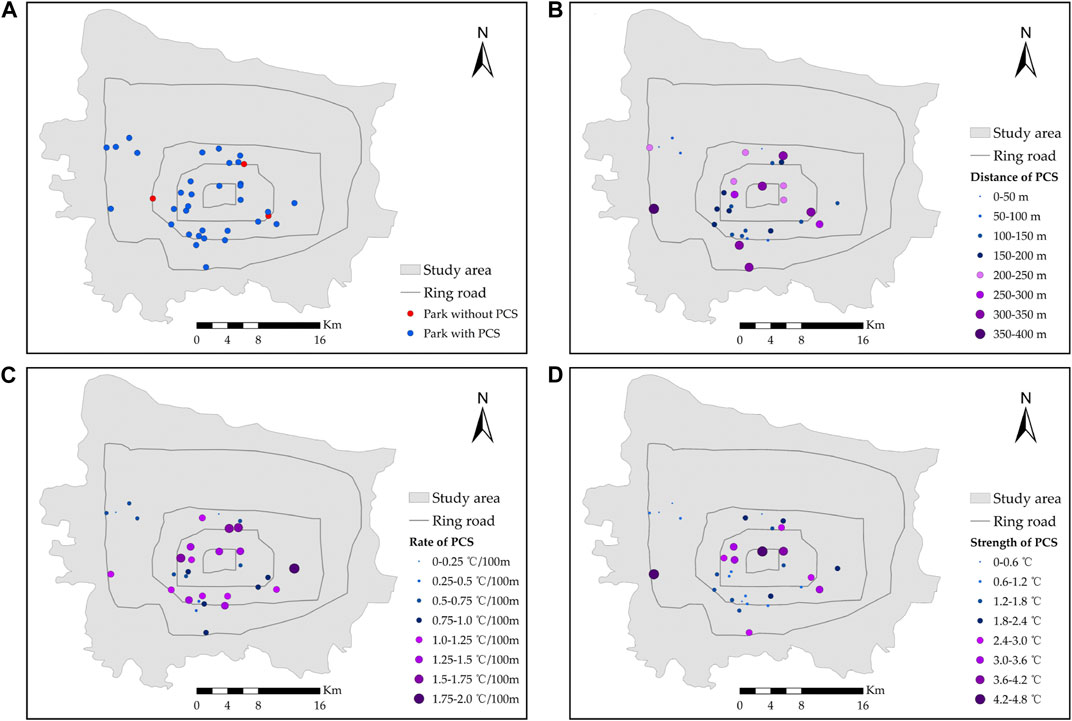
FIGURE 7. (A) Type of urban parks; (B) PCSD, spillover distance of the park cooling effect; (C) PCSR, spillover rate of the park cooling effect; and (D) PCSS, spillover strength of the park cooling effect.
3.3 Correlation of PCS with park landscape features
We analyzed the relationship between the 11 landscape characteristic indexes of the parks and PCS (PCSD, PCSS, and PCSR) (Figure 8). The results showed that park landscape features have a strong influence on PCS. PARA, ED, EDg, and PD were inversely correlated with PCSD. The correlation coefficients were −0.81, −0.76, −0.72, and −0.57, respectively, which indicates that the increase of PARA and ED was not conducive to the generation of larger PCSD. Qiu and Jia (2020) pointed out that PD is the most important negative indicator of the cooling effect. In this study, the increase in PD also has a negative effect on PCSD, but the degree of influence is not as strong as that of the first three.
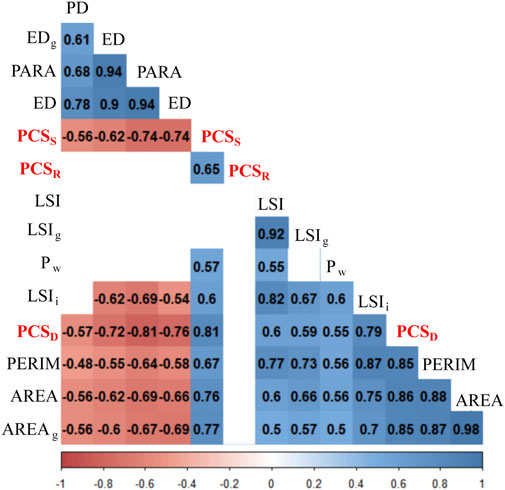
FIGURE 8. Correlation coefficients between PCS and impact factors in Zhengzhou city. All factors shown in the diagram were significant at p < 0.01. PCSD: spillover distance of the park cooling effect; PCSS: spillover strength of the park cooling effect; PCSR: spillover rate of the park cooling effect; PD: patch density; EDg: edge density of the green space; PARA: The ratio of the park perimeter to area; ED: edge density; LSI: landscape shape index; LSIg: landscape shape index of the green space; Pw: the percentage of the water body in park; LSIi: landscape shape index of the impervious surface; PERIM: park perimeter; AREA: park area; AREAg: the area of the green space in a park.
AREA, PERIM, AREAg, LSIi, LSI, LSIg, and Pw were positively correlated with PCSD. The correlation coefficients were 0.86, 0.85, 0.85, 0.79, 0.6, 0.59, and 0.55, respectively. Specifically, the role of AREA, PERIM, AREAg, and LSIi in promoting PCSD is obvious, which is consistent with the research results of Cao et al. (2010) and Yao et al. (2022). Therefore, PCSD can be significantly expanded by increasing AREA, AREAg, and changing LSIi, while the cooling benefits from changing LSI and LSIg or increasing the proportion of water are less obvious.
In terms of PCSS, ED and PARA had the most significant negative effect on it, with correlation coefficients of −0.74, followed by EDg (−0.62) and PD (−0.56). Comparing the results of the PCSD’s study, we found that the impacts of the four landscape indicators (PARA, ED, EDg, and PD) on PCSD and PCSS are similar. The difference is that the correlation between these four indicators and PCSS is not as good as that of PCSD. This means that PARA, ED, EDg, and PD have significant negative effects on PCS. How to alleviate the negative effects of these four aspects is crucial to improve the cooling effect of urban parks.
AREAg, AREA, PERIM, LSIi, and Pw were positively correlated with PCSS, with correlation coefficients of 0.77, 0.76, 0.67, 0.6, and 0.57, respectively. The results demonstrated that AREAg is the primary influencing factor and the degree of influence on PCSS exceeds that of AREA and PERIM. LSIi had a weaker effect on PCSS than on PCSD. Pw has a similar effect on both. In addition, LSI and LSIg had no significant correlation with PCSS.
PCSR was not significantly correlated with landscape elements such as AREA and LSI but only had a positive correlation with PCSS.
3.4 The threshold value of park area
We used non-linear functions to fit the correlation between the area element of the park (AREA and AREAg) and its PCS feature (PCSD and PCSS) (Figure 9). Formulas 7 and 8 were used to calculate the area threshold when the PCS efficiency of the park was at its highest. The results manifested that when the efficiency of the PCSD is the highest, the best AREA was 8.08 ha (Figure 9A) and the best AREAg was 5.71 ha (Figure 9B). The AREA with the best PCSS efficiency was 6.80 ha (Figure 9C), and the AREAg was 5.08 ha (Figure 9D). In general, the park area to achieve high PCS efficiency in Zhengzhou city should be 6–8 ha, while the internal green space area should be controlled within 5–6 ha.
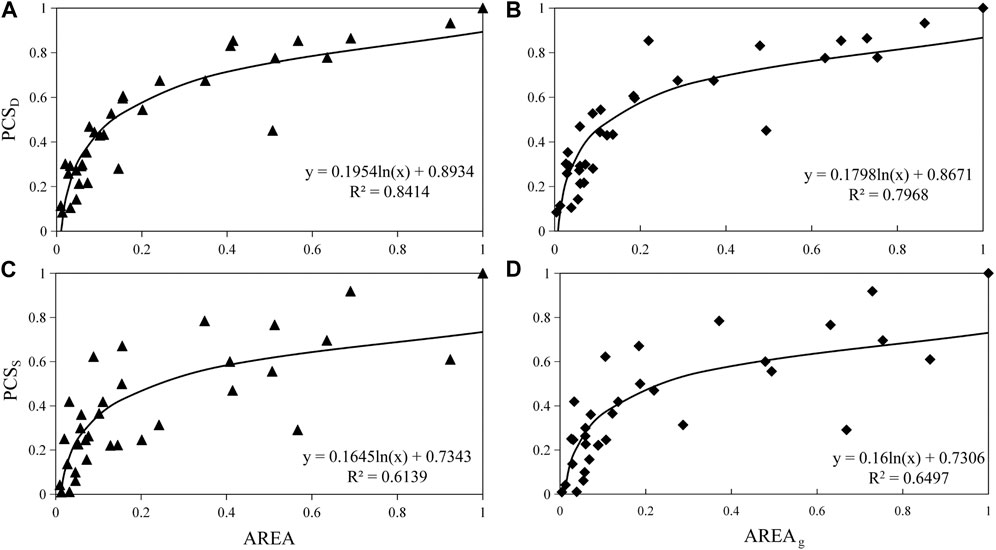
FIGURE 9. Fitting relationship between the area factor (AREA/AREAg) and the PCS (PCSD/PCSS). PCSD: spillover distance of the park cooling effect; PCSS: spillover strength of the park cooling effect; AREA: park area; AREAg: the area of the green space in the park.
4 Discussion
4.1 Influence of park landscape characteristics on LST within the parks
Urban parks are considered an effective way to mitigate the UHI (Chiesura, 2004; Ayala-Azcárraga et al., 2019), which is further confirmed by this study. The average LST of 36 parks in the study area is 2.3°C lower than that of Zhengzhou city, and the LST of the 33 parks is lower than that of the surrounding environment, forming an obvious “urban cold island.” However, the LST difference between different parks and the surrounding environment is not consistent, and the PCSS is between 0.04°C and 4.61°C. The LST of only three parks was higher than that of the surrounding environment, forming a “heat island.”
The LST is closely related to the landscape characteristics within the park, such as the size of the green spaces and water bodies. Whether the spatial configuration of the patches facilitates ventilation and heat exchange entails further investigation. Existing studies have also demonstrated that the patch inside the larger ED park is severely fragmented, and it is arduous to form a relatively stable microclimate (Cheung et al., 2021; Wu et al., 2021). The larger the PARA, the stronger the heat exchange capacity is between the park and the surrounding environment (Yu et al., 2020), which is not conducive to the formation of low-temperature areas. Furthermore, the impervious water surface also seriously affects the change of the LST inside the park. As an example, in our study, the proportion of impervious water surface in the three parks with UHI effect is over 65%, and the mean LSI is 1.82, which is far lower than the mean 2.70 of 33 parks with PCS. This indicated that concentrated and continuous hardened surfaces increase park LST rather than decreasing it.
In order to explore the causes of thermal effects in parks (Park 34–36), we calculated the mean values of indicators for two types of parks and explored the relationship between park landscape indicators and park LST (Tables 2, 3). From the table, we can find that AREAg, AREA, and LSIi can effectively reduce LST, among which AREAg is the most paramount influencing factor. However, these indicators of Parks 34–36 are much smaller than those of other parks. These three parks account for very little vegetation (34.8%), which means that they lack a cooling source and cannot efficiently reduce LST inside the park. Also, the mean values of PARA, PD, and ED in Parks 34–36 are higher than in other parks, and these three characteristics can cause the park temperature to increase. In this case, Parks 34–36 presented a situation where the park LST was higher than that of the surrounding environment.
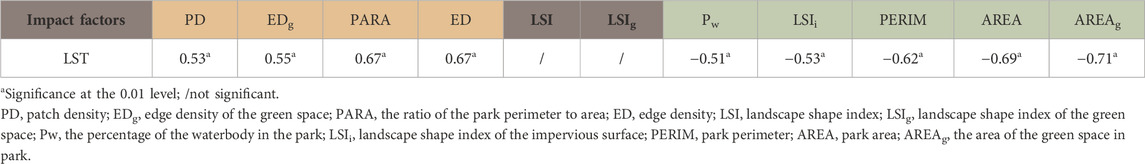
TABLE 2. Correlation coefficients for parks’ LST and 11 landscape indexes in Zhengzhou city.
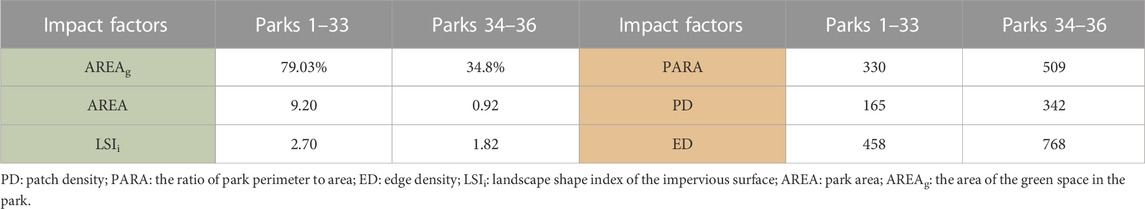
TABLE 3. Average values of six landscape characteristic indices in two types of parks, the Parks 1–33 had “urban cooling effect” and the Parks 34–36 had “urban thermal effect”.
4.2 Influence of park landscape characteristics on the surrounding thermal environment
PCSD and PCSS are major aspects of the cooling effect of the park. The larger PCSD suggests that more individuals can enjoy the cooling benefits of parks, while the improvement of PCSS means that the cooling effect directly felt by the human body is more obvious, both of which are very significant for improving the happiness of urban residents. We found the average PCSS in the study area is 1.8°C, and the maximum can exceed 4°C. PCSD can reach 370 m (Park 1) and has the most obvious cooling effect on the surrounding 200 m, and the average PCSR is 0.957°C/100 m. Our work showed that ED, PARA, EDg, and PD are notably inversely correlated with PCSD and PCSS, while AREAg, AREA, PERIM, LSIi, and Pw have a positive correlation (Figure 8), which is consistent with previous research results (Oliveira et al., 2011; Asgarian et al., 2014; Yang et al., 2017; Aram et al., 2019; Yu et al., 2020). The curves of landscape indicators and PCSD showed that as PARA, PD, ED, and EDg increased, the increase in park cooling range gradually slowed down. This decrease is non-linear but follows a logarithmic relationship (Figures 10A–D). This is because the park with a larger PARA is longer and narrower, and its width decreases while its boundary increases, which is not conducive to formation of the cold island effect. This is consistent with the conclusion proposed by Xie and Li (2020) that the park width is positively correlated with the cooling effect. Qiu and Jia (2020) pointed out that PD is the most influencing factor, which has a negative impact on the cooling effect of parks. This study also confirmed the view that the increase in PD and ED caused by park fragmentation will reduce PCSD (Figures 10A, C, D). In general, parks with smaller PARA have more superior PCS, but the increase of ED and PD caused by internal patch fragmentation is a crucial hindering factor of PCS.
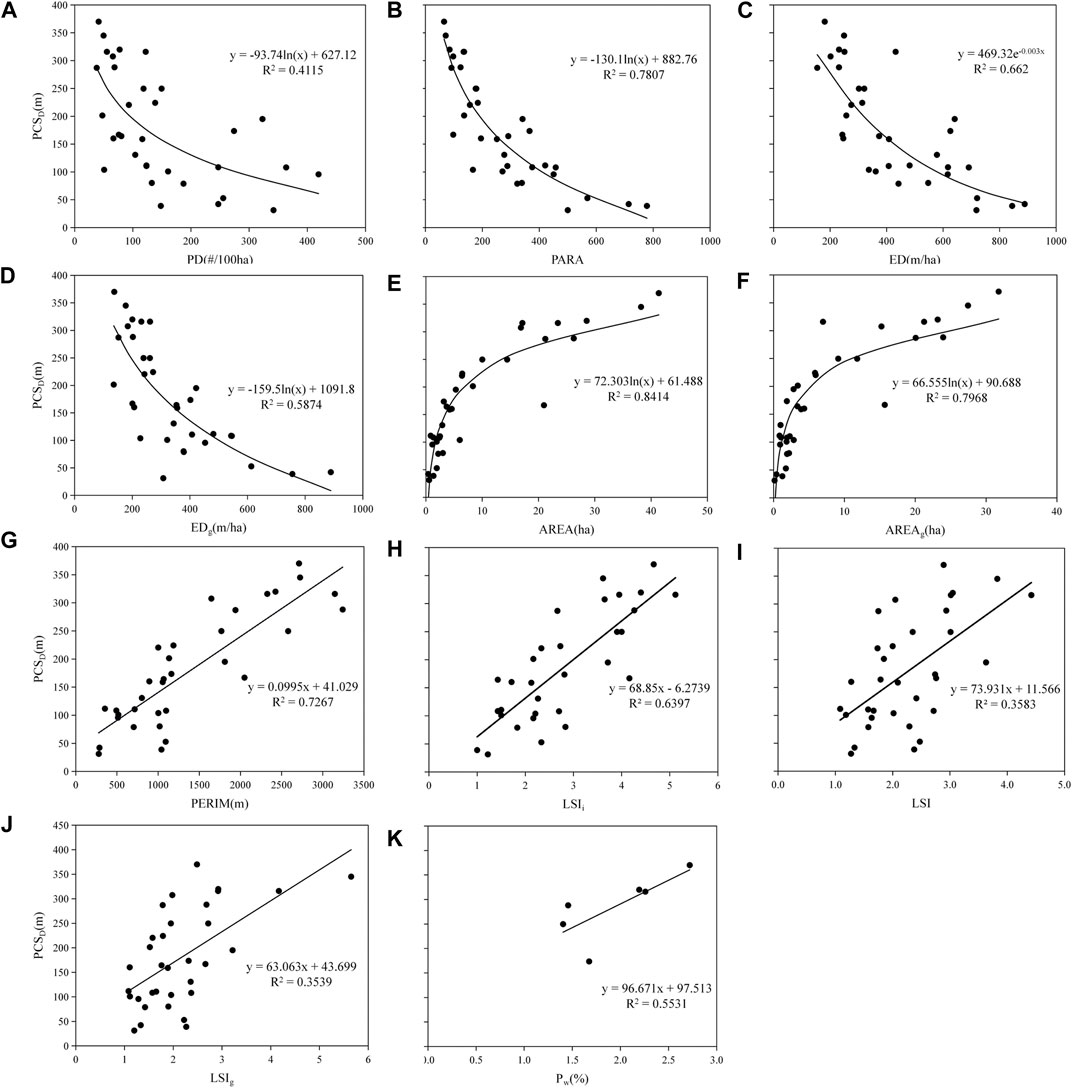
FIGURE 10. Relationship between 11 landscape indexes and spillover distance of the cooling effect (PCSD), (A) PD; (B) PARA; (C) ED; (D) EDg; (E) AREA; (F) AREAg; (G) PERIM; (H) LSIi; (I) LSI; (J) LSIg; (K) PW. PD: patch density; PARA: The ratio of the park perimeter to area; ED: edge density; EDg: edge density of the green space; AREA: park area; AREAg: the area of the green space in park; PERIM: park perimeter; LSIi: landscape shape index of the impervious surface; LSI: landscape shape index; LSIg: landscape shape index of the green space; Pw: The percentage of the water body in the park.
Vegetation within the park effectively reduces LST through shading, evapotranspiration, and increasing albedo, and it is an indispensable source of PCS (Knight et al., 2016; Fan et al., 2019; Blachowski and Hajnrych, 2021; Li et al., 2021; Wong et al., 2021). Our and other studies have proved that increasing AREAg is a paramount method to enhance the PCS (Figure 10F) (Cheng et al., 2015; Lin et al., 2015; Chen et al., 2022; Wang et al., 2022). However, with an increasing EDg, the green areas inside the park are broken up and divided, and PCSD gradually decreases (Figure 10D). Notably, the growth rate of PCSD is gradually slowed down with increasing AREAg. In park design or construction, if the vegetation area exceeds the threshold, changing the vegetation shape may have better benefits (Figure 10J). In addition, PCSD can be expanded by increasing the area and perimeter of a park, changing the park shape, and increasing the proportion of water bodies (Zhu et al., 2021; Chen et al., 2022; Yang et al., 2022; Zheng et al., 2022).
4.3 The threshold value of area for urban park planning and design
In the case of urban expansion and extremely scarce available land resources, it is arduous to enhance the PCS by expanding the urban park area. It is very significant to achieve the best cooling effect with minimum park space. The non-linear relationship between the park area and PCS has been widely recognized by scholars (Chang et al., 2007; Cao et al., 2010; Wu et al., 2021). Our results also manifested that PCSD and PCSS showed a logarithmic relationship with AREA (Figures 9A, B). PCS gradually slowed down with an increase in the park area, which was also confirmed by Wang et al. (2022) in the latest study. Nevertheless, most studies only prove the existence of the threshold value between the two, but few studies quantify the threshold value, which makes it difficult to implement the planning to improve the cooling efficiency of urban parks.
Our results demonstrated that 6–8 ha park patches can exert the most effective PCS in Zhengzhou city. In order to further verify our threshold calculation results, we simulated the cooling situation of the park (Figure 11) according to the fit curves of AREA and PCSD (Figure 10E). The results showed that when a 40-ha mega-park was set into four 10-ha parks with the same total area, the cooling range increased from 52.29 to 78.46 ha (Table 4), an increase of 50.4%. Furthermore, when the park was set into eight 5-ha parks, the cooling range increased by 69%. This indicated that medium-sized parks have higher cooling efficiency than large parks, and it is feasible to use 6–8 ha as the threshold range. In addition, parks with large patches are easily restricted by a series of external factors such as topography and roads. Consequently, in order to better achieve the cooling benefits brought by urban parks, it is more effective to establish more medium-sized parks in cities.
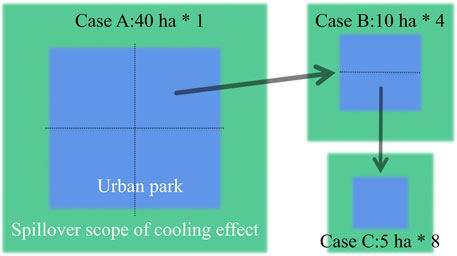
FIGURE 11. Simulation results of the park cooling range under different areas of the park: Case A was a 40-ha park, Case B was a 10-ha park, and Case C was a 5-ha park.

TABLE 4. Simulation results of the park cooling area.
4.4 Limitations and future research directions
There are some limitations in our research. First, the remote sensing data are limited. In terms of acquiring LST, the TIRS of Landsat 8 has a low resolution, and some miniature parks are abandoned because they are difficult to be recognized by remote sensing data. In addition, the imaging time of remote sensing data used in this study is 11:03, and a single remote sensing image constrained our conclusions on temporal dynamics (such as day and night) of PCS. Also, the water body has a considerable cooling effect (Peng et al., 2020) and is an important part of the PCS, but the number of parks with water bodies in the study area is small, which may undermine the applicability of the research conclusion of this study to a wider area. Here, we only discuss the influence of landscape characteristics on the PCS, and the influence of other factors (such as human activities, social economy, architectural layout, green space, and water body) needs to be further studied. Finally, the research on the threshold of PCS needs to be further conducted. We only put forward a design scheme for the maximum efficiency of parks to exert the PCS in terms of area. Other factors are entailed in future studies.
Future research needs to solve the problem at a spatial–temporal dimension, with the help of a new type of unmanned aerial vehicle or the use of ‘remote sensing + ground monitoring’ means, which can obtain more realistic LST data. Being more granular in the settings of the buffer zone can guarantee accurate capture of the LST changes in the surrounding environment to identify the PCS. Long time-series studies should also be carried out to better understand the diurnal or seasonal variations of PCS. In addition, it is also very important to obtain more park samples from different cities, which can help reduce the uncertainty caused by the small number of samples and the single city, and obtain more practical value planning schemes. Finally, full consideration of the relationship between the park’s internal and external factors and PCS can obtain more comprehensive results.
5 Conclusion
In this study, we analyzed 36 parks in Zhengzhou city using Landsat 8 data, aiming to quantify the PCS and the impact of the park’s landscape characteristics on it. Moreover, in order to maximize the cooling effect of the park, we also explored the park area threshold and proposed the ideal park area and the proportion of internal vegetation, which has practical significance for urban planning. The results are summarized below: 1) urban parks have a significant PCS, with a PCSs of 0.04°C–4.61°C. The average PCSS of 33 parks in the study area is 1.8°C, and only three parks have a thermal effect; 2) the piecewise function can better fit the relationship between LST and the distance around the park. The PCSD is between 31 and 370 m, and the cooling effect on the surrounding 200 m is the most obvious. The average PCSR is 0.9574°C/100 m; 3) ED, PARA, EDg, and PD are notably negatively correlated with PCS, while AREAg, AREA, PERIM, LSIi, and Pw have positive effects on the enhancement of PCS; 4) 6–8 ha park patches can achieve the best PCS efficiency in Zhengzhou city. In this case, it is most appropriate to control the internal green space area at 5–6 ha.
In the context of global warming and increasing scarcity of land resources, rational green space system planning will become increasingly paramount (Chen et al., 2022; Yao et al., 2022). Previous research has shown that larger parks can produce stronger cooling effects (Zhu et al., 2021; Liu et al., 2022), but in our work, medium-sized parks were shown to have higher cooling efficiencies. Therefore, in the planning of urban parks, 6–8 ha can be used as the best park area to alleviate the UHI. Our results showed that the larger the park area, the lower the degree of fragmentation, the higher the proportion of green space and water body, the simpler the boundary between the park and the inner green area, and the more complex the shape of the impervious surface, the better the PCS. Moreover, our study area is located in the temperate continental monsoon climate zone, and the study time is summer. The results of the study are also instructive for other cities in this climate zone, especially some cities that have not yet carried out such studies, which can provide policymakers in these cities with some practical reference.
Data availability statement
The Landsat 8 data we utilized are obtained from the geospatial data cloud (http://www.gscloud.cn/). Requests to access the datasets should be directed to gaoy.20s@igsnrr.ac.cn.
Author contributions
All authors contributed significantly to this work. LT designed the research and helped gain data; YG analyzed the data and wrote the manuscript. All authors have read and agreed to the published version of the manuscript.
Funding
This research was funded by the Basic Frontier Science Research Program of the Chinese Academy of Sciences Original innovation projects from 0 to 1 (ZDBS-LY-DQC023) and the Belt and Road Special Foundation of the State Key Laboratory of Hydrology-Water Resources and Hydraulic Engineering (2021490111).
Acknowledgments
We thank the developers of Landsat products for providing data free to the public.
Conflict of interest
The authors declare that the research was conducted in the absence of any commercial or financial relationships that could be construed as a potential conflict of interest.
Publisher’s note
All claims expressed in this article are solely those of the authors and do not necessarily represent those of their affiliated organizations, or those of the publisher, the editors, and the reviewers. Any product that may be evaluated in this article, or claim that may be made by its manufacturer, is not guaranteed or endorsed by the publisher.
References
Amani-Beni, M., Zhang, B., Xie, G.-D., and Odgaard, A. J. (2021). Impacts of the microclimate of a large urban park on its surrounding built environment in the summertime. Remote Sens. 13, 4703. doi:10.3390/rs13224703
Aram, F., Higueras Garcia, E., Solgi, E., and Mansournia, S. (2019). Urban green space cooling effect in cities. Heliyon 5, e01339. doi:10.1016/j.heliyon.2019.e01339
Asgarian, A., Amiri, B. J., and Sakieh, Y. (2014). Assessing the effect of green cover spatial patterns on urban land surface temperature using landscape metrics approach. Urban Ecosyst. 18, 209–222. doi:10.1007/s11252-014-0387-7
Ayala-AzcáRRAGA, C., Diaz, D., and Zambrano, L. (2019). Characteristics of urban parks and their relation to user well-being. Landsc. Urban Plan. 189, 27–35. doi:10.1016/j.landurbplan.2019.04.005
Baro, F., Chaparro, L., Gomez-Baggethun, E., Langemeyer, J., Nowak, D. J., and Terradas, J. (2014). Contribution of ecosystem services to air quality and climate change mitigation policies: The case of urban forests in barcelona, Spain. Ambio 43, 466–479. doi:10.1007/s13280-014-0507-x
Barsi, J., Schott, J., Hook, S., Raqueno, N., Markham, B., and Radocinski, R. (2014). Landsat-8 thermal infrared sensor (TIRS) vicarious radiometric calibration. Remote Sens. 6, 11607–11626. doi:10.3390/rs61111607
Bartesaghi-Koc, C., Osmond, P., and Peters, A. (2020). Quantifying the seasonal cooling capacity of ‘green infrastructure types’ (GITs): An approach to assess and mitigate surface urban heat island in Sydney, Australia. Landsc. Urban Plan. 203, 103893. doi:10.1016/j.landurbplan.2020.103893
Blachowski, J., and Hajnrych, M. (2021). Assessing the cooling effect of four urban parks of different sizes in a temperate continental climate zone: Wroclaw (Poland). Forests 12, 1136. doi:10.3390/f12081136
Cao, X., Onishi, A., Chen, J., and Imura, H. (2010). Quantifying the cool island intensity of urban parks using ASTER and IKONOS data. Landsc. Urban Plan. 96, 224–231. doi:10.1016/j.landurbplan.2010.03.008
Chang, C.-R., Li, M.-H., and Chang, S.-D. (2007). A preliminary study on the local cool-island intensity of Taipei city parks. Landsc. Urban Plan. 80, 386–395. doi:10.1016/j.landurbplan.2006.09.005
Chen, M., Jia, W., Yan, L., Du, C., and Wang, K. (2022). Quantification and mapping cooling effect and its accessibility of urban parks in an extreme heat event in a megacity. J. Clean. Prod. 334, 130252. doi:10.1016/j.jclepro.2021.130252
Cheng, X., Wei, B., Chen, G., Li, J., and Song, C. (2015). Influence of park size and its surrounding urban landscape patterns on the park cooling effect. J. Urban Plan. Dev. 141, 141. doi:10.1061/(asce)up.1943-5444.0000256
Cheng, Y., Zhang, J., Wei, W., and Zhao, B. (2021). Effects of urban parks on residents’ expressed happiness before and during the COVID-19 pandemic. Landsc. Urban Plan. 212, 104118. doi:10.1016/j.landurbplan.2021.104118
Cheung, P. K., Jim, C. Y., and Siu, C. T. (2021). Effects of urban park design features on summer air temperature and humidity in compact-city milieu. Appl. Geogr. 129, 102439. doi:10.1016/j.apgeog.2021.102439
Chiesura, A. (2004). The role of urban parks for the sustainable city. Landsc. Urban Plan. 68, 129–138. doi:10.1016/j.landurbplan.2003.08.003
Doick, K. J., Peace, A., and Hutchings, T. R. (2014). The role of one large greenspace in mitigating London's nocturnal urban heat island. Sci. Total Environ. 493, 662–671. doi:10.1016/j.scitotenv.2014.06.048
Du, H., Song, X., Jiang, H., Kan, Z., Wang, Z., and Cai, Y. (2016). Research on the cooling island effects of water body: A case study of shanghai, China. Ecol. Indic. 67, 31–38. doi:10.1016/j.ecolind.2016.02.040
Fan, H., Yu, Z., Yang, G., Liu, T. Y., Liu, T. Y., Hung, C. H., et al. (2019). How to cool hot-humid (asian) cities with urban trees? An optimal landscape size perspective. Agric. For. Meteorology 265, 338–348. doi:10.1016/j.agrformet.2018.11.027
Feyisa, G. L., Dons, K., and Meilby, H. (2014). Efficiency of parks in mitigating urban heat island effect: An example from Addis Ababa. Landsc. Urban Plan. 123, 87–95. doi:10.1016/j.landurbplan.2013.12.008
Geng, X., Yu, Z., Zhang, D., Li, C., Yuan, Y., and Wang, X. (2022). The influence of local background climate on the dominant factors and threshold-size of the cooling effect of urban parks. Sci. Total Environ. 823, 153806. doi:10.1016/j.scitotenv.2022.153806
Hewitt, C. N., Ashworth, K., and Mackenzie, A. R. (2020). Using green infrastructure to improve urban air quality (GI4AQ). Ambio 49, 62–73. doi:10.1007/s13280-019-01164-3
Jansson, C., Jansson, P. E., and Gustafsson, D. (2006). Near surface climate in an urban vegetated park and its surroundings. Theor. Appl. Climatol. 89, 185–193. doi:10.1007/s00704-006-0259-z
Jaurgrui, E. (1991). Influence of a large urban park on temperature and convective precipitation in a tropical city. Energy Build. 15-16, 457–463.
Knight, T., Price, S., Bowler, D., and King, S. (2016). How effective is ‘greening’ of urban areas in reducing human exposure to ground-level ozone concentrations, UV exposure and the ‘urban heat island effect’? A protocol to update a systematic review. Environ. Evid. 5, 3. doi:10.1186/s13750-016-0054-y
Kraemer, R., and Kabisch, N. (2022). Parks under stress: Air temperature regulation of urban green spaces under conditions of drought and summer heat. Front. Environ. Sci. 10. doi:10.3389/fenvs.2022.849965
Li, H., Wang, G., Tian, G., and Jombach, S. (2020). Mapping and analyzing the park cooling effect on urban heat island in an expanding city: A case study in Zhengzhou city, China. Land 9, 57. doi:10.3390/land9020057
Li, X., Zhou, W., and Ouyang, Z. (2013). Relationship between land surface temperature and spatial pattern of greenspace: What are the effects of spatial resolution? Landsc. Urban Plan. 114, 1–8. doi:10.1016/j.landurbplan.2013.02.005
Li, Y., Fan, S., Li, K., Zhang, Y., Kong, L., Xie, Y., et al. (2021). Large urban parks summertime cool and wet island intensity and its influencing factors in Beijing, China. Urban For. Urban Green. 65, 127375. doi:10.1016/j.ufug.2021.127375
Li, Z.-L., Wu, H., Wang, N., Qiu, S., Sobrino, J. A., Wan, Z., et al. (2012). Land surface emissivity retrieval from satellite data. Int. J. Remote Sens. 34, 3084–3127. doi:10.1080/01431161.2012.716540
Liao, W., Cai, Z., Feng, Y., Gan, D., and Li, X. (2021). A simple and easy method to quantify the cool island intensity of urban greenspace. A simple easy method quantify cool Isl. intensity urban Greensp. Urban For. Urban Green. 62, 127173. doi:10.1016/j.ufug.2021.127173
Lin, W., Yu, T., Chang, X., Wu, W., and Zhang, Y. (2015). Calculating cooling extents of green parks using remote sensing: Method and test. Landsc. Urban Plan. 134, 66–75. doi:10.1016/j.landurbplan.2014.10.012
Liu, W., Zhao, H., Sun, S., Xu, X., Huang, T., and Zhu, J. (2022). Green space cooling effect and contribution to mitigate heat island effect of surrounding communities in beijing metropolitan area. Front. Public Health 10, 870403. doi:10.3389/fpubh.2022.870403
Mcpherson, E. G., Xiao, Q., and Aguaron, E. (2013). A new approach to quantify and map carbon stored, sequestered and emissions avoided by urban forests. Landsc. Urban Plan. 120, 70–84. doi:10.1016/j.landurbplan.2013.08.005
Norton, B. A., Coutts, A. M., Livesley, S. J., Harris, R. J., Hunter, A. M., and Williams, N. S. G. (2015). Planning for cooler cities: A framework to prioritise green infrastructure to mitigate high temperatures in urban landscapes. Landsc. Urban Plan. 134, 127–138. doi:10.1016/j.landurbplan.2014.10.018
Oliveira, S., Andrade, H., and Vaz, T. (2011). The cooling effect of green spaces as a contribution to the mitigation of urban heat: A case study in lisbon. Build. Environ. 46, 2186–2194. doi:10.1016/j.buildenv.2011.04.034
Peng, J., Cheng, X., Hu, Y., and Corcoran, J. (2022). A landscape connectivity approach to mitigating the urban heat island effect. Landsc. Ecol. 37, 1707–1719. doi:10.1007/s10980-022-01439-3
Peng, J., Liu, Q., Xu, Z., Lyu, D., Du, Y., Qiao, R., et al. (2020). How to effectively mitigate urban heat island effect? A perspective of waterbody patch size threshold. Landsc. Urban Plan. 202, 103873. doi:10.1016/j.landurbplan.2020.103873
Qiu, K., and Jia, B. (2020). The roles of landscape both inside the park and the surroundings in park cooling effect. Sustain. Cities Soc. 52, 101864. doi:10.1016/j.scs.2019.101864
Schwarz, N., Schlink, U., Franck, U., and GroßMANN, K. (2012). Relationship of land surface and air temperatures and its implications for quantifying urban heat island indicators—an application for the city of leipzig (Germany). Ecol. Indic. 18, 693–704. doi:10.1016/j.ecolind.2012.01.001
Sobrino, J. A., JiméNEZ-MuñOZ, J. C., and Paolini, L. (2004). Land surface temperature retrieval from LANDSAT TM 5. Remote Sens. Environ. 90, 434–440. doi:10.1016/j.rse.2004.02.003
Song, D., Zhang, X., Zhou, X., Shi, X., and Jin, X. (2022). Influences of wind direction on the cooling effects of mountain vegetation in urban area. Build. Environ. 209, 108663. doi:10.1016/j.buildenv.2021.108663
Sugawara, H., Narita, K.-I., and Mikami, T. (2021). Vertical structure of the cool island in a large urban park. Urban Clim. 35, 100744. doi:10.1016/j.uclim.2020.100744
Sugawara, H., Shimizu, S., Takahashi, H., Hagiwara, S., Narita, K., Mikami, T., et al. (2016). Thermal influence of a large green space on a hot urban environment. J. Environ. Qual. 45, 125–133. doi:10.2134/jeq2015.01.0049
Sun, R., Chen, A., Chen, L., and Lü, Y. (2012). Cooling effects of wetlands in an urban region: The case of Beijing. Ecol. Indic. 20, 57–64. doi:10.1016/j.ecolind.2012.02.006
Tian, L., Chen, J., and Yu, S. (2013). How has Shenzhen been heated up during the rapid urban build-up process? Landsc. Urban Plan. 115, 18–29. doi:10.1016/j.landurbplan.2013.03.009
Upmanis, H., Eliasson, I., and Lindqvist, S. (1998). The influence of green areas on nocturnal temperatures in a high latitude city (Göteborg, Sweden). Int. J. Climatol. 18, 681–700. doi:10.1002/(sici)1097-0088(199805)18:6<681::aid-joc289>3.0.co;2-l
Wang, T., Tu, H., Min, B., Li, Z., Li, X., and You, Q. (2022). The mitigation effect of park landscape on thermal environment in shanghai city based on remote sensing retrieval method. Environ. Res. Public Health 19, 2949. doi:10.3390/ijerph19052949
Wang, X., Cheng, H., XI, J., Yang, G., and Zhao, Y. (2018). Relationship between park composition, vegetation characteristics and cool island effect. Sustainability 10, 587. doi:10.3390/su10030587
Wang, X., Dallimer, M., Scott, C. E., Shi, W., and Gao, J. (2021). Tree species richness and diversity predicts the magnitude of urban heat island mitigation effects of greenspaces. Sci. Total Environ. 770. 145211. doi:10.1016/j.scitotenv.2021.145211
Wolch, J. R., Byrne, J., and Newell, J. P. (2014). Urban green space, public health, and environmental justice: The challenge of making cities ‘just green enough. Landsc. Urban Plan. 125, 234–244. doi:10.1016/j.landurbplan.2014.01.017
Wong, N. H., Tan, C. L., Kolokotsa, D. D., and Takebayashi, H. (2021). Greenery as a mitigation and adaptation strategy to urban heat. Nat. Rev. Earth Environ. 2, 166–181. doi:10.1038/s43017-020-00129-5
Wu, C., Li, J., Wang, C., Song, C., Haase, D., Breuste, J., et al. (2021). Estimating the cooling effect of pocket green space in high density urban areas in shanghai, China. Front. Environ. Sci. 9. doi:10.3389/fenvs.2021.657969
Xie, Q., and Li, J. (2020). Detecting the cool island effect of urban parks in wuhan: A city on rivers. Int. J. Environ. Res. Public Health 18, 132. doi:10.3390/ijerph18010132
Xue, Z., Hou, G., Zhang, Z., Lyu, X., Jiang, M., Zou, Y., et al. (2019). Quantifying the cooling-effects of urban and peri-urban wetlands using remote sensing data: Case study of cities of Northeast China. Landsc. Urban Plan. 182, 92–100. doi:10.1016/j.landurbplan.2018.10.015
Yan, H., Wu, F., and Dong, L. (2018). Influence of a large urban park on the local urban thermal environment. Sci. Total Environ. 622-623, 882–891. doi:10.1016/j.scitotenv.2017.11.327
Yang, C., He, X., Yu, L., Yang, J., Yan, F., Bu, K., et al. (2017). The cooling effect of urban parks and its monthly variations in a snow climate city. Remote Sens. 9, 1066. doi:10.3390/rs9101066
Yang, J., Guo, R., Li, D., Wang, X., and Li, F. (2022). Interval-thresholding effect of cooling and recreational services of urban parks in metropolises. Sustain. Cities Soc. 79, 103684. doi:10.1016/j.scs.2022.103684
Yao, X., Yu, K., Zeng, X., Lin, Y., Ye, B., Shen, X., et al. (2022). How can urban parks be planned to mitigate urban heat island effect in “furnace cities” ? An accumulation perspective. J. Clean. Prod. 330, 129852. doi:10.1016/j.jclepro.2021.129852
Yu, X., Guo, X., and Wu, Z. (2014). Land surface temperature retrieval from Landsat 8 TIRS—comparison between radiative transfer equation-based method, split window algorithm and single channel method. Remote Sens. 6, 9829–9852. doi:10.3390/rs6109829
Yu, X., Liu, Y., Zhang, Z., and Xiao, R. (2021). Influences of buildings on urban heat island based on 3D landscape metrics: An investigation of China’s 30 megacities at micro grid-cell scale and macro city scale. Landsc. Ecol. 36, 2743–2762. doi:10.1007/s10980-021-01275-x
Yu, Z., Yang, G., Zuo, S., JøRGENSEN, G., Koga, M., and Vejre, H. (2020). Critical review on the cooling effect of urban blue-green space: A threshold-size perspective. Urban For. Urban Green. 49, 126630. doi:10.1016/j.ufug.2020.126630
Yuan, F., and Bauer, M. E. (2007). Comparison of impervious surface area and normalized difference vegetation index as indicators of surface urban heat island effects in Landsat imagery. Remote Sens. Environ. 106, 375–386. doi:10.1016/j.rse.2006.09.003
Zheng, J., Tarin, M. W. K., Chen, G., Zhang, Q., and Deng, C. (2022). The characteristics of plant clusters influence on the cooling effect: A case study in a subtropical island park, China. Glob. Ecol. Conservation 34, e02055. doi:10.1016/j.gecco.2022.e02055
Appendix
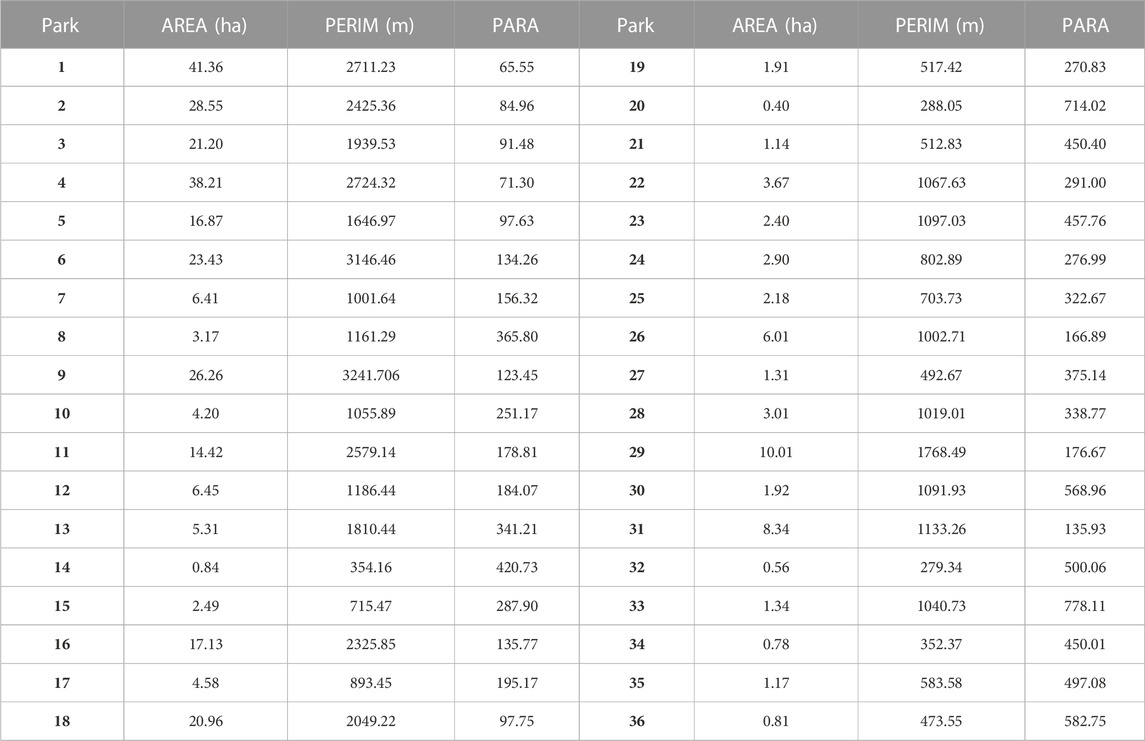
TABLE A1. Characteristics of urban parks in the study area.
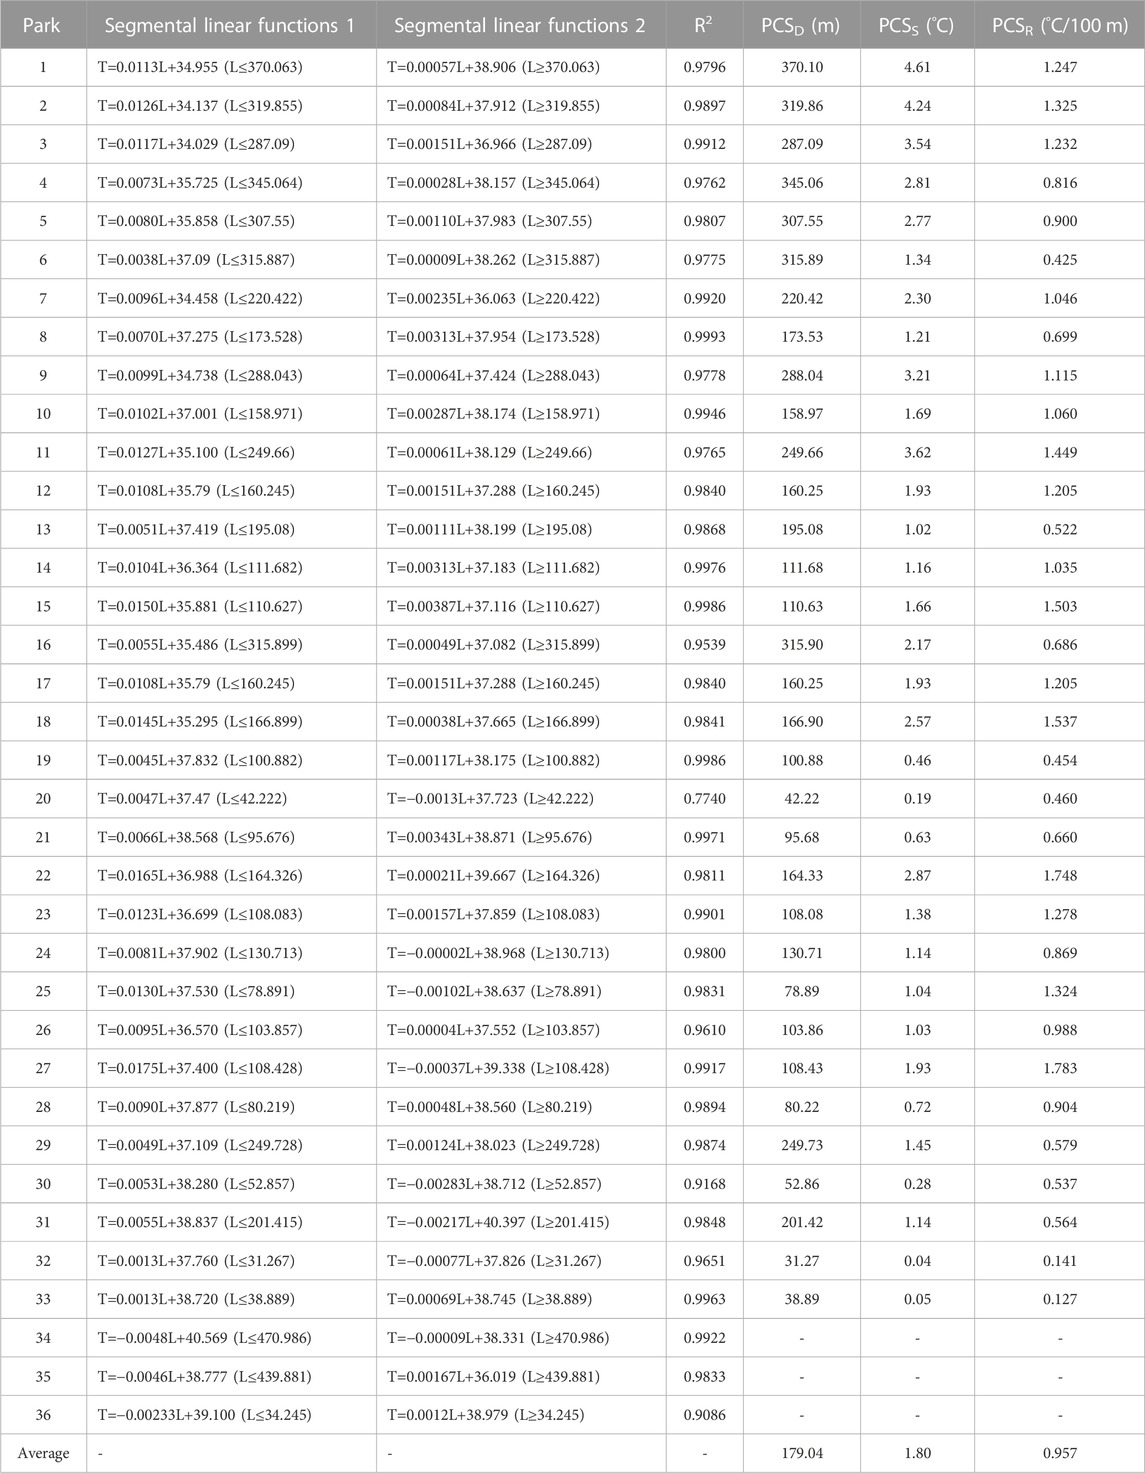
TABLE A2. Fitting result of segmental linear functions of buffer temperature and distance.
Keywords: urban parks, urban heat islands, spillover characteristics, cooling effect, park design
Citation: Gao Y, Pan H and Tian L (2023) Analysis of the spillover characteristics of cooling effect in an urban park: A case study in Zhengzhou city. Front. Earth Sci. 11:1133901. doi: 10.3389/feart.2023.1133901
Received: 29 December 2022; Accepted: 13 February 2023;
Published: 28 February 2023.
Edited by:
Liang Chen, University of Nebraska-Lincoln, United StatesReviewed by:
Jinda Qi, National University of Singapore, SingaporeDecheng Zhou, Nanjing University of Information Science and Technology, China
Copyright © 2023 Gao, Pan and Tian. This is an open-access article distributed under the terms of the Creative Commons Attribution License (CC BY). The use, distribution or reproduction in other forums is permitted, provided the original author(s) and the copyright owner(s) are credited and that the original publication in this journal is cited, in accordance with accepted academic practice. No use, distribution or reproduction is permitted which does not comply with these terms.
*Correspondence: Li Tian, tianli@igsnrr.ac.cn