Strain rate effects on characteristic stresses and acoustic emission properties of granite under quasi-static compression
 Lu Liu
 Sijing Wang1,2*
 - 1Key Laboratory of Shale Gas and Geoengineering, Institute of Geology and Geophysics, Chinese Academy of Sciences, Beijing, China
- 2Innovation Academy for Earth Science, Chinese Academy of Sciences, Beijing, China
- 3University of Chinese Academy of Sciences, Beijing, China
- 4Key Laboratory of Petroleum Research, Institute of Geology and Geophysics, Chinese Academy of Sciences, Beijing, China
In order to further investigate the strain rate effects on characteristic stresses and acoustic emission parameters of rock under quasi-static compression, uniaxial compressive tests were conducted on cylindrical specimens measuring 50 mm in diameter and 100 mm in height using a rock material testing machine and a multi-channel acoustic emission monitoring system at strain rates ranging from 10–6 s−1 to 10–2 s−1. The stress-strain curves of rock samples, characteristic stresses, energy data, and temporal and spatial distribution of acoustic emission signals were obtained and analyzed. The experimental results certified a linearly positive correlation between characteristic stresses and the logarithm of strain rates, despite the fact that the linear correlation varies for different characteristic stresses, whereas the ratios of characteristic stresses essentially do not change with increasing strain rates. The input energy and elastic strain energy at the damage point, UCS point and failure stress point exhibit a linearly positive correlation with the logarithm of strain rates when the strain rate exceeds 10–5 s−1. Meanwhile, the characteristics of energy conversion between input energy and elastic strain energy or the dissipated energy at different characteristic stresses points were explored. Based on this, the energy conversion process of rock under quasi-static compression can be divided into three stages: energy accumulation, energy dissipation, and energy release, respectively. Besides, it is noted that the total number of the located AE events decreases as strain rates increase when the strain rate exceeds 10–5 s−1, and the majority of located AE events occur during the crack closure stage and unstable crack growth stage. Finally, based on the perspective of energy conversion and the structural properties of multi-scale defects in rock, the mechanism of the increase of characteristic stresses with the increase of strain rates was proposed: that is, when rock is subjected to quasi-static compression, the higher strain rates can activate the small-scale defects, which necessitates more input energy from the external load via continuous work and causes an increase in the associated characteristic stresses.
1 Introduction
Rock is a type of special solid material generated by long-term tectonic geological movement. It is heavily fractured and contains numerous joints, fissures, and microflaws. Consequently, when rock is subjected to a variety of loading conditions, such as different strain rates, confining pressures, or loading paths, its mechanical properties may significantly vary. This implies that investigating the relationship between external loading conditions and rock mechanical properties is crucial, as the results of this research can help us better comprehend the process of rock deformation and failure, as well as provide more precise mechanical parameters of rock for use in practical engineering designs.
According to the magnitude of the strain rate, loading conditions can be roughly categorized into five groups: creep loading, quasi-static loading, intermediate strain rate loading, high strain rate loading and ultra-high strain rate loading (Zhang and Zhao, 2014). It is commonly acknowledged that the mechanical characteristics and corresponding fracture process of brittle rock can be influenced by varying loading strain rates under quasi-static loading conditions, such as blasting, explosion and seismic stress (Brace and Jones, 1971; Lindholm et al., 1974; Lajtai et al., 1991; Zhao et al., 1999; Li et al., 2005; Li et al., 2014; Liang C. et al., 2015; Hokka et al., 2016). A series of laboratory tests on granite samples were conducted at loading strain rates ranging from 10–4 s−1 to 100 s−1, and the results of these tests indicated that the compressive strength of rock samples increased with the increase of the strain rate and confining pressure, whereas elastic modulus and Poisson’s ratio had no rate-dependence on loading strain rates (Li et al., 1999). When the loading strain rate exceeds 5 × 10⁻⁴ s−1, Liang C. et al. (2015) found that the uniaxial compressive strength (UCS) of granite samples was dependent on strain rates. In addition, the uniaxial compressive strength of shale (Mahanta et al., 2018), marble (Li et al., 2014) and sandstone (Zhao Z. et al., 2021) exhibits a substantial dependence on strain rates, but the variation differs slightly from that of granite. The uniaxial compressive strength of rock, an essential parameter for evaluating rock mechanical characteristics, is a function of rock stress state (Martin and Chandler, 1994) and is easily affected by the size of rock samples, confining pressure, the shape of rock samples and other factors. Therefore, in addition to the uniaxial compressive strength of rock, characteristic stresses, including crack initiation stress, damage stress and failure stress, should be adopted to systematically analyze the strain rate effects on rock mechanical properties during rock deformation and failure. Wang C. et al. (2011) found that the varation between the crack initiation stress and damage stress of red sandstone samples and strain rates ranging from 10−6-10–3 s−1 was irregualr, while the ratio between the crack initiation stress and damage stress and the uniaxial compressive strength decreased as strain rates increased. Jaczkowski (2018) also determined that there was no significant relationship between the crack initiation stress, damage stress or uniaxial compressive strength of argillaceous limestone and axial strain rate. However, Liang C. Y. et al. (2015) discovered that the crack initiation stress, damage stress or uniaxial compressive strength of granite increased as strain rates increased, and silimar results were determined using grain-based finite-discrete element method (Li et al., 2020). In light of the aforementioned review of literature, a unified understanding of the variation of strain rate effects on charactersitic stress has not yet emerged, and the mechanism underlying these effects requires further investigation.
The essence of rock deformation and failure, from the viewpoint of thermodynamics, is the result of energy input, energy accumulation, and energy conversion (Xie et al., 2009). The input energy and elastic strain energy are typically calculated by integrating stress and strain, which can characterize the process of rock deformation and failure more comprehensively and systematically than stress or strain alone. Zhang et al. (2000) conducted dynamic compression tests on Gabbro samples and marble samples and discovered that rock samples can absorb more energy as strain rates increase. The greater the strain energy accumulated by rock samples under quasi-static compression prior to the peak point of the stress-strain curve, the greater the intensity of rock fracture (Li et al., 2014). Liang C. et al. (2015) provided an explanation for why rock samples can absorb more energy when strain rates increase: that is, at low strain rates, the predominant micro-fracture pattern of rock is the intergranular fracture, which consumes less energy. At the high strain rate, the process of energy input is rapid. Consequently, the transgranular fracture develops gradually. Due to the difficulty of the transgranular fracture, this mode will require more energy than the mode of the intergranular fracture. The variation trend of energy parameters of rock subjected to quasi-static compression is the primary focus of the aforementioned studies. Moreover, these studies are only limited to qualitative descriptions or simple data fitting between energy data, mechanical parameters, and strain rates, and there are a few investigations into the root cause of this phenomenon. In addition, the structural properties of multi-scale defects in rock have not been taken into account in the energy conversion during rock deformation and failure, necessitating further investigation.
Acoustic emission technology (AE), as an excellent approach for real-time and non-destructive monitoring of microscopic damage features, has been widely adopted in rock mechanics throughout recent decades (Lei et al., 2000; Cai et al., 2007; Meng et al., 2016; Wang et al., 2018). Several investigations have demonstrated that AE activities correlate well with the process of rock deformation and failure under quasi-static compression (Sirdesai et al., 2018; Zhao Z. et al., 2021). AE events decrease as the strain rates increase (Zhang et al., 2017), while the maximum AE ring rate and the maximum AE energy rate correlate positively with strain rates (Zhao et al., 2018). Using the AE location technology, Zhao Z. et al. (2021) determined that under high strain rates, AE events of rock samples occurred predominately along the axial loading direction, and their spatial distribution was more dispersed than under low strain rates. Despite the fact that the current studies have yielded significant results regarding the AE characteristics at various strain rates, additional research into the spatial distribution of AE events and the mechanism underlying the strain rate effect on AE properties is necessary.
According to the above review, numerous studies on the strain rate effects of rock mechanical properties and AE features have been conducted under quasi-static compression. However, the energy conversion in the process of rock deformation and failure and the structural properties of multi-scale defects in rock are rarely considered when investigating the mechanism of the increase of characteristic stresses with increasing strain rates. In this paper, uniaxial compressive tests of different strain rates in the range from 10–6 s−1 to 10–2 s−1 were comprehensively performed to investigate the mechanical behaviors and AE characteristics of granite samples subjected to quasi-static compression. Then, the stress-strain curves of rock samples, characteristic stresses, energy data, and temporal and spatial distribution of AE events were analyzed. Finally, the mechanism underlying the increase of characteristic stresses with the increasing strain rates was discussed from the perspective of energy conversion and rock intrinsic properties.
2 Rock samples and tests
2.1 Rock samples and testing system
The natural granite blocks were extracted from northern China, as shown in Figure 1A. It is noted from the microscopic structure in Figure 1B that the irregular mineral grains, tiny micro-pores and crannies are intertwined, which may have an effect on the macroscopic mechanical properties of granite samples. The X-ray Diffractometer (XRD) results of rock flakes are shown in Figures 1C–E, which represent quartz, potassium feldspar and biotite respectively, indicating that these minerals are the primary constituents of the testing samples. In accordance with the standard testing procedure of the International Society for Rock Mechanics (Kovari et al., 1983), the rock blocks were drilled and polished into cylindrical specimens measuring 50 mm in diameter and 100 mm in height, as shown in Figure 1A. The flatness of the specimen end surface must be less than 0.02 mm, and the parallelism of the upper and lower surfaces must be less than 0.05 mm. The physical parameters of rock samples were listed in Table 1, and the thirty-three processed specimens were randomly divided into eleven groups containing three specimens each. These specimens were numbered GS-1-1, GS-1-2, GS-1-3, GS-2-1, GS-2-2, and GS-2-3, etc., in accordance with the “GS-A-B″ naming convention.
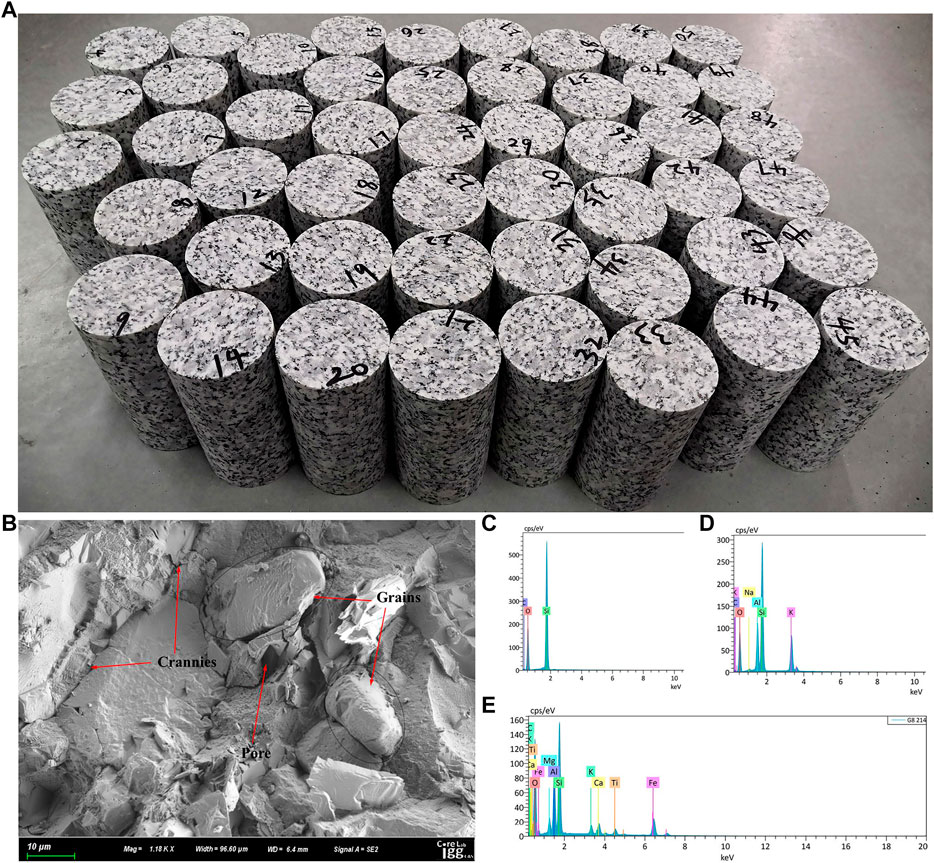
FIGURE 1. Rock samples. (A) Cylindrical specimens; (B) rock sample SEM; (C) quartz XRD; (D) potassium feldspar XRD; (E) biotite XRD.
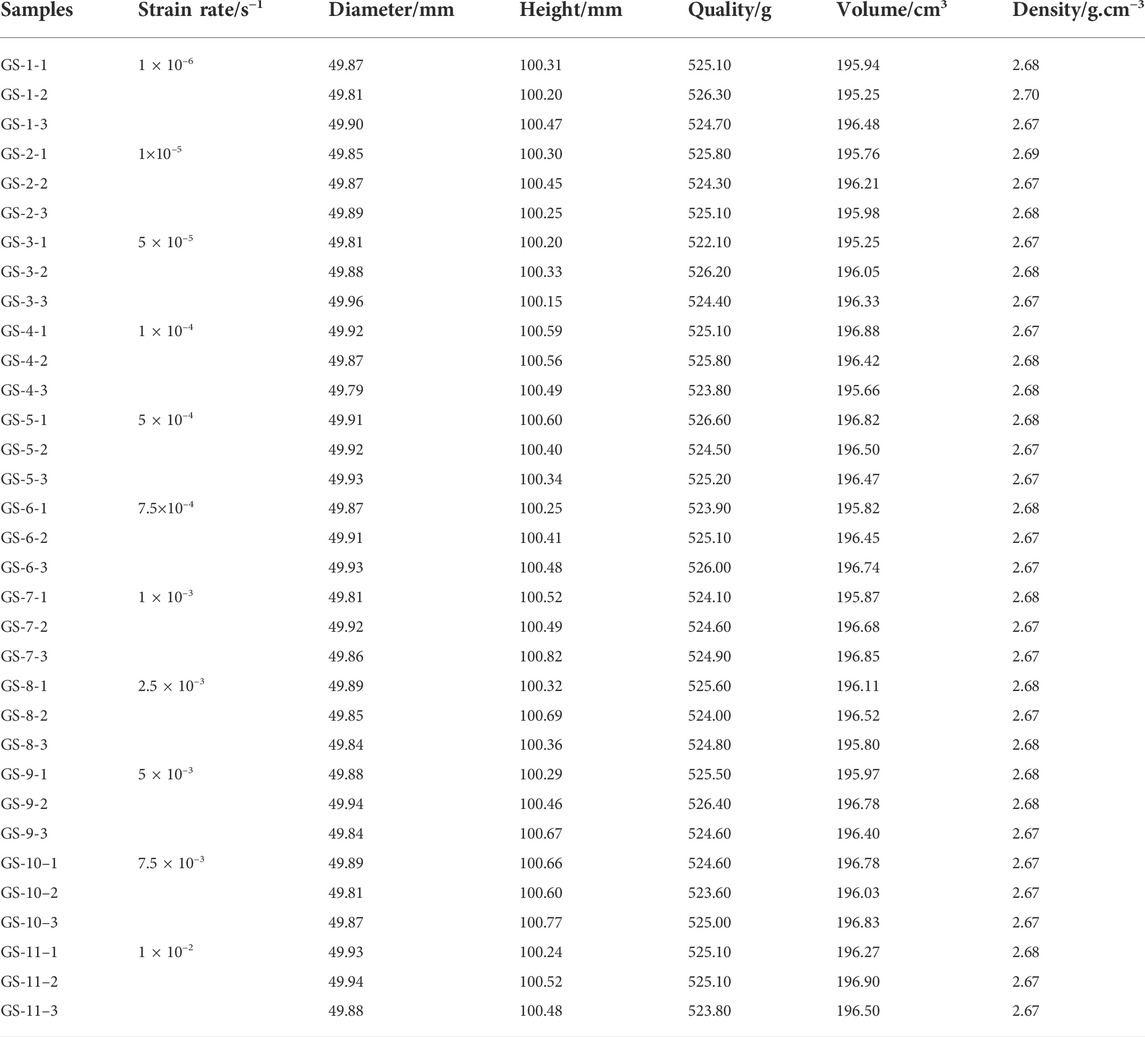
TABLE 1. Physical parameters of rock samples.
As shown in Figure 2A, uniaxial compressive tests were conducted in the Key Laboratory of Rock Mechanics and Geohazards of Zhejiang Province using the mechanics testing system MTS815.04 with strain rates ranging from 10–6 s−1 to 10–2 s−1 over eleven levels. AE signals were acquired using a digital AE monitoring system (12CHsPCI-2) with 32 channels manufactured by Physical Acoustic Company, and this test utilized eight of these channels, as shown in Figures 2B,C.
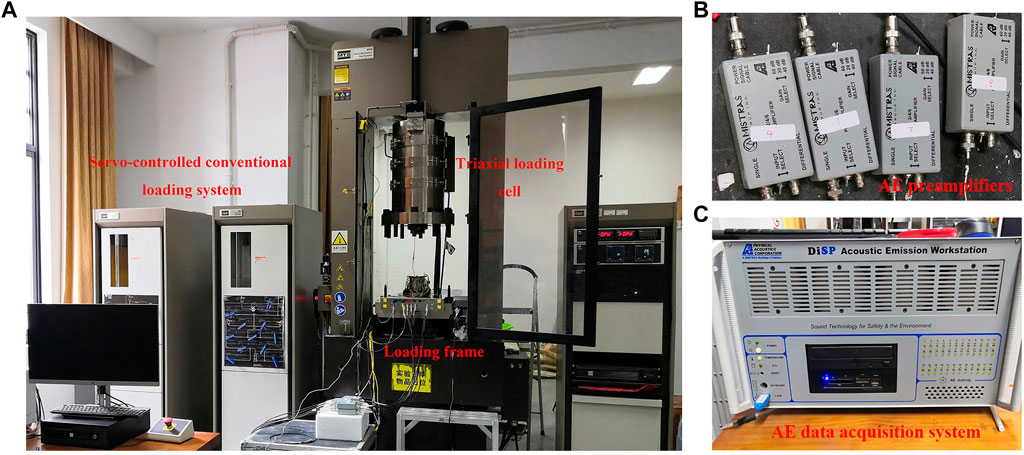
FIGURE 2. Schematic diagram of the testing system. (A) material testing system; (B) AE signals preamplifier; (C) AE signals acquisition system.
2.2 Procedures for testing
The quasi-static strain rates utilized in this paper ranged from 10–6 s−1 to 10–2 s−1 and were divided into three stages containing eleven levels (Li et al., 2014; Liang C. et al., 2015). As shown in Table 1, testing was undertaken on three replicates for each strain rate level to reduce the dispersion of experimental results. The three stages of strain rates were as follows: The first stage of the strain rate consists of two levels ranging from 10–6 s−1 to 10–5 s−1; the second stage of the strain rate has three levels: 10–5 s−1 to 5 × 10⁻⁴ s−1; six levels comprise the third stage of the strain rate: 5 × 10⁻⁴ s−1 to 10–2 s−1. Detailed procedures for testing include: First, eight AE sensors were adhered to the surface of the rock sample using hot adhesive according to the position designed in Figure 3A; Next, as illustrated in Figure 3B, the loading transducer and extensometer were mounted on the bottom and middle of the samples, respectively, ensuring that they did not come into contact with any AE sensors; Then, the acquisition parameters of the AE monitoring software were configured. In order to avoid erroneous interference from surrounding noise, the external amplifiers were set to 45 dB, which aided in amplifying the AE signals originating from the cracks within the rock samples. The operating frequency of the sensors was 300 kHz, and the sampling frequency was 1,000 kHz; Afterwards, 4 kN axial pre-stress was applied in the load-controlled mode of 0.5 kN per second, and then maintained for 30 s; Finally, uniaxial compressive tests of different strain rates were carried out at a loading rate ranging from 0.006 mm per minute to 60 mm per minute in displacement-controlled mode.
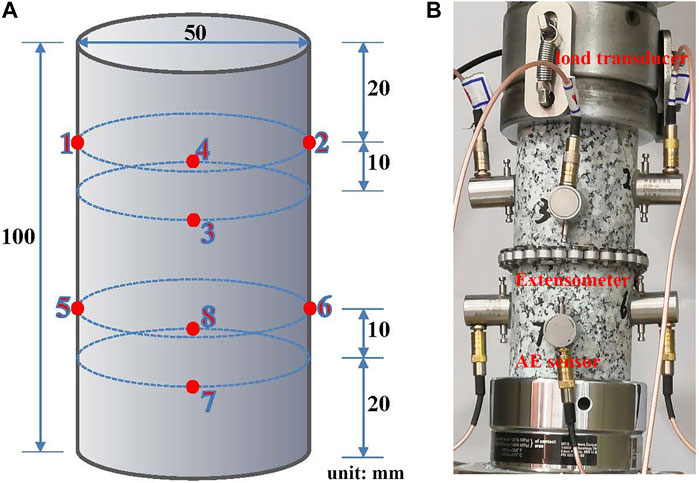
FIGURE 3. Schematic diagram of sensor installation. (A) The installation layout of AE sensors; (B) the layout of mechanical transducers.
3 Experimental results and analysis
3.1 Stress-strain curves
Figure 4 depicted the stress-strain curves of rock at various strain rates, ranging from 10–6 s−1 to 10–2 s−1. To make Figure 4 appear more concise, one sample was selected from three samples at each strain rate level. It can be observed that when strain rates increase, peak stress and associated strain also increase. However, despite the fact that rock samples are subjected to different strain rates, the shape of their stress-strain curves is essentially identical. In general, different shapes of rock’s stress-strain curves can characterize various modes of rock deformation. Therefore, the above results mean that increasing the strain rate only increases the peak stress and other related mechanical parameters of rock samples, but does not change the fundamental mode of rock deformation.
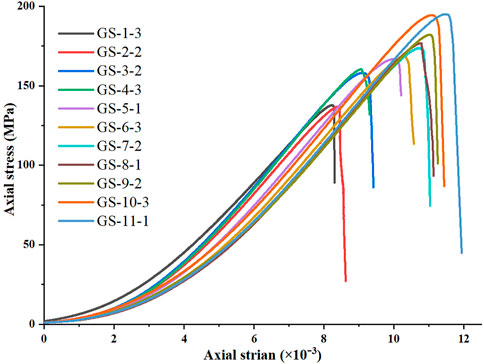
FIGURE 4. Stress-strain curves of a portion of granite samples at various strain rates.
3.2 Strain rate effects on characteristic stresses
The status of all micro-cracks within a compressed rock frequently determines its macroscopic mechanical properties. In other words, the process of rock deforamtion and failure is the process of microcrack development in rock (Liang C. et al., 2015). Thus, the process of rock deforamtion can be divided into five stages based on the process of microcracks development (Hoek and Bieniawski, 1965; Brace et al., 1966; Bieniawski, 1967; Martin and Chandler, 1994): 1) crack closure stage; 2) elastic stage; 3) stable crack growth stage; 4) unstable crack growth stage; 4) post-peak stage, as shown in Figure 5A. The division of each stage depends on three important stress thresholds, which are crack initiation stress σci, damage stress σcd, and uniaxial compressive strength σp. Crack initiation, the oneset of dilation and the beginning of crack growth, is attributed to local tensile stress concentration at the tips of pre-existed flaws, inclusions and other heterogeneities (Li et al., 2020); hence, the axial stress corresponding to the onset of micro-cracks in rock was referred to as the crack initiation stress (Martin and Chandler, 1994). The axial stress level at which the total volumetric strain reversal occurs marks the beginning of the unstable crack growth stage (Bieniawski, 1967). In other words, the axial stress corresponding to the maximum value of the axial stress-volumetric strain curve was designated as the damage stress, or dilatancy stress. The uniaxial compressive strength of rock correpsonding to the maximum value of the axial stress-axial strain marks the beginning of post-peak stage.
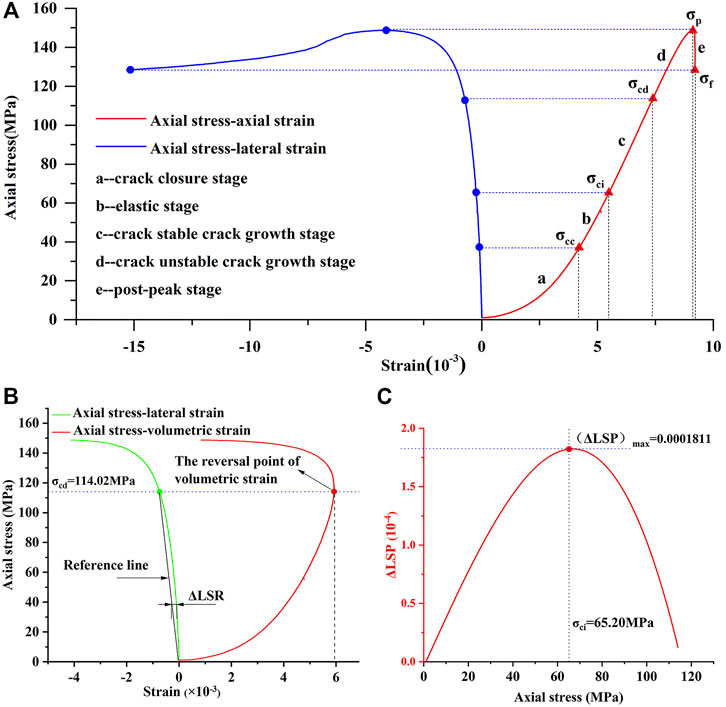
FIGURE 5. An example used to determine the crack initiation stress using the LSR method. (A) Stress-strain curves of the sample GS-2-3 (strain rate: 10–5 s−1); (B) the curves of axial stress-strain; (C) the curve of △LSP-axial stress.
The axial stress is the failure stress when rock loses its bearing capacity and appears to fail as a whole when subjected to external compression. The overall failure of rock samples was defined in this paper based on laboratory data as follows: when the external load exceeds the uniaxial compressive strength of rock samples, the drop of axial stress between two adjacent points of MTS loading transducers is more than 30%, and the corresponding lateral strain increases as well. At this point, the entire failure of rock samples can be considered, and the failure stress σf is the axial stress corresponding to this failure.
The value of crack initiation stress is difficult to determine in comparison to damage stress, uniaxial compressive strength and failure stress of rock. There are many methods to determine the value of crack initiation stress, including the crack volumetric strain method (Martin and Chandler, 1994), AE method (Zhao Z. et al., 2021), and the lateral strain response method (LSR method) (Nicksiar and Martin, 2012). In this paper, the LSR method was applied to determine the crack initiation stress, with the following procedures: First, determining the point of damage stress in the axial stress-lateral strain curve, as shown in Figure 5B; second, connecting the point of damage stress to the curve’s origin as the reference line, as shown in Figure 5B; and third, drawing the curve based on the difference value between the curve of axial stress-lateral strain and the reference line, where the peak point of this curve corresponding to the axial stress is the crack initiation stress, as shown in Figure 5C.
The characteristic stresses of rock samples were determined using the aforementioned method, as shown in Table 2. Figure 6A depicted the relationship between three kinds of characteristic stresses and strain rates, including crack initiation stress, damage stress and uniaxial compressive strength of rock samples. It can be observed that the characteristic stresses are significantly strain rate-dependent, while there are differences in the magnitude and trend of the increase. The growth process of characteristic stresses corresponding to the strain rate can be divided into two stages: stage I and stage II, as shown in Figure 6A. When the strain rate is less than 10–4 s−1, the crack initiation stress grows rapidly, but the stress increases slowly when the strain rate is greater than 10–4 s−1. Nevertheless, the strain rate for the damage stress and uniaxial compressive corresponding to the preceding trend is 2.5 × 10⁻³ s−1. Besides, the threshold strain rate between static loading and quasi-static loading should be mentioned as a key issue. There are numerous results for this value, such as 10–5 s−1 (Zhang and Zhao, 2014), 5 × 10⁻⁴ s−1 (Liang C. et al., 2015), 10–3 s−1 (Tarasov, 1990). However, comparing the variation of damage stress and the uniaxial compressive strength of rock samples in Figure 6B, a noticeable increase in the stresses occurred between 10–5 s−1 and 5 × 10⁻⁵ s−1, and the increments for damage stress and uniaxial compressive strength are 12.29 and 20.36 MPa, respectively, which are the maximum increments between the adjacent strain rate level in this test. Therefore, it may be inferred that the threshold strain rate of granite between static loading and quasi-static loading was 5 × 10⁻⁵ s−1.
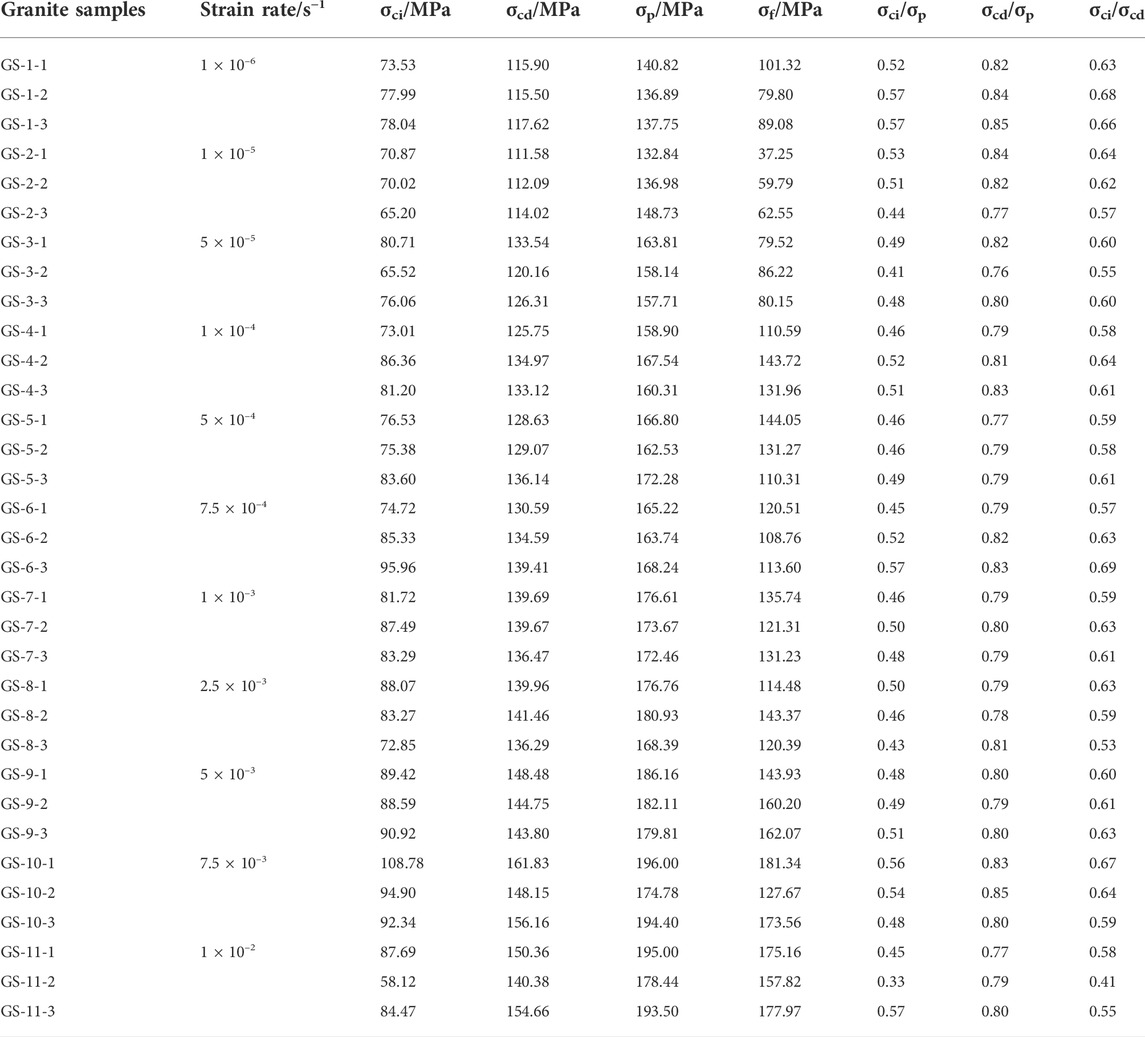
TABLE 2. Characteristic stresses of rock samples within different strain rates (σci-crack initiation stress; σcd-damage stress; σp-uniaxial compressive stress; σf-failure stress).
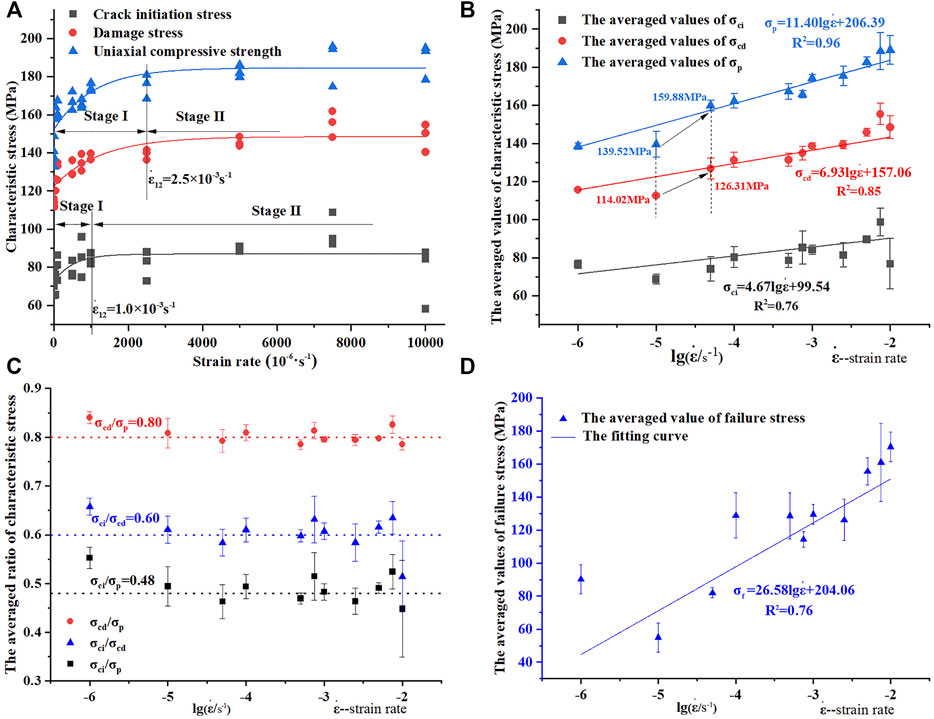
FIGURE 6. The relationship between characteristic stresses and strain rates. (A) The variation trend of characteristic stresses with the increase of strain rates; (B) the linear fitting of characteristic stresses versus the denary logarithm of strain rates; (C) the averaged ratios of characteristic stresses versus the denary logarithm of strain rates; (D) the linear fitting of the averaged failure stress versus the denary logarithm of strain rates (error bars at each data point represent the standard deviations).
The variation of the averaged characteristic stresses with the logarithm of strain rates at each level of strain rates was shown in Figure 6B. In the quasi-static strain rates ranging from 10–6 s−1 to 10–2 s−1, a linear relation can be expressed between the averaged characteristic stresses and the logarithm of strain rates, as illustrated in Figure 6B and Table 3. It can be seen that the damage stress and the uniaxial compressive strength both show a strong linear correlation with strain rates, and their mean values increase by approximately 32.79 and 50.49 MPa, respectively, as the strain rate rises from 10–6 s−1 to 10–2 s−1. However, the crack initiation stress presents a weak linear correlation with the logarithm of strain rates, and the correlation coefficient is only 76%, whereas the corresponding values for the damage stress and the uniaxial compressive strength are 85 and 96%, respectively. Furthermore, the averaged values of the crack initiation stress only increased from 76.52 to 76.76 MPa as the strain rate rises from 10–6 s−1 to 10–2 s−1, indicating that the strain rate had a minimal effect on the crack initiation stress within the spectrum of quasi-static strain rates. The definition of crack initiation stress is that the stress corresponds to the time when the micro-cracks begin to initiate, so this stress can reflect the condition of native defects or micro-cracks in rock. Consequently, the intrinsic properties of rock may have a greater impact on the crack initiation stress than external factors, such as the strain rate.
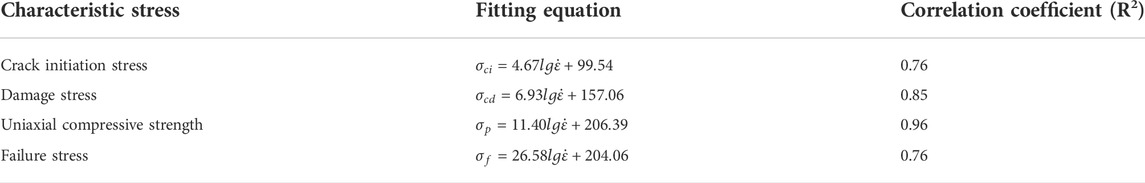
TABLE 3. Fitting equations of characteristic stresses with the logarithm of strain rates.
Figure 6C depicted the ratio of characteristic stresses to the denary logarithm of strain rates. It can be observed that, with the increase of the strain rates, the characteristic stress ratios neither exhibit a linear increase like the characteristic stresses, nor a clear downward trend, but instead fluctuate up and down a value, with σci/σp, σci/σcd and σcd/σp having values of 0.48, 0.60, and 0.80, respectively. This indicates that the strain rate has a significant effect on the magnitude of the values of characteristic stresses but a negligible effect on the ratios. Thus, it can be inferred that the ratio of characteristic stresses can be used to characterize the fundamental mode of rock deformation since strain rate does not change the mode when rock is under quasi-static compression, just like the shape of the stress-strain curves. In addition, the optimum option is the ratio between damage stress and uniaxial compressive strength if selecting one of those ratios to characterize the mode of rock deformation, because the deviation of σcd/σp is less than that of the other two ratios.
Figure 6D depicted the relationship between the averaged values of failure stress and the logarithm of strain rates. It can be seen that the averaged failure stress shows a certain rate of sensitivity, and as the strain rate increases, the averaged failure stress also increases. The reason for this increasing trend can be attributed to the differnce in crack propogation speeds at various strain rates. Rock deformation will enter the post-peak stage once the external force exceeds its uniaxial compressive strength, as shown in Figure 5A. At this stage, the macroscopic fracture plane of rock is forming, resulting in the instability of elastic strain energy stored in rock. The higher the loading strain rate, the faster the crack propagation speed (Alneasan and Behnia, 2021), and thus, the formation speed of rock’s fracture plane increases as strain rates rise. This implies that the time between the UCS point and the failure point decreases as strain rates increase, which is supported by experimental results: the time for 10−6 s−1 is 109.33 s, whereas the time for 10−2 s−1 is only 0.013 s. As a result, the stress drop between the UCS point and the failure point of rock decreases as the time between these two points decreases, causing the failure stress to increase as strain rates increase. On the other hand, the increase of failure stress as strain rates increase exhibits greater dispersion than the increase in damage stress or uniaxial compressive strength. The reason for this variation is that once the loading process exceeds the UCS point, the state of rock samples becomes unstable. In this condition, the overall failure of rock may occur at any time due to a minute change in external conditions or the coalescence of internal cracks. It is therefore reasonably straightforward to predict the mechanical characteristics before the UCS point when rock samples are subjected to quasi-static compression, whereas it is difficult and quite random to predict rock failure.
3.3 Energy conversion characteristics in the process of rock deformation and failure
The energy in the process of rock deformation and failure consists of three parts: input energy, elastic strain energy and dissipated energy. According to the first law of thermodynamics, the relationship between these three parts is shown in Eq. 1 and Figure 7:
Where U is the input energy; Ue is the elastic energy; Ud is the dissipated energy.
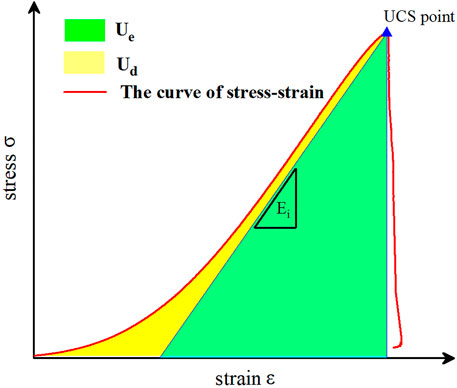
FIGURE 7. The relationship between elastic strain energy and dissipated energy.
The value of input energy can be calculated under uniaxial compression using Eq. 2 (Solecki and Conant, 2003). Combining Eqs 3, 4, the value of elastic strain energy can be expressed as the middle part of Eq. 4. Due to the fact that there is little difference between the unloading elastic modulus and the loading modulus of rock under unxiaxial compression, Ei in the middle part of Eq. 4 can be replaced by E (David et al., 2020). Thus, the elastic strain energy of rock can be calculated by the right part of Eq. 4. The dissipated energy can be expressed as Eq. 6:
Where σ and ε are the stress and strain, respectively; εe is the total elastic strain; Ei is the unloading modulus; E is the loading modulus, as illustrated in Figure 7.
The energy values at the crack initiation stress point, damage stress point, UCS point and failure stress point were determined using the method described above, as shown in Table 4. Figure 8 depicted the energy values at various characteristic stress points in relation to the denary logarithm of strain rates. The results indicate that as strain rates increase, the variations of input energy, elastic strain energy and dissipation energy are drastically different at various characteristic stress points. The values of input energy and elastic strain energy at the crack initiation stress point greatly fluctuate as stain rates increase and essentially do not exhibit any rate-dependence, as shown in Figure 8A. However, the variation of input energy and elastic strain energy at the damage stress point and UCS point exhibit a positive correlation with the logarithm of strain rates when the strain rate exceeds 10–5 s−1, as shown in Figures 8B,C. The dissipated energy prior to the UCS point varies little with the increase of strain rates, and the values at the crack initiation stress point, damage stress point and UCS point are significantly less than the corresponding values of elastic energy. A hypothesis can be derived from the analysis presented above: the values of elastic strain energy are substantially greater than the dissipated energy prior to the UCS point, indicating that elastic strain energy may govern the deformation process of rock before the UCS point, which may be the primary reason for brittle deformation of granite. The input energy and elastic strain energy at the failure stress point continue to exhibit a positive correlation with the logarithm of strain rates, similar to the trend at the damage stress point and UCS point, whereas the variation in the dissipated energy is completely different from the previous trend, as shown in Figure 8D. This difference is reflected in two aspects: First, the values of the dissipated energy at various strain rates are 2–14 times greater than the dissipated energy at the crack initiation stress point, damage stress point and UCS point; second, the dissipated energy increases as strain rates increase when the strain rate is less than 5 × 10⁻⁵ s−1 and reaches its maximum at this strain rate. Then, the value of the dissipated energy greatly fluctuates as stain rates increase and essentially shows no rate dependence once the strain rate exceeds 5 × 10⁻⁵ s−1.
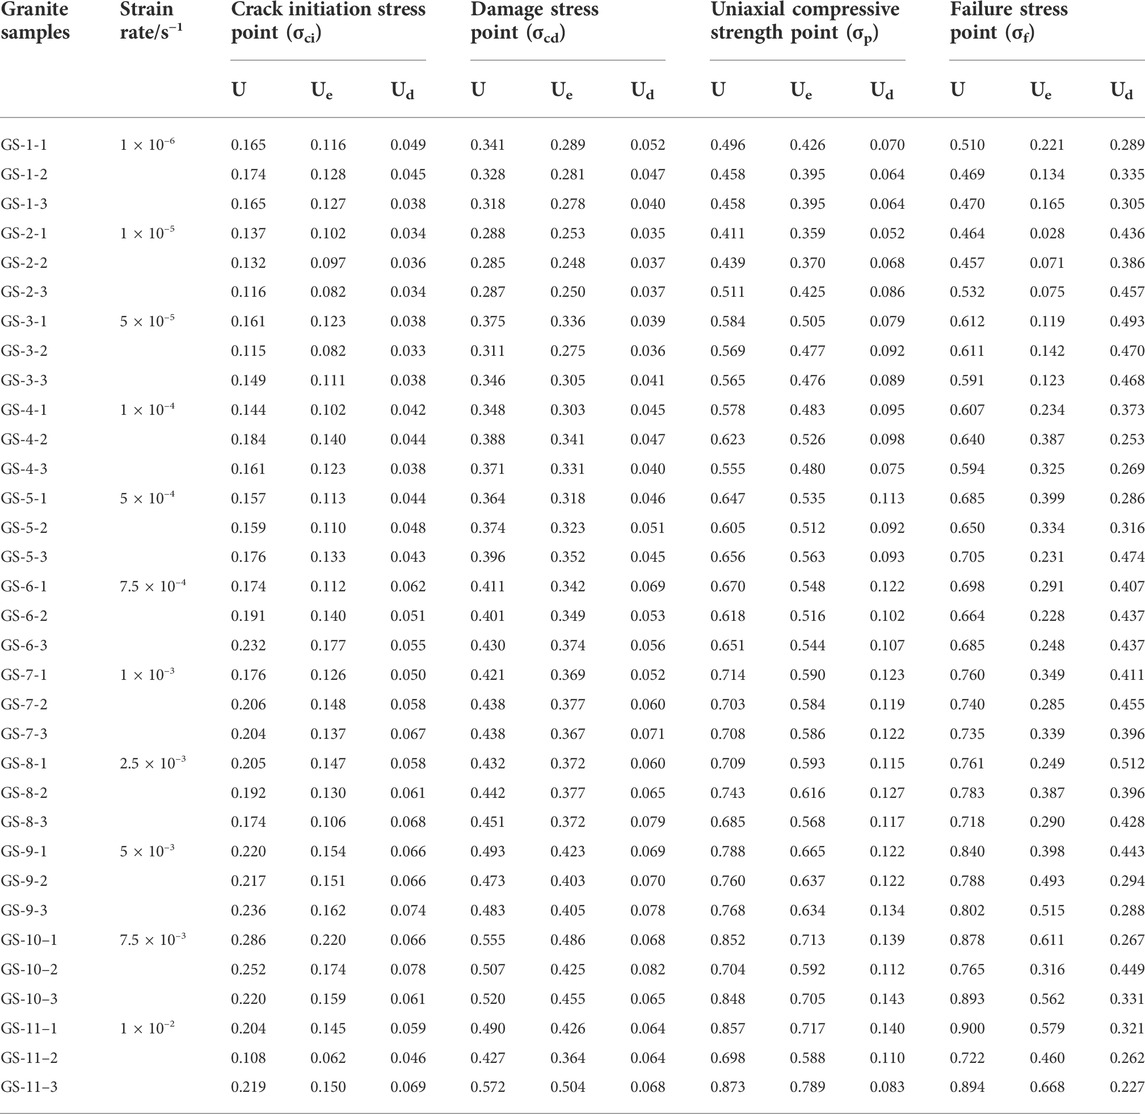
TABLE 4. The energy values at different stress points (enery unit: J/cm3).
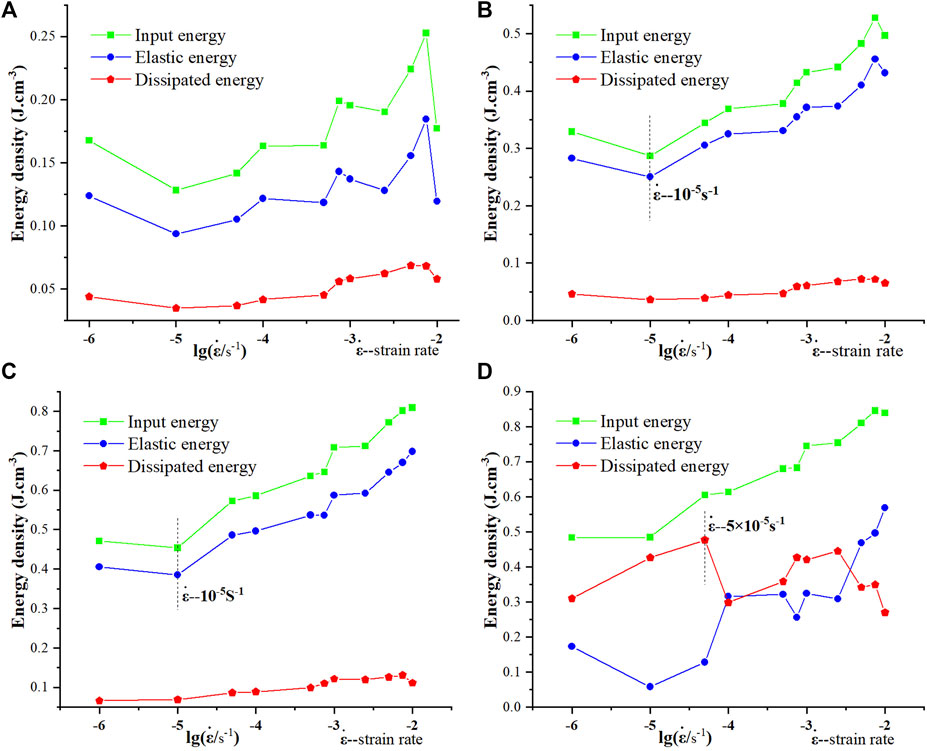
FIGURE 8. The energy values at different characteristic stress points versus the denary logarithm of strain rates. (A) Crack initiation stress; (B) damage stress; (C) uniaxial compressive strength; (D) failure stress.
The input energy generated by work performed by an external force is primarily converted into two components: elastic strain energy stored in rock and dissipated energy through crack initiation, crack propagation, friction heat, etc. Thus, the faster the external force is applied, or the higher the strain rate, the input energy is greater. Figure 9 depicted the relationship between input energy and elastic strain energy at different characteristic stress points. The relationship between input energy and elastic strain energy can be fitted by the linear equation, as depicted by the red lines in Figure 9, and the correlation coefficients of linear equations for the crack initiation stress point, damage stress point and UCS point are 0.94, 0.99, and 0.98, respectively, indicating a strong linear correlation between input energy and elastic strain energy. The slope of the linear equations in Figure 9 is 0.74, 0.84, and 0.83, respectively, representing the ratios of energy conversion between input energy and ealstic strain erergy (Gong et al., 2019a; Gong et al., 2019b). Based on this, energy conversion ratio was defined, and in Figure 10, Ka, Kb, and Kc represent the respective ratios at different characteristic stress points. As shown in Figure 10, the energy conversion ratio at stage III increased from 0.74 to 0.84, despite the fact that this stage may dissipate more input energy than the ealstic stage. More energy is dissipated at stage IV due to the crack propagation and coalescence, resulting in the energy conversion ratio decreasing from 0.84 to 0.83, but the decline is only 1.1%, indicating that unstable crack growth does not alter the primary mode of energy conversion. Therefore, it can be concluded that, although the energy conversion ratios differ prior to the UCS point, the values are all greater than 0.74 and that the input energy is primarily stored as elastic strain energy in rock during the pre-peak stage. When the stress exceeds the UCS point of rock, its deformation enters into the post-peak stage, and the dissipated energy increases sharply due to the formation of the macro-fracture surface, as shown in Figure 8D. The dissipated energy at the strain rate level of 5 × 10⁻⁵ s−1 even increased 13.12 times, 12.37 times and 5.54 times, respectively, than the dissipated energy at the crack initiaiton stress point, damage stress point and UCS point, indicating that the primary characteristic of energy conversion during the post-peak stage is the dissipated energy transferred from the elastic strain energy stored in rock. Nonetheless, this stage only lasts a brief period, and its duration decreases as the strain rate increases. Finally, the elastic strain energy stored in rock is abruptly released when rock fails, accompanied by the ejection of rock fragments and loud noises. Based on the analysis of energy conversion features at different deforamtion stages, it can be concluded that the energy conversion process of rock under quasi-static compression can be divided into three stages: energy accumulation, energy dissipation, and energy release, respectively, as shown in Figure 10, which differs from other rock types, such as mudstone (Zhang et al., 2020), sandstone (Zhao H. et al., 2021).
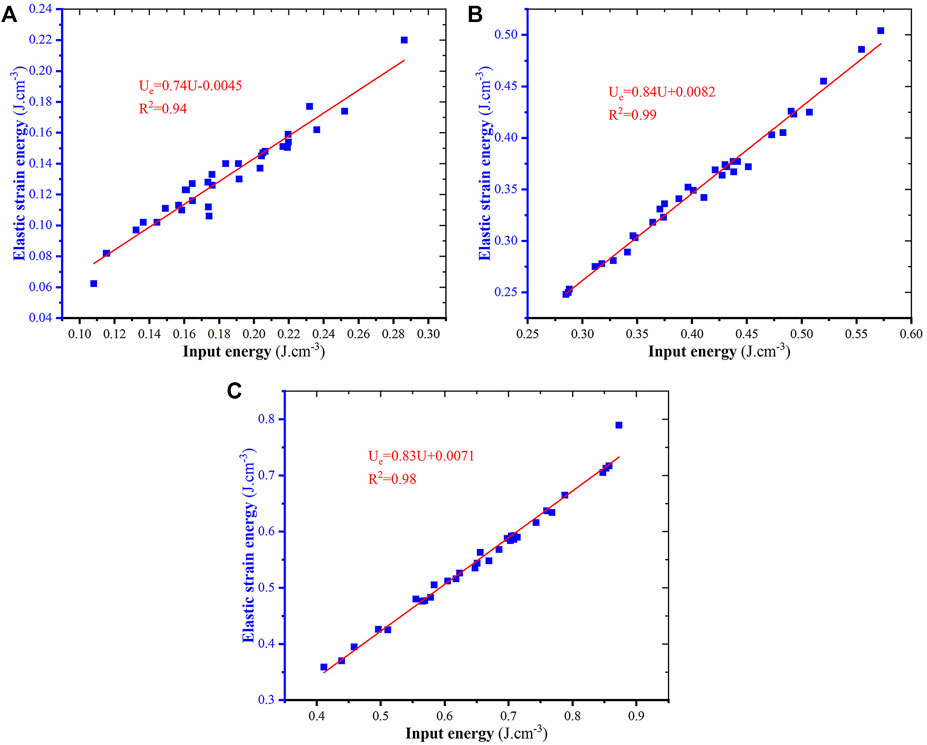
FIGURE 9. The relationship between the input energy and elastic strain energy at different characteristic stress points (A) crack initiation stress; (B) damage stress; (C) uniaxial compressive strength.
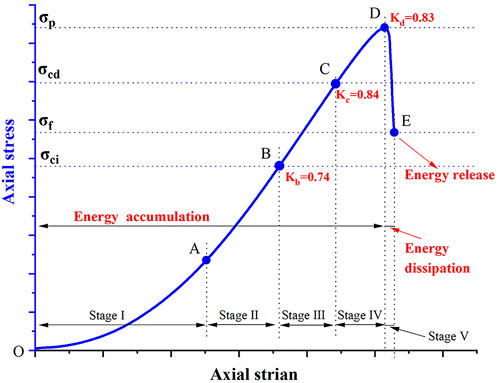
FIGURE 10. The typical stress-strain curve of granite: stage I (OA)—crack closure stage; stage II (AB)—elastic stage; stage III (BC)—stable crack growth stage; stage Ⅳ (CD)—unstable crack growth stage; stage Ⅴ (ED)—post-peak stage.
3.4 Acoustic emission properties
Rock deformation and failure are always accompanied by the release of strain energy in the form of elastic waves, which is referred to as acoustic emission (Meng et al., 2016). With five different strain rates as represented strain rates, as depicted in Figure 11, it is evident that the AE energy rate around different characteristic stress points varies significantly. The values of the AE energy rate around the crack initiaiton stress point and damage stress point are in the tens to hundreds when strain rates range from 10−6-10–3 s−1, as depicted by the enlarged figures in Figures 11A–D. However, the value around the UCS point is three to four orders of magnitude greater than the above two characteristic stress points, increasing to hundreds of thousands or even millions, indicating the number and magnitude of AE events occurred around the crack initiation stress and damage stress ponit being greatly lower than that around the UCS point. There is a strong correlation between AE activity and the process of crack development (Sirdesai et al., 2018). Thus, this difference implies that the internal damage caused by crack propagation and crack coalescence occurs primarily near the UCS point, reflecting the brittle characteristics of granite deformation and failure. In addition, there is an obvious increase of AE energy rate around the crack initiation stress point and damage stress point when the strain rate is 10–2 s−1, as depicted by the enlarged figures in Figure 11E, indicating that the AE events or magnitudes resulting from the cracking development are beginning to increase. Nonetheless, as the strain rate is 10–2 s−1, the maximum value of AE energy rate around the UCS point is roughly dozens of times greater than that around the crack initiation stress point and damage stress point. This means that when the strain rate increase from 10–6 to 10–2 s−1, the mode of crack development does not fundamentally change.
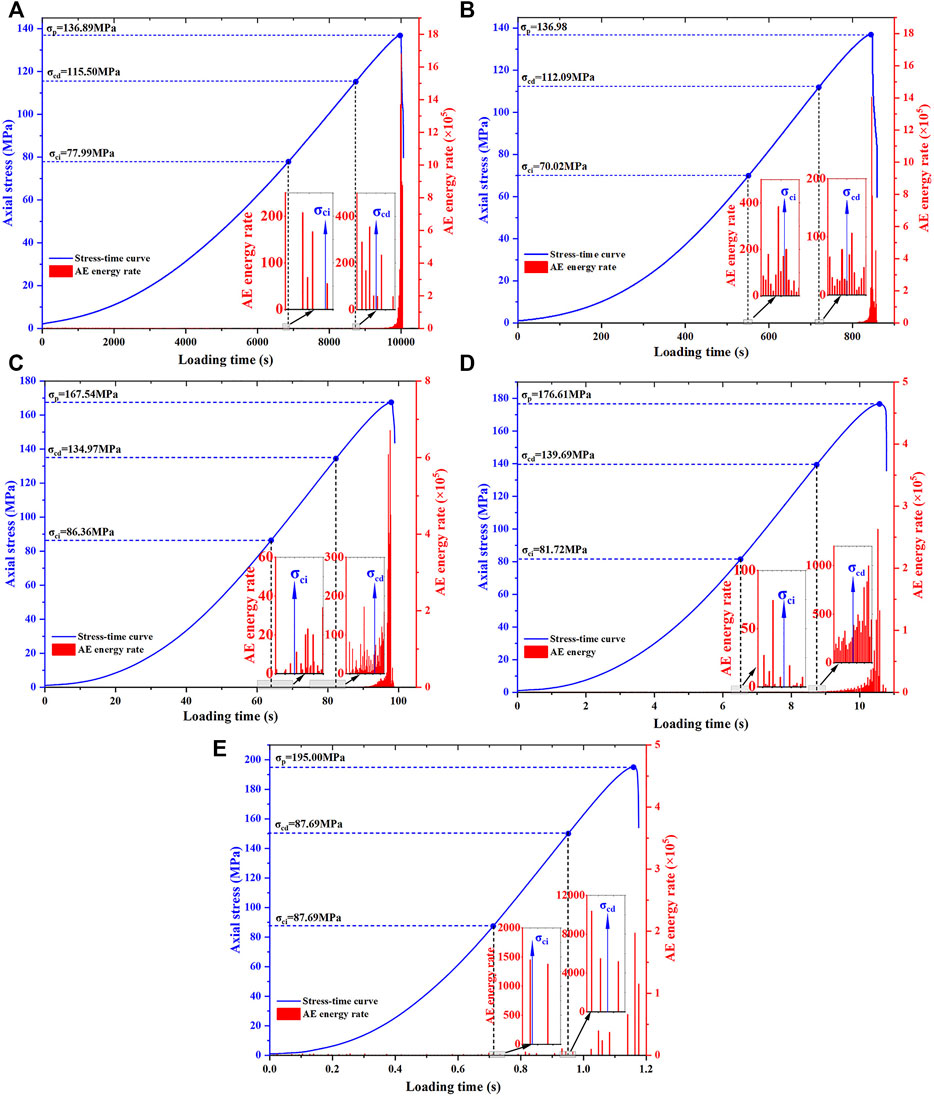
FIGURE 11. AE energy rate and stress versus loading time under different strain rates. (A) 1 × 10⁻⁶ s−1; (B) 1 × 10⁻⁵ s−1; (C) 1 × 10⁻⁴ s−1; (D) 1 × 10⁻³ s−1; (E) 1 × 10⁻² s−1.
Figure 12 depicted the spatial location and energy intensity of AE events at different deformation stages and strain rates. It can be observed that the number of the located AE events varies significantly under various strain rates or at different deformation stages. Table 5 depicted the statistical results from Figure 12. There is a great difference in the total number of the located AE events between 10–6 s−1 and 10–5 s−1, but energy rate varies little between 10–6 s−1 and 10–5 s−1, as shown in Figures 11A,B. This difference can be explained by the AE location principle. In order to confirm the spatial location of an AE event, at least four sensors in different positions that can receive the AE signal are necessary to determine the event’s three-dimensional coordinates and arrival time. Consequently, the AE events with a low magnitude may lack sufficient energy to propagate over a greater distance, preventing them from being received by more than four sensors and preventing the AE monitoring system from locating them. Based on the above principle, it is concluded that the number of low-magnitude AE events of 10–6 s−1 is greater than that of 10–5 s−1, and this quantitative variation may be indicative of a transition from 10–6 s−1 to 10–5 s−1 in the rock’s microscopy failure pattern. The total number of the located AE events decreases as strain rates increase when the strain rate exceeds 10–5 s−1. It is noted that when the strain rate exceeds 7.5 × 10⁻³ s−1, the number of the located AE events is less than 10. This variation may be due to the high loading strain rate and the limitation of the AE sensors’ resonant frequency. The loading time is only 2.22 and 1.17 s, corresponding to 7.5 × 10⁻³ s−1 and 10–2 s−1, respectively, and the resonant frequency of AE sensors is 300 kHz. Even though a large number of AE events can occur in a short period of time, the acquisition mode of the AE sensor is time-triggered and it takes a certain amount of time to receive an AE signal. This means that AE monitoring system can only receive the limited number of AE signal during the given time period. In addition, more than four sensors must receive the signal simultaneously for an AE event to be located, which further increases the difficulty of determining the spatial location of an AE event under high strain rate loading. Obviously, the solution to this issue is to use a more sensitive AE sensor, which is also the direction of future research. It is also possible to conclude that 10–5 s−1 is the optimal strain rate for acoustic emission testing of granite samples, given that the number of the located AE events is greatest for this strain rate in the range of 10–6 s−1 to 10–2 s−1. In comparison to the difference in the number of the located AE events at different deformation stages, it is found that the majority of located AE events occur during the unstable crack growth stage and prior to the crack initiation stress. In general, almost no AE activity is present during the elastic stage. Thus, it can be concluded that the majority of located AE events occur during the crack closure stage and unstable crack growth stage. The AE events during the crack closure stage are frictional AE caused by the closure of original cracks and friction between the particles of rock, where the AE events during the unstable crack growth stage are cracking AE produced by the new failure extension or dislocation (Wang X. et al., 2011).
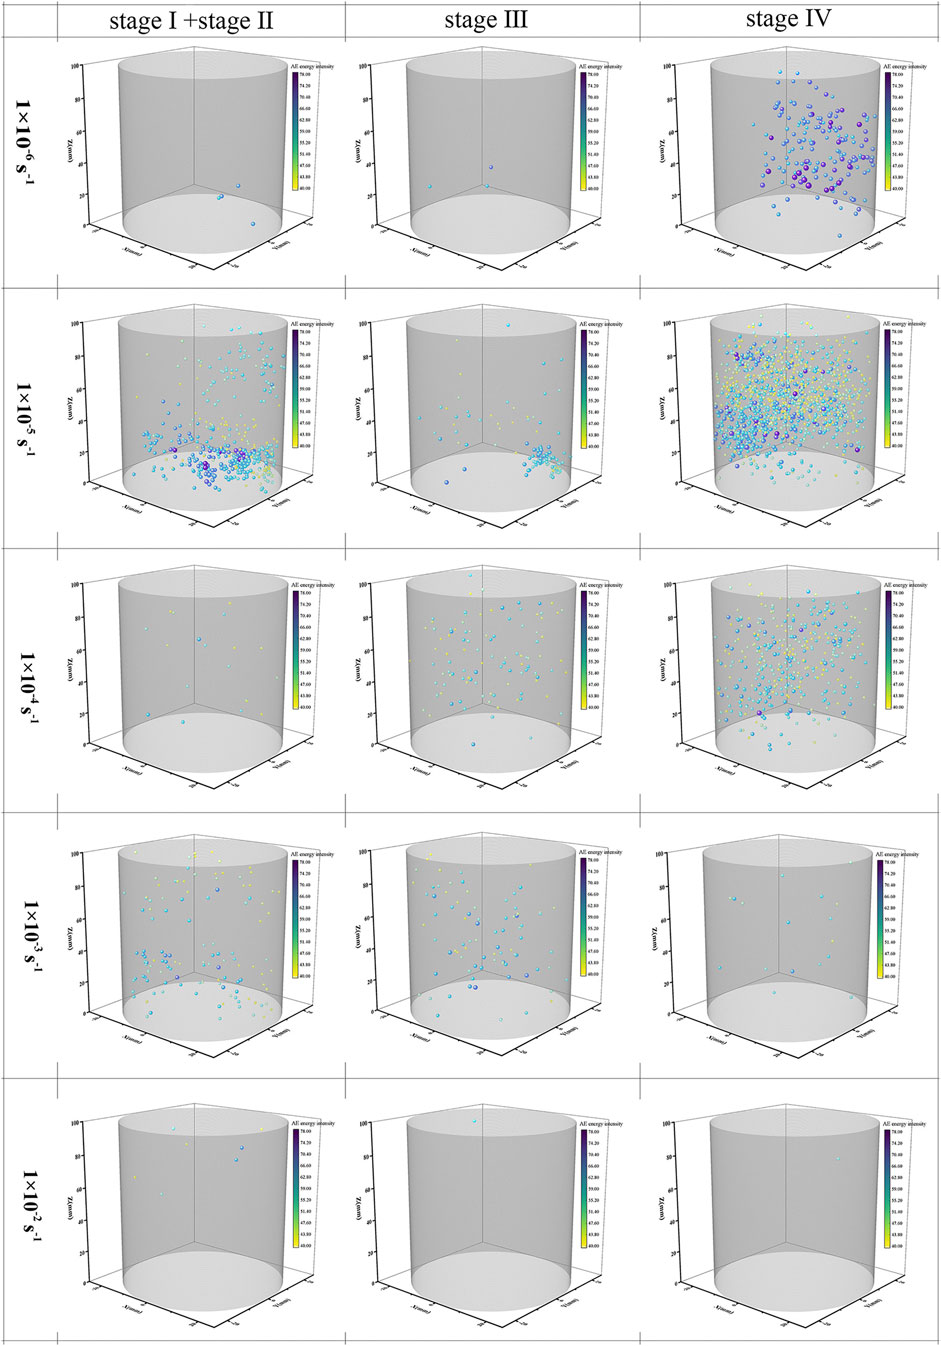
FIGURE 12. Spatial distribution and energy intensity of the located AE events at different deformation stages under various strain rates: stage Ⅰ– crack closure; stage Ⅱ– elastic stage; stage Ⅲ– stable crack growth; stage Ⅳ– unstable crack growth.
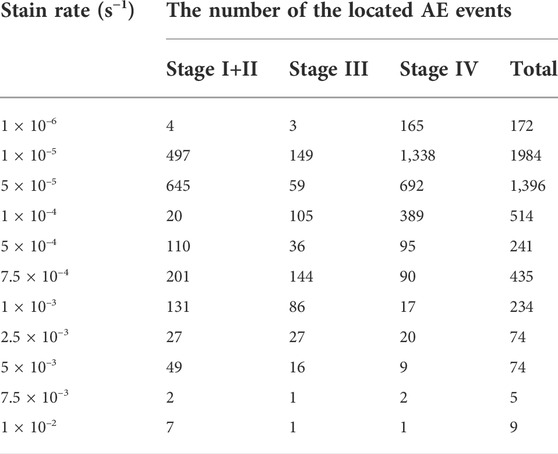
TABLE 5. The number of the located AE events at different deformation stages and various strain rates before the UCS point.
4 Discussion
The preceding analysis of experimental results suggests that characteristic stresses exhibited a positive correlation with strain rates, with this correlation being relatively high for damage stress and uniaxial compressive strength, but relatively low for crack initiation stress. There are several explanations for this increasing trend, such as the thermal reactivation effect (Qi et al., 2009), the micromechanics-based effect (Zhang and Zhao, 2014), the Stefan effect (Rossi, 1991), energy dissipation (Pan, 2017) and the inertia effect (Ožbolt et al., 2011). These perspectives revealed the mechanisms of the rock’s rate effect to some extent, whereas we argue the explanation for why the characteristic stresses of rock increase with increasing strain rates should depend on the rock’s intrinsic properties and the perspective of energy conversion.
Figure 13 depicted the relationship between characteristic stresses and input energy. The correlation coefficients for the linear positive relationship between three kind of characteristic stresses and their corresponding input energy are 0.91, 0.93, and 0.97, respectively, indicating that there is a strong positive correlation between characteristic stress and input energy. This relationship allows us to explain the strain rate effects of characteristic stresses through energy conversion between input energy and elastic strain energy. In general, a portion of the input energy is dissipated by crack initiation, crack propagation, and crack coalescence, while the remaining portion of the input energy is stored in rock as elastic strain energy. Consequently, the variation in the dissipated energy and elastic strain energy transferred from input energy correlate strongly with the increase of characteristic stresses. In addition, it is interesting to note that the intercept of the Y axis of the fitting equation in Figure 13C is 78.26 MPa, which is the corresponding uniaxial compressive strength when the input energy is zero. This value may be the intrinsic strength of rock.
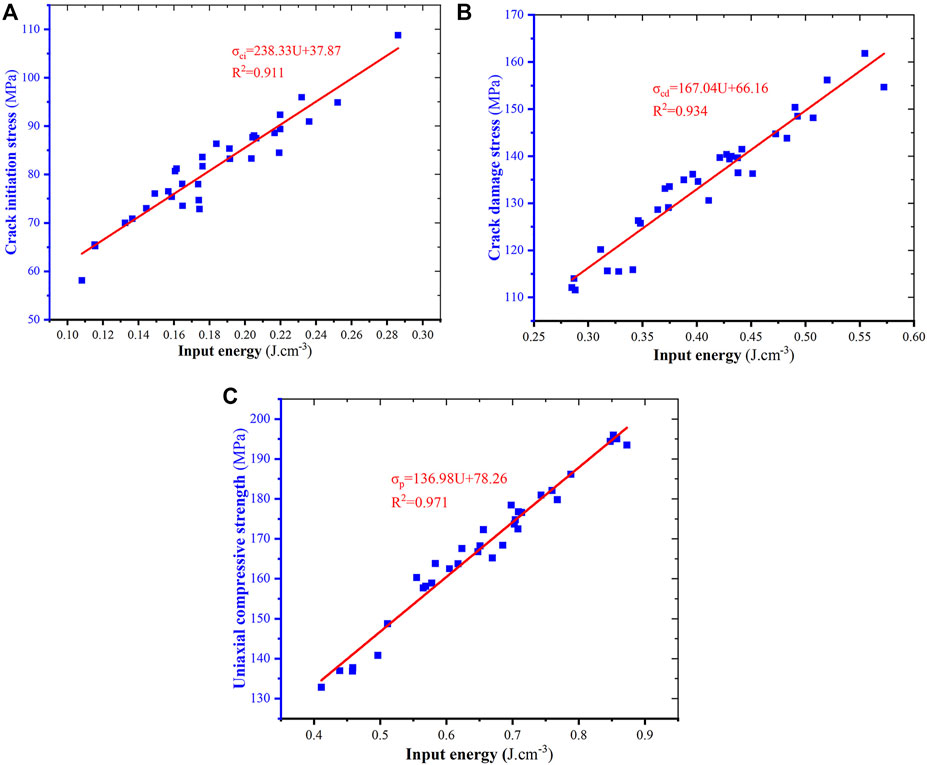
FIGURE 13. The relationship between the characteristic stresses and input energy. (A) Crack initiation stress; (B) damage stress; (C) uniaxial compressive strength.
Figure 14 shows the relationship between uniaxial compressive strength, the cumulative AE energy prior to the UCS point and strain rates. Contrary to the variation trend of rock’s uniaxial compressive strength, the cumulative AE energy has a negative correlation with the logarithm of strain rates. The cumulative AE energy can indicate the damage degree of rock (Meng et al., 2016). As strain rates increase, the damage degree of rock decreases, indicating that the dissipated energy also decreases indirectly. Considering the discussion of the preceding paragraph, it can be determined that, as the strain rate increases, a greater proportion of the input energy is transferred primarily into the elastic strain energy, which is the main reason for the increase in characteristic stresses.
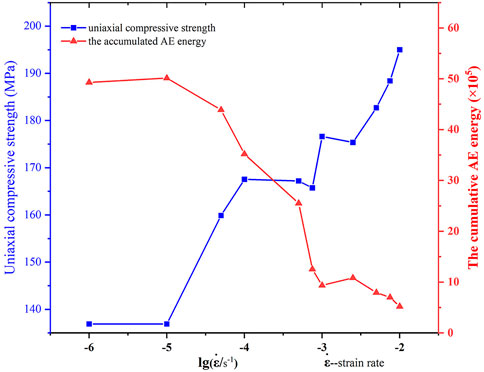
FIGURE 14. The averaged values of uniaxial compressive strength and the cumulative AE energy prior to the UCS point versus the denary logarithm of strain rates.
It is commonly known that rock is a type of heterogeneous material, consisting of mineral grains of various sizes and multi-scale defects. In fact, the size of rock defects extends from a few nanometers to thousands of kilometers with a strong hierarchy if the crust is considered a specific type of rock. Table 6 depicted the range in size of rock defects in rock mechanics and rock engineering, from a few microns to several hundred meters (Feng and Zhao, 2008). Consequently, when rock is compressed at varying strain rates, its defects on different scales are activated, and the interaction of these defects determines rock deformation and failure. The overall stress state of rock is relatively uniform under the lower strain rate loading, and the area harboring native defects on a large scale begins to crack once the stress exceeds its strength limit. Based on the principle of minimal dissipative energy, as the external load slowly increases, the cracks will preferentially propagate to the sections with the weakest structure in rock, such as native fissures, mineral boundaries, etc. These defects then join to form a macro-fracture surface, resulting in the loss of the rock’s bearing capacity, as shown in Figure 15A. The accumulated elastic stain energy is dissipated during the process of crack development, resulting in a drop of the elastic strain energy stored in rock and a decrease in the values of the characteristic stresses. In contrast, due to the rapid rise in input energy, the cumulative elastic strain energy increases when the rock is compressed at a higher strain rate. As a result, the accumulated elastic strain energy at the extremities of some cracks, such as the point a and b in Figure 15B, grows dramatically. In addition to guaranteeing the consumption of crack propagation along the path II and the path IV, residual energy remains, but it may be insufficient to initiate cracks on a small scale because the energy required to initiate a small crack is significantly greater than that required to initiate a large crack. Therefore, the elastic strain energy continues to accumulate at these two points until it reaches the threshold energy required to initiate the small-scale cracks and then propagate it down the path I and path III, as shown in Figure 15B. Prior to that, the accumulated energy has to be transferred from the external load through continuous work, resulting in a rise in the corresponding characteristic stresses. Some studies can attest to the validity of the preceding explanation. Kipp et al. (1980) found that smaller cracks get activated as strain rate increases, resulting in an increase in the material’s ultimate strength. Liang C. Y. et al. (2015) discovered that uniaxial compressive strength of rock decreased with an increase in the ratio between the height and radius of cylindrical samples at various strain rates. In general, the size of rock samples increases as the ratio increases. This indicates that these samples may contain more large-scale defects than small-size samples. Therefore, the large-scale defect is easier to be initiated than the smalle-scale defect under uniaxial compression, causing the uniaxial strength of the large-size samples to be lower than that of the small-size samples.

TABLE 6. Scale distribution of rock defects.
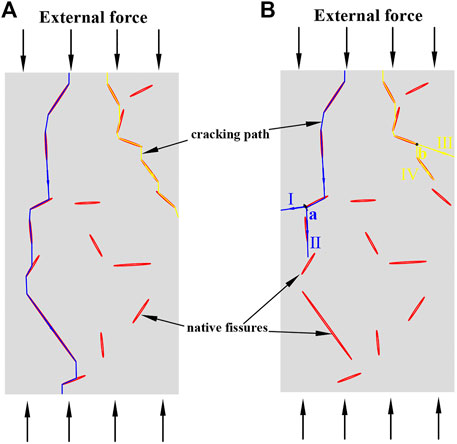
FIGURE 15. The schematic diagram of the cracking process in rock under different strain rates. (A) Lower strain rate; (B) higher strain rate.
In a word, rock is a special material with multi-scale defects, and the threshold energy required to activate the defect varies depending on the scale of the defects. In general, the smaller the scale of cracks, the higher the threshold energy for crack initiation. Therefore, due to the difficulty in initiating small-scale cracks, the elastic strain energy transferred from input energy increases as strain rates increase within the range of quasi-static strain rates, resulting in an increase in the values of the associated characteristic stresses.
5 Conclusion
In this paper, uniaxial compressive tests of various strain rates within quasi-static strain rates of 10–6 s−1–10–2 s−1 were carried out using a rock material testing system and a multi-channel acoustic emission monitoring system. The stress-strain curves of rock samples, characteristic stresses, energy data, and temporal and spatial distribution of AE signals were analyzed. According to the experimental results, the following conclusions can be drawn:
1 The characteristic stresses of rock samples, including crack initiation stress, damage stress, uniaxial compressive strength and failure stress, increase as strain rates increase. The relationship between characteristic stresses and the logarithm of strain rates can be described by linear equations with respective correlation coefficients of 0.76, 0.85, 0.96, and 0.76. In addition, the ratios of characteristic stresses are 0.48, 0.60, and 0.80, respectively, and essentially do not vary when strain rates increase. The ratios can therefore be used to characterize the fundamental mode of rock deformation, as the loading of various strain rates cannot change the mode when rock is under quasi-static compression.
2 As strain rates increase, the variations of input energy, elastic strain energy and dissipation energy are drastically different at various characteristic stress points. The input energy and elastic strain energy at the damage point, UCS point and failure stress point exhibit a linearly positive correlation with the logarithm of strain rates when the strain rate exceeds 10–5 s−1, whereas the dissipated energy prior to the UCS point varies little with the increase of strain rates. The input energy is converted primarily into elastic strain energy stored in rock during the pre-peak stage, and the ratios of energy conversion between input energy and elastic strain energy corresponding to the crack initiation stress point, damage stress point and UCS point, are 0.74, 0.84, and 0.83, respectively. However, the primary characteristic of energy conversion during the post-peak stage is the dissipated energy transferred from the elastic strain energy stored in rock, and the elastic strain energy stored in rock is abruptly released when rock fails. Based on those, the energy conversion process of rock under quasi-static compression can be divided into three stages: energy accumulation, energy dissipation, and energy release, respectively.
3 AE energy rate around different characteristic stress points varies significantly. This difference can be summarized as follows: the AE energy rate around the UCS point is considerably greater than the AE energy rate around the crack initiation stress point or damage stress point, and this relationship does not change as strain rates increase. The total number of the located AE events decreases as strain rates increase when the strain rate exceeds 10–5 s−1, and the majority of the located AE events occur during the crack closure stage and the unstable crack growth stage. Besides, 10–5 s−1 may be the optimal strain rate for acoustic emission testing of granite samples, given that the number of the located AE events is greatest for this strain rate in the range of 10–6 s−1 to 10–2 s−1.
4 It is certified that there is a strong linearly positive correlation between input energy and characteristic stresses. Consequently, based on the perspective of energy conversion and the structural properties of multi-scale defects in rock, the mechanism of the increase of characteristic stresses with the increase of strain rates was proposed: that is, when rock is subjected to a lower strain rate, native defects on a large scale are initially activated and then propagate toward the weak section of rock, resulting in a decrease in the elastic strain energy stored in rock and a reduction in characteristic stress values. Nonetheless, the cumulative elastic strain energy increases when the rock is compressed at a higher strain rate, so it is able to initiate more small-scale defects, which necessitates more input energy from the external load via continuous work and causes an increase in the associated characteristic stresses.
Data availability statement
The original contributions presented in the study are included in the article/Supplementary Material, further inquiries can be directed to the corresponding author.
Author contributions
SW contributed to the conception of the study; LL performed the experiment and data analysis; SW and LL contributed significantly to analysis and manuscript preparation; LL wrote the first draft of the manuscript; SW provided the thought of discussion; WY performed the AE data analysis and guided the AE tests; All authors contributed to manuscript revision, read, and approved the submitted version.
Funding
This work was supported by the Opening Fund of State Key Laboratory of Geohazard Prevention and Geoenvironment Protection (Chengdu University of Technology) No. SKLGP2016K001.
Conflict of interest
The authors declare that the research was conducted in the absence of any commercial or financial relationships that could be construed as a potential conflict of interest.
Publisher’s note
All claims expressed in this article are solely those of the authors and do not necessarily represent those of their affiliated organizations, or those of the publisher, the editors and the reviewers. Any product that may be evaluated in this article, or claim that may be made by its manufacturer, is not guaranteed or endorsed by the publisher.
References
Alneasan, M., and Behnia, M. (2021). Strain rate effects on the crack propagation speed under different loading modes (I, II and I/II): Experimental investigations. Eng. Fract. Mech. 258, 108118. doi:10.1016/j.engfracmech.2021.108118
Bieniawski, Z. T. (1967). Mechanism of brittle fracture of rock: Parts I-theory of the fracture process. Int. J. Rock Mech. Min. Sci. Geomechanics Abstr. 4 (4), 395–406. doi:10.1016/0148-9062(67)90030-7
Brace, W., and Jones, A. (1971). Comparison of uniaxial deformation in shock and static loading of three rocks. J. Geophys. Res. 76 (20), 4913–4921. doi:10.1029/JB076i020p04913
Brace, W., Paulding, B., and Scholz, C. (1966). Dilatancy in the fracture of crystalline rocks. J. Geophys. Res. 71 (16), 3939–3953. doi:10.1029/JZ071i016p03939
Cai, M., Morioka, H., Kaiser, P., Tasaka, Y., Kurose, H., Minami, M., et al. (2007). Back-analysis of rock mass strength parameters using AE monitoring data. Int. J. Rock Mech. Min. Sci. 44 (4), 538–549. doi:10.1016/j.ijrmms.2006.09.012
David, E. C., Brantut, N., and Hirth, G. (2020). Sliding crack model for nonlinearity and hysteresis in the triaxial stress-strain curve of rock, and application to antigorite deformation. J. Geophys. Res. Solid Earth 125 (10), e2019JB018970. doi:10.1029/2019JB018970
Feng, Z., and Zhao, Y. (2008). Control effect of fissure scale on deformamtion and failure of rock mass. Chin. J. Rock Mech. Eng. 27 (1), 78–83. (in Chinese).
Gong, F., Yan, J., Li, X., and Luo, S. (2019a). A peak-strength strain energy storage index for rock burst proneness of rock materials. Int. J. Rock Mech. Min. Sci. 117, 76–89. doi:10.1016/j.ijrmms.2019.03.020
Gong, F., Yan, J., Luo, S., and Li, X. (2019b). Investigation on the linear energy storage and dissipation laws of rock materials under uniaxial compression. Rock Mech. Rock Eng. 52 (11), 4237–4255. doi:10.1007/s00603-019-01842-4
Hoek, E., and Bieniawski, Z. (1965). Brittle fracture propagation in rock under compression. Int. J. Fract. 1 (3), 137–155. doi:10.1007/BF00186851
Hokka, M., Black, J., Tkalich, D., Fourmeau, M., Kane, A., Hoang, N. H., et al. (2016). Effects of strain rate and confining pressure on the compressive behavior of Kuru granite. Int. J. Impact Eng. 91, 183–193. doi:10.1016/j.ijimpeng.2016.01.010
Jaczkowski, E. L. (2018). Laboratory strength testing of argillaceous limestone under varying saturation, scale, loading rate, and confinement conditions. Kingston: Dissertation thesis, Queen's University.
Kipp, M., Grady, D., and Chen, E. (1980). Strain-rate dependent fracture initiation. Int. J. Fract. 16 (5), 471–478. doi:10.1007/BF00016585
Kovari, K., Tisa, A., and Einstein, H. (1983). Suggested methods for determining the strength of rock materials in triaxial compression: revised version. Int. J. Rock Mech. Min. Sci. 20 (6), 283–290. doi:10.1016/0148-9062(83)90598-3
Lajtai, E. Z., Duncan, E., and Carter, B. (1991). The effect of strain rate on rock strength. Rock Mech. Rock Eng. 24 (2), 99–109. doi:10.1007/BF01032501
Lei, X., Kusunose, K., Rao, M., Nishizawa, O., and Satoh, T. (2000). Quasi‐static fault growth and cracking in homogeneous brittle rock under triaxial compression using acoustic emission monitoring. J. Geophys. Res. 105 (B3), 6127–6139. doi:10.1029/1999JB900385
Li, H., Zhao, J., and Li, T. (1999). Triaxial compression tests on a granite at different strain rates and confining pressures. Int. J. Rock Mech. Min. Sci. 36 (8), 1057–1063. doi:10.1016/S1365-1609(99)00120-3
Li, X., Li, H., Liu, L., Liu, Y., Ju, M., and Zhao, J. (2020). Investigating the crack initiation and propagation mechanism in brittle rocks using grain-based finite-discrete element method. Int. J. Rock Mech. Min. Sci. 127, 104219. doi:10.1016/j.ijrmms.2020.104219
Li, X., Lok, T., and Zhao, J. (2005). Dynamic characteristics of granite subjected to intermediate loading rate. Rock Mech. Rock Eng. 38 (1), 21–39. doi:10.1007/s00603-004-0030-7
Li, Y., Huang, D., and Li, X. a. (2014). Strain rate dependency of coarse crystal marble under uniaxial compression: strength, deformation and strain energy. Rock Mech. Rock Eng. 47 (4), 1153–1164. doi:10.1007/s00603-013-0472-x
Liang, C., Wu, S., Li, X., and Xin, P. (2015a). Effects of strain rate on fracture characteristics and mesoscopic failure mechanisms of granite. Int. J. Rock Mech. Min. Sci. 76, 146–154. doi:10.1016/j.ijrmms.2015.03.010
Liang, C. Y., Zhang, Q. B., Li, X., and Xin, P. (2015b). The effect of specimen shape and strain rate on uniaxial compressive behavior of rock material. Bull. Eng. Geol. Environ. 75 (4), 1669–1681. doi:10.1007/s10064-015-0811-0
Lindholm, U., Yeakley, L., and Nagy, A. (1974). The dynamic strength and fracture properties of dresser basalt. Int. J. Rock Mech. Min. Sci. Geomechanics Abstr. 11 (5), 181–191. doi:10.1016/0148-9062(74)90885-7
Mahanta, B., Singh, T. N., Ranjith, P. G., and Vishal, V. (2018). Experimental investigation of the influence of strain rate on strength; failure attributes and mechanism of Jhiri shale. J. Nat. Gas. Sci. Eng. 58, 178–188. doi:10.1016/j.jngse.2018.08.001
Martin, C., and Chandler, N. (1994). The progressive fracture of Lac du Bonnet granite. Int. J. Rock Mech. Min. Sci. Geomechanics Abstr. 31 (6), 643–659. doi:10.1016/0148-9062(94)90005-1
Meng, Q., Zhang, M., Han, L., Pu, H., and Nie, T. (2016). Effects of acoustic emission and energy evolution of rock specimens under the uniaxial cyclic loading and unloading compression. Rock Mech. Rock Eng. 49 (10), 3873–3886. doi:10.1007/s00603-016-1077-y
Nicksiar, M., and Martin, C. D. (2012). Evaluation of methods for determining crack initiation in compression tests on low-porosity rocks. Rock Mech. Rock Eng. 45 (4), 607–617. doi:10.1007/s00603-012-0221-6
Ožbolt, J., Sharma, A., and Reinhardt, H.-W. (2011). Dynamic fracture of concrete–compact tension specimen. Int. J. Solids Struct. 48 (10), 1534–1543. doi:10.1016/j.ijsolstr.2011.01.033
Pan, F. (2017). Study on the mechanism of the enhancement of dynamic strength for concrete material considering the meso-structure. Dissertation thesis. Xi'an: Xi'an Technological University. (in Chinese).
Qi, C., Wang, M., and Qian, Q. (2009). Strain-rate effects on the strength and fragmentation size of rocks. Int. J. Impact Eng. 36 (12), 1355–1364. doi:10.1016/j.ijimpeng.2009.04.008
Rossi, P. (1991). A physical phenomenon which can explain the mechanical behaviour of concrete under high strain rates. Mat. Struct. 24 (6), 422–424. doi:10.1007/BF02472015
Sirdesai, N. N., Gupta, T., Singh, T. N., and Ranjith, P. (2018). Studying the acoustic emission response of an Indian monumental sandstone under varying temperatures and strains. Constr. Build. Mat. 168, 346–361. doi:10.1016/j.conbuildmat.2018.02.180
Solecki, R., and Conant, R. J. (2003). Advanced mechanics of materials. Oxford: Oxford University Press.
Tarasov, B. (1990). Simplified method for determining the extent to which strain rate affects the strength and energy capacity of rock fracture. Soviet Min. Sci. 26 (4), 315–320. doi:10.1007/BF02506510
Wang, C., Fan, P., and Wang, M. (2011a). Influence of strain rate on progressive failure process and characteristic stresses of red sandstone. Rock Soil Mech. 32 (5), 1340–1346. (in Chinese). doi:10.16285/j.rsm.2011.05.008
Wang, X., Ge, H., and Song, L. (2011b). Experimental study of two types of rock sample acoustic emission events and kaiser effect point recognition approach. Chin. J. Rock Mech. Eng. 30 (3), 580–588. (in Chinese).
Wang, X., Wen, Z., Jiang, Y., and Huang, H. (2018). Experimental study on mechanical and acoustic emission characteristics of rock-like material under non-uniformly distributed loads. Rock Mech. Rock Eng. 51 (3), 729–745. doi:10.1007/s00603-017-1363-3
Xie, H., Li, L., Peng, R., and Ju, Y. (2009). Energy analysis and criteria for structural failure of rocks. J. Rock Mech. Geotechnical Eng. 1 (1), 11–20. doi:10.3724/SP.J.1235.2009.00011
Zhang, Q. B., and Zhao, J. (2014). A review of dynamic experimental techniques and mechanical behaviour of rock materials. Rock Mech. Rock Eng. 47 (4), 1411–1478. doi:10.1007/s00603-013-0463-y
Zhang, Y., Chen, Y., Yu, R., Hu, L., and Irfan, M. (2017). Effect of loading rate on the felicity effect of three rock types. Rock Mech. Rock Eng. 50 (6), 1673–1681. doi:10.1007/s00603-017-1178-2
Zhang, Z., Deng, M., Bai, J., Yu, X., Wu, Q., and Jiang, L. (2020). Strain energy evolution and conversion under triaxial unloading confining pressure tests due to gob-side entry retained. Int. J. Rock Mech. Min. Sci. 126, 104184. doi:10.1016/j.ijrmms.2019.104184
Zhang, Z., Kou, S., Jiang, L., and Lindqvist, P. A. (2000). Effects of loading rate on rock fracture: fracture characteristics and energy partitioning. Int. J. Rock Mech. Min. Sci. 37 (5), 745–762. doi:10.1016/S1365-1609(00)00008-3
Zhao, F., Li, Y., Ye, Z., Fan, Y., Zhang, S., Wang, H., et al. (2018). Research on acoustic emission and electromagnetic emission characteristics of rock fragmentation at different loading rates. Shock Vib. 2018, 1–8. doi:10.1155/2018/4680879
Zhao, H., Song, Z., Zhang, D., Liu, C., and Yu, B. (2021a). True triaxial experimental study on mechanical characteristics and energy evolution of sandstone under various loading and unloading rates. Geomech. Geophys. Geo-energ. Geo-resour. 7 (1), 22. doi:10.1007/s40948-020-00212-7
Zhao, J., Li, H., Wu, M., and Li, T. (1999). Dynamic uniaxial compression tests on a granite. Int. J. Rock Mech. Min. Sci. 36 (2), 273–277. doi:10.1016/S0148-9062(99)00008-X
Keywords: strain rate effects, characteristic stresses, acoustic emission, energy conversion, multi-scale defects
Citation: Liu L, Wang S and Yang W (2022) Strain rate effects on characteristic stresses and acoustic emission properties of granite under quasi-static compression. Front. Earth Sci. 10:960812. doi: 10.3389/feart.2022.960812
Received: 03 June 2022; Accepted: 12 July 2022;
Published: 10 August 2022.
Edited by:
Zhiqiang Yin, Anhui University of Science and Technology, ChinaReviewed by:
Baohua Guo, Henan Polytechnic University, ChinaWanchun Zhao, Northeast Petroleum University, China
Copyright © 2022 Liu, Wang and Yang. This is an open-access article distributed under the terms of the Creative Commons Attribution License (CC BY). The use, distribution or reproduction in other forums is permitted, provided the original author(s) and the copyright owner(s) are credited and that the original publication in this journal is cited, in accordance with accepted academic practice. No use, distribution or reproduction is permitted which does not comply with these terms.
*Correspondence: Sijing Wang, Wangsijing@126.com