Corrigendum: 14,000-Year Carbon Accumulation Dynamics in a Siberian Lake Reveal Catchment and Lake Productivity
 Lara Hughes-Allen1,2*
  Frédéric Bouchard1,3
  Christine Hatté4
  Hanno Meyer2
  Lyudmila A. Pestryakova5
  Bernhard Diekmann2
  Dmitry A. Subetto6,7
  Boris K. Biskaborn2*
- 1CNRS, GEOPS, Université Paris-Saclay, Orsay, France
- 2Alfred Wegener Institute Helmholtz Centre for Polar and Marine Research, Potsdam, Germany
- 3Centre d’études Nordiques (CEN), Université Laval, Québec, QC, Canada
- 4Laboratoire des Sciences du Climat et de L’Environnement (LSCE), CEA CNRS UVSQ, Université Paris-Saclay, Gif-sur-Yvette, France
- 5North-Eastern Federal University of Yakutsk, Yakutsk, Russia
- 6Herzen State Pedagogical University of Russia, Saint Petersburg, Russia
- 7Institute for Water and Environmental Problems, Siberian Branch of the Russian Academy of Sciences, Barnaul, Russia
A Corrigendum on
14,000-Year Carbon Accumulation Dynamics in a Siberian Lake Reveal Catchment and Lake Productivity Changes
by Hughes-Allen, L., Bouchard, F., Hatté, C., Meyer, H., Pestryakova, L. A., Diekmann, B., Subetto, D. A., and Biskaborn, B. K. (2021). Front. Earth Sci. 9:710257. doi: 10.3389/feart.2021.710257
In the original article, there was a mistake in Figure 2 as published. There was an error in the calculation of mass accumulation rate (MAR) and organic carbon accumulation rate (OCAR). There was also a mistake in Figure 5 as published. There was an error in the calculation of OCAR (gOC m2/yr). The corrected Figures 2 and 5 appear below.
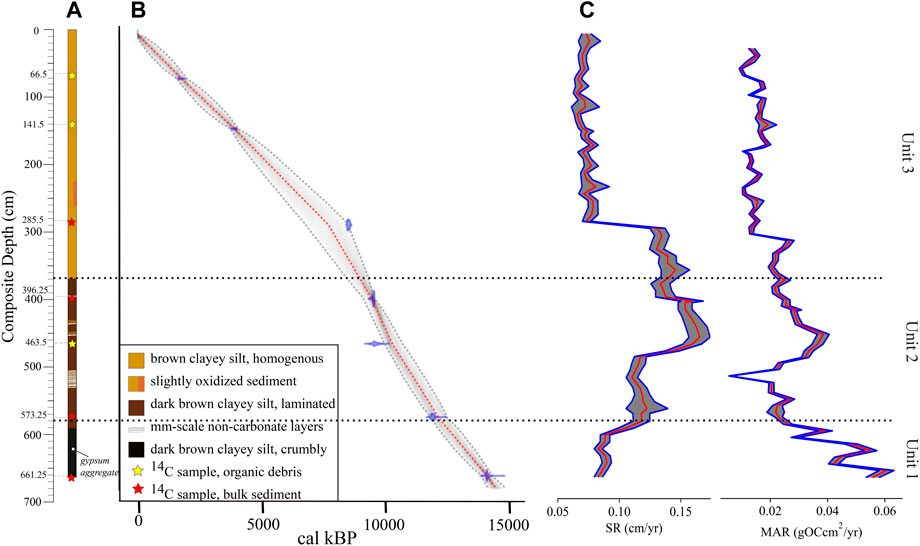
FIGURE 2. (A) General stratigraphy and (B) age-depth model of the sediment core, based on radiocarbon dating of 7 samples, shown as green/yellow stars (see details in Table 1). (C) Inferred sedimentation and mass accumulation rate (SR and MAR) curves along the core, based on the age-depth model.
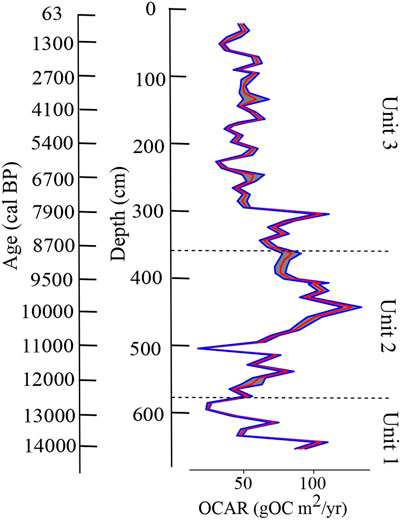
FIGURE 5. Organic carbon accumulation rate (OCAR, in g OC m−2 a−1) for each biogeochemical subsample along the core (see Figure 4), inferred from the age-depth model, as well as sedimentation and mass accumulation rates (see Figure 2).
In the original article, there were also multiple errors in the text. Corrections are made to the below listed sections. There was an error in the calculations of MAR and OCAR. A correction has been made to Section 4 Results, Sub-section 4.1 Chronology and sedimentation rates, Paragraph 1:
“Considering the dry bulk density (DBD) of each sample, instantaneous sediment mass accumulation rates (MARs) range from 0.02 g cm−2 a−1 above 300 cm depth to 0.06 g cm−2 a−1 near the bottom of the core. Considering each unit separately, average MAR values are 0.05 g cm−2 a−1 for Unit 1, 0.03 g cm−2 a−1 for Unit 2, and 0.02 g cm−2 a−1 for Unit 3. Average OCAR is similar in Unit 1 (57 g m−2 a−1) and Unit 3 (55 g m−2 a−1) and highest in Unit 2 (77 g m−2 a−1).”
A further correction has been made to Section 4 Results, Sub-section 4.4 Biogeochemistry, Paragraph 1:
“OCAR, controlled by both TOC and MAR, experiences two low peaks (∼20 g OC m−2 a−1) at 600 cm depth and 500 cm depth. OCAR decreases throughout Unit 1 from approximately 100 g OC m−2 a−1–24 g OC m−2 a−1. Apart from the low peak at 500 cm depth, OCAR increases relatively steadily throughout Unit 2. There is a high peak of 127 g OC m−2 a−1 at 438 cm depth. OCAR then decreases into Unit 3 where it stabilizes around 50 g OC m−2 a−1 from approximately 300 cm depth.”
A correction has been made to Section 5 Discussion, Sub-section 5.1 Multiproxy-inferred paleolimnological history, Paragraph 1:
“Decreasing TOC and MAR values, resulted in decreasing OCAR values throughout this Unit culminating in a low peak at 600 cm depth (Figure 2, Figure 5).”
A correction has been made to Section 5 Discussion, Sub-section 5.1 Multiproxy-inferred paleolimnological history, Paragraph 6:
“Sedimentation experienced an initial decrease in the bottom half of Unit 2 (MAR decreasing from 0.03 g cm−2 a−1 bottom of Unit 2 to 0.006 g cm−2 a−1 at 500 cm depth), before gradually increasing to 0.04 g cm−2 a−1 cm at 450 cm depth (Figure 2). MAR then decreases slightly until about 300 cm depth, where it stabilizes until the top of the core. OC delivery was high during the Early Holocene (average OCAR 83 g OC m−2 a−1 above 500 cm of composite depth, i.e., after ∼11 cal kBP until about 300 cm depth, i.e., 7.9 cal kBP). Such rates are clearly well above the reported values for high-latitude lake basins and notably higher than global modern values (Vyse et al., 2021 and references therein).”
A correction has been made to Section 5 Discussion, Sub-section 5.1 Multiproxy-inferred paleolimnological history, Paragraph 12:
“OC delivery decreased after 7.9 cal kBP, as shown by an average OCAR of 55 g OC m−2 a−1 for Unit 3. This was the result of a lower sedimentation (average MAR decreasing from ∼0.02 g cm−2 a−1 at the top of Unit 2 to ∼0.01 g cm−2 a−1 in the upper section of Unit 3). Still, OCAR values of 55 g OC m−2 a−1 are notably in the upper range of global modern values and significantly higher than elsewhere across high-latitude regions (Vyse et al., 2021; Figure 8).”
A correction has been made to Section 5 Discussion, Sub-section 5.2 Lake Malaya Chabyda carbon accumulation rates, Paragraph 2:
“Moreover, the inferred OCARs for Unit 1 indeed represent low values compared to Unit 2, with an average of ∼100 g OC m −2 a−1 (ranging from 24 to 105 g OC m−2 a−1; Figure 5).”
A correction has been made to Section 5 Discussion, Sub-section 5.2 Lake Malaya Chabyda carbon accumulation rates, Paragraph 3:
“Furthermore, inferred OCARs for Unit 2 show a strong increase from the base (42 g OC m −2 a−1) to the top (76 g OC m−2 a−1) of this unit, in accordance with developing lacustrine conditions and enhanced biological productivity from algae (i.e., mostly autochthonous source of OM).”
Finally, a correction has been made to Section 5 Discussion, Sub-section 5.2 Lake Malaya Chabyda carbon accumulation rates, Paragraph 6:
“Decreasing MAR combined with low and decreasing TOC resulted in decreasing OCAR values within Unit 1 with a low peak at the top of this unit (Figure 2C; Figure 5).”
The authors apologize for these errors and state that this does not change the scientific conclusions of the article in any way. The original article has been updated.
Publisher’s Note
All claims expressed in this article are solely those of the authors and do not necessarily represent those of their affiliated organizations, or those of the publisher, the editors and the reviewers. Any product that may be evaluated in this article, or claim that may be made by its manufacturer, is not guaranteed or endorsed by the publisher.
Keywords: paleolimnology, lake sediment core, late pleistocene, holocene, Eastern Siberia, organic carbon accumulation, stable carbon isotope (13C)
Citation: Hughes-Allen L, Bouchard F, Hatté C, Meyer H, Pestryakova LA, Diekmann B, Subetto DA and Biskaborn BK (2022) Corrigendum: 14,000-Year Carbon Accumulation Dynamics in a Siberian Lake Reveal Catchment and Lake Productivity. Front. Earth Sci. 10:949116. doi: 10.3389/feart.2022.949116
Received: 20 May 2022; Accepted: 24 May 2022;
Published: 24 June 2022.
Edited and reviewed by:
Lutz Schirrmeister, Alfred Wegener Institute Helmholtz Centre for Polar and Marine Research (AWI), GermanyCopyright © 2022 Hughes-Allen, Bouchard, Hatté, Meyer, Pestryakova, Diekmann, Subetto and Biskaborn. This is an open-access article distributed under the terms of the Creative Commons Attribution License (CC BY). The use, distribution or reproduction in other forums is permitted, provided the original author(s) and the copyright owner(s) are credited and that the original publication in this journal is cited, in accordance with accepted academic practice. No use, distribution or reproduction is permitted which does not comply with these terms.
*Correspondence: Lara Hughes-Allen, lara.hughes-allen@universite-paris-saclay.fr; Boris K. Biskaborn, Boris.biskaborn@awi.de