Sedimentary Dynamics in the Distal Margin Around Isolated Carbonate Platforms of the Northern South China Sea
 Junjin Chen
 Shiguo Wu
 Shiqiao Liu3
  Wanli Chen
- 1Laboratory of Marine Geophysics and Georesources, Institute of Deep-Sea Science and Engineering, Chinese Academy of Sciences, Sanya, China
- 2University of Chinese Academy of Sciences, Beijing, China
- 3Haikou Marine Geological Survey Center, China Geological Survey, Haikou, China
The South China Sea (SCS) serves as an excellent case for studying “source-to-sink” sedimentary dynamics among the global marginal seas. Analysis of the grain size distribution enables reconstruction of the sediment transport processes and dynamic mechanisms. In this study, based on 232 surface sediment samples obtained from the distal margin of the northern SCS, grain size trend analysis (GSTA) and end-member analysis (EMA) were first applied to the deep-sea environment to reveal the sedimentary dynamics around isolated carbonate platforms. The Zhongsha Atoll and Xisha Archipelagos were the two main sources of gravity flows in the study area. The GSTA results indicate the dominant transport trends that sediments initially originated from the Zhongsha Atoll and Xisha Archipelagos, dispersed in surrounding areas, and eventually formed a deposition center in the Zhongsha Trough. Furthermore, the sediment transport trends in the northern, eastern, and southern boundaries of the study area bounded by the oceanic basin were driven by deep circulation with seasonal variations. The grain size distributions were unmixed into five end-members, with dominant modes of 0.62, 1.89, 3.31, 7.14, and 10.17 Ф, corresponding to coarse sand, medium sand, fine sand, fine silt, and clay, respectively. Gravity flows and deep circulation have a significant impact on the distribution of end-members in the study area. The contents of EM1, EM2, and EM3 decreased while EM4 and EM5 contents increased outward from the Zhongsha Atoll to deep-sea areas. Sediments with coarse grains are primarily retained in the Zhongsha Atoll, and sediments with fine grains can be transported by gravity flows from platforms to deep-sea areas and removed by deep currents. The sediment transport trends were consistent with the results of sediment sources, seafloor topography, and current observations. The results show that GSTA is applicable in deep-sea environments and its combination with EMA helps to better understand sedimentary dynamics.
Introduction
Marine sedimentary dynamics are the natural result of the comprehensive effects of sediment provenances, transport processes, and hydrodynamic conditions (Friedman, 1967; Hails, 1967). Sediment transport patterns can be determined by grain size analysis, current observations, sedimentation rates, and sedimentary textures or structures, which can greatly reflect the sedimentary dynamic processes (Gao and Collins, 1994; Venkatramanan et al., 2014; Yamashita et al., 2018; Liang et al., 2020; Zheng et al., 2021). Grain size provides abundant information regarding sedimentary dynamics and is extensively applied to identify sediment sources, recover depositional environments, illustrate sediment transport processes, and discuss dynamic mechanisms (Folk and Ward, 1957; Friedman, 1961; McCave, 1978; McLaren, 1981; McLaren and Bowles, 1985; Flemming, 1988). In general, grain size distribution is a mixture of multiple dynamic populations from different sediment sources and is associated with different transport processes (Middleton, 1976; Ashley, 1978; Weltje and Prins, 2003; Flemming, 2007). Therefore, many geoscientists have attempted to invert the sedimentary dynamics based on an analysis of the grain size distribution.
Grain size trend analysis (GSTA) aims to establish net sediment transport trends, which can illustrate sediment provenance, transport, and deposition processes (Gao and Collins, 1992; Gao and Collins, 1994; Balsinha et al., 2014; Sánchez et al., 2019; Wang et al., 2020). Likewise, end-member analysis (EMA) attempts to partition grain size distributions into geologically meaningful dynamic populations and enables the extraction of environmental information represented by irrelevant end-members (EMs) (Weltje, 1997; Prins and Weltje, 1999; Sun et al., 2002; Weltje and Prins, 2007; Dietez et al., 2012; Ha et al., 2021). However, the combination of GSTA and EMA can greatly facilitate the geological explanation of grain size distribution and reveal sedimentary dynamics (Liu et al., 2012; Yu et al., 2019). In previous studies, the GSTA has been successfully applied in nearshore environments (Gao et al., 1994; Plomaritis et al., 2008; Ma et al., 2010; Liang et al., 2020; Wang et al., 2020) but has never been used in deep-sea environments. Thus, the applicability of the GSTA in deep-sea environments is yet to be evaluated.
The study area is located in the distal margin of the northern South China Sea (SCS), which ranges from shallow carbonate platforms to deep-sea basins (Figure 1A). The Zhongsha Atoll (ZA) is the largest single atoll system of the SCS, forming a unique isolated carbonate platform situated in the study area. Many studies have focused on the stratigraphic evolution of the ZA and the crustal structure of the Zhongsha Block (Huang et al., 2019; Huang et al., 2021; Huang et al., 2020; Li et al., 2021; Chen et al., 2022). However, an understanding of sediment transport processes and dynamic mechanisms from carbonate platforms along slopes to deep-sea basins requires further improvement.
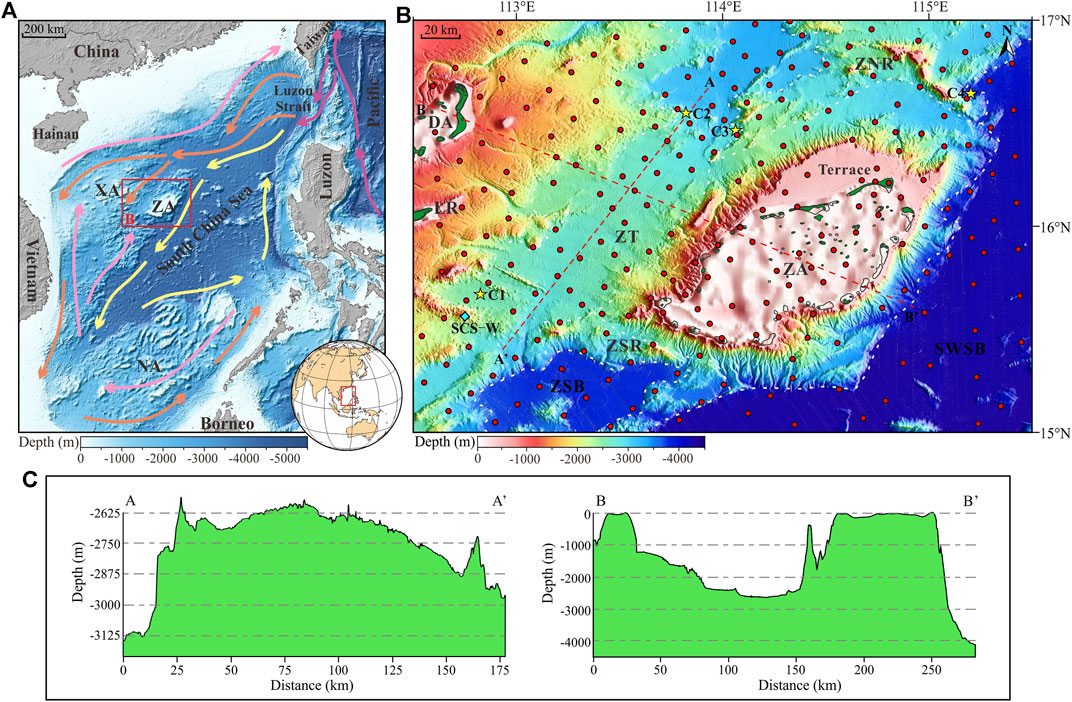
FIGURE 1. Location, oceanography, and topography of the study area. (A) Bathymetric map of the SCS revealing the location of the study area. Purple arrows indicate the western Pacific waters entering the SCS through the Luzon Strait (Fang et al., 1998; Lüdmann et al., 2005). The surface circulation is indicated by orange arrows (winter) and pink arrows (summer) (Yang et al., 2002; Wang et al., 2018). The deep circulation is indicated by yellow arrows (Lan et al., 2015; Wang et al., 2018). (B) Multibeam bathymetric map showing the submarine topography of the study area. Green patches indicate the reefs. Red dots and yellow stars mark the 232 samples and 4 ADCP stations analyzed in this study, respectively. The blue diamond indicates a sampling location of Liu et al. (2018). Red dashed lines indicate the profile position displayed in Panel (C). (C) Bathymetric profiles show the geometry of seafloor topography in the study area. ZA, Zhongsha Atoll; XA, Xisha Archipelagos; NA, Nansha Archipelagos. DA, Dongdao Atoll; LR, Langhua Reef; ZT, Zhongsha Trough; ZSB: Zhongsha South Basin; ZNR, Zhongsha North Ridge; ZSR, Zhongsha South Ridge; SWSB, Southwest Sub-basin.
In this study, the grain size distributions of 232 surface sediment samples collected around isolated carbonate platforms in the study area were studied using the GSTA and EMA. The main objectives were to 1) clarify the characteristics of the grain size distribution of surface sediments in the study area, 2) combine newly acquired current observation and multibeam bathymetric data to examine the applicability of the GSTA in the deep-sea environment, and 3) explore the sediment transport patterns and dynamic processes and their interactions with modern topography, hydrodynamics, and other environmental factors.
Regional Setting
Geological and Topographic Settings
The SCS is the largest and deepest marginal sea in the western Pacific Ocean, with an area of approximately 3.5 × 10⁶ km2. The SCS was formed by episodes of rifting and subsequent seafloor spreading from the Late Cretaceous to Early Miocene (Taylor and Hayes, 1983; Franke et al., 2014; Li et al., 2014). The oceanic basin opened first in the north and moved south, forming the Northwest Sub-basin, East Sub-basin, and Southwest Sub-basin (SWSB). The Zhongsha Block is a microcontinent rifted from the South China continental margin (Li et al., 2021). The study area is located between the lower continental slope and the oceanic basin of the northern SCS, spanning from shallow carbonate platforms with a water depth of tens of meters to deep-sea basins thousands of meters deep, which is bounded to the north by the Northwest Sub-basin, to the east by the East Sub-basin, and to the south by the SWSB (Figures 1A,B). This special transition zone is of great significance to research on the geological evolution, sedimentary structure, and paleoceanography of the SCS.
The topography and geomorphology of the study area vary with water depth exceeding 4,300 m. The ZA is one of the largest drowned atolls globally and is composed of a series of shoals and reefs surrounding a lagoon with a water depth of 75–85 m (Huang, 1987; Huang et al., 2020). The most unique feature of the ZA bordered by a terrace in the north is the development of the ring-shaped submarine canyons around its periphery. Only part of the Dongdao Atoll (DA) and Langhua Reef of the Xisha Archipelagos (XA) are involved in the study area, which also developed many submarine canyons extending to the Zhongsha Trough (ZT). The ZT is located at the intersection of the ZA and XA, stretching to the northeast by the Northwest Sub-basin and to the southwest by the Zhongsha South Basin (ZSB). The west of the ZT has a gentle slope with a height difference of more than 500 m, whereas the east of the ZT has a steeper slope with a height difference of up to 2,200 m.
Oceanographic Setting
The SCS has a deep oceanic basin surrounded by a steep continental slope and links to the Pacific Ocean through the Luzon Strait, whose largest sill depth is approximately 2,400 m (Figure 1A). The western Pacific waters flowing into the SCS via the Luzon Strait are estimated to have an annual mean transport volume of 3.09 Sv (1 Sv = 106 m3/s) (Qu, 2000; Fang et al., 2009). SCS circulation is endowed with a distinctive three-dimensional structure “cyclonic-anticyclonic-cyclonic” as a result of an “inflow-outflow-inflow” pattern in the surface, middle, and deep layers of the Luzon Strait (Shu et al., 2014; Gan et al., 2016; Zhu et al., 2019). The surface circulation is overwhelmingly dominated by the seasonally reversing Southeast Asian monsoon, where the northeast monsoon prevails in winter and the southwest monsoon prevails in summer (Wyrtki, 1961; Yang et al., 2002; Lüdmann et al., 2005; Wang et al., 2018). Furthermore, the Kuroshio intrusion has a vital effect on surface circulation (Wyrtki, 1961; Hu et al., 2000; Xue et al., 2004). Moreover, deep circulation is associated with the persistent overflow of deep water through the Luzon Strait because of the density and salinity variations of water (Qu et al., 2006; Wang et al., 2011; Zhu et al., 2019). The Luzon Strait deep-water overflow can upwell and affect the surface circulation (Chao et al., 1996; Shu et al., 2014). The SCS possesses complex circulation patterns and hydrodynamic environments under the comprehensive influence of multilayer circulation and seafloor topography.
Data and Methods
Data Collection
A total of 232 surface sediment samples were collected using gravity samplers during seven cruises from July to November 2020 in the study area that was operated by the Haikou Marine Geological Survey Center, China Geological Survey. The position was determined by using the HYPACE-integrated navigation system. Among the 232 surface sediment samples, most were distributed along slopes and deep-sea areas, and only 37 were distributed on the platforms, including 36 on the ZA and one on the DA (Figure 1B). In the meantime, the current observation stations (C1–C4) were equipped with the RDI 300K ADCP fixed on the mooring system during the cruises at about 120 m above the seafloor in the study area (Figure 1B).
Grain Size Analysis Experiments
In this study, all surface sediment samples were processed using a laser particle size analyzer, owing to the absence of gravel grains. First, each surface sediment sample was immersed in 0.5 mol/L (NaPO3)6 for 24 h and stirred every 8 h to disperse the particles. Subsequently, each sample was poured into a laser sample tank and fully dispersed by ultrasonic vibration and high-speed centrifugation. The grain size analysis experiments were performed using a Beckman Coulter LS13 320 laser particle size analyzer, which has a measuring range of −1.8 to 16.6 Ф, repeatability error of ≤±0.5%, and an accuracy error of ≤±0.5%. Each sample was tested three times, and the average result was calculated. The grain size analysis results were primarily distributed in the range of −1 to 11.4 Ф. Moreover, the grain size standard adopts the Udden–Wentworth standard (Wentworth, 1922), and the grain size parameters of each sample were calculated using the statistical moment method (McManus, 1988), including the mean grain size (µ), sorting coefficient (σ), and skewness (Sk).
Grain Size Trend Analysis
McLaren (1981) was the first to relate the spatial variations in grain size parameters (μ, σ, and Sk) to sediment transport trends. The basic principle assumes that the grain size may become coarser, better sorted, and more positively skewed or finer, better sorted, and more negatively skewed along the sediment transport direction, indicating a high- or low-energy environment, respectively (McLaren and Bowles, 1985). Subsequently, Gao and Collins (1992) proposed a two-dimensional GSTA model to identify net sediment transport trends that have proven to be effective in different sedimentary environments such as estuaries (Gao and Collins, 1994; Venkatramanan et al., 2014; Su et al., 2016), nearshore (Plomaritis et al., 2008; Liang et al., 2020; Wang et al., 2020), continental shelves (Gao et al., 1994; Cheng et al., 2004; Balsinha et al., 2014), and submarine canyons (Liu et al., 2002; Zhang et al., 2013).
The Fortran program for the GSTA introduced by Gao (1996) was used to establish net sediment transport trends in this study. First, the GSTA defined trend vectors by comparing the distributions of the grain size parameters (μ, σ, and Sk) of each sampling station with its adjacent stations within the characteristic distance. In addition, all defined vectors were aggregated to produce a single vector for each sampling station with more than one trend vector. Furthermore, a filtering operation was performed to eliminate background noise by averaging the resultant vectors of each sampling station and its neighboring stations. The residual vectors formed a general pattern that reflects the net sediment transport trends. The vectors are dimensionless and have unit length, but the length of the vector only suggests the significance of grain size trends and has no significance in depositional rates (Gao and Collins, 1992).
End-Member Analysis
Weltje (1997) introduced a numerical-statistical algorithm end-member modeling analysis to solve the explicit mixing problem that has been successfully applied to the study of sediment dispersal and depositional processes (Hamann et al., 2008; Dietze et al., 2014; Li and Li., 2018) and paleoclimate changes (Moreno et al., 2002; Weltje and Prins, 2003). In recent years, a range of new algorithms have become available, especially for unmixing grain size distributions (Heslop et al., 2007; Dietze et al., 2012; Yu et al., 2016). EMA is a newly improved approach that includes both non-parametric and parametric methods for partitioning grain size distributions into subpopulations related to dynamic processes. The non-parametric end-member analysis (NEMA) was based on hierarchical alternating least squares for non-negative matrix factorization, and the parametric end-member analysis (PEMA) was based on the Gen. Weibull distributions (Paterson and Heslop, 2015). In this study, we performed the EMA to unmix the grain size distributions and select the best number of EMs by MATLAB-based software AnalySize designed by Paterson and Heslop (2015).
Results
Grain Size Trend Analysis Model
We divided the sediments in the study area into three grain size groups: sand, silt, and clay. Sand grains are coarser and harder to move great distances than silt and clay grains. Sand grains were primarily distributed in the ZA, where the sand percentage exceeded 50%, and their outward extension showed a gradual reduction (Figure 2A). Silt grains were primarily found in deep-sea areas, with a silt percentage of more than 40% (Figure 2B). The distribution of the silt content was therefore negatively correlated with that of sand content. Clay grains were mostly distributed in deep-sea areas where the silt percentage surpassed 25% (Figure 2C), and the clay content was positively associated with silt content in the distribution. In general, sand grains comprised the largest fraction of the platforms, whereas silt and clay grains constituted the majority in deep-sea areas.
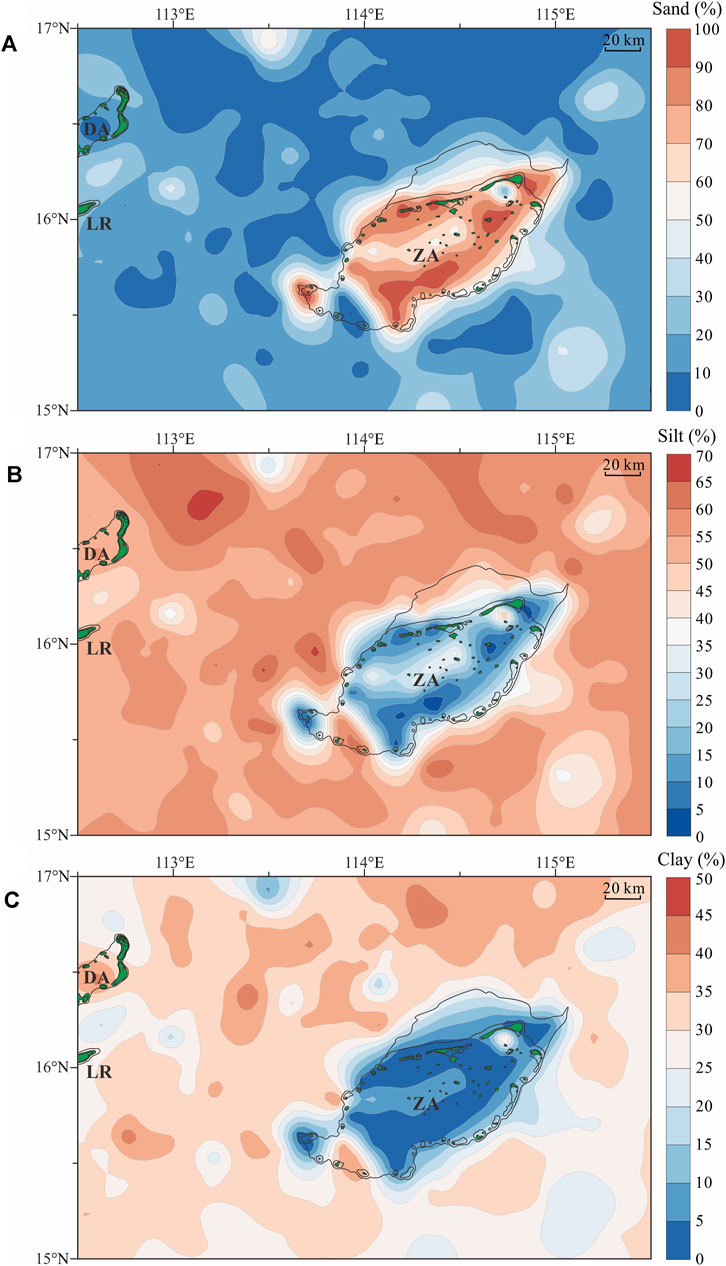
FIGURE 2. Spatial distribution of sediment contents in the study area, including (A) sand, (B) silt, and (C) clay.
The mean grain size of surface sediments in the study area varies from 0.62 to 7.81 Ф, with an average of 6.21 Ф. Sediments with the coarsest mean grain size were located in the ZA, ranging from 0.50 to 4.50 Ф, and sediments with the finest mean grain size were distributed in the northern part of the study area, most of which were larger than 7.00 Ф. The mean grain size of the sediments decreased outward from the ZA to deep-sea areas (Figure 3A). The sorting coefficient of surface sediments in the study area ranging from 0.58 to 3.16 with an average of 2.07 indicates poor sorting. The sorting coefficient in the ZA was between 0.50 and 2.10, ranging from good to poor sorting. The sorting coefficient in the northern part of the study area was relatively poor, ranging from 1.70 to 2.10, and other deep-sea areas were poorly sorted with a sorting coefficient of over 2.10 (Figure 3B). The skewness of surface sediments in the study area varies from −1.32 to 2.71 with an average of 0.09. The skewness in the ZA primarily ranges from 0.40 to 2.50, indicating positive skewness (Sk > 0.33). Similarly, the northwestern region of the study area exhibited a positive skewness. Furthermore, the skewness of the other areas is between −1.40 and 1.00, most of which are dominated by negative skewness (Sk <−0.33) with a speckled distribution of positive skewness (Figure 3C).
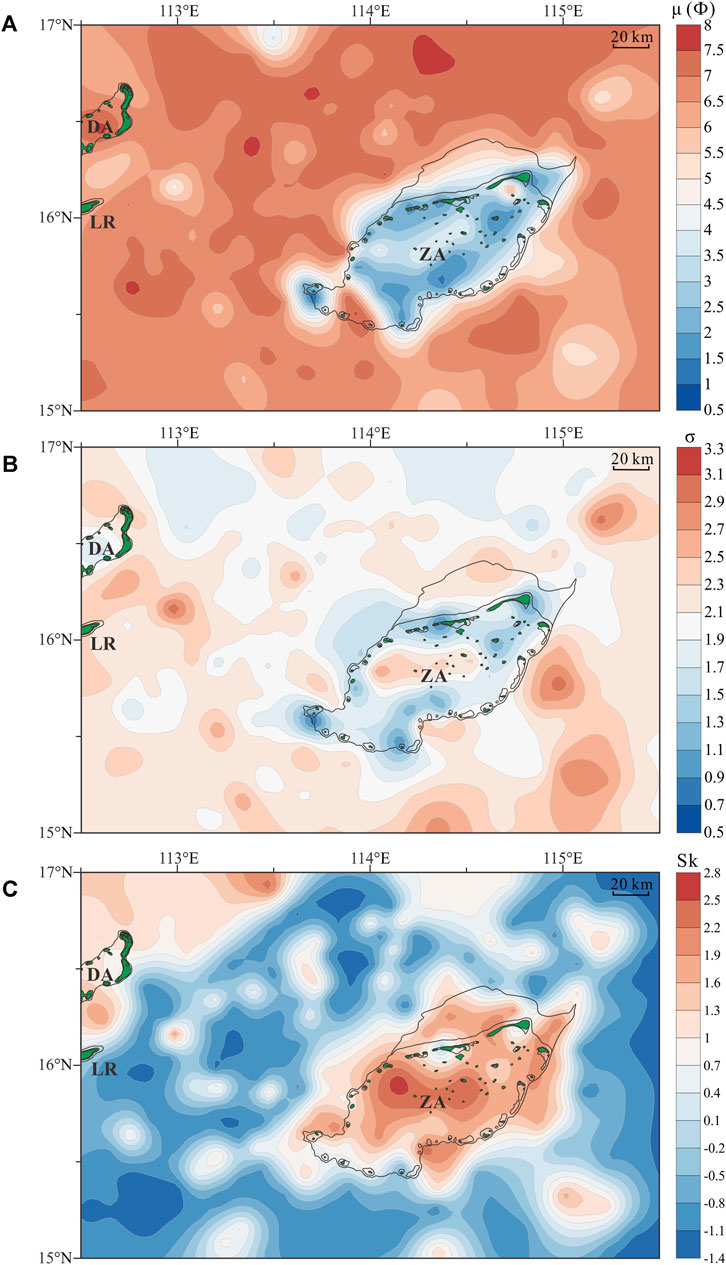
FIGURE 3. Spatial distribution of grain size parameters in the study area, including (A) μ, (B) σ, and (C) Sk.
The sampling stations in the study area are spaced at irregular and unequal intervals, especially those on carbonate platforms, which are scattered and may affect the accuracy of the sediment transport trends. As a result, the GSTA was performed for 195 surface sediment samples, excluding those from the ZA and DA, to create sediment transport pathways from platforms to slopes and deep-sea basins. Owing to the variations in hydrodynamic and sedimentary environments, the GSTA was conducted in the slope, trough-ridge, and deep-sea basin areas. The net sediment transport trends revealed by the GSTA took the maximum sampling interval of 0.3 decimal degrees as the characteristic distance, and the edge effects were removed.
According to the different groups of vector directions and the changes in water depth and topography, the sediment transport trends were divided into eight zones (Zone A–H) (Figure 4; Table 1). Zone A was located on the northeastern slope of the DA, with a water depth of 1,000–2,500 m. The vector directions of Zone A are nearly southwestward, which is opposite to the extension direction of the submarine canyon. Zone B was situated on the southeastern slope of the DA at a water depth of 900–2,700 m. The vector directions were primarily southeastward, which is consistent with the extension direction of the submarine canyons and landslides. Although both Zones A and B were located on the southeastern slope of the XA, the sediment transport trends were significantly different. Zone C was distributed on the western slope of the ZA, extending to the ZT at a water depth of 500–2,700 m. The vector directions were northwestward in the north and southwestward in the south. Zones B and C were located at the intersection between the ZA and XA. The ZT area formed a deposition center, receiving sediments transported from the ZA and XA. Controlled by the height difference in the topography of the ZT (Figure 1C), the sediments were transported northeastward and southwestward. Zone D was located on the southern slope of the ZA, with a water depth of 1,000–3,600 m, and the vector directions were primarily southwestward. Zone E was located north of the ZA with a water depth of 500–3,000 m, and the vector directions were primarily northward and northeastward. Zone F was situated north and east of the ZNR, with a water depth of 500–4,200 m, and the vector direction was southwestward. The vector directions of Zones E and F presented opposite trends because the sediment transport pathways were separated by the high topography of the ZNR. Zone G was distributed in the ZSB and west of the SESB at a water depth of 2,500–4,200 m, and the vector direction was nearly northward. Zone H was located on the eastern slope of the ZA, extending to the SWSB at a water depth of 500–4,300 m. The vector directions were eastward on the slope and northward in deep-sea areas, displaying a counterclockwise trend. Zones C, D, E, and H around the peripheral slope of the ZA indicate that the vector directions are consistent with the extension direction of the submarine canyon.

FIGURE 4. Net sediment transport trends were revealed by the GSTA in the study area. Vector directions were divided into eight zones (Zone A–H) by red dashed lines. Black vector arrows indicate the sediment transport directions. The vector length suggests the significance of grain size trends and has no significance in depositional rates. Yellow stars indicate the position of four ADCP stations.
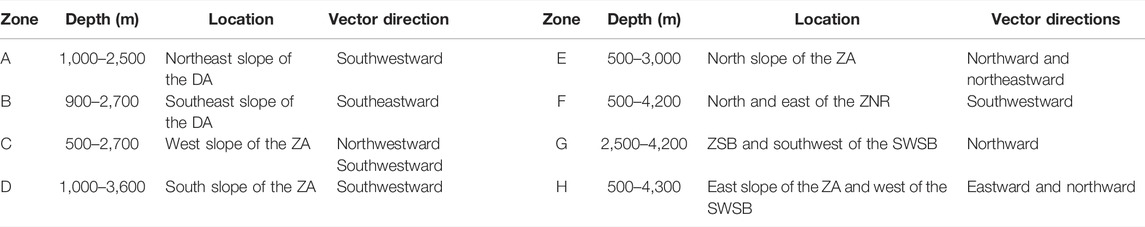
TABLE 1. Classification and characteristics of sediment transport trends.
End-Member Analysis Model
The grain size distribution of 232 surface sediment samples in the study area was unmixed between the NEMA and PEMA. The optimal number of EMs was selected by comparing the fitting effects of different EMs from 2 to 10. The results indicated that the PEMA and NEMA had little difference between the linear correlation and angular deviation; however, the EM correlation of the PEMA was better than that of the NEMA, and the PEMA displayed a better EM correlation with an increase in the EM number (Figure 5). The linear correlation increased and the angular deviation decreased, with an increase in EMs, but the EM correlation initially decreased and then increased. Therefore, the EMA presented the best fitting effect when the EM correlation decreased to the lowest value. The EM correlation was reduced to 0.05 with a linear correlation of 0.93 when unmixed into four EMs using the NEMA (Figure 5A), and the EM correlation reached 0.02 with a linear correlation of 0.92 when unmixed into five EMs by the PEMA (Figure 5C). Consequently, when unmixed into four EMs by the NEMA and five EMs by the PEMA, the EMA provided a better fitting effect to the original dataset and yielded a model closer to the true unmixing regime. In general, the fitting effect was better for smaller angle deviations. However, the angular deviation of the EMA was large overall because of the large sampling interval of surface sediments and rapidly changing topography with deep water depth in the study area (Figures 5B,D), but it exhibited little influence on selecting the number of EMs.
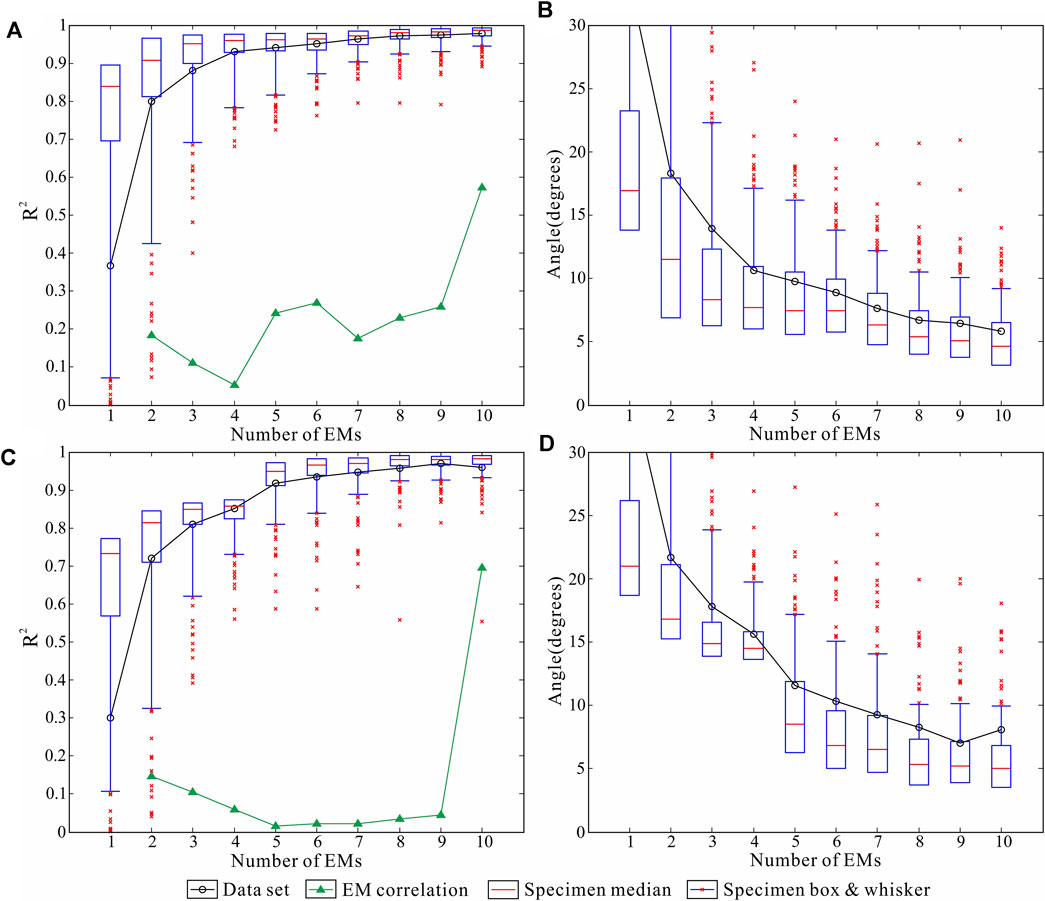
FIGURE 5. Fitting effect of the end-member analysis of surface sediments in the study area. (A) Linear and EM correlation of the NEMA. (B) Angular deviation of the NEMA. (C) Linear and EM correlation of the PEMA. (D) Angular deviation of the PEMA.
Based on the distribution of the four EMs unmixed by the NEMA, each EM showed a multimodal distribution, and even the modes of one EM were similar to those of the other EMs (Figure 6A); however, in light of the distribution of the five EMs unmixed by the PEMA, each EM displayed only one mode, and the modes of each EM were sufficiently irrelevant (Figure 6B). Additionally, EM4 of the PEMA exhibited two dominant modes in the fine-grained portion, and these two modes can be unmixed by the PEMA into two independent EMs (EM4 and EM5). Although the calculation speed of the NEMA was faster, the unmixing efficiency of the PEMA was better than that of the NEMA for highly mixed datasets. Therefore, the PEMA exhibited a better EM fitting quality through the combination and comparison of the PEMA and NEMA. The EMA results indicated that the PEMA had the best fitting effect on surface sediments in the study area, with grain size distributions unmixed into five EMs, which explained the related sedimentary dynamics represented by EMs. The dominant modes of these five EMs were 0.62, 1.89, 3.31, 7.14, and 10.17 Ф, corresponding to coarse sand, medium sand, fine sand, fine silt, and clay, respectively (Figure 6B).
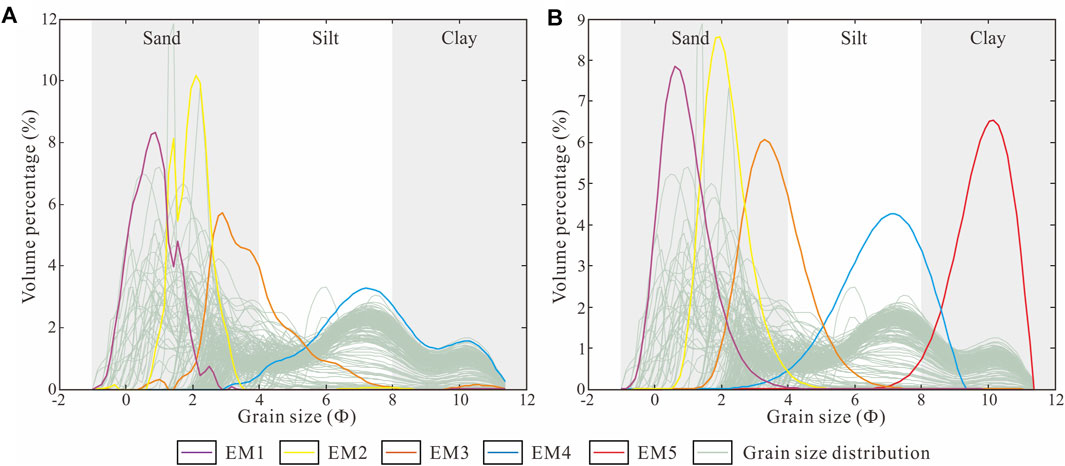
FIGURE 6. End-member analysis results of surface sediments in the study area. (A) Distribution of four end-members unmixed by the NEMA. (B) Distribution of five end-members unmixed by the PEMA.
Among the 232 surface sediment samples, 59, 78, 216, 227, and 223 sediment samples contained EM1, EM2, EM3, EM4, and EM5 components, respectively. The characteristics and compositions of the five EMs are listed in Table 2. EM1, EM2, and EM3 were practically absent in the clay component, while EM4 and EM5 contained little sand. EM1 had a grain size varying from −1 to 5.06 Ф with a maximum sand content of 99.83%, primarily representing the coarse sand component. EM2 had a grain size range of 0.35–5.86 Ф with a sand content of 98.50%, suggesting medium to fine sand components. EM3 had a grain size ranging from 0.88 to 8.28 Ф with a sand content of 66.92% and silt content of 33.06%, indicating very fine sand to coarse silt components. EM4 had a grain size varying from 1.15 to 9.36 Ф with a silt content of 79.79% and clay content of 18.22%, representing medium to fine silt components. EM5 had a grain size ranging between 5.86 and 11.36 Ф with a maximum clay content of 97.81%, indicating the clay components.
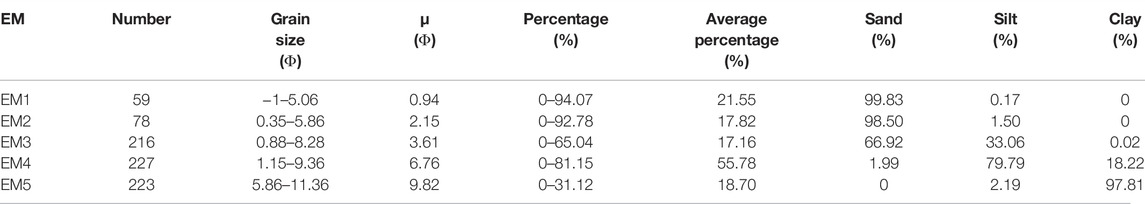
TABLE 2. Characteristics and components of five end-members.
EM1 was primarily distributed in the ZA and largely absent in deep-sea areas, with an average percentage of 21.55% (Figure 7A). EM2 was primarily located in the ZA and scattered in deep-sea areas, with an average percentage of 17.82% (Figure 7B). EM3 was universally distributed throughout the study area, with an average of 17.16%. The highest percentage (>30%) of EM3 was located in the ZA and XA with the maximum percentage on the terrace (Figure 7C). EM1, EM2, and EM3 had a common feature in that the ZA was an obviously high percentage center in the study area, and the farther away from the ZA, the lower was the percentage. EM4 showed a relatively high percentage between 40% and 70% in the study area, with an average of 55.78% (Figure 7D). There was a low EM4 percentage center (<30%) in the ZA. The greater the distance from the ZA, the higher was the percentage. EM5 mainly displayed a gentle percentage between 10% and 30%, with an average of 18.70%. Similar to EM4, there was a low percentage center (<10%) of EM5 in the ZA (Figure 7E). EM4 and EM5 were primarily concentrated in deep-sea areas north and west of the ZA, and the greater the distance between the ZA and XA, the higher was the percentage. In general, the spatial distributions of EM4 and EM5 displayed trends opposite to those of EM1, EM2, and EM3.
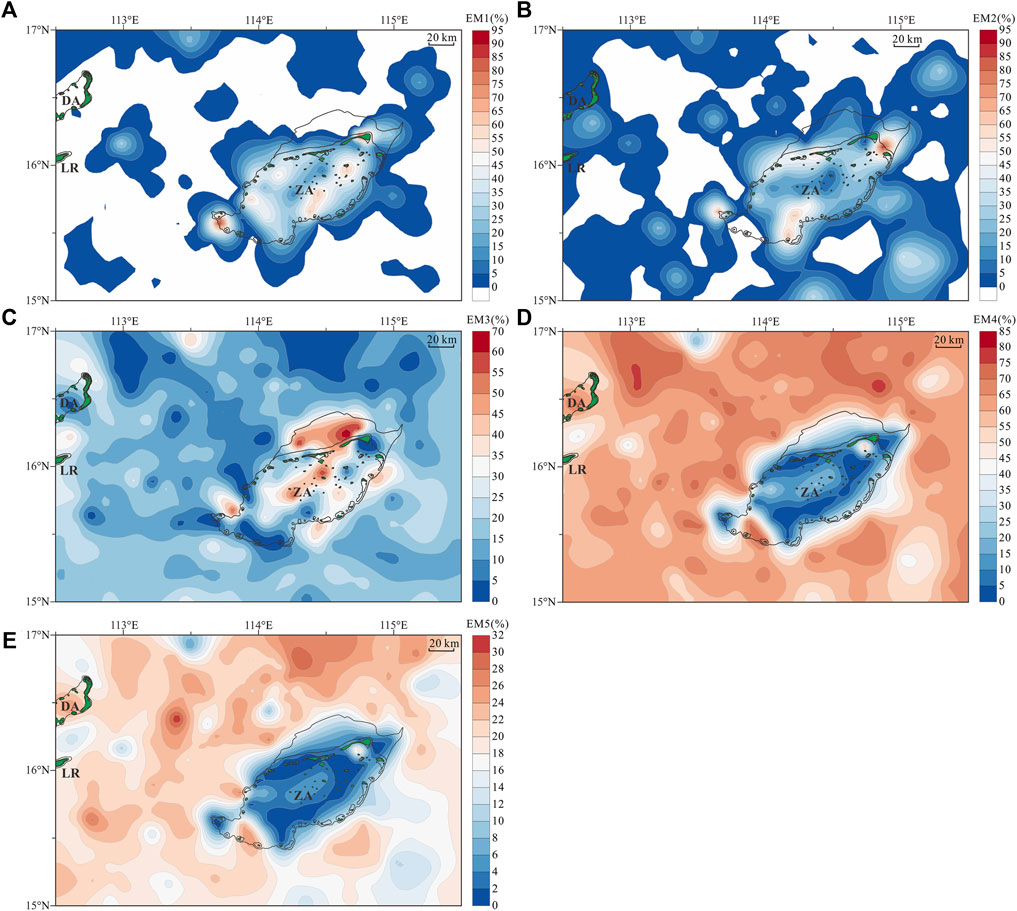
FIGURE 7. Spatial distribution of five end-members in the study area, including (A) EM1, (B) EM2, (C) EM3, (D) EM4, and (E) EM5.
Deep Current Observations
The flow velocity and direction of the deep currents were recorded by the ADCP in the study area (Figure 8; Table 3). C1 was situated southeast of the Langhua Reef at a water depth of 2,424 m. The flow velocity of C1 ranged from 0.01 to 0.11 m/s with an average of approximately 0.06 m/s, and the flow direction changed strongly from northeast to the southeast (Figure 8A). C2 was located northeast of the ZT, with a water depth of 2,653 m. The flow velocity was primarily between 0.03 and 0.23 m/s with an average of approximately 0.15 m/s, and the flow direction began eastward and rotated clockwise with a relatively large flow velocity during the observation period (Figure 8B). C3 was located northwest of the ZA at a water depth of 2,709 m. The flow velocity of C3 ranged from 0.01 to 0.15 m/s with an average of 0.07 m/s, and the flow direction was stable in northwestward to northeastward direction (Figure 8C). C4 was situated in the deep-sea basin east of ZNR, with a water depth of 3,733 m. The flow velocity of C4 varied from 0.01 to 0.08 m/s with an average of approximately 0.04 m/s, and the flow direction was primarily southwestward to northeastward (Figure 8D).
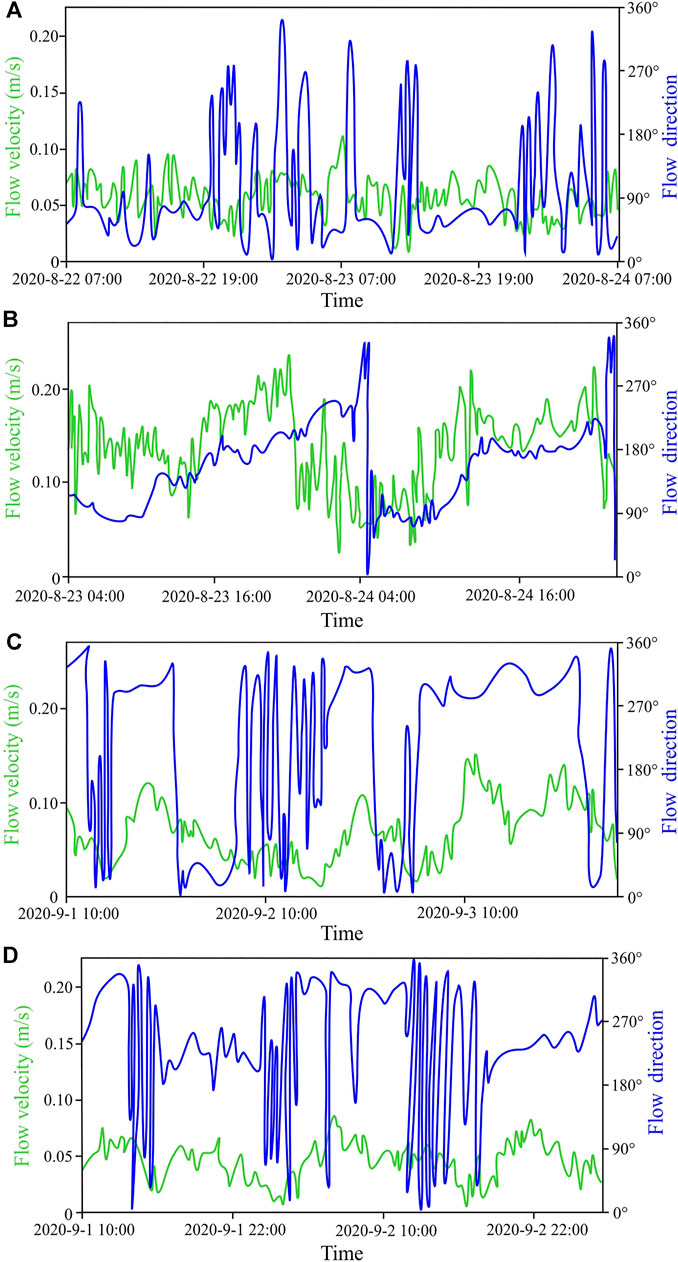
FIGURE 8. Flow velocity and direction of the bottom currents recorded by the ADCP, including the stations of (A) C1, (B) C2, (C) C3, and (D) C4. Yellow stars indicate the ADCP stations depicted in Figure 4.
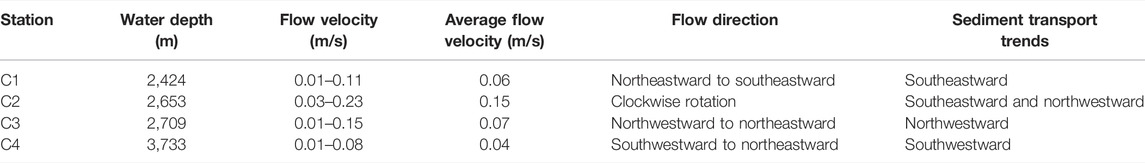
TABLE 3. Flow velocity and direction of deep currents and the associated sediment transport trends.
Discussion
Sediment Transport Pattern Affected by Gravity Flows
Numerous submarine canyons developed around the platforms, and sediments can be transported from the platform top to deep-sea areas. The ZA and XA were the two main sediment sources of gravity flows in the study area. As a result, gravity flows had a crucial influence on the transport trends of sediments. The sediment transport trends surrounding the platforms indicated that sediments were primarily transported from platforms along platform slopes to deep-sea areas, and the transport pathways were in the same direction as the extension of the submarine canyons around the platforms (Figure 9).
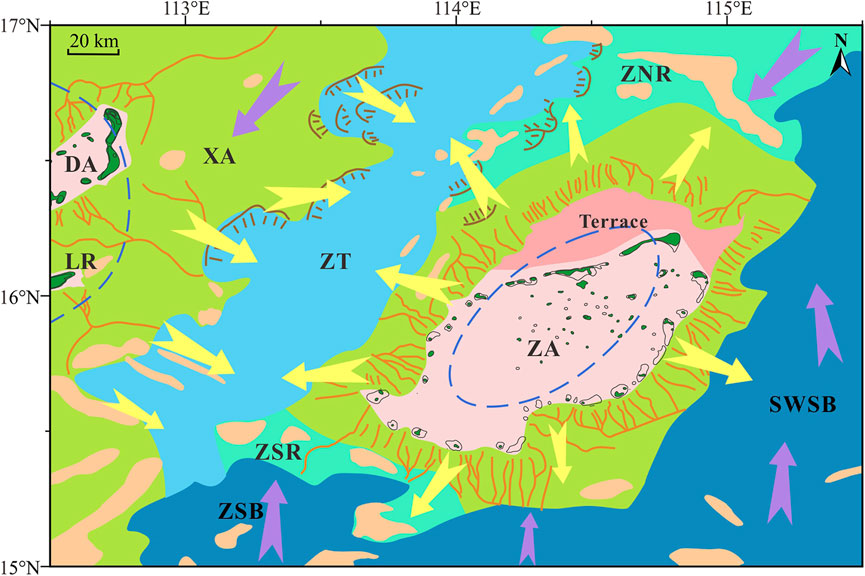
FIGURE 9. Sediment transport pattern in the study area. Blue circles indicate the sources of gravity flows. Yellow and purple arrows represent the sediment transport trends driven by gravity flows and bottom currents, respectively. Orange lines indicate the submarine canyons. Brown lines mark the traces of submarine landslides.
EM1, EM2, and EM3 are sand-dominated components. The contents of EM1, EM2, and EM3 were higher in the ZA and lower in the deep-sea areas (Figures 7A–C). They were the coarser EMs of the analyzed samples and were difficult to transport by deep currents. The presence of EM1, EM2, and EM3 in deep-sea areas indicated that gravity flows were essential for the transport of sediments from platforms to deep-sea areas. However, the outward decreasing trend of the contents of EM1, EM2, and EM3 suggested that coarse-grained sediments were primarily retained on the ZA, and fine-grained sediments can be transported by gravity flows from platforms to deep-sea areas. The ZA had the coarsest mean grain size ranging from 0.50 to 4.00 Ф (sand grains) with good sorting, indicating a high-energy environment.
EM4 and EM5 are the finer EMs of the analyzed samples with a dominance of silt to clay components, which are easily suspended and transported by gravity flows. The contents of EM4 and EM5 were higher in the deep-sea areas and lower in the ZA, in contrast to EM1, EM2, and EM3 (Figures 7D,E). Therefore, the outward increasing trend of EM4 and EM5 indicated that fine-grained sediments were capable of being transported by gravity flows from platforms to deep-sea areas.
Sediment Transport Pattern Affected by Deep Circulation
The SCS deep circulation driven by the Luzon overflow is characterized by a basin-scale cyclonic circulation with seasonal variations (Figure 1A), which is prominent in summer, corresponding to a higher volume transport of the deep-water overflow but is insignificant in winter, as suggested by the lower volume transport of the deep-water overflow (Lan et al., 2015; Gan et al., 2016). Large-scale deep circulation observations in the northeast of the study area found that the southwestward and northeastward currents constitute the cyclonic circulation, and the annual averaged current exhibited a maximum velocity of 2.25–2.52 cm/s (Zheng et al., 2021). The deep circulation flowed southwestward with an average velocity of 0.02 m/s and volume transport of 1.65 Sv (Zhou et al., 2017). However, the interaction between multilayer circulation and the detailed interior structures and seasonal variations of deep circulation remains vague. The four current observations in this study supplement the data gaps of deep circulation in the distal margin of northern SCS. Among the four observation stations, station C4 was located in the deep oceanic basin area. The flow direction observed here indicates southwestward dominance, which is consistent with the deep cyclonic circulation pattern established for the SCS. The flow velocity suggests an average of 0.04 m/s higher than that observed in previous studies, which might be influenced by the short period of observation and variable hydrodynamic environment.
Geochemical studies have manifested that sinking particles at the SCS-W station with high Eu* values originate from the Philippine Arc (Liu et al., 2018) (Figure 1B). The winter samples have a broader range than the summer samples; thus, the sediment sources and hydrodynamic conditions are more variable in winter than summer (Liu et al., 2018). Therefore, surface sediments in the study area can be transported by deep circulation with seasonality in the SCS. The northern and western regions of the sediment transport trends were primarily driven by the southwestward cyclonic deep circulation, and the deep circulation was then blocked by the high topography of the XA and ZNR (Figure 9). The sediment transport trends were northward in the south of the study area, including the ZSB and south of the SWSB, which may be controlled by seasonal changes in deep circulation, eddies, or other hydrodynamic conditions. EM3, EM4, and EM5 were broadly dispersed in the deep-sea areas and dominated by fine-grained components (Figures 7C–E). Fine-grained sediments transported from platforms to deep-sea areas can be removed by deep currents. As a result, deep circulation had a significant influence on the transport trend of sediments in the study area.
The sediment transport trends defined by the GSTA were compared to the flow direction and velocity obtained by the ADCP (Table 3). The sediment transport trends around C1 were southeastward, which were consistent with the flow direction changing from northeast to southeast. The sediment transport trends near C2 point in the southeastward and northwestward directions, and the flow direction revolved clockwise with a higher flow velocity, implying that C2 is located at the intersection of numerous currents with diverse flow directions. The sediment transport trends next to C3 were primarily northwestward, which agreed with the flow direction switching from northeastward to southeastward. The sediment transport trends around C4 show southwestward dominance, which corresponded to the flow direction shifting from southwestward to northwestward. To summarize, the transport trends revealed by the GSTA are consistent with the results of the deep current observations.
Applicability of Grain Size Trend Analysis
The GSTA has proven to be an effective tool in the study of shallow water environments with water depths of tens to hundreds of meters, such as the Gulf of California (Sánchez et al., 2019), Gulf of Thailand (Wang et al., 2020; Feng et al., 2022), East China Sea (Cheng et al., 2004; Liu et al., 2012; Liang et al., 2020), and northern SCS (Zhang et al., 2013; Li and Li., 2018). For the first time, we applied the GSTA to deep-sea areas in the distal margin of the northern SCS, where the water depth ranged from shallow platforms to deep-sea basins with complex topography, and the greatest depth exceeded 4,300 m. Moreover, owing to the variations in hydrodynamic and sedimentary environments, the GSTA was conducted in the slope, trough-ridge, and deep-sea basin areas. With the separation method, the sediment transport trends obtained by the GSTA appeared to be more pronounced and consistent with the actual conditions in the study area. The sediment transport trends defined by the GSTA were consistent with the results of gravity flows and deep circulation in the study area, indicating that the GSTA can be applied in deep-sea areas.
Factors that may affect the applicability of the GSTA were not significant in the study area, such as sediment sources, sampling intervals, and edge effects (Gao, 2009). For example, when sediments from different sources are physically mixed, the grain size composition and distribution of sediments must be changed, but its effect on sediment transport trends remains unclear (Flemming, 2007; Moore et al., 2007). In this study, the sediment transport trends revealed multiple sediment sources, which were consistent with previous studies. Moreover, sampling stations with regular intervals were beneficial for obtaining accurate sediment transport trends. The sampling interval in the study area was not regular; however, the sediment transport trends can be better presented and were in accordance with the results of the current observations. Additionally, each sampling station has eight adjacent sampling stations inside the square sampling grid, whereas the sampling stations on the edge do not have more than five adjacent sampling stations. This limitation may lead to inaccurate results; therefore, the vectors of the sampling stations on the edge were precluded in this study.
In deep-sea environments, different mechanisms of sediment transport and deposition can reverse the vectors and affect the formation and distribution of sediment transport trends under the influence of numerous current activities, such as gravity flows, deep currents, or a combination of multiple dynamics. Therefore, when interpreting the results of the GSTA, in addition to the regional geological background and hydrodynamic conditions, the comparison with transport evidence should be considered, such as current observations, sedimentation rates, and sedimentary textures or structures, etc.
Conclusion
The sediment transport trends revealed by the GSTA reflected the dominant circulation patterns, which were primarily controlled by gravity flows and deep circulation in the study area. The ZA and XA regions were the main sediment sources of gravity flows in the study area. Gravity flows can transport from platforms along platform slopes to deep-sea areas, and the transport pathways followed the same direction as the submarine canyons surrounding platforms. Sediments formed a deposition center in the ZT and were transported northeastward and southwestward, affected by the height difference in topography. In addition, the sediment transport trends on the northern, eastern, and southern boundaries adjacent to the oceanic basin were significantly driven by deep circulation with seasonal variations. Sediment transport trends were the comprehensive responses of the sediment sources, seafloor topography, and current activities in the study area.
Five grain-sized EMs were identified using the EMA. The distribution of EMs was significantly influenced by gravity flows and deep circulation. EM1, EM2, and EM3 were dominated by sand components, and the contents of these EMs decreased outward from the ZA to deep-sea areas. In contrast, EM4 and EM5 were dominated by silt and clay components, and their contents increased outward from the ZA to deep-sea areas. As a result, sediments with coarse grains were primarily retained in the ZA, and sediments with fine grains can be transported by gravity flows from platforms to deep-sea areas and carried by deep currents.
The sediment transport trends defined by the GSTA agreed with the study results of sediment sources, seafloor topography, and current observations in the study area, demonstrating the applicability of the GSTA in deep-sea environments. To strengthen the accuracy of the GSTA, we should comprehensively consider the regional geological background and hydrodynamic conditions and compare the GSTA model results with other sediment transport evidence. The combination of the GSTA and EMA better illustrated the sedimentary dynamics in the present study.
Data Availability Statement
The original contributions presented in the study are included in the article/Supplementary Material, further inquiries can be directed to the corresponding authors.
Author Contributions
JC conceived the study, analyzed the data, and prepared the original manuscript. SW and XW contributed to the conceptualization and reviewing and editing of the manuscript. SL and WC helped collect the samples and complete the grain size analysis experiments. YQ provided background information and contributed to reviewing and editing of the manuscript. All authors contributed to the manuscript and approved the submitted version.
Funding
This study was financially supported by the National Natural Science Foundation of China (U1701245) and the China Geological Survey Program (DD20191027).
Conflict of Interest
The authors declare that the research was conducted in the absence of any commercial or financial relationships that could be construed as a potential conflict of interest.
Publisher’s Note
All claims expressed in this article are solely those of the authors and do not necessarily represent those of their affiliated organizations, or those of the publisher, the editors and the reviewers. Any product that may be evaluated in this article, or claim that may be made by its manufacturer, is not guaranteed or endorsed by the publisher.
Acknowledgments
We greatly acknowledge the Haikou Marine Geological Survey Center for providing with the surface sediment samples and the Guangzhou Marine Geological Survey for bathymetric data.
References
Ashley, G. M. (1978). Interpretation of Polymodal Sediments. J. Geology. 86, 411–421. doi:10.1086/649710
Balsinha, M., Fernandes, C., Oliveira, A., Rodrigues, A., and Taborda, R. (2014). Sediment Transport Patterns on the Estremadura Spur continental Shelf: Insights from Grain-Size Trend Analysis. J. Sea Res. 93, 28–32. doi:10.1016/j.seares.2014.04.001
Chao, S.-Y., Shaw, P.-T., and Wu, S. Y. (1996). Deep Water Ventilation in the South China Sea. Deep Sea Res. Oceanographic Res. Pap. 43, 445–466. doi:10.1016/0967-0637(96)00025-8
Chen, J., Liu, S., Wang, S., Zhang, H., Qin, Y., Chen, W., et al. (2022). Characteristics and Mechanism of the Development of Gravity Flow Deposits in Zhongsha Trough. Acta Scientiarum Naturalium Universitatis Sunyatseni 61, 39–54. doi:10.13471/j.cnki.acta.snus.2021d044
Cheng, P., Gao, S., and Bokuniewicz, H. (2004). Net Sediment Transport Patterns over the Bohai Strait Based on Grain Size Trend Analysis. Estuarine, Coastal Shelf Sci. 60, 203–212. doi:10.1016/j.ecss.2003.12.009
Dietze, E., Hartmann, K., Diekmann, B., IJmker, J., Lehmkuhl, F., Opitz, S., et al. (2012). An End-Member Algorithm for Deciphering Modern Detrital Processes from lake Sediments of Lake Donggi Cona, NE Tibetan Plateau, China. Sediment. Geology. 243-244, 169–180. doi:10.1016/j.sedgeo.2011.09.014
Dietze, E., Maussion, F., Ahlborn, M., Diekmann, B., Hartmann, K., Henkel, K., et al. (2014). Sediment Transport Processes across the Tibetan Plateau Inferred from Robust Grain-Size End Members in lake Sediments. Clim. Past 10, 91–106. doi:10.5194/cp-10-91-2014
Fang, G., Fang, W., Fang, Y., and Wang, K. (1998). A Survey of Studies on the South China Sea Upper Ocean Circulation. Acta Oceanographica Taiwanica 37, 1
Fang, G., Wang, Y., Wei, Z., Fang, Y., Qiao, F., and Hu, X. (2009). Interocean Circulation and Heat and Freshwater Budgets of the South China Sea Based on a Numerical Model. Dyn. Atmospheres Oceans 47, 55–72. doi:10.1016/j.dynatmoce.2008.09.003
Feng, S., Liu, Z., Sompongchaiyakul, P., Lin, B., and Wiesner, M. (2022). Grain Size Characteristics of Terrigenous Clastics in Surface Sediments of the Gulf of Thailand and Their Significance for Sedimentary Dynamic Environment. Earth Sci. Front. doi:10.13745/j.esf.sf.2022.1.18
Flemming, B. W. (1988). “Process and Pattern of Sediment Mixing in a Microtidal Coastal Lagoon along the West Coast of South Africa,” in Tide-influenced Sedimentary Environments and Facies. Editors P. L. D. Boer, A. V. Gelder, and S. D. Nio (Dordrecht: D. Reidel Publishing Company), 275–288. doi:10.1007/978-94-015-7762-5_20
Flemming, B. W. (2007). The Influence of Grain-Size Analysis Methods and Sediment Mixing on Curve Shapes and Textural Parameters: Implications for Sediment Trend Analysis. Sediment. Geology. 202, 425–435. doi:10.1016/j.sedgeo.2007.03.018
Folk, R. L., and Ward, W. C. (1957). Brazos River Bar [Texas]; a Study in the Significance of Grain Size Parameters. J. Sediment. Res. 27, 3–26. doi:10.1306/74D70646-2B21-11D7-8648000102C1865D
Franke, D., Savva, D., Pubellier, M., Steuer, S., Mouly, B., Auxietre, J.-L., et al. (2014). The Final Rifting Evolution in the South China Sea. Mar. Pet. Geology. 58, 704–720. doi:10.1016/j.marpetgeo.2013.11.020
Gan, J., Liu, Z., and Hui, C. R. (2016). A Three-Layer Alternating Spinning Circulation in the South China Sea. J. Phys. Oceanogr. 46, 2309–2315. doi:10.1175/JPO-D-16-0044.1
Gao, S. (1996). A Fortran Program for Grain-Size Trend Analysis to Define Net Sediment Transport Pathways. Comput. Geosciences 22, 449–452. doi:10.1016/0098-3004(95)00100-X
Gao, S., and Collins, M. B. (1994). Analysis of Grain Size Trends, for Defining Sediment Transport Pathways in marine Environments. J. Coastal Res. 10, 70–78. doi:10.2307/4298194
Gao, S., Collins, M. B., Lanckneus, J., De Moor, G., and Van Lancker, V. (1994). Grain Size Trends Associated with Net Sediment Transport Patterns: An Example from the Belgian continental Shelf. Mar. Geology. 121, 171–185. doi:10.1016/0025-3227(94)90029-9
Gao, S., and Collins, M. B. (1992). Net Sediment Transport Patterns Inferred from Grain-Size Trends, Based upon Definition of “Transport Vectors”. Sediment. Geol. 81 (1-2), 47–60. doi:10.1016/0037-0738(92)90055-v
Gao, S. (2009). Grain Size Trend Analysis: Principle and Applicability. Acta Sediment. Sin. 27, 826–836. doi:10.14027/j.cnki.cjxb.2009.05.006
Gerald M. Friedman, G. M. (1961). Distinction between Dune, beach, and River Sands from Their Textural Characteristics. Sepm Jsr Vol. 31, 514–529. doi:10.1306/74D70BCD-2B21-11D7-8648000102C1865D
Gerald M. Friedman, G. M. (1967). Dynamic Processes and Statistical Parameters Compared for Size Frequency Distribution of beach and River Sands. Sepm Jsr Vol. 37, 327–354. doi:10.1306/74D716CC-2B21-11D7-8648000102C1865D
Ha, H. J., Chang, T. S., and Ha, H. K. (2021). Using End-Member Analysis to Determine Sediment Dispersal and Depositional Processes on the Heuksan Mud belt, Southwest Korean Shelf. Geo-mar Lett. 41, 1–13. doi:10.1007/s00367-020-00672-6
Hamann, Y., Ehrmann, W., Schmiedl, G., Krüger, S., Stuut, J.-B., and Kuhnt, T. (2008). Sedimentation Processes in the Eastern Mediterranean Sea during the Late Glacial and Holocene Revealed by End-Member Modelling of the Terrigenous Fraction in marine Sediments. Mar. Geology. 248, 97–114. doi:10.1016/j.margeo.2007.10.009
Heslop, D., von Dobeneck, T., and Höcker, M. (2007). Using Non-negative Matrix Factorization in the "unmixing" of Diffuse Reflectance Spectra. Mar. Geology. 241, 63–78. doi:10.1016/j.margeo.2007.03.004
Hu, J., Kawamura, H., Hong, H., and Qi, Y. (2000). A Review on the Currents in the South China Sea: Seasonal Circulation, South China Sea Warm Current and Kuroshio Intrusion. J. Oceanography 56, 607–624. doi:10.1023/A:1011117531252
Huang, H., He, E., Qiu, X., Guo, X., Fan, J., and Zhang, X. (2019). Insights about the Structure and Development of Zhongsha Bank in the South China Sea from Integrated Geophysical Modelling. Int. Geology. Rev. 62, 1070–1080. doi:10.1080/00206814.2019.1653798
Huang, H., Klingelhoefer, F., Qiu, X., Li, Y., and Wang, P. (2021). Seismic Imaging of an Intracrustal Deformation in the Northwestern Margin of the South China Sea: the Role of a Ductile Layer in the Crust. Tectonics 40, e2020TC006260. doi:10.1029/2020TC006260
Huang, J. (1987). Features of the Zhongsha Atoll in the South China Sea. Mar. Geo. Quatern Geo. 7, 21–24. doi:10.16562/j.cnki.0256-1492.1987.02.004
Huang, X., Betzler, C., Wu, S., Bernhardt, A., Eagles, G., Han, X., et al. (2020). First Documentation of Seismic Stratigraphy and Depositional Signatures of Zhongsha Atoll (Macclesfield Bank), South China Sea. Mar. Pet. Geology. 117, 104349. doi:10.1016/j.marpetgeo.2020.104349
John R. Hails, J. R. (1967). Significance of Statistical Parameters for Distinguishing Sedimentary Environments in New South Wales, Australia. Sepm Jsr Vol. 37, 1059–1069. doi:10.1306/74D71834-2B21-11D7-8648000102C1865D
Lan, J., Wang, Y., Cui, F., and Zhang, N. (2015). Seasonal Variation in the South China Sea Deep Circulation. J. Geophys. Res. Oceans 120, 1682–1690. doi:10.1002/2014JC010413
Li, C.-F., Xu, X., Lin, J., Sun, Z., Zhu, J., Yao, Y., et al. (2014). Ages and Magnetic Structures of the South China Sea Constrained by Deep Tow Magnetic Surveys and IODP Expedition 349. Geochem. Geophys. Geosyst. 15, 4958–4983. doi:10.1002/2014GC005567
Li, T., and Li, T.-J. (2018). Sediment Transport Processes in the Pearl River Estuary as Revealed by Grain-Size End-Member Modeling and Sediment Trend Analysis. Geo-mar. Lett. 38, 167–178. doi:10.1007/s00367-017-0518-2
Li, Y., Huang, H., Grevemeyer, I., Qiu, X., Zhang, H., and Wang, Q. (2021). Crustal Structure beneath the Zhongsha Block and the Adjacent Abyssal Basins, South China Sea: New Insights into Rifting and Initiation of Seafloor Spreading. Gondwana Res. 99, 53–76. doi:10.1016/j.gr.2021.06.015
Liang, J., Liu, J., Xu, G., and Chen, B. (2020). Grain-size Characteristics and Net Transport Patterns of Surficial Sediments in the Zhejiang Nearshore Area, East China Sea. Oceanologia 62, 12–22. doi:10.1016/j.oceano.2019.06.002
Liu, J. T., Liu, K.-j., and Huang, J. C. (2002). The Effect of a Submarine canyon on the River Sediment Dispersal and Inner Shelf Sediment Movements in Southern Taiwan. Mar. Geology. 181, 357–386. doi:10.1016/S0025-3227(01)00219-5
Liu, T., Shi, X., Li, C., and Yang, G. (2012). The Reverse Sediment Transport Trend between Abandoned Huanghe River (Yellow River) Delta and Radial Sand Ridges along Jiangsu Coastline of China-an Evidence from Grain Size Analysis. Acta Oceanol. Sin. 31, 83–91. doi:10.1007/s13131-012-0255-3
Liu, X., Wei, G., Zou, J., Guo, Y., Ma, J., Chen, X., et al. (2018). Elemental and Sr‐Nd Isotope Geochemistry of Sinking Particles in the Northern South China Sea: Implications for Provenance and Transportation. J. Geophys. Res. Oceans 123, 9137–9155. doi:10.1029/2018JC014312
Lüdmann, T., Wong, H. K., and Berglar, K. (2005). Upward Flow of North Pacific Deep Water in the Northern South China Sea as Deduced from the Occurrence of Drift Sediments. Geophys. Res. Lett. 32, L05614. doi:10.1029/2004gl021967
Ma, F., Wang, Y., Li, Y., Ye, C., Xu, Z., and Zhang, F. (2010). The Application of Geostatistics in Grain Size Trend Analysis: a Case Study of Eastern Beibu Gulf. J. Geogr. Sci. 20, 77–90. doi:10.1007/s11442-010-0077-1
McCave, I. N. (1978). Grain-size Trends and Transport along Beaches: Example from Eastern England. Mar. Geology. 28, M43–M51. doi:10.1016/0025-3227(78)90092-0
McManus, J. (1988). “Grain Size Determination and Interpretation,” in Techniques in Sedimentology. Editor M. Trucker (Oxford: Blackwell), 36–85.
Middleton, G. V. (1976). Hydraulic Interpretation of Sand Size Distributions. J. Geology. 84, 405–426. doi:10.2307/3006605910.1086/628208
Moore, A. L., McAdoo, B. G., and Ruffman, A. (2007). Landward Fining from Multiple Sources in a Sand Sheet Deposited by the 1929 Grand Banks Tsunami, Newfoundland. Sediment. Geology. 200, 336–346. doi:10.1016/j.sedgeo.2007.01.012
Moreno, A., Cacho, I., Canals, M., Prins, M. A., Sánchez-Goñi, M.-F., Grimalt, J. O., et al. (2002). Saharan Dust Transport and High-Latitude Glacial Climatic Variability: the Alboran Sea Record. Quat. Res. 58, 318–328. doi:10.1006/qres.2002.2383
Paterson, G. A., and Heslop, D. (2015). New Methods for Unmixing Sediment Grain Size Data. Geochem. Geophys. Geosyst. 16, 4494–4506. doi:10.1002/2015GC006070
Patrick McLaren, P. (1981). An Interpretation of Trends in Grain Size Measures. Sepm Jsr Vol. 51, 611–624. doi:10.1306/212F7CF2-2B24-11D7-8648000102C1865D
Patrick McLaren, Donald Bowles, P., and Bowles, D. (1985). The Effects of Sediment Transport on Grain-Size Distributions. Sepm Jsr Vol. 55, 457–470. doi:10.1306/212f86fc-2b24-11d7-8648000102c1865d
Plomaritis, T. A., Paphitis, D., and Collins, M. (2008). The Use of Grain Size Trend Analysis in Macrotidal Areas with Breakwaters: Implications of Settling Velocity and Spatial Sampling Density. Mar. Geology. 253, 132–148. doi:10.1016/j.margeo.2008.05.003
Prins, M. A., and Weltje, G. J. (1999). “End-Member Modeling of Siliciclastic Grain-Size DistributionsThe Late Quaternary Record of Eolian and Fluvial Sediment Supply to the Arabian Sea and its Paleoclimatic Significance,” in Numerical Experiments in Stratigraphy: Recent Advances in Stratigraphic and Sedimentologic Computer Simulations. Editors J. Harbaugh, L. Waney, G. Rankey, R. Slingerland, R. Goldstein, E. Franseenet al. (SEPM special publication), 63, 91–111. doi:10.2110/pec.99.62.0091
Qu, T., Girton, J. B., and Whitehead, J. A. (2006). Deepwater Overflow through Luzon Strait. J. Geophys. Res. 111, C01002. doi:10.1029/2005JC003139
Qu, T. (2000). Upper-Layer Circulation in the South China Sea*. J. Phys. Oceanogr. 30, 14502–21460. doi:10.1175/1520-0485(2000)0302.0.CO10.1175/1520-0485(2000)030<1450:ulcits>2.0.co;2
Sánchez, A., Shumilin, E., and Rodríguez-Figueroa, G. (2019). Sediment Transport Patterns Inferred from Grain Size Trends and Trace Metal Dispersion Near the Santa Rosalía Mining District, Gulf of California. Sediment. Geology. 380, 158–163. doi:10.1016/j.sedgeo.2018.12.006
Shu, Y., Xue, H., Wang, D., Chai, F., Xie, Q., Yao, J., et al. (2014). Meridional Overturning Circulation in the South China Sea Envisioned from the High-Resolution Global Reanalysis Data GLBa0.08. J. Geophys. Res. Oceans 119, 3012–3028. doi:10.1002/2013JC009583
Su, Q., Peng, C., Yi, L., Huang, H., Liu, Y., Xu, X., et al. (2016). An Improved Method of Sediment Grain Size Trend Analysis in the Xiaoqinghe Estuary, Southwestern Laizhou Bay, China. Environ. Earth Sci. 75, 1185. doi:10.1007/s12665-016-5924-7
Sun, D., Bloemendal, J., Rea, D. K., Vandenberghe, J., Jiang, F., An, Z., et al. (2002). Grain-size Distribution Function of Polymodal Sediments in Hydraulic and Aeolian Environments, and Numerical Partitioning of the Sedimentary Components. Sediment. Geology. 152, 263–277. doi:10.1016/S0037-0738(02)00082-9
Taylor, B., and Hayes, D. E. (1983). Origin and History of the South China Sea basin. Geophys. Monogr. 27, 23–56. doi:10.1029/GM027p0023
Venkatramanan, S., Chung, S. Y., Ramkumar, T., and Park, N. (2014). Grain Size Trend and Hydrodynamic Condition of Tirumalairajan River Estuary, East Coast of India. Oceanology 54, 532–540. doi:10.1134/s0001437014040134
Wang, A., Du, Y., Peng, S., Liu, K., and Huang, R. X. (2018). Deep Water Characteristics and Circulation in the South China Sea. Deep Sea Res. Part Oceanographic Res. Pap. 134, 55–63. doi:10.1016/j.dsr.2018.02.003
Wang, C., Chen, M., Qi, H., Intasen, W., and Kanchanapant, A. (2020). Grain-Size Distribution of Surface Sediments in the Chanthaburi Coast, Thailand and Implications for the Sedimentary Dynamic Environment. Jmse 8, 242. doi:10.3390/jmse8040242
Wang, G., Xie, S.-P., Qu, T., and Huang, R. X. (2011). Deep South China Sea Circulation. Geophys. Res. Lett. 38, a–n. doi:10.1029/2010GL046626
Weltje, G. J. (1997). End-member Modeling of Compositional Data: Numerical-Statistical Algorithms for Solving the Explicit Mixing Problem. Math. Geol. 29, 503–549. doi:10.1007/BF02775085
Weltje, G. J., and Prins, M. A. (2007). Genetically Meaningful Decomposition of Grain-Size Distributions. Sediment. Geology. 202, 409–424. doi:10.1016/j.sedgeo.2007.03.007
Weltje, G. J., and Prins, M. A. (2003). Muddled or Mixed? Inferring Palaeoclimate from Size Distributions of Deep-Sea Clastics. Sediment. Geology. 162, 39–62. doi:10.1016/S0037-0738(03)00235-5
Wentworth, C. K. (1922). A Scale of Grade and Class Terms for Clastic Sediments. J. Geology. 30, 377–392. doi:10.1086/622910
Xue, H., Chai, F., Pettigrew, N., Xu, D., Shi, M., and Xu, J. (2004). Kuroshio Intrusion and the Circulation in the South China Sea. J. Geophys. Res. 109, C02017. doi:10.1029/2002JC001724
Yamashita, S., Naruse, H., and Nakajo, T. (2018). Reconstruction of Sediment-Transport Pathways on a Modern Microtidal Coast by a New Grain-Size Trend Analysis Method. Prog. Earth Planet. Sci. 5, 1–18. doi:10.1186/s40645-018-0166-9
Yang, H., Liu, Q., Liu, Z., Wang, D., and Liu, X. (2002). A General Circulation Model Study of the Dynamics of the Upper Ocean Circulation of the South China Sea. J. Geophys. Res. 107 (C7), 3085. doi:10.1029/2001JC001084
Yu, S.-Y., Colman, S. M., and Li, L. (2016). BEMMA: a Hierarchical Bayesian End-Member Modeling Analysis of Sediment Grain-Size Distributions. Math. Geosci. 48, 723–741. doi:10.1007/s11004-015-9611-0
Yu, X., Li, T., Gu, D., Feng, A., Liu, S., Li, P., et al. (2019). Sediment Transport in the Luanhe River delta: Grain Size Trend Analysis. J. Ocean. Limnol. 37, 982–997. doi:10.1007/s00343-019-8156-3
Zhang, W., Zheng, J., Xiaomei, J., Hoitink, A. J. F., van der Vegt, M., and Zhu, Y. (2013). Surficial Sediment Distribution and the Associated Net Sediment Transport Pattern Retain-->in the Pearl River Estuary, South China. Continental Shelf Res. 61-62, 41–51. doi:10.1016/j.csr.2013.04.011
Zheng, H., Zhang, C., Zhao, R., Zhu, X. H., Zhu, Z. N., Liu, Z. J., et al. (2021). Structure and Variability of Abyssal Current in Northern South China Sea Based on CPIES Observations. J. Geophys. Res. Oceans 126, 16780. doi:10.1029/2020JC016780
Zhou, C., Zhao, W., Tian, J., Zhao, X., Zhu, Y., Yang, Q., et al. (2017). Deep Western Boundary Current in the South China Sea. Sci. Rep. 7. doi:10.1038/s41598-017-09436-2
Keywords: grain size, end-members, sedimentary dynamics, transport trends, isolated carbonate platforms, distal margin, South China Sea
Citation: Chen J, Wu S, Liu S, Chen W, Qin Y and Wan X (2022) Sedimentary Dynamics in the Distal Margin Around Isolated Carbonate Platforms of the Northern South China Sea. Front. Earth Sci. 10:884921. doi: 10.3389/feart.2022.884921
Received: 27 February 2022; Accepted: 11 April 2022;
Published: 10 May 2022.
Edited by:
Xiting Liu, Ocean University of China, ChinaReviewed by:
Selvaraj Kandasamy, Xiamen University, ChinaYongjian Yao, Guangzhou Marine Geological Survey, China
Copyright © 2022 Chen, Wu, Liu, Chen, Qin and Wan. This is an open-access article distributed under the terms of the Creative Commons Attribution License (CC BY). The use, distribution or reproduction in other forums is permitted, provided the original author(s) and the copyright owner(s) are credited and that the original publication in this journal is cited, in accordance with accepted academic practice. No use, distribution or reproduction is permitted which does not comply with these terms.
*Correspondence: Shiguo Wu, swu@idsse.ac.cn; Xiaoming Wan, daozhong09@163.com