Improving Carbonate Equilibria-Based Estimation of pCO2 in Anthropogenically Impacted River Systems
 Omme K. Nayna
 Most Shirina Begum
 Lishan Ran
 Ji-Hyung Park
- 1Department of Environmental Science and Engineering, Ewha Womans University, Seoul, South Korea
- 2Department of Geography, The University of Hong Kong, Pokfulam, Hong Kong, China
Estimating riverine carbon dioxide (CO2) emissions has been constrained by lacking field measurements of the partial pressure of CO2 (pCO2) and inaccuracies in calculating pCO2 using carbonate equilibria-based models such as CO2SYS. To evaluate potential errors in applying the carbonate equilibria-based pCO2 calculation to river systems affected by monsoon rainfall and water pollution, we compared pCO2 values calculated using CO2SYS and those measured by headspace equilibration in five Asian rivers (Ganges, Mekong, Yangtze, Yellow, and Han rivers) undergoing various water pollution stages. Across the five rivers, calculated and measured pCO2 values exhibited larger discrepancies during the monsoon season, particularly in the low pH range, while in the Han River mismatches were also noticeable during the dry season. In the Han River, pH was negatively correlated with dissolved organic carbon (DOC) during the monsoon, indicating organic acids flushed from soils during rainfalls as a key factor for overestimated pCO2 at sites with low pH and alkalinity, whereas dry-season overestimation of pCO2 may be ascribed to non-carbonate alkalinity including organic acids and inorganic anions delivered by wastewater effluents or sporadic rainfalls. The four large rivers exhibited a positive correlation between pH and DOC in tributaries during the monsoon season, indicating that DOC flushed from soils may be diluted by monsoonal floods to such a degree as to exert little influence on pH and hence pCO2. Therefore, the monsoonal overestimation of pCO2 at sites with low pH and alkalinity warrants further investigation of other factors than non-carbonate alkalinity to explain the increased sensitivity of pCO2 to subtle changes in acidity and buffering. These results illustrate the importance of direct measurements of pCO2 in highly polluted rivers, especially during the monsoon season. For river systems lacking pCO2 measurements, we suggest that carbonate equilibria-based models be complemented with corrective measures: 1) presenting pCO2 values calculated from low pH values (pH < 6.5 for monsoon and pH < 6.3 for dry season) together with the pH range to warn potential overestimation; 2) using pre-established regressions between measured pCO2 and environmental variables to correct pCO2 values, particularly during wet periods when large changes in pH and acid buffering are expected.
1 Introduction
Inland waters have been recognized as important sources of carbon dioxide (CO2) and other greenhouse gases (GHGs), as highlighted by recent regional and global syntheses (Raymond et al., 2013; Borges et al., 2015; Lauerwald et al., 2015; Park et al., 2018). Inland waters play a crucial role in the global carbon cycle by storing, transporting, or transforming carbon (C) in the form of inorganic or organic C in the terrestrial-aquatic-atmosphere continuum (Cole et al., 2007); however, these synthesis efforts have been limited by the lack of spatially resolved datasets (Raymond et al., 2013; Lauerwald et al., 2015; Park et al., 2018). Various direct and indirect methods have been employed to measure or calculate the aquatic partial pressure of CO2 (pCO2) (Park, 1969; Smethie et al., 1985; Kling et al., 1992; Pierrot et al., 2006; Yoon et al., 2016). Due to the lack of direct measurements of pCO2, many studies on CO2 emissions from inland waters depend on calculated pCO2 using carbonate equilibria (Butman and Raymond, 2011; Raymond et al., 2013; Lauerwald et al., 2015; Park et al., 2018). Although this carbonate equilibria-based pCO2 calculation has been widely used to estimate regional and global CO2 emissions from inland waters, considerable concerns exist about potential errors associated with such calculations. The estimation accuracy of pCO2 and CO2 emissions needs to be improved by employing proper corrective measures under specific conditions, for instance, where large changes in pH and acid buffering are expected (Liu et al., 2020).
Direct measurements of pCO2 are based on the gas equilibration between the water and air phases (headspace equilibration method) or continuous measurements using various systems and devices, including membrane-enclosed CO2 sensors and automated equilibrators (Yoon et al., 2016). Carbonate equilibria-based methods for estimating pCO2 use combinations of related water quality parameters, including pH, total alkalinity (TA), dissolved inorganic carbon (DIC), and water temperature (Park, 1969; Lewis and Wallace, 1998). Constants used for pCO2 calculation in freshwater systems include those for the carbonic acid dissociation (Millero, 1979) and CO2 solubility (Weiss, 1974), both of which are dependent on temperature.
The potential bias in the calculated pCO2 relative to the measured one may arise from inaccuracies of these multiple parameters. Frankignoulle and Borges (2001) provided the first comparison between the pCO2 calculated from pH and TA and pCO2 measured by an equilibrator coupled to an IR analyzer in an estuary in Belgium. They observed a relatively good agreement between the two approaches under the conditions of high TA (2,500–4,800 μeq L−1) and pH (>7.4). The concomitant measurements of pH, TA, and pCO2 in acidic and organic-rich waters of the Sinnamary River in French Guiana exhibited extremely high values of estimated pCO2 under the conditions of pH at 5 and TA at 200 μeq L−1, compared to pCO2 values directly measured using the headspace equilibration technique (Abril et al., 2005; Abril et al., 2006). This overestimation in pCO2 indicates the contribution of organic acids to TA. Organic acids in DOC can significantly contribute to TA not only in the polluted rivers, but also in the organic-rich, unpolluted rivers, resulting in overestimation of calculated pCO2 (Hunt et al., 2011; Wang et al., 2013). Abril et al. (2015) warned that in acidic, poorly buffered,and organic-rich freshwaters pCO2 can be overestimated by 50–300% when compared to direct pCO2 measurements. Recently, Golub et al. (2017) have also reported potential biases in pCO2 calculated using carbonate equilibria (pH-TA), due to influences of organic acids and ionic strengths in freshwater systems. While the calculation method works well in systems with typical pH range (e.g., pH > 7) and alkalinity (e.g., TA>1,000 μeq L−1) (Abril et al., 2015; Liu et al., 2016), potential overestimation of pCO2 has been found in systems with low pH and alkalinity (Hunt et al., 2011; Abril et al., 2015; Liu et al., 2020). Calculated and measured pCO2 values exhibited larger discrepancies during floods, particularly in the low pH range (e.g., pH < 8), resulting in overestimation of pCO2 (Abril et al., 2015). In the large rivers across Asia, seasonal variations in carbonate equilibria regimes have been associated with the monsoon climate, because heavy monsoonal rainfalls can dilute river water TA and decrease pH, resulting in overestimation of pCO2 under conditions of low pH and alkalinity (Li et al., 2013; Manaka et al., 2015; Ran et al., 2015).
The calculation of pCO2 from water quality data could not only provide useful data for estimating regional and global riverine CO2 emissions but also help to reconstruct long-term changes in pCO2, as conducted for a large number of rivers in China (Ran et al., 2021). This study aimed to improve the prediction capability of the carbonate equilibria-based pCO2 model by comparing calculated and measured pCO2 with associated water quality measurements in the mainstem, tributaries, and/or wastewater drains of the Ganges, Mekong, Yangtze, Yellow, and Han River during both monsoon and dry seasons. We compared the values of pCO2 calculated using CO2SYS with pCO2 measurements from seasonal field measurements across various locations in the five river basins. In the case of the Han River in Korea, more frequent measurements in the mainstem, tributaries, and wastewater effluents during both dry and monsoon seasons were separately analyzed to evaluate the effects of both monsoon and sporadic, dry-season rainfalls on seasonal differences in pCO2 and associated water quality components. This study provides the first comprehensive comparison of the calculated and measured pCO2 values between monsoon and dry seasons in multiple Asian river basins under elevating anthropogenic pressures (Figure 1). We postulate that riverine CO2 emissions can be overestimated if values of pCO2 are calculated from low-pH and low-alkaline river systems without proper corrections. Specifically, we tested the hypothesis that increasing inputs of soil-derived organic acids during monsoonal floods can decrease pH and dilute TA in the river water, causing potential pCO2 overestimation. In contrast, increasing discharge of untreated or poorly treated wastewater may not only alter the composition of the riverine organic matter (OM) but also increase the pH and TA during dry periods due to lack of dilution in river water.
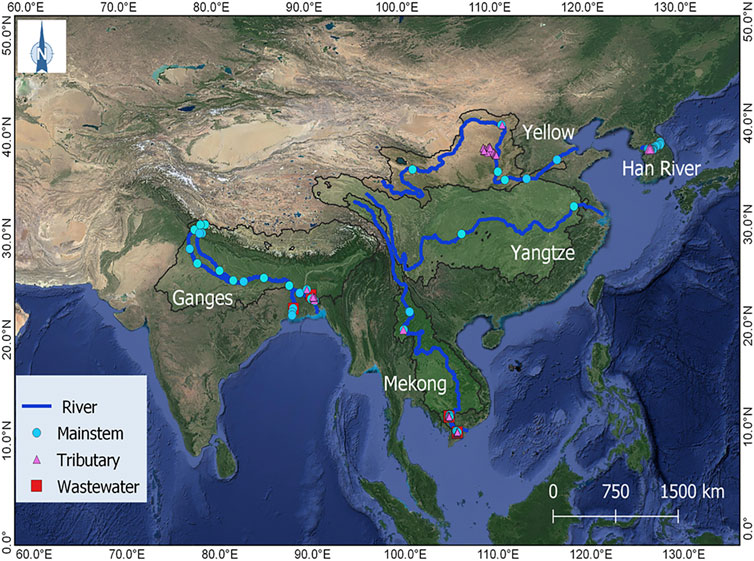
FIGURE 1. Study map showing the sampling sites across the mainstems, tributaries, and polluted urban tributaries or wastewater effluents of four large rivers (the Ganges, Mekong, Yangtze, and Yellow River) and a smaller, urbanized river system in Korea (the Han River).
2 Methods
2.1 Study Sites
We compared pCO2 measurements with values of pCO2 calculated from the concomitant water quality measurements in five Asian rivers—the Ganges, Mekong, Yangtze, Yellow, and Han River (Figure 1). The Ganges, Mekong, Yangtze, and Yellow River all originate from the Himalayan-Tibetan Plateau, draining some of the largest watersheds in the world (Milliman and Farnsworth, 2011). These river systems share certain common hydrological and demographic characteristics, such as intense monsoon-driven seasonality of flow and high population density along their banks (Park et al., 2018). The Ganges River is 2,515 km long, flowing from the Himalayas through India, Nepal, and Bangladesh to the Bay of Bengal, with a drainage area of 1,050 × 103 km2 (Meybeck and Ragu, 2012). The Mekong River is 4,800 km long, flowing from the Tibetan Plateau through six countries to the South China Sea, with a drainage area of 800 × 103 km2 (Milliman and Farnsworth, 2011). The 5,500 km long Yellow River flows from the Tibetan Plateau through nine provinces in Northern China to the Bohai Sea, with a drainage area of 750 × 103 km2 (Milliman and Farnsworth, 2011). The Yangtze River traverses 6,380 km eastward from the Tibetan Plateau to the East China Sea, draining a total area of 1810 × 103 km2 and, covering the Sichuan Basin and Middle-Lower Reach Plains (Ran et al., 2017a). The 494 km long Han River, consisting of the North Han and South Han branches and the lower Han River, drains an area of 34 × 103 km2 in the middle of the Korean Peninsula and flows westward into the Yellow Sea (Kim et al., 2021). A large population living in this region is affected by heavy monsoon rainfalls and associated sediment transport to the floodplains. For agricultural irrigation, and domestic, or industrial purposes, people depend on river water via many dams and reservoirs being constructed on the rivers over the last few decades (Lehner et al., 2011).
Four large rivers excluding the Han River were sampled in the mainstem, tributary, and wastewater drain sites from March 2015 to July 2019 to explore spatial and seasonal variations in pCO2 and other water quality parameters (Figure 1; Supplementary Table S1). Four main branches of the Ganges traversing were considered as the mainstem, including the Yamuna and Ganga traversing the northern India and two bifurcated distributaries, namely the Hooghly in India and the Padma in Bangladesh flowing towards the Bay of Bengal. The Mekong River mainstem comprises the upper Mekong (Lancang) and the lower Mekong River. The Yangtze and Yellow River consist of a single mainstem. Sampling was conducted along the mainstems, urban tributaries, and wastewater drains within or downstream of major metropolitan areas (e.g., Kolkata and Dhaka). Measurements include water temperature, pH, TA, pCO2, and DOC. This study focused on the analysis of CO2 as well as DOC for the five river basins across Asia. Monsoonal samples were collected from 65 locations, including 22 in the Ganges, 19 in the Mekong, 2 in the Yangtze, and 22 in the Yellow River, while dry-season samples were collected from 65 locations, including 22 in the Ganges, 23 in the Mekong, and 20 in the Yellow River.
In the Han River, field surveys were repeated at various intervals from July 2014 to May 2020 to explore the spatial and seasonal variations as well as localized pollution impacts that vary longitudinally along the river. The mainstem was divided into three reaches: the upper (U), middle (M), and lower (L) reaches. Different sites along urban tributaries and effluents from a wastewater treatment plant were also sampled together with mainstem sites. Water temperature, pH, TA, pCO2, and DOC were measured at 31 locations, including 4 in the upper reaches, 7 in the middle reaches, 5 in the lower reaches, 14 in tributaries, and one discharge of a wastewater treatment plant during the monsoon (from June to September) and dry season (from October to May). It should be noted that sporadic rainfalls have been recorded during the dry season.
The data of pCO2 measured in the Ganges, Mekong, and Yellow River have been reported by Begum et al. (2021). pCO2 data measured in the Wuding River, a Yellow River tributary, have been reported by Ran et al. (2017b), while measurements in the Yangtze River in 2018 have not yet been published. While pCO2 data measured in the Han River from 2014 to 2017 have been reported by Jin et al. (2018), more recent measurements from 2018 to 2020 have not yet been published. Field surveys in the Ganges, Mekong, and Yellow River from 2016 to 2019 included concomitant measurements of water temperature, pH, TA, pCO2, and DOC (Begum et al., 2021), while field measurements in the Yangtze, Wuding, and Han River from 2014 to 2020 included simultaneous measurements of water temperature, pH, TA, pCO2, and DOC.
2.2 Sampling and In Situ Measurements
Water samples were collected at 10–20 cm below the surface. In the Ganges, Mekong, Yangtze, and Yellow rivers, water samples were directly collected using acid-washed polycarbonate bottles and immediately frozen before being transported in an icebox to the lab in Korea within a week of collection. In the Han River, water samples were collected through a peristaltic pump (Masterflex E/S, Cole-Parmer, IL, USA) into acid-washed amber glass bottles. A portable multiparameter meter (Orion 5-Star Portable, Thermo Scientific, USA) was used to measure in situ water quality parameters, such as water temperature, pH, dissolved oxygen (DO), and electrical conductivity (EC). The barometric pressure and air temperature were measured in situ using a portable sensor (Watchdog 1,650 Micro Station, Spectrum Technologies, IL, USA) or collected from the Internet (https://www.timeanddate.com/weather/).
The manual headspace equilibration method was performed on site with water samples collected from the same water depth as water samples (Yoon et al., 2016). For the headspace equilibration, a polypropylene syringe (60 ml; HSW Norm-Ject Luer Lock Tip; Henke-Sass Wolf GmbH, Germany) was used to collect a 30 ml water sample and then a 30 ml ambient air sample. At the same time, a 30 ml ambient air sample was collected in another syringe to measure the CO2 mixing ratio in ambient air separately. After vigorously shaking water and air samples in the syringe for 2 min (Yoon et al., 2016), approximately 20 ml of the equilibrated air sample was transferred to a pre-evacuated 12 ml Exetainer vial for gas analysis in the laboratory. The stored gas sample was greater than the vial volume to generate overpressure and hence minimize concentration changes associated with potential gas leakage. Vials had been flushed with high-purity N2 gas before the vial was evacuated using a pump. “Blanks” (without samples) were analyzed together with the samples to correct the effect of any remaining CO2 gases after evacuation. The gas analysis was generally completed within a month after sampling.
Continuous underway measurements of riverine pCO2 during the dry season were conducted in the lower Ganges and a tributary near Dhaka in February 2018, and in the Mekong and connected Tonle Sap around Phnom Penh in January 2017. Continuous measurements of pCO2 were conducted using a spray-type equilibrator connected to an infrared gas analyzer (IRGA; LI820, Li-Cor, USA), as described by Yoon et al. (2016) (Table 1).
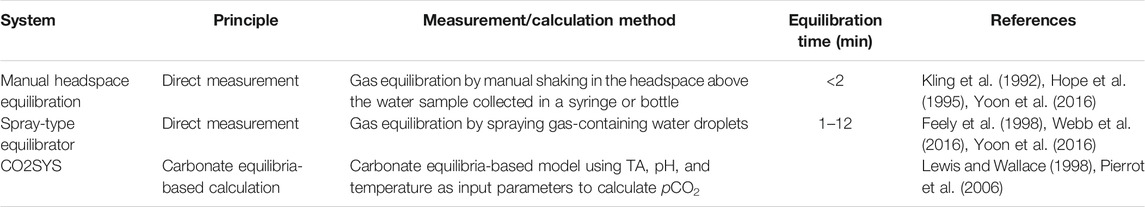
TABLE 1. Summary of the partial pressure of CO2 (pCO2) methods used in this study, including manual headspace equilibration, automated equilibration, and CO2SYS (carbonate equilibria-based model).
2.3 Laboratory Analyses
CO2 concentrations in equilibrated and ambient air samples were measured using gas chromatography (GC; 7890A, Agilent, USA) (Jin et al., 2018). Measured gas concentrations in equilibrated and ambient air samples were used together with the barometric pressure and water temperature to calculate pCO2 and dissolved CO2 concentrations based on Henry’s law (Hudson, 2004).
Water samples were filtered using pre-combusted (450°C) glass fiber filters (GF/F, Whatman; nominal pore size 0.7 µm) in the laboratory, and filtered water samples were then analyzed for DOC and TA. The concentration of DOC was measured by a total organic carbon (TOC) analyzer using high-temperature combustion of OM followed by thermal detection of CO2 (TOC-VCPH, Shimadzu, Japan). TA was measured with 40–80 ml filtered samples using an automated electric titrator (EasyPlus Titrator Easy pH, Metrohm, Switzerland) based on the Gran titration method. To determine the equivalence point at pH between 3 and 4, a strong acid (0.1 N HCl) was used for the titration (Gran, 1952). As part of quality assurance, duplicate analyses of DOC and pCO2 were performed for approximately 10% of all analyzed samples, while triplicate analyses of TA were conducted for the same samples. Standards with known concentrations and ultrapure water were analyzed for each batch of ten samples to determine instrumental stability and accuracy. The relative standard deviation for replicate measurements of DOC and TA was ≤5%.
2.4 pCO2 Calculation From pH and TA
pCO2 was calculated using the CO2SYS program (Lewis and Wallace, 1998; Pierrot et al., 2006), which has been widely used to calculate riverine pCO2 from temperature, pH, and TA. We calculated values of pCO2 from temperature, pH, and TA, using the carbonic acid dissociation constants of Millero (1979) for freshwater systems and the CO2 solubility constant from Weiss (1974). The difference in the calculated pCO2 using this method is 2% lower than that of the PHREEQC program reported by Hunt et al. (2011). Abril et al. (2015) suggested that large discrepancies between the calculated and measured pCO2 values may not be related to differences in software or dissociation constants (Abril et al., 2015).
2.5 Statistical Analyses
The relationships between calculated pCO2 and other measured parameters, including pH, TA, and DOC were analyzed using best-fit regressions in SigmaPlot (Systat Software Inc.). Regression analysis determined the agreement between the calculated and measured pCO2 in the mainstem, tributary, and wastewater sites across the four large Asian rivers and Han River. All statistical analyses were performed after applying the Shapiro-Wilk test to examine the normal distribution of the data using SigmaPlot or R. Given the nonnormal distributions of data sets, we conducted a nonparametric t-test (Mann Whitney U test) to explore seasonal differences in pCO2, pH, TA, DOC, and water temperature for the mainstems, tributaries, wastewater drains or urban streams for each of the five Asian rivers. Statistical significance was set at p < 0.05, unless otherwise stated.
3 Results
3.1 Comparison of Measured and Calculated pCO2 in Five River Systems
Measured values of pCO2 revealed large spatial variations among mainstems, tributaries, and wastewater drains across the five river basins (Table 2). In the four large Asian rivers excluding the Han River, pCO2 varied between 224 and 34,151 µatm, with the lowest pCO2 value observed along the upper reaches of the Ganges (Table 2). The highest pCO2 of 34,151 µatm was observed in wastewater drains of the Mekong basin during the dry season. In the Han River basin, pCO2 varied between 43 µatm and 13,094 µatm, with the mean pCO2 increasing downstream along the mainstem as affected by higher pCO2 levels in tributaries and wastewater effluents along the lower reach (Table 2). The highest pCO2 level in the Han River was measured in the wastewater effluents during a dry period.
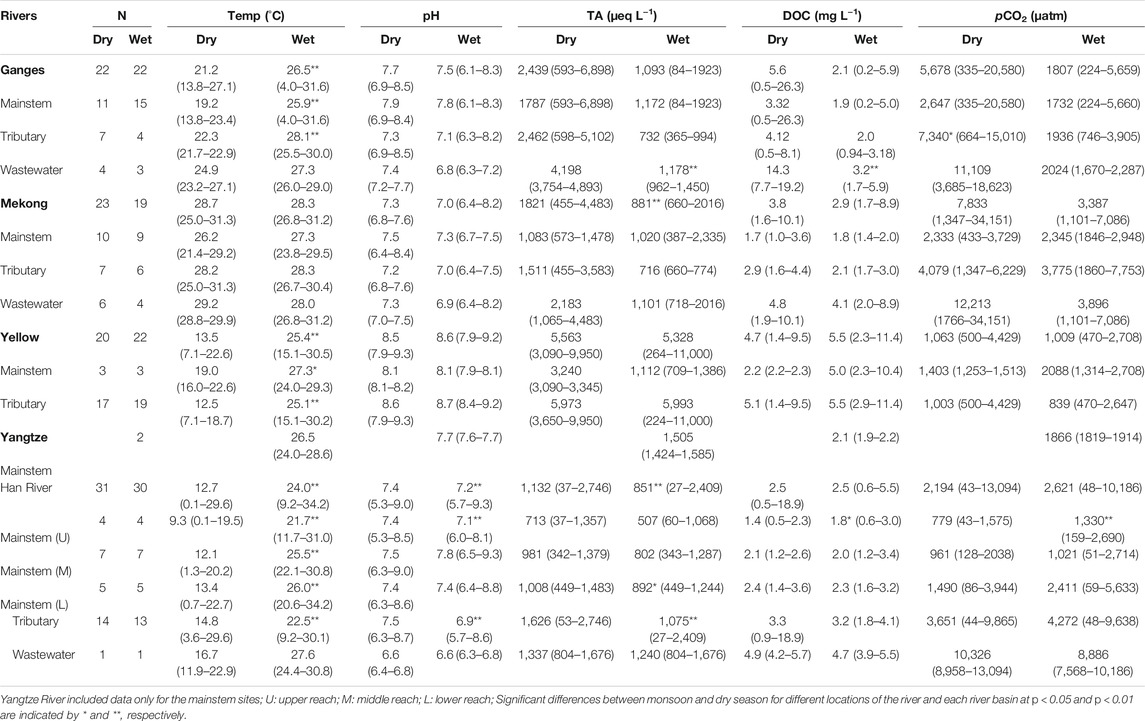
TABLE 2. Comparison of water temperature (Temp), pH, total alkalinity (TA), dissolved organic carbon (DOC), and partial pressure of CO2 (pCO2) measured in five river systems in Asia between monsoon (wet) and dry season. Values are means followed by ranges in parentheses. N represents the number of the study sites.
DOC concentrations varied between 0.2 mg L−1 and 26.3 mg L−1, with the lowest DOC observed in a headwater stream of the Ganges during the monsoon season (Table 2). The highest DOC concentration was found in the middle reach of the Yamuna that drains the Delhi metropolitan area during a dry period. The pH value varied between 3.0 and 9.3, with the lowest pH observed in the upper reach of the mainstem Han River (Table 2). The highest level of pH was found in a tributary of the Yellow River during a dry season. TA varied between 27 and 11,000 µeq L−1, the lowest TA was observed in a tributary of the Han River during a monsoon season (Table 2). The highest level of TA was observed in a tributary of the Yellow River during a monsoon season.
The comparison between calculated and measured pCO2 values in the five river basins exhibited stronger positive deviations when the pH was lower than 7 (Figure 2). Mean pCO2 deviations were higher at the sites with lower pH (<7) and TA (<500 µeq L−1) during both monsoon and dry seasons (Table 3). In the four large rivers, calculated pCO2 reached 46,476 µatm (measured pCO2: 1,670 µatm) at a pH of 6.34 at a wastewater site on the Ganges River during the monsoon season, and deviations between the calculated and measured pCO2 values ranged from −5,911 to +44,806 µatm. In the Han River basin, during the monsoon season calculated pCO2 reached 6,773,9120 µatm (measured pCO2: 1782 µatm) at a headwater stream at a low pH of 3.0; deviations between the calculated and measured pCO2 values ranged from −1,683 to +67,737,338 µatm (Figure 2B). In contrast, potential underestimations of pCO2 compared to measured pCO2 were observed in the samples with pH > 9.2 (Figure 2B). The comparison between the calculated and measured pCO2 values in the four large rivers exhibited negative deviations at wastewater sites during dry periods (Figure 3A). In contrast, the comparison between calculated and measured pCO2 values exhibited large positive deviations in the mainstems, tributaries, and wastewater sites during the monsoon season (Figure 3B). Across the Han River, the comparison between the calculated and measured pCO2 values exhibited relatively large positive deviations for the mainstem and tributary sites during dry periods (Figure 3C). For the mainstem, tributaries, and wastewater sites of the Han River, stronger positive deviations were observed during the monsoon season than during the dry season (Figures 3C,D).
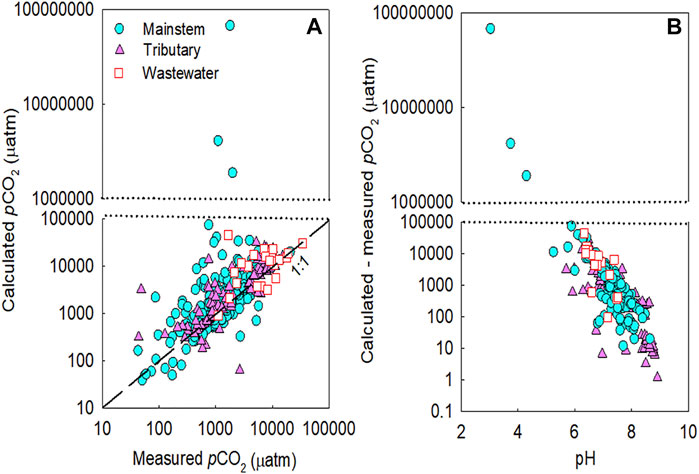
FIGURE 2. Comparison of the measured and calculated partial pressure of CO2 (pCO2) (A) and the difference between calculated and measured pCO2 as a function of pH (B) in the mainstems (M), tributaries (T), and polluted urban tributaries or wastewater effluents (W) of the five studied river basins across Asia. The studied rivers include the Ganges, Mekong, Yangtze, Yellow, and Han River. The dashed black line represents the 1:1 line.
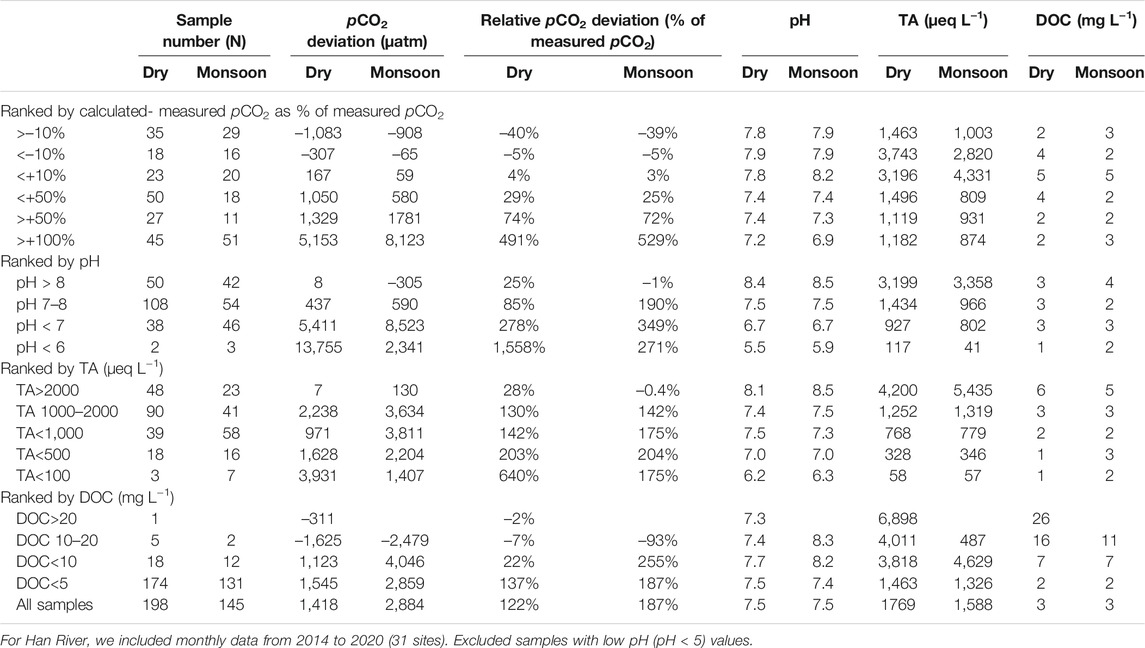
TABLE 3. Seasonal variations in the mean partial pressure of CO2 (pCO2) deviations (calculated minus measured values and their proportions in measured values), pH, total alkalinity (TA), and dissolved organic carbon (DOC) in the five Asian Rivers during the dry and monsoon (wet) seasons.
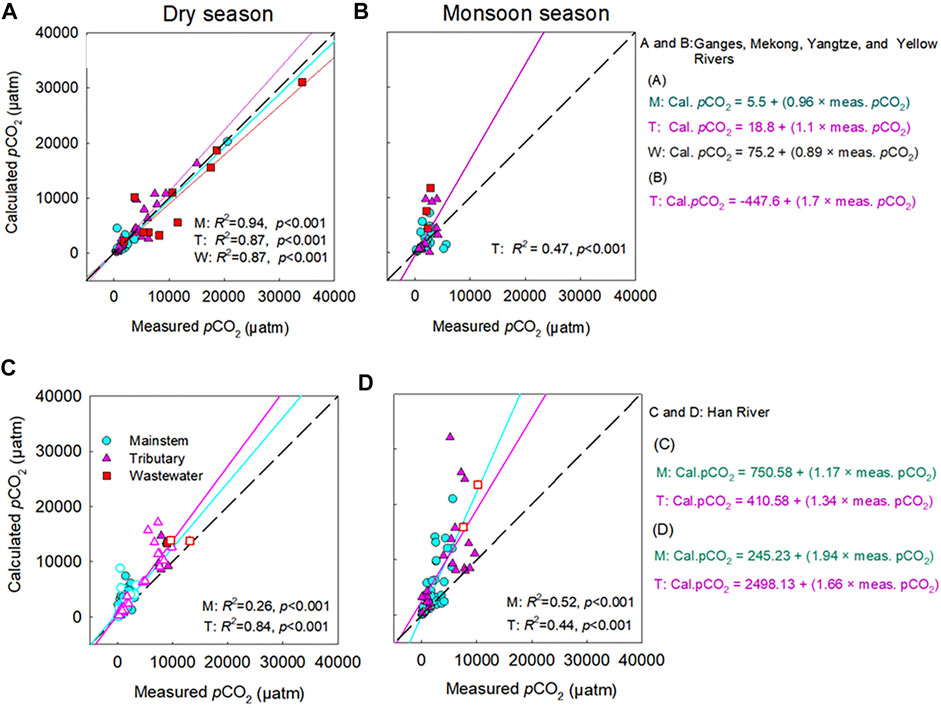
FIGURE 3. Comparison of the measured and calculated partial pressure of CO2 (pCO2) in the mainstems (M), tributaries (T), and polluted urban tributaries or wastewater effluents (W) of the four large Asian rivers [(A,B): the Ganges, Mekong, Yangtze, and Yellow River] and Han River (C,D) between the dry season (A, C) and monsoon season (B, D). For the four large rivers, 122 data points are presented from Figure 2 (excluding 8 samples with the large discrepancies between the calculated and measured values obtained at pH < 6.5 and pH < 6.3 during the monsoon and dry periods, respectively), including the mainstem (M) (n: 27 for monsoon season; 23 for dry season), tributaries (T) (n: 27 for monsoon season; 31 for dry season) and wastewater (W) (n: 4 for monsoon season; 10 for dry season) from 2015 to 2019. For the Han River, 209 data points are presented from Figure 2 (excluding 9 samples with the large discrepancies between the calculated and measured values obtained at pH < 6.4 during the dry periods), including the mainstem (M) (n: 53 for monsoon season; 81 for dry season), tributaries (T) (n: 25 for monsoon season; 44 for dry season) and wastewater (W) (n: 2 for monsoon season; 4 for dry season) from 2014 to 2020. For the Han River, dry seasonal samples are indicated by filled symbols for the months without “rainfall,” while void symbols represent the months with “sporadic rainfall.” The significant relationship (p < 0.05) is indicated by the regression line, while the dashed black line represents the 1:1 line.
3.2 Relationships Between pCO2 and Other Environmental Variables
The calculated pCO2 subtracted from the measured pCO2 were negatively correlated with pH for the mainstem, tributaries, and wastewater sites of the five river basins during both monsoon and dry seasons (p < 0.05; Figures 4, 6). Large deviations of the calculated pCO2 from the measured pCO2 were found for the samples with relatively low concentrations of DOC and TA (DOC<2.5; TA<500 µeq L−1) across various sites of the four large rivers (Figure 4). In contrast, the discrepancy between measured and calculated pCO2 is negligible for the sites with higher DOC and TA, and no trend was discernable for the calculated minus measured pCO2 with these two variables (Figure 4). Although it was weak, a significant positive correlation was found between pH and DOC (p < 0.05; Figure 5D) for the tributary sites during the monsoon season. For the mainstem sites of the Han River, the deviations of the calculated pCO2 from the measured pCO2 were positively correlated with a relatively short range of DOC concentrations from 0.64 mg L−1–3.35 mg L−1 (p < 0.001; Figure 6E), while DOC concentrations had a negative correlation with the large span of pH from 6.0 to 9.3 during the monsoon season (p < 0.05; Figure 7D).
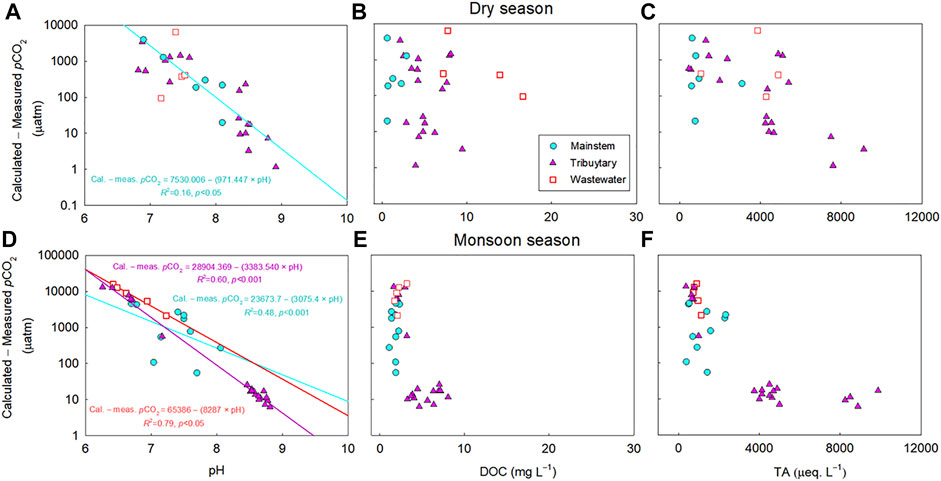
FIGURE 4. Relationships between the calculated minus measured partial pressure of CO2 (pCO2) and pH (A, D), dissolved organic carbon (DOC) (B, E), or total alkalinity (TA) (C, F) in the mainstems (M), tributaries (T), and polluted urban tributaries or wastewater effluents (W) of the four large rivers during the monsoon and dry seasons. For the four large rivers, 128 data points are presented from Figure 2 (excluding 2 extreme values exceeding 25,000 µatm during the monsoon season), including the mainstem (M) (n: 29 for monsoon season; 24 for dry season), tributaries (T) (n: 29 for monsoon season; 30 for dry season), and wastewater (W) (n: 6 for monsoon season; 10 for dry season) from 2015 to 2019. The significant relationship (p < 0.05) is indicated by a regression line through the plot. The difference between calculated pCO2 and measured pCO2 against pH was plotted in y-axis in log-scale.
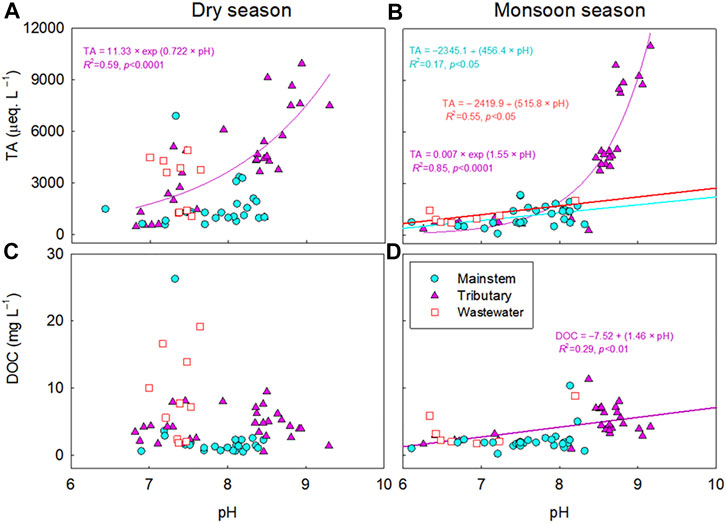
FIGURE 5. Relationships between pH and total alkalinity (TA) (A,B) or dissolved organic carbon (DOC) (C,D) in the mainstems (M), tributaries (T), and polluted urban tributaries or wastewater effluents (W) of the Ganges, Mekong, Yangtze, and Yellow River. The significant relationship (p < 0.05) for each water type during the monsoon or dry season is indicated by a regression line through the plot.
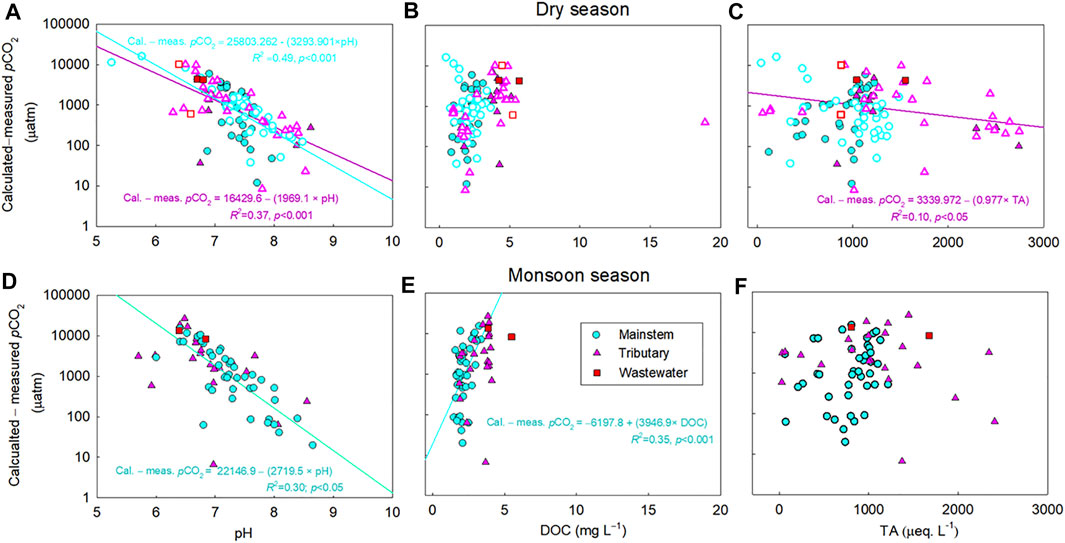
FIGURE 6. Relationships between the calculated minus measured partial pressure of CO2 (pCO2) and pH (A, D), dissolved organic carbon (DOC) (B, E), and total alkalinity (TA) (C, F) in the mainstems (M), tributaries (T), and wastewater effluents (W) of the Han River during the monsoon and dry seasons. For the Han River, 212 data points are presented from Figure 2 (excluding 6 extreme values exceeding 35,000 and 25,000 µatm during the monsoon and dry periods, respectively), including the mainstem (M) (n: 55 for monsoon season; 83 for dry season), tributaries (T) (n: 25 for monsoon season; 43 for dry season), and wastewater (W) (n: 2 for monsoon season; 4 for dry season) from 2014 to 2020. For the dry season, samples are indicated by filled symbols for the months without “rainfall,” while void symbols represent the months with “sporadic rainfall.” The significant relationship (p < 0.05) is indicated by a regression line through the plot. The difference between calculated pCO2 and measured pCO2 against pH was plotted in y-axis in log-scale.
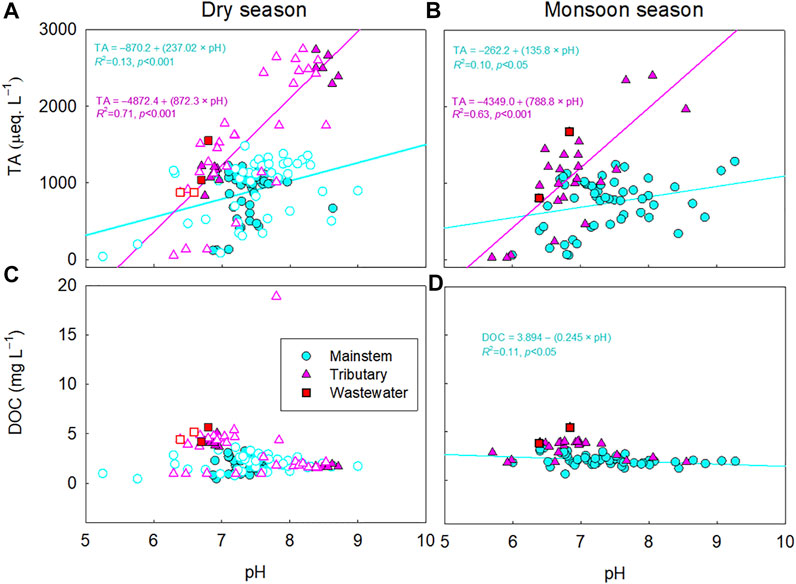
FIGURE 7. Relationships between pH and total alkalinity (TA) (A,B) or dissolved organic carbon (DOC) (C,D) in the mainstems (M), tributaries (T), and wastewater effluents (W) of the Han River during the monsoon and dry seasons. For the dry season, samples are indicated by filled symbols for the months without “rainfall,” while void symbols represent the months with “sporadic rainfall.” The significant relationship (p < 0.05) is indicated by a regression line through the plot.
A comparison between the calculated and two different measurements of pCO2 (i.e., headspace equilibration and spray-type equilibrator) was made in addition to the point samplings during the continuous underway measurement of pCO2 along the Mekong-Tonle Sap around Phnom Penh, Cambodia (in January 2017) and the Buriganga-Meghna-Ganges near Dhaka, Bangladesh (in February 2018) and exhibited very consistent results; the deviation from the 1:1 line was always less than 10% (Figure 8). Strong agreement was observed between the calculated and measured pCO2 values, obtained from the two different measurement techniques (i.e., headspace equilibration and spray-type equilibrator) during the underway measurements across the Ganges and Mekong. Both measurements exhibited strong linear relationships with the calculated values (R2 > 0.90; p < 0.001; Figure 8).
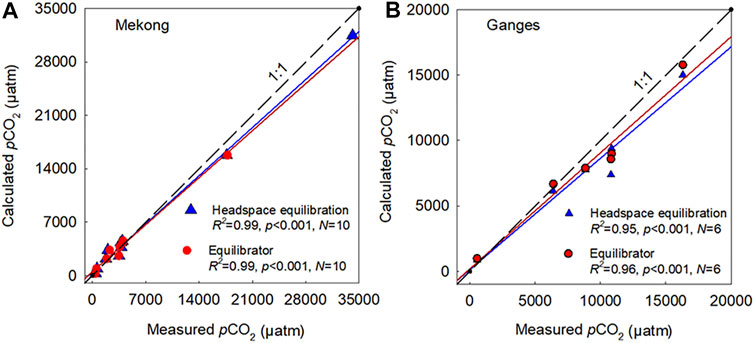
FIGURE 8. Comparison of the calculated (CO2SYS) and measured partial pressure of CO2 (pCO2) using manual headspace equilibration and spray-type equilibrator along the Mekong (A) and the Ganges (B). Manual measurements were obtained during a cruise expedition in February 2018 from 6 sampling locations along the mainstems and tributaries of the Lower Ganges near Dhaka, Bangladesh and during a cruise expedition in January 2017 from 10 sampling sites along the Mekong-Tonle Sap and urban tributaries around Phnom Penh, Cambodia.
4 Discussion
4.1 Sources of Error in Calculating pCO2
Across the five river basins, large discrepancies between the measured and calculated values of pCO2 were associated with low pH (<7), particularly during the monsoon seasons (Figures 4, 6). The significant decrease in pH across the five rivers during the monsoon season may result from acid rain (pH: 3.5–5; Kim et al., 2007), which is caused by anthropogenic S and N emissions to the atmosphere (Guo et al., 2010; Bisht et al., 2015). In the Han River basin, the significant correlation between DOC and pH (Figure 7) implies that soil-derived organic acids flushed from monsoonal floods, combined with low buffering capacity, may be responsible for the overestimation of pCO2 at sites with low pH and alkalinity (Jin et al., 2018). The observed overestimation of pCO2 at low pH is consistent with the previous findings of overestimated pCO2 in organic-rich, acid freshwater systems (Abril et al., 2005; Abril et al., 2015; Liu et al., 2020). When pCO2 is calculated from pH and TA, the freshwater TA is often assumed to be dominated by bicarbonate and carbonate (Millero, 1995). Despite this assumption, organic acids and inorganic ions such as PO43- and NH4+ can contribute significant non-carbonate alkalinity, leading to overestimated calculations of pCO2 (Supplementary Table S2; Hunt et al., 2011; Abril et al., 2015). In particular, large biases in estimating pCO2 can occur in systems with low alkalinity values (e.g., TA< 500 µeq L−1; Abril et al., 2015; Hunt et al., 2011), while pCO2 calculations from carbonate equilibria have been successfully applied to rivers and estuaries with moderate to high alkalinity (Raymond et al., 1997; Frankignoulle and Borges 2001).
In the four large river basins, lowered carbonate alkalinity during the monsoon season, combined with relatively low concentrations of DOC, implies an increased sensitivity of pCO2 calculation to the lowered carbonate alkalinity at low pH, rather than that of organic alkalinity (Hunt et al., 2011; Abril et al., 2015). A large increase in monsoonal rainfall has been shown to considerably dilute TA (Manaka et al., 2015). This rainfall-induced dilution of carbonate alkalinity can become a primary factor for the overestimation of pCO2 at sites with low pH and alkalinity (Li et al., 2013; Manaka et al., 2015). In contrast, the increasing proportion of wastewater in the receiving river reaches during dry periods can increase the river water alkalinity due to the lack of dilution by rainwater (Hassan et al., 2017), resulting in relatively lower discrepancies between the calculated and measured pCO2 values in the four large Asian rivers during dry periods compared to wet periods (Figure 4A). Small discrepancies between the calculated and measured values of pCO2 during the cruise expedition along the Ganges and Mekong (Figure 8) also suggest that carbonate equilibria-based calculations can be reliably applied to large rivers to calculate pCO2 from the usual ranges of pH and alkalinity under low-flow conditions. In the case of the Han River, inputs of soil-derived organic acids during sporadic rainfall events may decrease pH even during the dry season (Jin et al., 2018), which appears to be responsible for the observed discrepancies between the measured and calculated pCO2.
As some sites of the four large Asian rivers, such as wastewater sites of the Ganges and Mekong (i.e., W1, W5–W7, W9, and W10), some dry-seasonal negative discrepancies between the calculated and measured pCO2 (Figure 3A) were observed at pH 7–8 (Figure 4). Wastewater discharges of organic and inorganic alkalinity under conditions of low flows without rain-induced dilution, not only altered the composition of riverine OM but also increased pH and TA, resulting in negative deviations of the calculated pCO2 from well-buffered samples (Figures 4C, 5A; Supplementary Figure S1C). The dry seasonal negative discrepancies between the calculated and measured pCO2 observed at the various sites of the Han River (Figure 3C) indicate the potential role of enhanced phytoplanktonic uptake of CO2 in the low DOC and neutral to basic pH systems (Figures 6A, 7B; Supplementary Figure S3A; Jin et al., 2018). Calculated values of pCO2 below the 1:1 line during the dry season were found at low-pCO2 sites along the mainstem and impounded sites (i.e., H1–H3, H7, H11, H13–H14) of the Han River (Figure 3C). We observed potential underestimations of the calculated pCO2 at highly basic pH (Figure 2B; pH: 9.3–10), such as in the Yellow River, which was consistent with observations of previous research on the Zambezi River in Africa (Abril et al., 2015). Abril et al. (2015) provided no clear explanation for the potential underestimation of the calculated pCO2 at the high pH range.
4.2 Implications of pCO2 Overestimations for Estimating Riverine CO2 Emissions
These results point to potential overestimations of previous regional to global-scale riverine CO2 emissions that were mostly based on carbonate equilibria (pH-TA or pH-DIC). Raymond et al. (2013) excluded pCO2 values calculated from pH < 5.4 to avoid any potential overestimations. However, our results (Figure 2B; Table 3) reveal that overestimations of calculated pCO2 can occur at pH much higher than 5.4, which is consistent with previous findings from a wide range of river systems (Abril et al., 2015; Ran et al., 2021). When we discarded samples with low pH values (pH < 6.5 for the monsoon and <6.3 for the dry season) reasonably good agreements were established between the calculated and measured pCO2 in the mainstem, tributary, and wastewater sites of the four large rivers (Figures 3A,B; Table 4). Ran et al. (2021) also excluded the pCO2 values calculated from samples with low pH values (pH < 6.5) to avoid potential biases in the calculated pCO2. A more conservative approach by Lauerwald et al. (2015) excluded all polluted sites of rivers across Europe and America to avoid potential overestimations. Our analysis revealed that anthropogenic acids from wastewater effluents and/or soil-flushed CO2 and organic acids could decrease both pH and TA, causing overestimation of the calculated pCO2 in the polluted urban rivers during both monsoon and dry seasons (Wang et al., 2017).
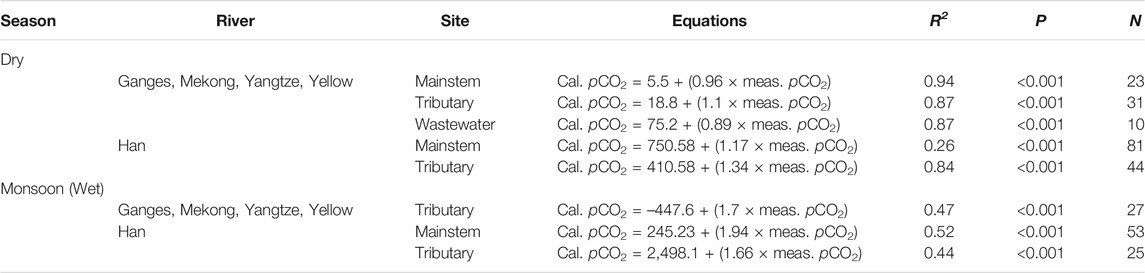
TABLE 4. Summary of the significant linear regressions between the calculated and measured partial pressure of CO2 (pCO2) presented in Figure 3 with adjusted R2, number of observation (N), and p values for the regression model.
Across the five Asian rivers, relatively low average overestimation of pCO2 was found for dry seasonal samplings than for monsoonal samplings (dry: 122%, monsoon: 187%; Table 3). Abril et al. (2015) reported a range of overestimation of pCO2 (50–300%), while our average overestimations of pCO2 for seasonal samplings were lower than their highest value (300%). The dry seasonal overestimation of pCO2 for the mainstem sites of the Han River was higher than that of the four larger rivers (Supplementary Figures S2, S4). This implies that inputs of organic acids and inorganic anions such as PO43– from wastewater effluents and/or soils can increase non-carbonate alkalinity while the buffering capacity of the carbonate systems can decrease at low pH, resulting in potential overestimation of pCO2 (Hunt et al., 2011; Abril et al., 2015; Jin et al., 2018).
4.3 Recommendations for Improving Estimation Accuracy
The observed overestimations of pCO2 during the monsoon and dry seasons suggest that corrective measures be taken when employing a carbonate equilibria model to calculate pCO2 in rivers with wide ranges of acidity and organic loads under varying weather conditions, particularly during high flow periods. We recommend the constrained use of pCO2 calculations depending on sites and seasonal conditions. To avoid large overestimations of calculated pCO2 using pH and TA, we recommend presenting pCO2 values calculated from low pH values (pH < 6.5 for monsoon and pH < 6.3 for dry season) together with the original pH values to warn the potential overestimation of pCO2 from low pH values. Although potential overestimations of pCO2 from low pH values have been reported in previous studies (Abril et al., 2005; Hunt et al., 2011; Abril et al., 2015; Liu et al., 2020), these have often been from acidic, organic-rich waters. Our study provides evidence that intense rainfalls and increasing loads of wastewater can also amplify discrepancies between the calculated and measured pCO2 from low pH values during both monsoon and dry seasons (Figures 4, 6).
Preestablished regressions between measured pCO2 and environmental variables can be used to correct overestimated pCO2 values, particularly during wet periods when major deviations in pH and other conditions are expected. Corrective measures such as adjusting pH to reduce the bias associated with low pH values can reduce uncertainty levels of pH-based pCO2 calculations. However, this approach would require more empirical relationships to be established to be applied to specific sites. Given the growing interest in evaluating the contribution of riverine CO2 emissions to the global C budget, it is urgent to obtain more field measurements of pCO2 across previously understudied river systems where monsoon floods induce various effects on riverine loads of organic acids and TA, thereby affecting pH and carbonate buffering. The lack of direct measurements of pCO2, however, necessitates the use of carbonate equilibria-based calculations of pCO2 for many river systems in the near future. In the long-term, direct measurements of pCO2 using manual headspace equilibration or sensor-based instrumental measurements will provide increasingly more reliable field-based data.
Data Availability Statement
Data are available and can be requested from the corresponding author (jhp@ewha.ac.kr).
Author Contributions
OKN and JHP designed the study and wrote the manuscript. MSB and LR obtained and analyzed data for the research. All authors contributed to the discussion of research results and manuscript revision. Funding for this research was arranged by JHP.
Funding
This work was supported by the Asia-Pacific Network for Global Change Research (CRRP2016-01MY-Park) and the National Research Foundation of Korea funded by the Korean Government (2017R1D1AB06035179; 2021M3I6A1091270).
Conflict of Interest
The authors declare that the research was conducted in the absence of any commercial or financial relationships that could be construed as a potential conflict of interest.
The handling Editor declared a past co-authorship with the authors ON, SB, LR, and JP.
Publisher’s Note
All claims expressed in this article are solely those of the authors and do not necessarily represent those of their affiliated organizations, or those of the publisher, the editors and the reviewers. Any product that may be evaluated in this article, or claim that may be made by its manufacturer, is not guaranteed or endorsed by the publisher.
Acknowledgments
We thank Yewon Chun, Dohee Kim, Ju-Hee Lim, and Sung-Hee Choi for their help with fieldwork and sample analyses in the Han River. It is also gratefully acknowledged that the collaborators of the APN-funded project, including Eliyan Chae, Sanjeev Kumar, Xixi Lu, V. V. S. S. Sarma, Shafi Tareq, Do Thi Xuan, and Ruihong Yu, provided invaluable assistance for fieldwork, sample analyses, or data work in the Ganges, Mekong, Yangtze, and Yellow River.
Supplementary Material
The Supplementary Material for this article can be found online at: https://www.frontiersin.org/articles/10.3389/feart.2021.778215/full#supplementary-material
Abbreviations
DIC, dissolved inorganic carbon; DOC, dissolved organic carbon; DOM, dissolved organic matter; DO, dissolved oxygen; OM, organic matter; pCO2, Partial pressure of CO2; TA, total alkalinity.
References
Abril, G., Bouillon, S., Darchambeau, F., Teodoru, C. R., Marwick, T. R., Tamooh, F., et al. (2015). Technical Note: Large Overestimation of pCO2 Calculated from pH and Alkalinity in Acidic, Organic-Rich Freshwaters. Biogeosciences 12, 67–78. doi:10.5194/bg-12-67-2015
Abril, G., Guérin, F., Richard, S., Delmas, R., Galy-Lacaux, C., Gosse, P., et al. (2005). Carbon Dioxide and Methane Emissions and the Carbon Budget of a 10-year Old Tropical Reservoir (Petit Saut, French Guiana). Glob. Biogeochem. Cycles 19. doi:10.1029/2005GB002457
Abril, G., Richard, S., and Guérin, F. (2006). In Situ measurements of Dissolved Gases (CO2 and CH4) in a Wide Range of Concentrations in a Tropical Reservoir Using an Equilibrator. Sci. Total Environ. 354, 246–251. doi:10.1016/j.scitotenv.2004.12.051
Begum, M. S., Bogard, M. J., Butman, D. E., Chea, E., Kumar, S., Lu, X., et al. (2021). Localized Pollution Impacts on Greenhouse Gas Dynamics in Three Anthropogenically Modified Asian River Systems. J. Geophys. Res. Biogeosci. 126, e2020JG006124. doi:10.1029/2020JG006124
Bisht, D. S., Tiwari, S., Srivastava, A. K., Singh, J. V., Singh, B. P., and Srivastava, M. K. (2015). High Concentration of Acidic Species in Rainwater at Varanasi in the Indo-Gangetic Plains, India. Nat. Hazards 75, 2985–3003. doi:10.1007/s11069-014-1473-0
Borges, A. V., Darchambeau, F., Teodoru, C. R., Marwick, T. R., Tamooh, F., Geeraert, N., et al. (2015). Globally Significant Greenhouse-Gas Emissions from African Inland Waters. Nat. Geosci. 8, 637–642. doi:10.1038/ngeo2486
Butman, D., and Raymond, P. A. (2011). Significant Efflux of Carbon Dioxide from Streams and Rivers in the United States. Nat. Geosci. 4, 839–842. doi:10.1038/ngeo1294
Cole, J. J., Prairie, Y. T., Caraco, N. F., McDowell, W. H., Tranvik, L. J., Striegl, R. G., et al. (2007). Plumbing the Global Carbon Cycle: Integrating Inland Waters into the Terrestrial Carbon Budget. Ecosystems 10, 172–185. doi:10.1007/s10021-006-9013-8
Feely, R. A., Wanninkhof, R., Milburn, H. B., Cosca, C. E., Stapp, M., and P. Murphy, P. (1998). A New Automated Underway System for Making High Precision pCO2 Measurements Onboard Research Ships. Analytica Chim. Acta 377, 185–191. doi:10.1016/S0003-2670(98)00388-2
Frankignoulle, M., and Borges, A. V. (2001). Direct and Indirect pCO2 Measurements in a Wide Range of pCO2 and Salinity Values. Aquat. Geochem. 7, 267–273. doi:10.1023/a:1015251010481
Golub, M., Desai, A. R., Mckinley, G. A., Remucal, C. K., and Stanley, E. H. (2017). Large Uncertainty in Estimating PCO2 from Carbonate Equilibria in Lakes. J. Geophys. Res. Biogeosci. 122, 2909–2924. doi:10.1002/2017jg003794
Gran, G. (1952). Determination of Equivalence point in Potentiometric Titrations of Seawater with Hydrochloric Acid. Oceanol. Acta 5, 209–218.
Guo, J. H., Liu, X. J., Zhang, Y., Shen, J. L., Han, W. X., Zhang, W. F., et al. (2010). Significant Acidification in Major Chinese Croplands. Science 327, 1008–1010. doi:10.1126/science.1182570
Hassan, T., Parveen, S., Bhat, B. N., and Ahmad, U. (2017). Seasonal Variations in Water Quality Parameters of River Yamuna, India. Int. J. Curr. Microbiol. App. Sci. 6, 694–712. doi:10.20546/ijcmas.2017.605.079
Hope, D., Dawson, J. J. C., Cresser, M. S., and Billett, M. F. (1995). A Method for Measuring Free CO2 in upland Streamwater Using Headspace Analysis. J. Hydrol. 166, 1–14. doi:10.1016/0022-1694(94)02628-O
Hudson, F. (2004). Sample Preparation and Calculations for Dissolved Gas Analysis in Water Samples Using GC Headspace Equilibration Technique. RSKSOP-175, Revision No. 2. USA: U.S. Environmental Protection Agency.
Hunt, C. W., Salisbury, J. E., and Vandemark, D. (2011). Contribution of Non-carbonate Anions to Total Alkalinity and Overestimation of pCO2 in New England and New Brunswick Rivers. Biogeosciences 8, 3069–3076. doi:10.5194/bg-8-3069-2011
Jin, H., Yoon, T. K., Begum, M. S., Lee, E.-J., Oh, N.-H., Kang, N., et al. (2018). Longitudinal Discontinuities in Riverine Greenhouse Gas Dynamics Generated by Dams and Urban Wastewater. Biogeosciences 15, 6349–6369. doi:10.5194/bg-15-6349-2018
Kim, M. G., Kim, O. J., and Lee, H. Y. (2007). A Case Study on Acid Rain over Jeju Island, Korea. J. Clim. Res. 2, 33–49. http://db.koreascholar.com/article.aspx?code=43648.
Kim, D., Lim, J.-H., Chun, Y., Nayna, O. K., Begum, M. S., and Park, J.-H. (2021). Phytoplankton Nutrient Use and CO2 Dynamics Responding to Long-Term Changes in Riverine N and P Availability. Water Res., 203. doi:10.1016/j.watres.2021.117510
Kling, G. W., Kipphut, G. W., and Miller, M. C. (1992). The Flux of CO2 and CH4 from Lakes and Rivers in Arctic Alaska. Hydrobiologia 240, 23–36. doi:10.1007/BF00013449
Lauerwald, R., Laruelle, G. G., Hartmann, J., Ciais, P., and Regnier, P. A. G. (2015). Spatial Patterns in CO2 evasion from the Global River Network. Glob. Biogeochem. Cycles 29, 534–554. doi:10.1002/2014GB004941
Lehner, B., Liermann, C. R., Revenga, C., Vörösmarty, C., Fekete, B., Crouzet, P., et al. (2011). High‐resolution Mapping of the World's Reservoirs and Dams for Sustainable River‐flow Management. Front. Ecol. Environ. 9, 494–502. doi:10.1890/100125
Lewis, E., Wallace, D., and Allison, L. J. (1998). Program Developed for CO2 System Calculations. United States Oak Ridge, Tennessee: Carbon dioxide Information Analysis Center, Oak Ridge National Laboratory, U.S. Department of Energy. doi:10.2172/639712
Li, S. Y., Lu, X. X., and Bush, R. T. (2013). CO2 Partial Pressure and CO2 Emission in the Lower Mekong River. J. Hydrol. 504, 40–56. doi:10.1016/j.jhydrol.2013.09.024
Liu, S., Butman, D. E., and Raymond, P. A. (2020). Evaluating CO2 Calculation Error from Organic Alkalinity and pH Measurement Error in Low Ionic Strength Freshwaters. Limnol. Oceanogr. Methods 18, 606–622. doi:10.1002/lom3.10388
Liu, S., Lu, X. X., Xia, X., Zhang, S., Ran, L., Yang, X., et al. (2016). Dynamic Biogeochemical Controls on River pCO2 and Recent Changes under Aggravating River Impoundment: An Example of the Subtropical Yangtze River. Glob. Biogeochem. Cycles 30, 880–897. doi:10.1002/2016gb005388
Manaka, T., Ushie, H., Araoka, D., Otani, S., Inamura, A., Suzuki, A., et al. (2015). Spatial and Seasonal Variation in Surface Water pCO2 in the Ganges, Brahmaputra, and Meghna Rivers on the Indian Subcontinent. Aquat. Geochem. 21, 437–458. doi:10.1007/s10498-015-9262-2
Meybeck, M., and Ragu, A. (2012). GEMS-GLORI World River Discharge Database. Laboratoire de Géologie Appliquée, Université Pierre et Marie Curie. Paris, France: PANGAEA. doi:10.1594/PANGAEA.804574
Millero, F. J. (1979). The Thermodynamics of the Carbonate System in Seawater. Geochim. Cosmochim. Acta 43, 1651–1661. doi:10.1016/0016-7037(79)90184-4
Millero, F. J. (1995). Thermodynamics of the Carbon Dioxide System in the Oceans. Geochim. Cosmochim. Acta 59, 661–677. doi:10.1016/0016-7037(94)00354-o
Milliman, J. D., and Farnsworth, K. L. (2011). River Discharge to the Coastal Ocean: A Global Synthesis. Cambridge, UK: Cambridge University Press, 13–69.
Park, J.-H., Nayna, O. K., Begum, M. S., Chea, E., Hartmann, J., Keil, R. G., et al. (2018). Reviews and Syntheses: Anthropogenic Perturbations to Carbon Fluxes in Asian River Systems - Concepts, Emerging Trends, and Research Challenges. Biogeosciences 15, 3049–3069. doi:10.5194/bg-15-3049-2018
Park, P. K. (1969). Oceanic Co2 System: an Evaluation of Ten Methods of Investigation1. Limnol. Oceanogr. 14, 179–186. doi:10.4319/lo.1969.14.2.0179
Pierrot, D., Lewis, E., and Wallace, D. W. R. (2006). MS Excel Program Developed for CO2 System Calculations, ORNL/CDIAC-105a, 3. Oak Ridge, Tennessee: Carbon dioxide Information Analysis Center, Oak Ridge National Laboratory, U.S. Department of Energy.
Ran, L., Butman, D. E., Battin, T. J., Yang, X., Tian, M., Duvert, C., et al. (2021). Substantial Decrease in CO2 Emissions from Chinese Inland Waters Due to Global Change. Nat. Commun. 12, 1730. doi:10.1038/s41467-021-21926-6
Ran, L., Li, L., Tian, M., Yang, X., Yu, R., Zhao, J., et al. (2017b). Riverine CO2 emissions in the Wuding River Catchment on the Loess Plateau: Environmental Controls and Dam Impoundment Impact. J. Geophys. Res. Biogeosci. 122, 1439–1455. doi:10.1002/2016JG003713
Ran, L., Lu, X. X., and Liu, S. (2017a). Dynamics of Riverine CO2 in the Yangtze River Fluvial Network and Their Implications for Carbon Evasion. Biogeosciences 14, 2183–2198. doi:10.5194/bg-14-2183-2017
Ran, L., Lu, X. X., Richey, J. E., Sun, H., Han, J., Yu, R., et al. (2015). Long-term Spatial and Temporal Variation of CO2 Partial Pressure in the Yellow River, China. Biogeosciences 12, 921–932. doi:10.5194/bg-12-921-2015
Raymond, P. A., Caraco, N. F., and Cole, J. J. (1997). Carbon Dioxide Concentration and Atmospheric Flux in the Hudson River. Estuaries 20, 381–390.
Raymond, P. A., Hartmann, J., Lauerwald, R., Sobek, S., McDonald, C., Hoover, M., et al. (2013). Global Carbon Dioxide Emissions from Inland Waters. Nature 503, 355–359. doi:10.1038/nature12760
Smethie, W. M., Takahashi, T., Chipman, D. W., and Ledwell, J. R. (1985). Gas Exchange and CO2 flux in the Tropical Atlantic Ocean Determined from 222Rn and pCO2 measurements. J. Geophys. Res. 90, 7005–7022. doi:10.1029/jc090ic04p07005
Wang, X., He, Y., Yuan, X., Chen, H., Peng, C., Zhu, Q., et al. (2017). pCO2 and CO2 fluxes of the Metropolitan River Network in Relation to the Urbanization of Chongqing, China. J. Geophys. Res. Biogeosci. 122, 470–486. doi:10.1002/2016jg003494
Wang, Z. A., Bienvenu, D. J., Mann, P. J., Hoering, K. A., Poulsen, J. R., Spencer, R. G. M., et al. (2013). Inorganic Carbon Speciation and Fluxes in the Congo River. Geophys. Res. Lett. 40, 511–516. doi:10.1002/grl.50160
Webb, J. R., Maher, D. T., and Santos, I. R. (2016). Automated, In Situ Measurements of Dissolved CO2 , CH4 , and δ13 C Values Using Cavity Enhanced Laser Absorption Spectrometry: Comparing Response Times of Air-Water Equilibrators. Limnol. Oceanogr. Methods 14, 323–337. doi:10.1002/lom3.10092
Weiss, R. F. (1974). Carbon Dioxide in Water and Seawater: The Solubility of a Non-ideal Gas. Mar. Chem. 2, 203–215. doi:10.1016/0304-4203(74)90015-2
Keywords: Asian rivers, carbonate equilibria, monsoon, partial pressure of CO2 (pCO2), urban tributary, wastewater
Citation: Nayna OK, Begum MS, Ran L and Park J- (2021) Improving Carbonate Equilibria-Based Estimation of pCO2 in Anthropogenically Impacted River Systems. Front. Earth Sci. 9:778215. doi: 10.3389/feart.2021.778215
Received: 16 September 2021; Accepted: 17 November 2021;
Published: 20 December 2021.
Edited by:
Xixi Lu, National University of Singapore, SingaporeReviewed by:
Ronny Lauerwald, Université Paris-Saclay, FranceManab Kumar Dutta, National Centre for Earth Science Studies, India
Ping Yang, Fujian Normal University, China
Copyright © 2021 Nayna, Begum, Ran and Park. This is an open-access article distributed under the terms of the Creative Commons Attribution License (CC BY). The use, distribution or reproduction in other forums is permitted, provided the original author(s) and the copyright owner(s) are credited and that the original publication in this journal is cited, in accordance with accepted academic practice. No use, distribution or reproduction is permitted which does not comply with these terms.
*Correspondence: Ji-Hyung Park, jhp@ewha.ac.kr