Best Practice for Measuring Permafrost Temperature in Boreholes Based on the Experience in the Swiss Alps
 Jeannette Noetzli1*
  Lukas U. Arenson2
  Alexander Bast1
  Jan Beutel3
  Reynald Delaloye4
  Daniel Farinotti5,6
  Stephan Gruber7
  Hansueli Gubler8 Wilfried Haeberli9 Andreas Hasler10
  Christian Hauck4 Martin Hiller1
  Martin Hoelzle4
  Christophe Lambiel11
  Cécile Pellet4 Sarah M. Springman12
  Daniel Vonder Muehll13
  Marcia Phillips1
- 1WSL Institute for Snow and Avalanche Research SLF, Davos Dorf, Switzerland
- 2BGC Engineering Inc., Vancouver, BC, Canada
- 3Department of Computer Science, University of Innsbruck, Innsbruck, Austria
- 4Department of Geosciences, University of Fribourg, Fribourg, Switzerland
- 5Laboratory of Hydraulics, Hydrology and Glaciology (VAW), ETH Zurich, Zurich, Switzerland
- 6Swiss Federal Institute for Forest, Snow and Landscape Research WSL, Birmensdorf, Switzerland
- 7Department of Geography and Environmental Studies, Carleton University, Ottawa, ON, Canada
- 8Alpug GmbH, Davos Platz, Switzerland
- 9Department of Geography, University of Zurich, Zurich, Switzerland
- 10SensAlpin GmbH, Davos Dorf, Switzerland
- 11Institute of Earth Surface Dynamics, University of Lausanne, Lausanne, Switzerland
- 12Institute for Geotechnical Engineering and Rectorate, ETH Zurich, Zurich, Switzerland
- 13Personalized Health and Related Technologies (PHRT), ETH Zurich, Zurich, Switzerland
Temperature measurements in boreholes are the most common method allowing the quantitative and direct observation of permafrost evolution in the context of climate change. Existing boreholes and monitoring networks often emerged in a scientific context targeting different objectives and with different setups. A standardized, well-planned and robust instrumentation of boreholes for long-term operation is crucial to deliver comparable, high-quality data for scientific analyses and assessments. However, only a limited number of guidelines are available, particularly for mountain regions. In this paper, we discuss challenges and devise best practice recommendations for permafrost temperature measurements at single sites as well as in a network, based on two decades of experience gained in the framework of the Swiss Permafrost Monitoring Network PERMOS. These recommendations apply to permafrost observations in mountain regions, although many aspects also apply to polar lowlands. The main recommendations are (1) to thoroughly consider criteria for site selection based on the objective of the measurements as well as on preliminary studies and available data, (2) to define the sampling strategy during planification, (3) to engage experienced drilling teams who can cope with inhomogeneous and potentially unstable subsurface material, (4) to select standardized and robust instrumentation with high accuracy temperature sensors and excellent long-term stability when calibrated at 0°C, ideally with double sensors at key depths for validation and substitution of questionable data, (5) to apply standardized maintenance procedures allowing maximum comparability and minimum data processing, (6) to implement regular data control procedures, and (7) to ensure remote data access allowing for rapid trouble shooting and timely reporting. Data gaps can be avoided by timely planning of replacement boreholes. Recommendations for standardized procedures regarding data quality documentation, processing and final publication will follow later.
1. Introduction
Permafrost is a thermal phenomenon found in cold polar and high-mountain regions and is defined on a thermal and temporal basis as ground with a maximum temperature of 0°C throughout the year, in most cases for long time periods and often reaching considerable depths. Permafrost was selected as one of the essential climate variables (ECVs) of the Global Climate Observing System (GCOS, Karl et al., 1995; cf. Bojinski et al., 2014). Sound assessments of permafrost changes and the separation of short-term variations from long-term trends or local variations from regional patterns require reliable and comparable data measured at representative sites over decades. Such time series make practical use of the ECVs: to detect change patterns and assess impacts, to improve process understanding, to validate and calibrate corresponding models, and to put shorter time series or those locations devoid of data into perspective. Long-term climate-related monitoring of permafrost relies on ground temperatures measured in boreholes, since they are the only direct, quantitative and comparable thermal observations. When permafrost temperatures approach 0°C in ice-bearing permafrost, however, temperature changes are significantly reduced by latent heat uptake during ground ice melt. Additional measurements that are sensitive to changes in ground ice and unfrozen water content are required to observe changes within the permafrost until the frozen material has thawed completely.
Careful standardization and strategic planning of permafrost borehole installations as well as of subsequent site maintenance and data management arecrucial to reduce field interventions and data processing efforts, and to achieve consistent and comparable long-term records. General key principles for long-term observation of climate variables are given by the ten GCOS monitoring principles (GCOS, 2004). GCOS also defined a five-tiered monitoring strategy from global to local scale, the Global Hierarchical Observations Strategy (GHOST, see Harris et al., 2001 for adaptation to permafrost observations): long-term monitoring is mainly related to sampling the range of environmental variation in permafrost thermal state as stated in tier 3 and aims to describe representative permafrost conditions based on field observations as in tier 4. The Global Terrestrial Network for Permafrost (GTN-P) is the primary international program for permafrost monitoring. GTN-P operates a database with international permafrost temperature data, which are measured in a large variety of settings (Biskaborn et al., 2015) and provides basic guidelines for the instrumentation of permafrost boreholes, which are mainly targeted to polar lowlands (Burgess et al., 2000; Smith et al., 2009; Streletskiy et al., 2017). Standards for the installation of a borehole transect for climate-related permafrost monitoring from Svalbard to the Sierra Nevada were published in the framework of the EU-funded PACE project (Permafrost and Climate in Europe PACE, Harris et al., 2001, 2009). The Swiss Permafrost Monitoring Network PERMOS started in the year 2000 as the first national permafrost observation network based on available research infrastructure (Haeberli et al., 1993; Delaloye and Vonder Mühll, 1998). It includes three of the PACE boreholes. The standardization and operationalization of the PERMOS network has continued since (Vonder Mühll et al., 2008, PERMOS, 2019) and extensive experience was gained in the past two decades. Progress toward establishing standards or consensus methods for permafrost borehole instrumentation is however still limited to general guidelines, to project frameworks and minimum requirements, yet without specifically addressing mountain environments.
Permafrost distribution and temperatures in mountain regions are characterized by complex topography and rapidly changing micro-climates, leading to extreme horizontal and vertical spatial variability (e.g., Gruber and Haeberli, 2009). Permafrost is found in bedrock, debris slopes, viscous and ice-rich creep features (rock glaciers), moraines, and glacier forefields. Ground ice content ranges from massive ice (tens of meters thick) in loose debris to bedrock with permanent ice in rock pores and fractures. In mid-latitude mountains, such as the European Alps, widespread permafrost regions have temperatures close to 0°C, with considerable amounts of unfrozen water present in the soil matrix. In shady bedrock slopes at elevations above around 3500 m asl., however, permafrost can be as cold as in the high Arctic (Noetzli et al., 2019). Further, gravity-driven downslope deformation processes are widespread. The drilling and instrumentation of boreholes and their long-term operation under harsh climate conditions, at remote locations, and in steep or deforming mountain slopes are technically and logistically challenging.
Three initial shallow boreholes were drilled to 7 m depth to measure permafrost temperature in the 1970s in the rock glaciers Murtèl-Corvatsch and Gruben in the Swiss Alps (Barsch, 1977; Barsch et al., 1979). The first deep borehole for continuous permafrost observation in mountain regions was drilled through Murtèl-Corvatsch rock glacier in 1987 (Figure 1; Haeberli et al., 1988; Vonder Mühll and Haeberli, 1990). This borehole was replaced by a new one nearby in 2015 to secure the world’s longest and most detailed thermal record available for this type of environment (PERMOS, 2019). Today, over thirty boreholes reaching depths between 20 and 100 m and located at 15 sites between 2300 and 3500 m asl. are operated by six academic partner institutions as a part of PERMOS. In addition, approximately 30 other boreholes have been instrumented during this period in the Swiss Alps for process research, hazard monitoring or in the framework of construction projects (e.g., Scapozza et al., 2011; Buchli et al., 2013; Luethi and Phillips, 2016). National permafrost observation programs have also been started, for example, in Norway (Juliussen and Christiansen, 2010), France (Schoeneich et al., 2010), Austria (Kellerer-Pirklbauer et al., 2017), and Canada (Brown et al., 2020). Similarly, these programs are mainly based on available borehole infrastructure from research and industrial projects.
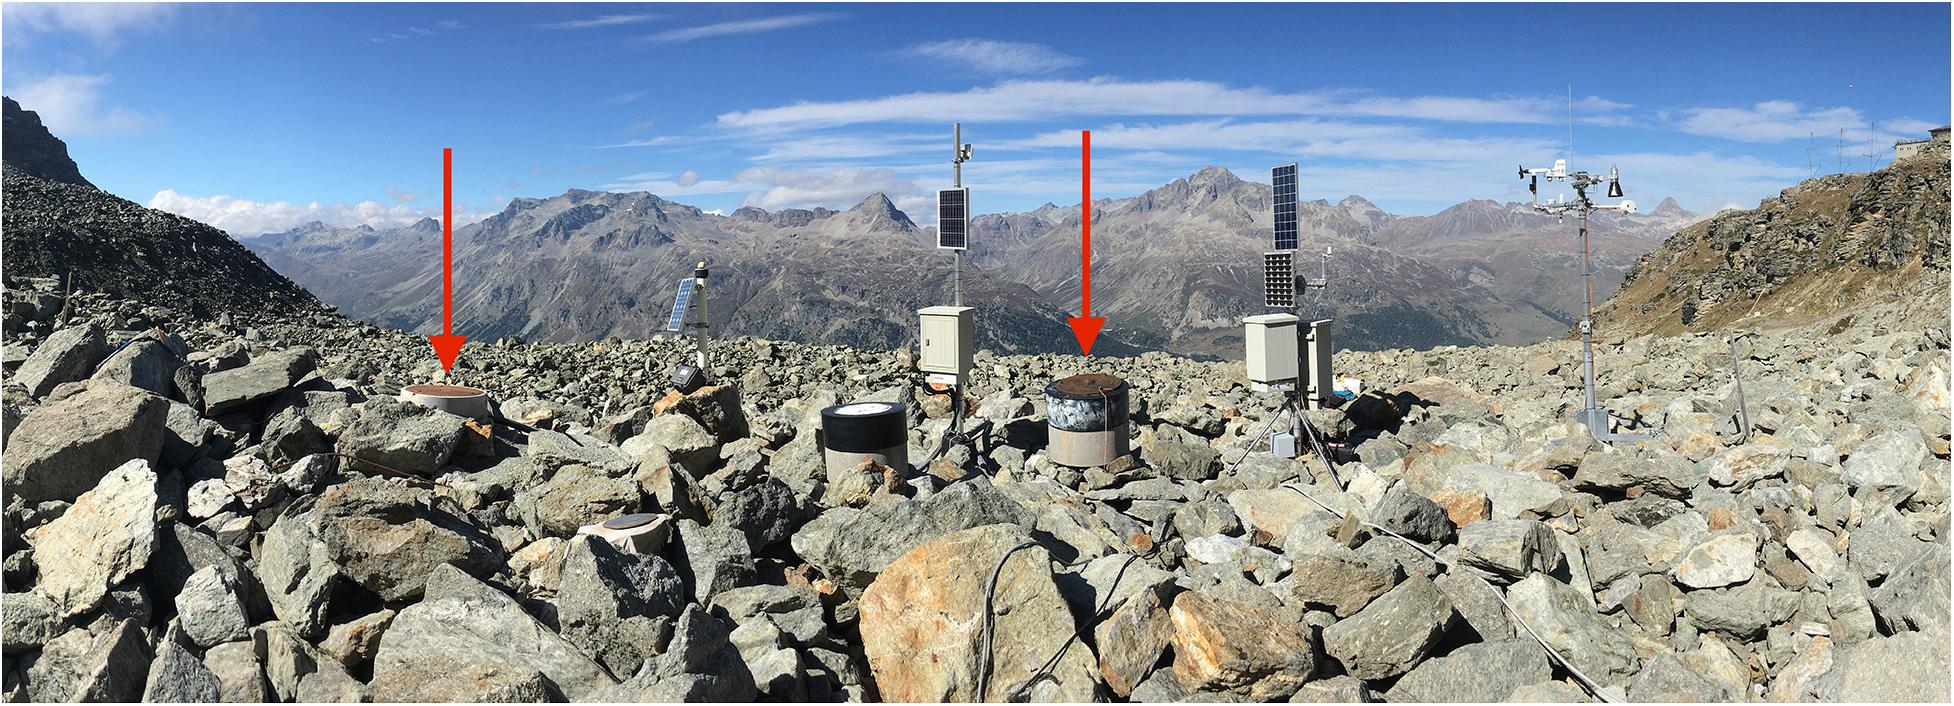
Figure 1. Borehole site on rock glacier Murtèl-Corvatsch, Switzerland. The 1987-borehole is marked with the right arrow. The 2015 replacement borehole is on the far left (left arrow) and the meteorological station on the far right. A permanent GNSS device with a solar panel is mounted on a large boulder to the right of the 2015-borehole. Two other boreholes drilled in 2000 are not visible on the picture. Photo: J. Noetzli, October 2019.
In this paper, we compile best practice recommendations for the long-term measurement of permafrost temperatures (Figure 2) based on 20 years of experience accumulated in the context of PERMOS and beyond. These recommendations condense the experience gained by a large number of institutions and scientists, and have been identified as being crucial for the delivery of continuous, high-quality data. We concentrate on complex terrain in cold mountain regions, where methods and interpretations as well as the challenges for long-term operation of the sites can differ from those in polar lowlands. Nevertheless, many of the points described are also applicable in polar lowlands. While we focus on long-term borehole monitoring here, information from the drilling and installation of other boreholes is also presented and discussed.
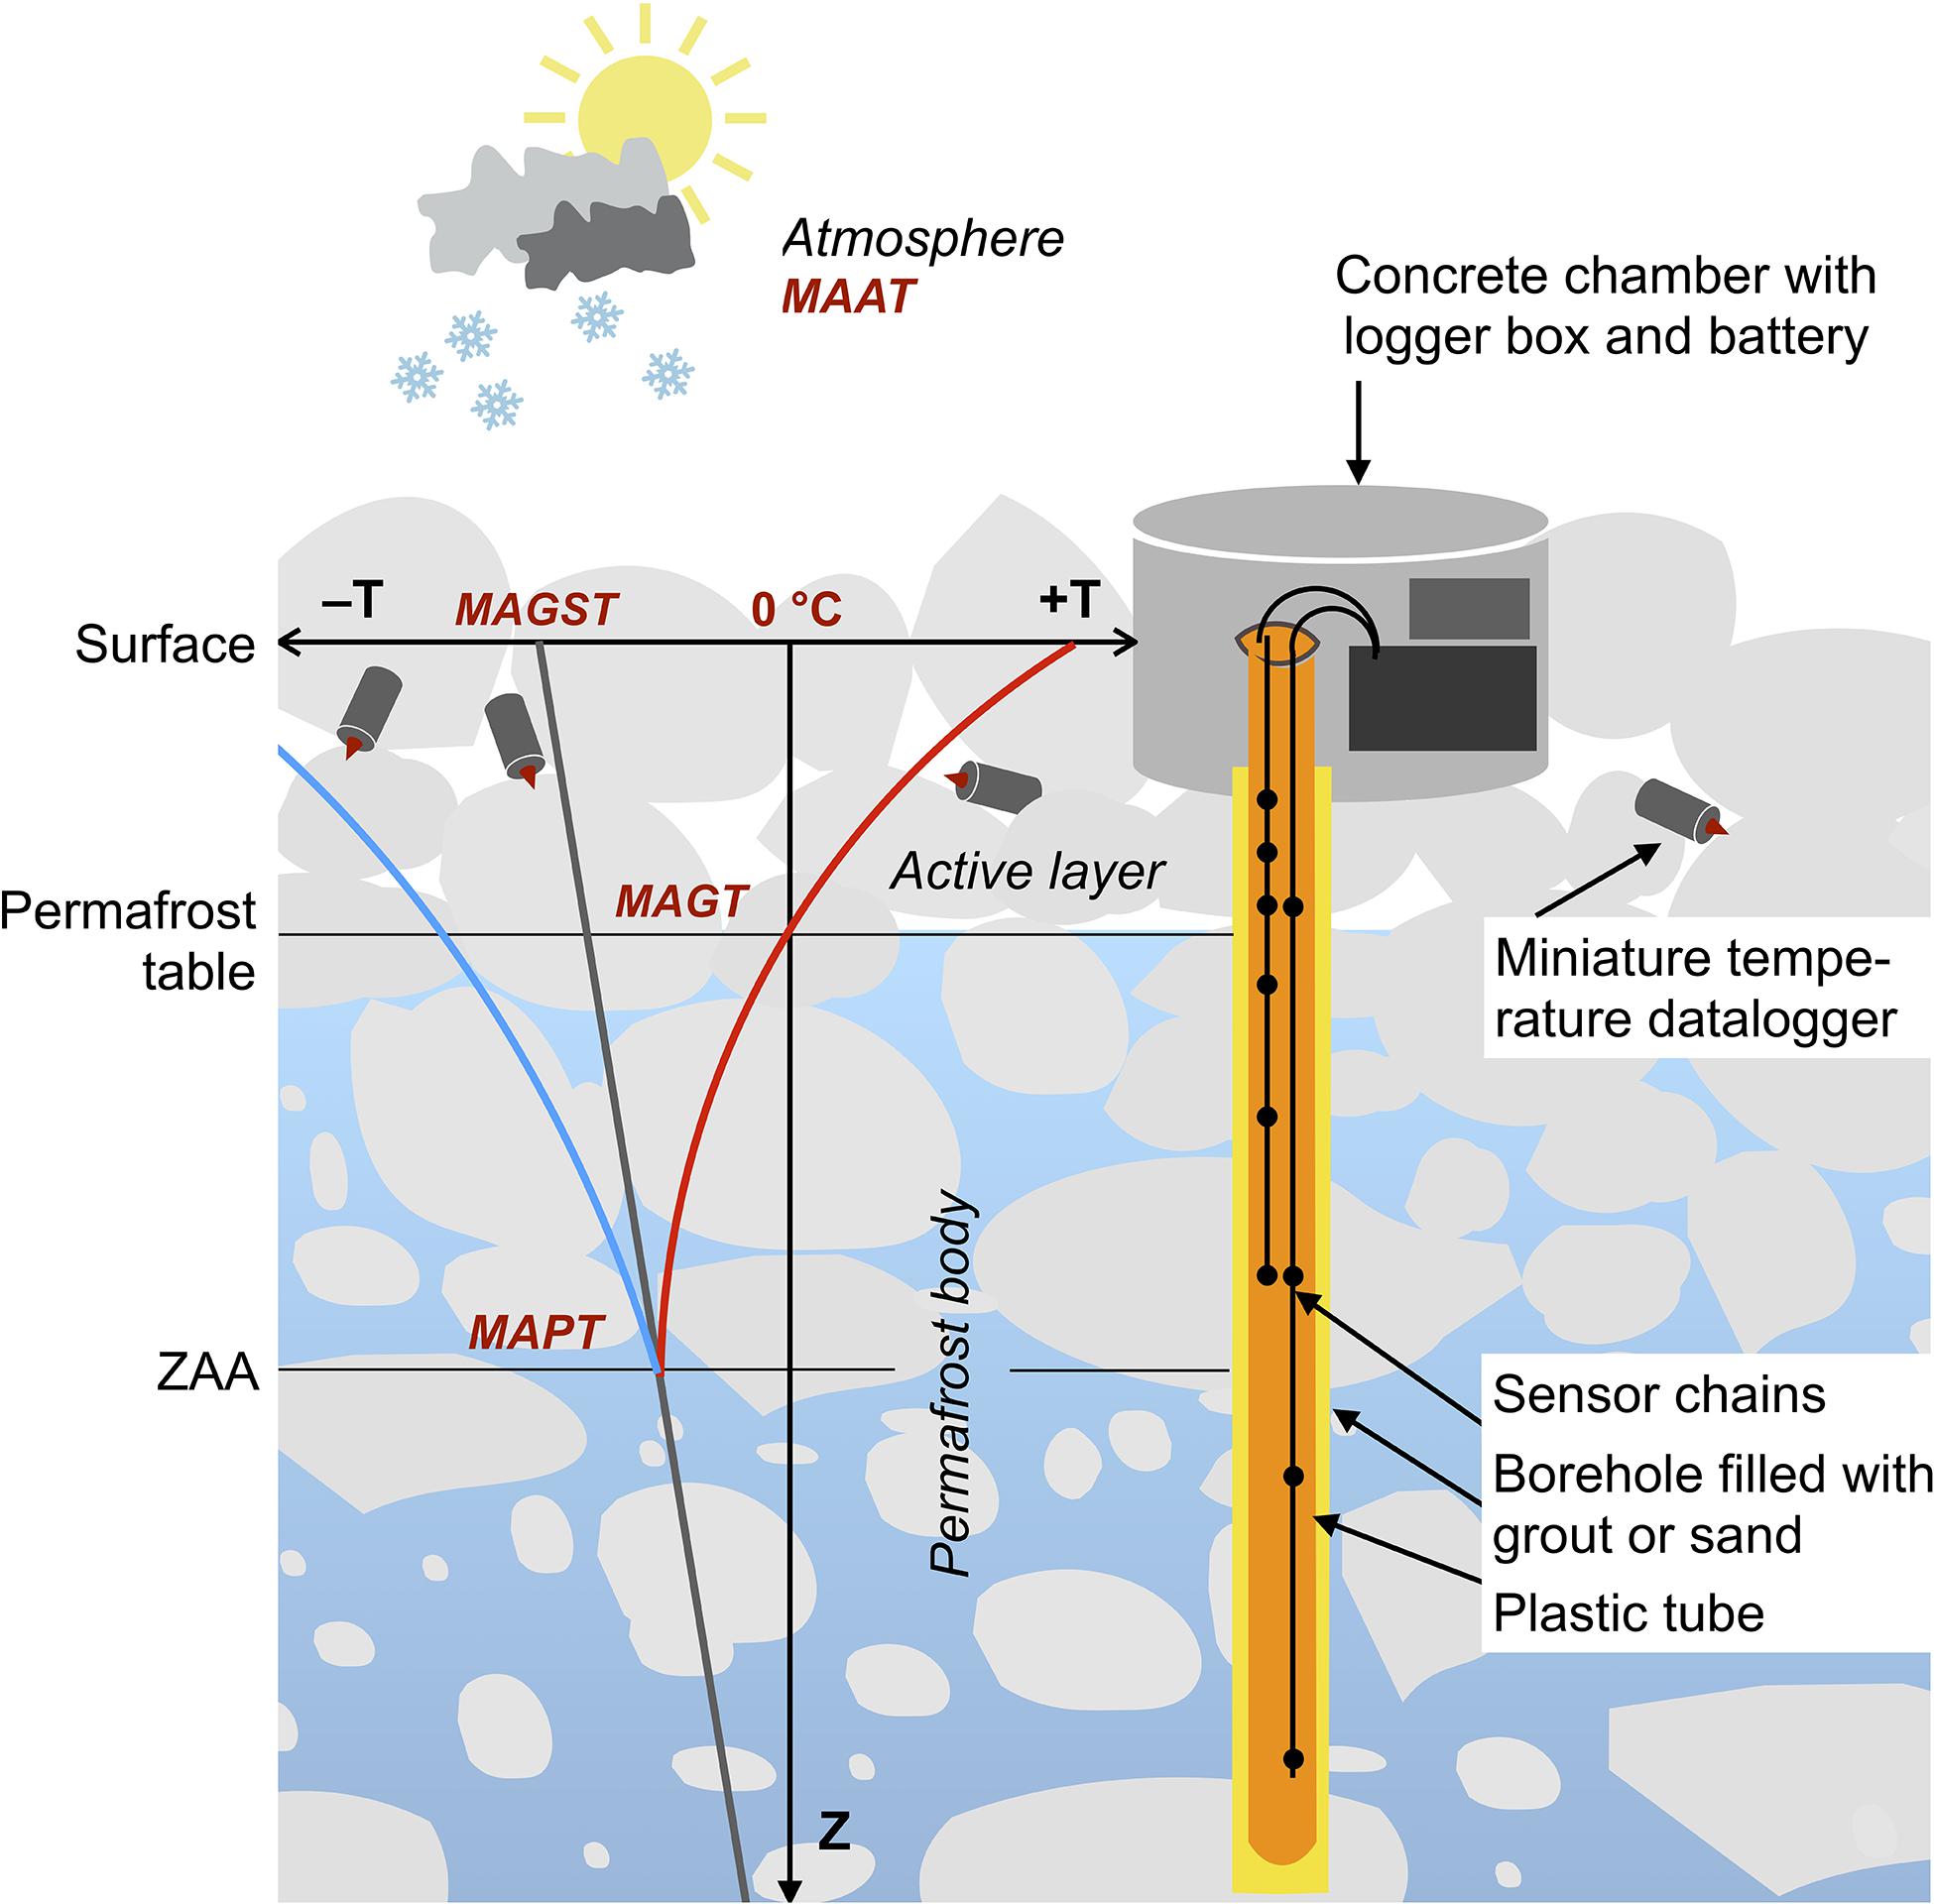
Figure 2. Sketch of a basic setup for a borehole in ice-rich permafrost. A schematic temperature profile in the active layer and permafrost body is indicated on the left. The blue line of the profile denotes the annual minimum temperature, the gray line the annual mean temperature, and the red line the annual maximum temperature. MAAT, mean annual air temperature; MAGST, mean annual ground surface temperature; MAGT, mean annual ground temperature; MAPT, mean annual permafrost temperature; ZAA, zero annual amplitude.
2. Main Challenges and Procedure
Four major challenges were identified for the long-term operation of borehole infrastructure and the acquisition of permafrost temperature data in mountain regions:
1. The high mountain permafrost environment: hazards (such as storms, lightning, snow avalanches, and rock fall), meteorological effects (such as high winds and melt water) and even animals (such as marmots or stoats) can damage instruments and lead to instrument failure, reducing data quality and causing data gaps. Creep-induced slope deformation can deform boreholes, block or shear off sensor strings, and prevent recalibration or replacement. Drilling is complicated by difficult logistics and inhomogeneous ground material.
2. Measurements of small and invisible changes: permafrost is a subsurface phenomenon and observed changes in ground temperatures are a few decimal degrees over a decade. Sensor drift and measurement instabilities can be difficult to distinguish from «real» signals or from trends, as they can be in the same order of magnitude. Additionally, latent heat effects lead to minimal temperature changes when the permafrost is just below the melting point.
3. Science-driven network: permafrost monitoring networks often build on infrastructure and resources from research institutions, and the instrumentation was set up with different objectives. Data quality protocols and metadata may be incomplete or lacking. The standardization of equipment, maintenance and data processing procedures is costly and time-consuming. In addition, the site distribution is often biased toward easily accessible sites and sites selected for specific research questions.
4. Long-term funding: Long-term climate-related monitoring not only requires perseverance but also continuous financial support and embedding into national climate monitoring structures. Permafrost monitoring complements scientific studies by providing key basic data sets, which cannot be obtained in a typical research project. However, funding for this essential data backbone (Zemp, 2011) is difficult to obtain in most countries and international programs. Research funding is typically reserved for novel technologies and specific research questions, gaps or variables.
Data validation is hampered by points 1 and 2 above. Several temperature sensors can be malfunctioning after several years of operation, e.g., due to damage caused by slope deformation or refreezing of melt water inside the borehole. In active rock glaciers, the temperature sensors below and within the shear horizon often failed successively: e.g., in Corvatsch-Murtèl the sensors below 30 m depth failed after 20 years, whereas failure occurred at Muragl (sensors below ca. 20 m depth) or Ritigraben (sensors below ca. 15 m depth) after 5–10 years. In such cases, only the drilling of a new borehole nearby allows direct data validation.
These challenges should be considered in all steps of the realization of a borehole for permafrost temperature measurements in mountain regions, for its long-term operation as well as for data analyses (Figure 3). The planning of a new borehole includes the definition of the objectives of the infrastructure (e.g., process studies, long-term environmental monitoring, performance monitoring), the choice of the site and the exact drilling location (Section 3). The sampling design includes the drilling angle and borehole depth, instrument types and detailed location of sensors, data recording intervals as well as potential complementary measurements (Section 4). Subsequently, the borehole is drilled (Section 5), instrumented (Section 6), and requires regular maintenance (Section 7). A borehole may need to be replaced toward the end of its service life (Section 8).
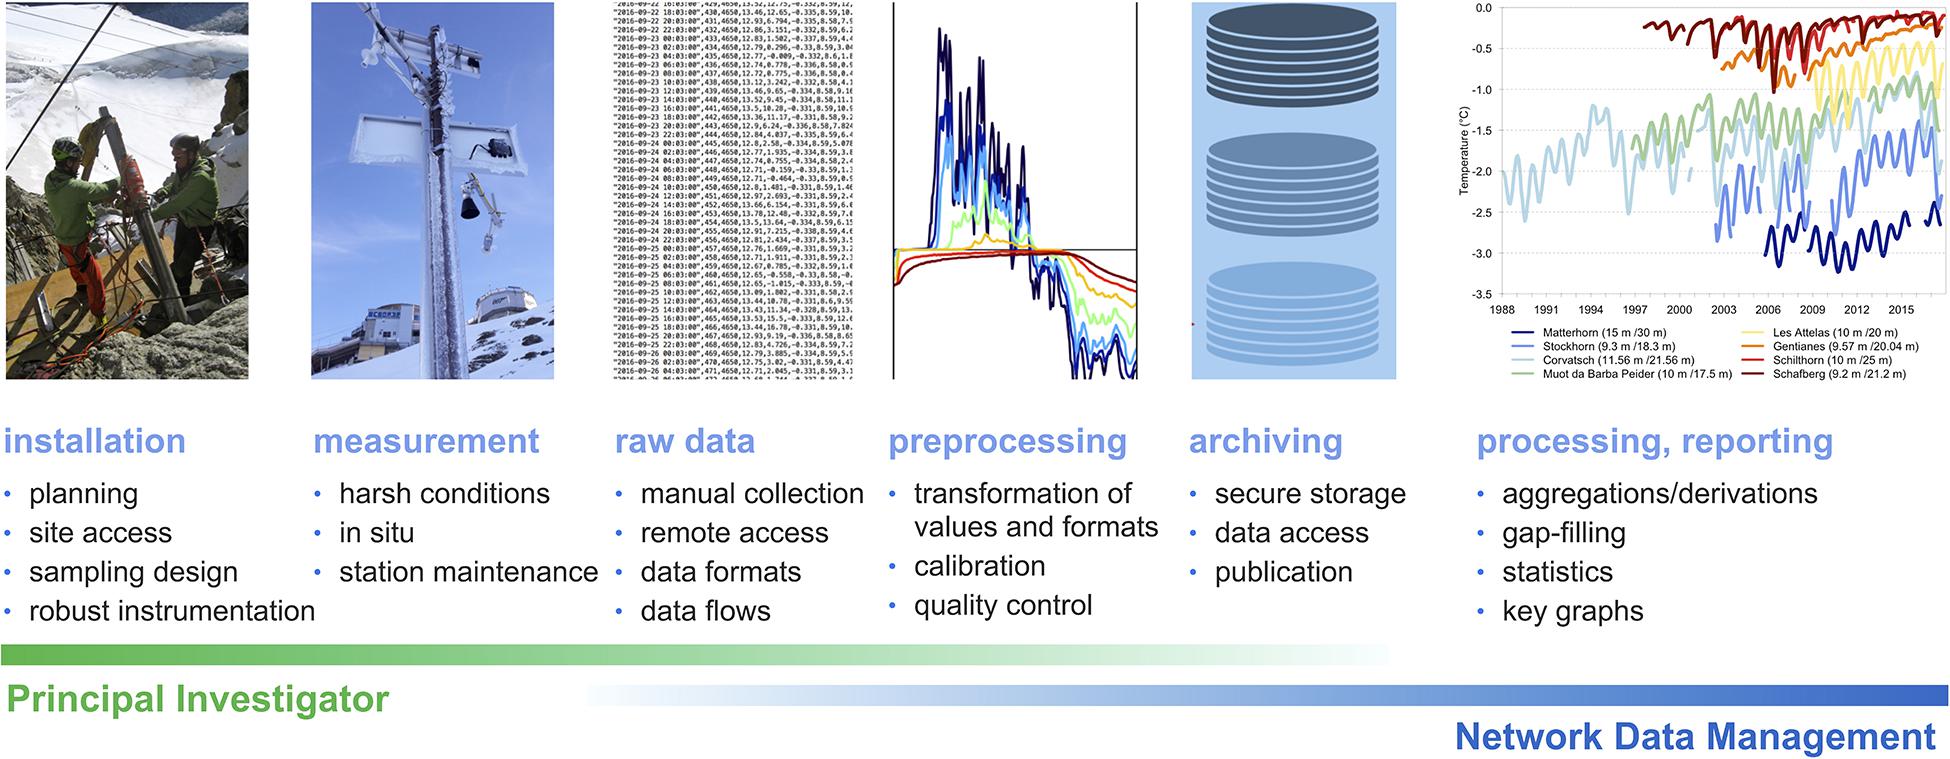
Figure 3. Procedure to obtain permafrost temperatures measured in a borehole: from planning and installation of the measurement infrastructure (far left), operation and measurement, data collection, quality control, archiving, to processing and publication (far right). In this paper, we address the first three tasks, which are typically the responsibility of a research institution/principal investigator. Data source and photos: PERMOS.
Data acquisition in the field is followed by data processing (including quality control, manual or automatic correction, and re-calibration) and secure archiving. Finally, the data may be published, often together with derived products such as aggregated data or key parameters describing the permafrost characteristics (e.g., active layer thickness, ALT) or changes (e.g., warming rates). Although best practices for post-data acquisition tasks are equally important for comparable and sound scientific analyses, they are rarely available in the literature.
3. Site Selection
3.1 Primary Selection Criteria and Assessment
The primary criteria to locate a potential borehole depends on the project’s objective and on instrumentation possibilities, as well as on the network strategy in case the borehole is planned to be part of a network (see Section 3.2). Criteria may be weighted differently, resulting in the selection of different sites, depending on whether the project goal is climate monitoring, process understanding or hazard management. A focus on long-term monitoring may exclude permafrost sites of scientific interest, in which degrading permafrost is undergoing rapid thermal changes and significant slope deformation: temperature and deformation measurements would be irretrievably lost rapidly after their installation here (Springman et al., 2012; Buchli et al., 2013, 2018; Delaloye et al., 2013). However, most of the procedures described also apply for these boreholes.
The following three criteria are essential for long-term observations:
1. Relevance of a site, which is mainly defined by the type of site and its socio-economic relevance, as well as by gaps identified in an existing network. The central question is: Why is it important to monitor the thermal condition of permafrost at a type of site? The most abundant or otherwise relevant types of site with permafrost in high mountain areas should be considered when designing the sampling of locations to be monitored, for example, differing topographic settings (related to aspect, elevation, snow cover, etc.) and landforms. Azonal permafrost at low elevations is not typically observed in long-term climate-related monitoring.
2. Representativeness of a location, which refers to how well it reflects a topographic setting (e.g., aspect), landform (e.g., rock wall) or permafrost characteristic (e.g., ice-rich ground). Local conditions or artificial structures and their changes can influence the thermal regime (e.g., heat from buildings, local changes in snow distribution at the foot of a steep slope or from infrastructure). The central question is: is the selected location representative for the site, or are its thermal characteristics driven by specific local conditions?
3. Feasibility and longevity, which relate to potential hazards threatening equipment and accessibility as well as to terrain deformation, particularly in a rock glacier. The central questions are: For how long will a site yield representative data and over what period of time can borehole operation be guaranteed? What are the risks and what is the necessary commitment in terms of resources, including for maintenance? The commitment of the stakeholders is fundamental for long-term financial support. The possibility of complete permafrost thaw occurring during monitoring and its implications should also be considered.
An assessment of the permafrost conditions at a potential borehole site is essential to verify that the site is suitable and to define the drilling position and procedure as well as instrumentation details. This includes a reasonable estimation of the active layer thickness, depth of the permafrost base, range of permafrost temperatures, ground ice content and potential warming and deformation rates. The variability of surface and subsurface characteristics in the inhomogeneous mountain terrain must be considered: the selected drilling location should represent the general character of the site regarding slope angle, surface cover, snow distribution, bedrock fracturing, or hydrological conditions (point 2 above). For rock glacier sites, the maximum acceptable range of annual horizontal deformation needs to be assessed (point 3 above). The permafrost assessment should be based on available data from the site of interest or nearby locations (e.g., permafrost distribution maps, geomorphological and geological maps, meteorological data, ground temperatures, geophysical surveys, ground characteristics, geology, or geodetic surveys and digital image analysis of slope deformation). Additional surveys may have to be performed. Modeling studies are also helpful in predicting three-dimensional or future temperature fields. We compile an overview of available methods in Supplementary Material 1, while details are described in the scientific literature.
3.2 Network Strategy
Permafrost observation sites are often distributed unevenly from a geographical perspective and biased toward more accessible locations or pre-existing research sites (Hock et al., 2019). A regional or national permafrost monitoring network aims to observe the most relevant types of sites with respect to permafrost evolution in its country. The selection of a borehole site to be included in a permafrost monitoring network should therefore consider how well different regions, topographic settings and permafrost types are represented and where gaps exist. In addition to a general warming trend, the change patterns observed over more than a decade are consistent for different permafrost regions (Romanovsky et al., 2010; Biskaborn et al., 2019; Hock et al., 2019; Noetzli et al., 2019; PERMOS, 2019; Etzelmueller et al., 2020). They depend on three main characteristics:
(1) temperature range: the lower the permafrost temperatures, the higher the warming rates,
(2) ground ice content: temperatures of ice-rich permafrost just below 0°C hardly increase because the available energy is used to melt ground ice (latent heat effect), and
(3) duration of the snow cover: changes in the snow regime can accelerate or interrupt warming trends and decisively influence the subsurface thermal regime.
The topographic and climatic situation (temperature range and snow distribution) and the ground material (ground ice content) are thus most relevant to distinguish different types of sites for permafrost observation. PERMOS (2019) considers differences between these characteristics to be more important than regional differences and follows a landform-based approach. Countries with larger climate gradients may additionally focus on regional aspects. A European transect focusing on bedrock sites and undisturbed climate signals was established within the PACE project. Small-scale regional or local networks may focus on particular aspects, for example, how different surface characteristics influence the subsurface thermal regime in otherwise comparable conditions (Schneider et al., 2012).
Establishing a balanced and standardized network takes decades due to the high cost of infrastructure and maintenance and the challenges regarding access. High-elevation bedrock sites in cold permafrost in the European Alps are, for example, severely under-represented, although warming rates in these areas are highest and comparable to those observed in the Arctic regions (Noetzli et al., 2019). Permafrost temperatures in extremely steep and mainly snow-free rock faces evolve differently than in ice-rich debris slopes with highly variable snow conditions. Only four sites with deep boreholes above 3400 m asl. exist today in the Alps – Aiguille du Midi, France; Jungfrau East ridge, Matterhorn and Stockhorn, Switzerland – and only the first two are in steep, mostly snow-free bedrock. Other permafrost observations exist at high elevations outside the European Alps or are being developed in the framework of research or industry. Examples are the Qinghai-Tibetan Plateau (Zhao et al., 2010), the Hindu Kush Himalaya (Gruber et al., 2017; Wani et al., 2020), the Indian Himalaya (Allen et al., 2016), North America (Gruber et al., 2015; Hasler et al., 2015) or the South American Andes (Monnier and Kinnard, 2013). Nevertheless, these sites are still rare, even more difficult to access, not in comparably mountainous topography, have shallow boreholes or are not (yet) equipped for long-term monitoring. Boreholes in non-permafrost substrates are also valuable as they provide useful comparisons to assess the particularities of temperature development in frozen ground, and help to determine the lower fringe of the permafrost (Kenner et al., 2019a). The temperature evolution of permafrost and non-permafrost sites is likely comparable in solid bedrock with low ice content and, hence, no significant thermal effects of latent heat or air convection (Gruber et al., 2004a; Noetzli and Gruber, 2009).
3.3 Complementary Measurements
The main limitations of permafrost temperature measurements in boreholes are that (1) they only provide information at one single location in inhomogeneous terrain, and (2) they do not reveal changes in ground ice content during permafrost thaw. Complementary measurements are crucial for a comprehensive understanding of permafrost changes (PERMOS, 2019) as well as for the validation and interpretation of permafrost temperature data, helping to determine their plausibility and consistency (see Sections 7.2 and 7.3). Well established complementary measurements include:
• Ground surface temperature (GST) measurements using distributed miniature temperature dataloggers (MTD, Hoelzle et al., 1999, 2003; Delaloye, 2004; Weber et al., 2019) allow to assess thermal effects of local surface variability. GST are near-surface temperatures obtained at a 1–2 decimeters depth to avoid atmospheric disturbances and direct solar radiation.
• Repeated geophysical surveys with fixed sensors such as electrical resistivity tomography (ERT) allow the detection of changes in unfrozen water content, which also reflect changes in ground ice content and hence, permafrost degradation (Hilbich et al., 2008; Mollaret et al., 2019). This complement is particularly important for permafrost temperatures in ice-rich terrain just below the melting point, where hardly any temperature changes can be observed but permafrost degradation is taking place and these techniques allow to distinguish ice and water at 0°C.
• Creep velocities of rock glaciers are increasing with rising permafrost temperatures and related ice softening and increase in water contents (Arenson et al., 2002; Cicoira et al., 2019a, b; Kenner et al., 2019b). Velocity measurements are important in view of slope stability and increased sediment transport. They are monitored using terrestrial geodetic surveys (PERMOS, 2019) or in situ GNSS (Wirz et al., 2013), as well as by remote sensing methods such as photogrammetry, laser scanning (Kääb, 2002; Arenson et al., 2016; Kenner et al., 2018), terrestrial radar interferometry (Buchli et al., 2018) or InSAR (Strozzi et al., 2020).
• Deformation rates in boreholes can be measured parallel to temperatures. This is the only direct method to record deformation profiles at depth and to determine shear horizons. The use of deformation measurement devices influences the choice of borehole casing and/or sensor arrays (Sections 4 and 5). Measurements with standard inclinometers can only be carried out until the casing reaches a certain degree of deformation and the instrument can no longer be inserted (Arenson et al., 2002). Permanently installed inclinometers allowing for automatic data supply (e.g., type ShapeAccelArray Field, SAA) require the casing to be filled with sand to stabilize the instruments. Plastic spacers were mounted on the instrument prior to installation at Furggwanghorn rock glacier in Switzerland to achieve frictional connection between the instrument and the casing (Buchli et al., 2013). The SAAF device installed in the 2015 Murtèl-Corvatsch borehole is fixed in a plastic tube to pre-compress the inclinometer and insulated by an Armaflex foam tube to prevent heat transfer between the temperature sensor strings as well as the borehole liner.
• A well-equipped meteorological station at the borehole site (Mittaz et al., 2000) is important for interpreting monitoring results because the subsurface thermal conditions are largely driven by the surface energy balance. The complex topography introduces high uncertainties when extrapolating data from other weather stations. Meteorological data from the borehole site are indispensable input data for physics-based modeling of permafrost evolution (e.g., Gisnas et al., 2013; e.g., Marmy et al., 2016; Pruessner et al., 2018).
4. Temperature Sampling Strategy
The design of the temperature sampling in a permafrost borehole has to address (a) the depth of the borehole, (b) the angle of drilling, (c) the number and spacing of installed sensors, and (d) the accuracy, recording and measurement rate and resolution. The technical implementation of the sampling strategy, which includes the type of sensors used and the data acquisition system including logger and data transmission, is discussed in Section 6.
The depth of a permafrost borehole depends on the purpose of the measurements and the estimated permafrost conditions as well as on the terrain, the accessibility of the site, the available drilling equipment, and economics. Diurnal temperature fluctuations occur in the uppermost 1–3 meters, whereas the ground temperatures at depths below the zero annual amplitude (ZAA) react to multi-annual trends in connection with changing climatic conditions. The ground in-between is subject to seasonal temperature variations. Measurements at these depths further reflect effects of extreme weather periods. The minimal depth for temperature data to be included into the GTN-P database is the depth of the ZAA (Biskaborn et al., 2019), which is around 15–20 m for Alpine sites. The minimal borehole depth in the PERMOS network is 20 m, which allows determining the temperature gradient with depth. Reaching the depth of the ZAA can be difficult if access to a site is not possible with the required drilling equipment (e.g., in near-vertical mountain flanks) and should therefore not be a limiting factor determining the usefulness of a borehole for long-term observations. Deeper boreholes with several tens of meters depth – for example the 100 m deep PACE boreholes – allow inversion-modeling to describe the surface temperature evolution for several decades prior to drilling (Lachenbruch and Marsall, 1986; Isaksen et al., 2000). This is however not straightforward in complex mountain topography (Noetzli et al., 2007).
Most permafrost boreholes are drilled (nearly) vertically, which is recommended in loose debris to minimize the risk of borehole collapse. A slight inclination of ca. 2° to the vertical is useful for better contact between the temperature sensors and the casing. Examples of horizontal or oblique (normal to the surface and parallel to the main heat flux) boreholes exist in steep bedrock terrain (e.g., Jungfrau or Schilthorn, Switzerland; Aiguille du Midi, France; and Kitzsteinhorn, Austria). Some of them even completely pierce a ridge allowing active layer and thermal regimes to be studied for two contrasting sides (e.g., Zugspitze, Germany; Gemsstock, and Switzerland). Oblique or horizontal boreholes allow the three-dimensional temperature fields of steep crests and peaks to be studied (Gruber et al., 2004b; Noetzli et al., 2008).
The individual depths at which temperatures are recorded depend on the geotechnical and thermal characteristics of the location. The available number of sensors per string is typically limited to a few ten either by the number of (multiplexed) input channels and size of the connecting cable for analog sensors or by the address range of individual digital sensors. The WMO defines the depths of 0.1, 0.2, 0.5, and 1 m as standard depths for soil measurements (WMO, 2008). Measurements at 10 and 20 meters depth were established for reporting in national and international assessments (Hock et al., 2019; Noetzli et al., 2019; PERMOS, 2019). Examples of sensor spacings in permafrost boreholes in the European Alps, including the PACE standard (Harris et al., 2001), are provided in Table 1. Sensor spacing should increase with depth due to the decreasing temporal variability in the ground temperatures. Typically, a spacing of 0.2–1.0 m is applied in the uppermost 5–10 meters. Below around 10 m depth, the spacing increases to 2–5 m down to ca. 30 meters. At larger depth, temperature is usually measured every 10 meters. A dense sensor spacing in the uppermost 0.5 to 1 m is not considered useful if the distance is small compared to the size of the sensors, and because of the influence of the concrete chamber near the surface (cf. Section 5.4). An additional shallow borehole should be installed nearby for precise active layer temperature measurement (Harris et al., 2001; Isaksen et al., 2001). A simpler, less costly option to measure near-surface temperatures and to assess the influence of the surface installations is the placement of MTD just outside the borehole (e.g., Pogliotti et al., 2015 see also Section 3.3). A sensor spacing of 0.1–0.2 m is practicable in consolidated material or bedrock where no shaft is present. In coarse-blocky terrain, the surface (i.e., 0 m depth) has to be clearly defined and documented, since its position is not unambiguous and introduces uncertainty in the depth of the sensors. Subsidence of ice-rich ground can further require a regular reassessment of the sensors’ depths. A mm-level positioning of the sensors at larger depths, where temperature gradients are small (<0.1°C m–1) does not impact measurement accuracy (Biskaborn et al., 2019).
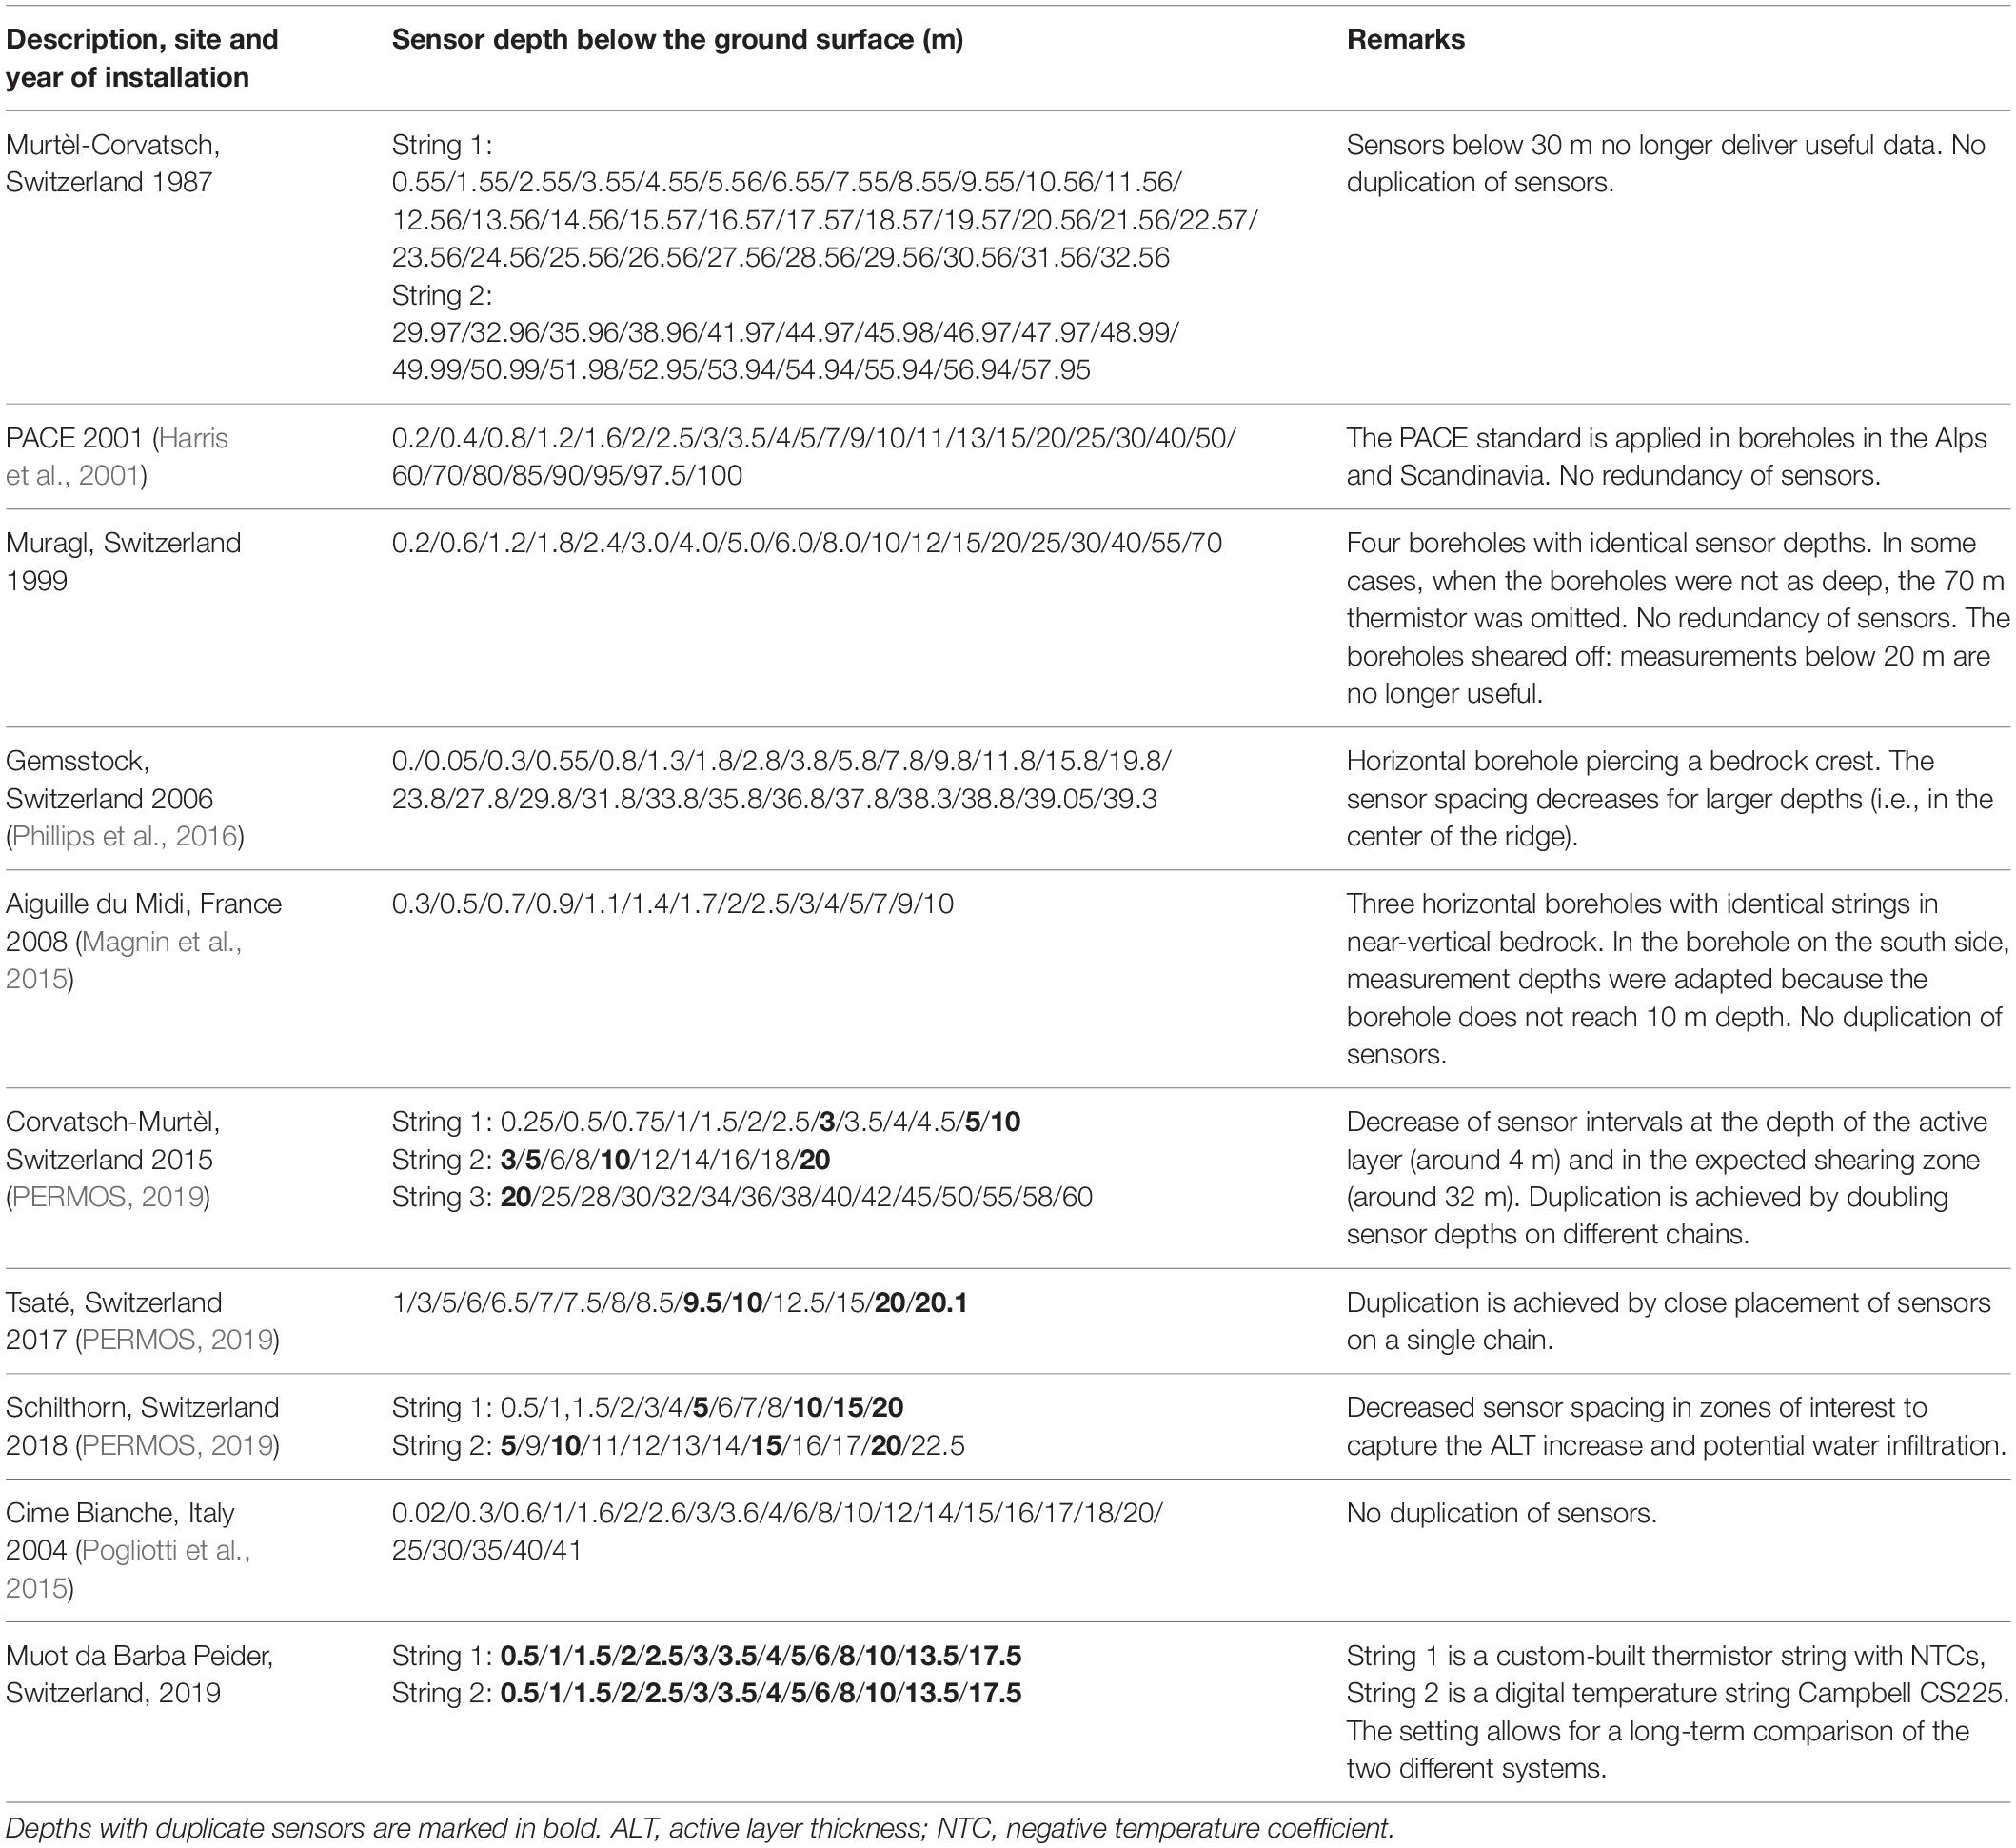
Table 1. Temperature sensor spacing defined within the PACE Project in 2001 as well as for recently instrumented boreholes in the Alps.
The placement of the sensors should – if known or reliably estimated – additionally account for site-specific zones of interest: the ALT, shear horizons, taliks or lateral water/air fluxes (Vonder Mühll, 1992; Arenson et al., 2002; Luethi and Phillips, 2016). Close spacing of temperature sensors of 0.1 m or less is recommended at the permafrost table in ice-rich ground, because freeze-thaw processes are non-linear and the commonly applied linear interpolation from neighboring sensors only allows an estimation of ALT (Brown et al., 2000; Luethi and Phillips, 2016). Future ALT increase can attain meters over time and must be considered. For example, the ALT at Schilthorn (Switzerland) increased from 4 to 10 m in 20 years, and at Lapires from 3.5 to 6 m (PERMOS, 2019). While the temperature sensors in the Schilthorn borehole are only 0.5 m apart in the topmost 4 m, they are 2 m apart below 5 m depth, which leads to a significant uncertainty with increasing ALT.
Temperature sensor duplication is highly recommended to ensure uninterrupted time series, particularly at the key depths 5, 10, and 20 m. Sensor duplication allows for validation of questionable data and provides a backup in case of sensor failure and lack of access for servicing. Inaccessible/blocked temperature sensor strings were repeatedly experienced due to ice plugging or borehole shearing. The only option for sensor replacement in such a case is a costly replacement of the borehole (Section 8). Duplication can be achieved by placing two or more sensor strings with overlapping depths into the borehole, or two sensors close to each other on the same string (cf. Table 1). Temperatures measured in nearby boreholes can also be helpful, but may not allow direct comparison due to small-scale terrain heterogeneity.
Hourly resolution of temperature recording is recommended to capture the high variability in the uppermost meters and potential non-conductive heat transfer processes. The latter can occur at all depths and may result from ground water or air flows, and are likely increasing with permafrost degradation and the formation of taliks. In addition, hourly recording allows an assessment of the stability of the measurements at larger depths with small temperature fluctuations. Recording intervals are typically programmed for the entire sensor string and its definition is thus based on the minimum interval of interest. The storage capacity of modern data acquisition systems is no longer a limiting factor. However, energy supply can be a challenge and needs to be considered when defining sub-hourly measurement intervals.
5. Borehole Drilling
5.1 Diameter
Typical diameters for boreholes of several tens of meters depth in loose debris are in the range of 100–140 mm (typical sizes of standard Q used: HQ and PQ) to allow for installation of casing and backfill. Diameters can be smaller, in the range of 45–70 mm, in solid bedrock, for shallow boreholes and with relatively stable walls (e.g., Magnin et al., 2015). The exact diameter depends on the equipment available, sampling technique and quality, drill bit and the selected casing (cf. Section 5.3), which in turn depends on the number and type of instruments to be inserted.
5.2 Drilling Procedure and Technical Aspects
A site inspection with potential drilling companies is mandatory for them to determine feasibility, access/shelter for workers and equipment, potential hazards and hence produce a cost estimate. It also helps the research team to decide who to award a contract to. Funding bodies require estimates due to the high costs involved and estimates have been known to vary hugely. Past experience of drilling in alpine environments is essential in the choice of a drilling company.
The installation of a high-alpine drilling site is logistically demanding and costly (see Vonder Mühll, 1996) and usually requires a building permit. Transport of equipment to remote sites in the European Alps is usually done by cable car, truck/bulldozer or helicopter. Access by road is rarely possible. A drill rig can be installed on specifically prepared drilling platforms or on a walking excavator if access is possible (Figure 4). For the latter, no rocks may have to be moved and the impact on the surface is typically lower, which is important for undisturbed conditions. Protection measures such as mobile rockfall barriers or safety lines may need to be installed to ensure the safety of workers, machinery and instruments on site. It is also important to protect pre-existing instruments and the drilling company has to be advised accordingly. The logistics of a platform installation in near-vertical terrain may require additional safety installations for securing site and workers, the help of mountain guides, and a rope pulley system to transport equipment (Magnin et al., 2015). Typically, around 8–10 tons of machinery are needed for a borehole of about 30 m depth, whereas lighter equipment may be used for shallower boreholes. Additional space at the drilling site is necessary for a compressor and bulky equipment such as generators, containers, drill tubes, fuel tanks, casings, sampling devices, or boxes for sampling. All equipment as well as excess material needs to be removed and transported back from the site.
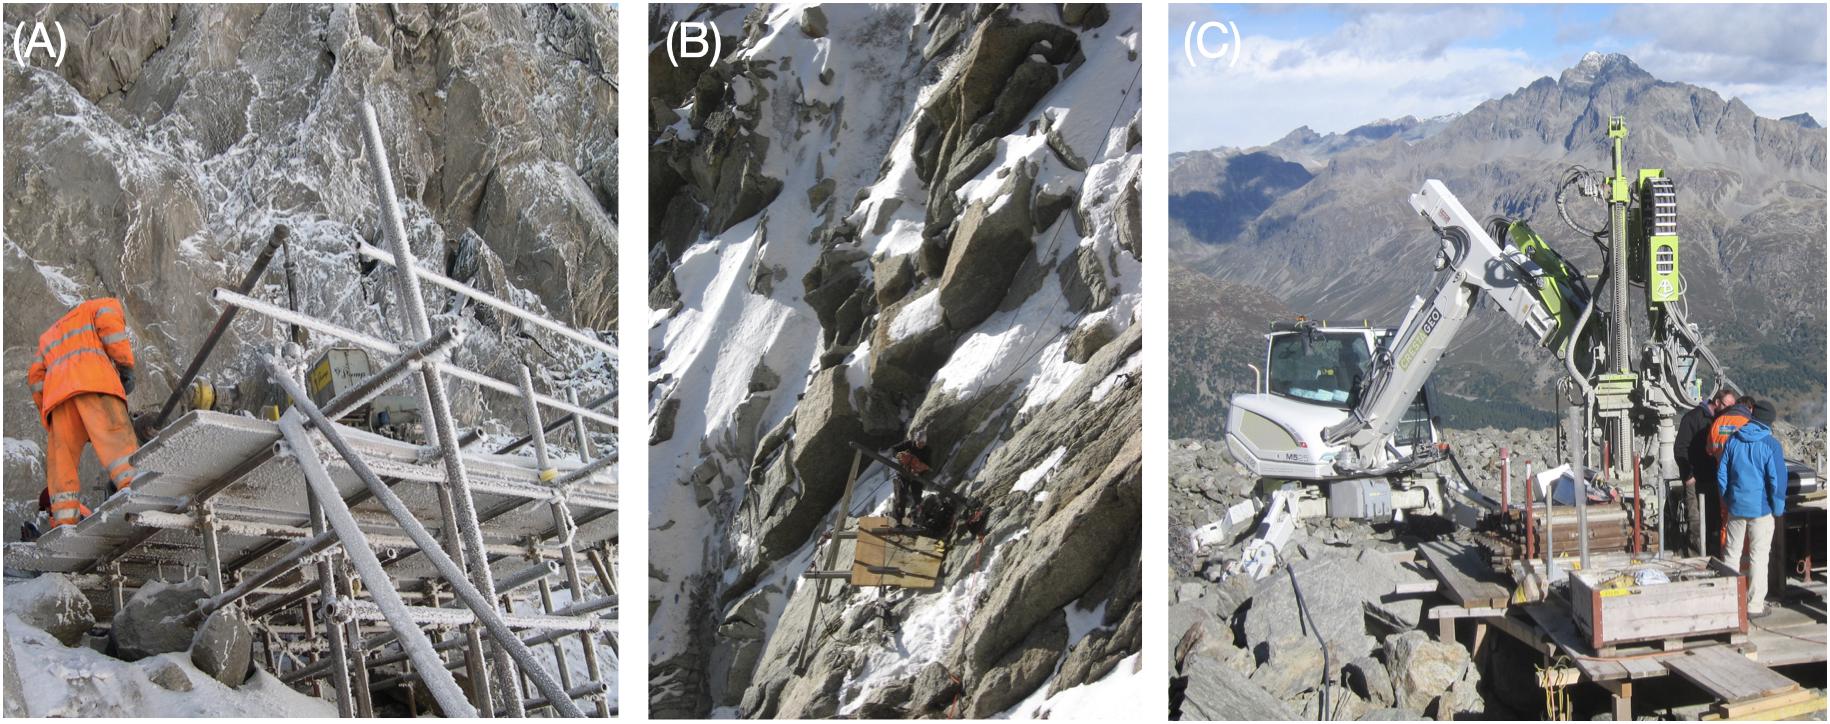
Figure 4. Drilling platforms: in steep bedrock at Gemsstock in 2006 (A, photo: A. Bauder) and at Aiguille du Midi in 2008 (B, photo: J. Noetzli). A walking excavator with drill head was used on Murtèl-Corvatsch rock glacier in 2015 (C, photo: J. Noetzli).
Boreholes are either drilled destructively or by extracting cores (Figure 5). Destructive or percussion drilling is significantly cheaper, faster and requires simpler logistics. However, it only allows qualitative information on stratigraphy, ice content (low/high ice content and depth), fractures (depth) or water occurrences: thorough documentation of the type of material ejected (e.g., ice chips), encountered fissures, water occurrence and hardness of the material is essential, both by an experienced driller and in parallel by a qualified team member. Any flow of (ground)water into the borehole during or after drilling should also be logged, as well as drilling data, such as torque and penetration rate. The latter may later be used to support the description of the stratigraphy. Due to the unfrozen and uncompacted nature of the active layer in rock glaciers, for example at the Muragl rock glacier, Switzerland, steel casing may be required for the top meters to stabilize the borehole during drilling (see Arenson et al., 2002). An ODEX system allows a casing to be advanced during drilling in such loose debris. In this case, caution must be used when extracting this casing so that any installed instrumentation is not damaged.
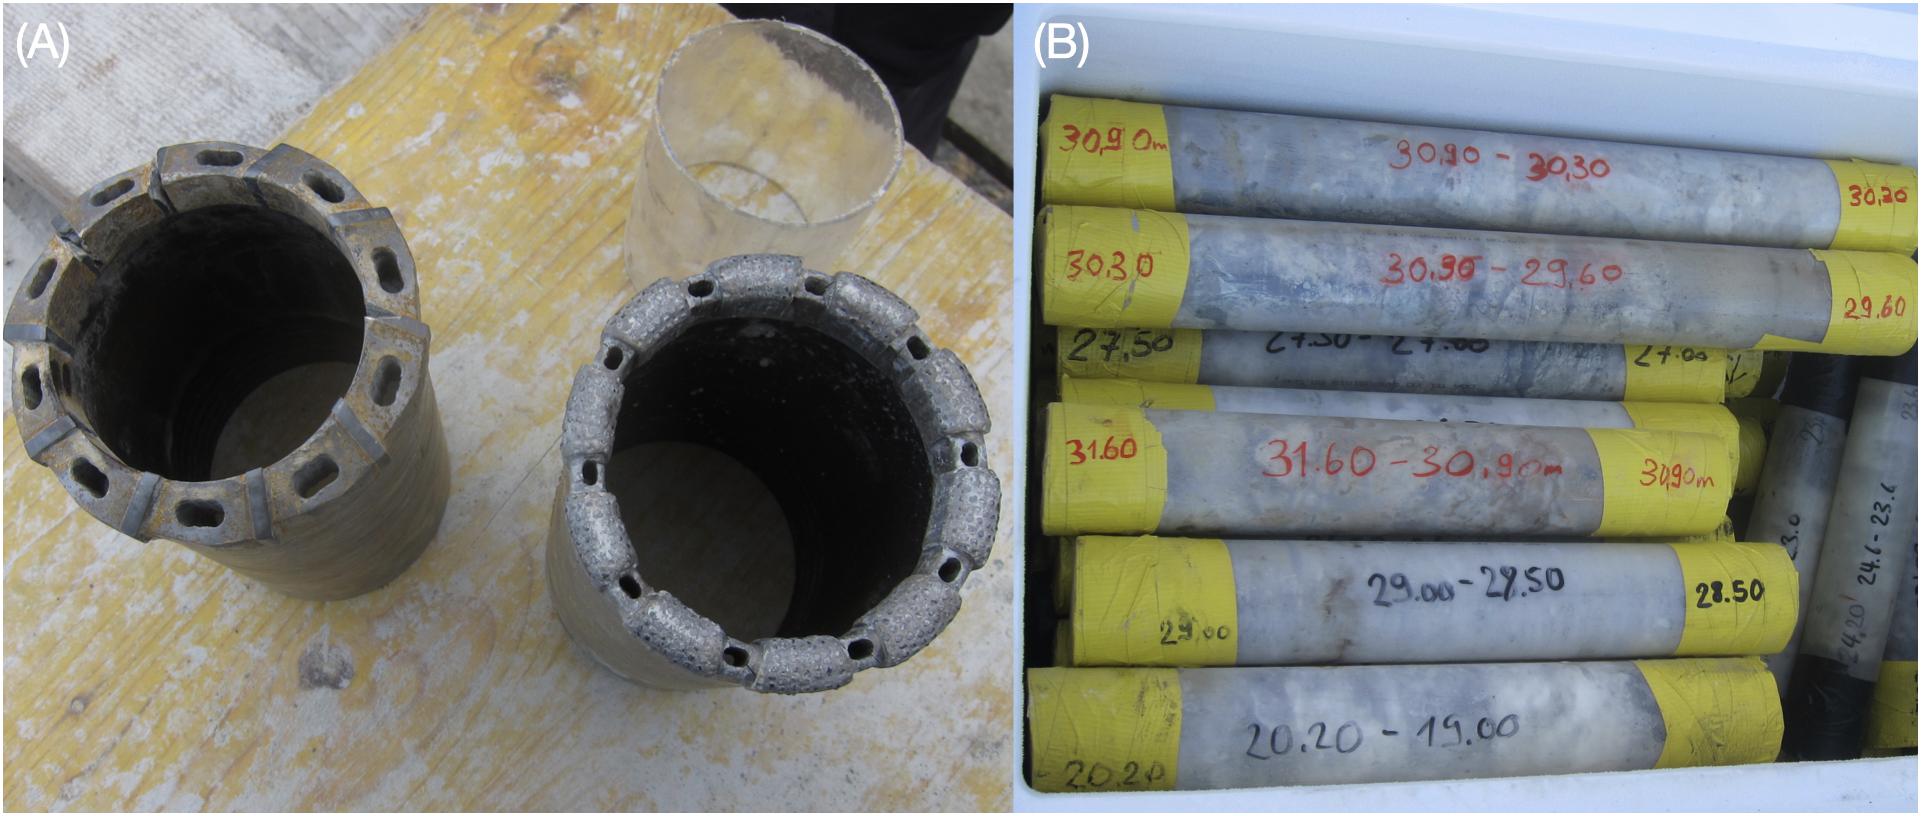
Figure 5. Drill bits (A) and cores (B) taken in the Murtèl-Corvatsch rock glacier between 5 and 30 m depth. The samples consist of nearly pure ice and were stored in a freezer on the drill site before transport to the cold laboratory. Photos: J. Noetzli.
Core drilling typically requires heavy equipment and is around 3–4 times more expensive and time-consuming. It allows quantitative determination of stratigraphy, particle size and ice characteristics (geotechnical tests, dating, ground and ice composition). Duplex or triplex techniques should be used to minimize heat input into the ice core (Vonder Mühll, 1996; Arenson et al., 2002). Triple tube core drilling was used on the Muragl and Murtèl-Corvatsch rock glacier drilling campaigns in 1999 and 2000 with adiabatic cooling, as well as between ca. 5 and 30 m depth for the ice-rich parts of the 2015 Murtèl-Corvatsch borehole. In the latter, the rest was drilled destructively to save time and money. Sonic drilling has also allowed good frozen sample recovery rates in frozen ground and rock glaciers (L. Arenson, pers. communication). An ODEX system can be driven behind drill bits and sampling tubes in unstable terrain. Any cores extracted from the borehole should be insulated and stored in a freezer immediately, and transferred at frequent intervals to a freezer truck for transport to the cold laboratory.
The choice of the drilling crowns depends on whether percussion or coring is applied – and for the latter if they have to cope with hard rock (e.g., gneiss or granite), granular porous media or soft ice. The inhomogeneous material in loose debris has to be assessed in advance and requires an experienced driller and fast adaptation of the drilling technique and crown. While a diamond drill bit can pulverize rock, this may not work on ice, which must be scraped. Pauses in the drilling procedure should be minimized because the drill head can become irretrievably stuck due to freezing inside the borehole. In such a case the borehole and drilling equipment would be lost. Gravels were also found to rotate with the drill bit, causing additional damage to the sample (Arenson, 2002).
Heat disturbance from drilling has to be kept to a minimum, especially in ice-rich permafrost with temperatures close to the melting point. It is essential to drill very slowly using a compressor-driven air flushing system, or brine, but not a water flushing system. The latter causes significant thermal disturbances or melt of the ground ice – as experienced with the very first drillings in rock glaciers (Barsch et al., 1979) – and remaining water can freeze in the borehole or even destroy its walls, possibly initiating the formation of taliks. In addition, water is often not available at high elevation sites. Water cooling may be used when drilling into solid bedrock close to a cable car station with water supply (Magnin et al., 2015), if flushed out completely at the end of the procedure.
Borehole camera logging either in parallel with the drilling or immediately thereafter allows the ground ice content, type of material, porosity and ground stratigraphy to be assessed, if it is not necessary to stabilize the borehole walls with a casing (Arenson et al., 2002; Scapozza et al., 2011). A caliber log may be useful to reveal information about the borehole diameter. Televiewer logging (optical and acoustic) can be completed to provide detailed scans of the borehole walls, including orientation of layers and thin irregularities. However, such surveys can lead to the collapse of the borehole and loss of the sensor in the worst case, as the borehole has to be cleaned before the survey and, depending on the size of the instrument, the borehole walls may be touched. Methods such as electrical resistivity, electromagnetic induction or sonic (P-wave velocity) surveys, that may require a water-filled borehole before the stabilizing casing is inserted (e.g., Vonder Mühll et al., 2003) are not recommended because of the high risk of losing the borehole. In-hole surveys are only recommended if logging can be completed from within a PVC casing that is tightly grouted into the ground. Nuclear magnetic resonance (NMR) measurements can provide information on total and liquid water content with depth. Active nuclear well logging methods (gamma ray log, gamma-gamma or neutron-neutron logs) were previously applied in periglacial talus slopes (Vonder Mühll and Haeberli, 1990; Scapozza et al., 2015) but they are now forbidden in Switzerland.
5.3 Installation of Borehole Casing
A borehole casing is required to protect sensors from slope deformation and moisture, and for access to the instruments for later servicing. A casing is particularly needed for boreholes in loose debris and has to be installed immediately after extraction of the drill. Failure to do so can cause the borehole walls to sag, collapse or be blocked by falling stones within minutes/hours, preventing insertion of the casing and instruments.
Polyethylene casing or similar material should be used. Metal casing is considered unsuitable due to its high thermal conductivity. The casing must be watertight, and sealed at the base and at all connections. In practice, a completely watertight sealing is challenging as most casings consist of different pieces put together on site. It is best to use the longest possible segments (e.g., 5 m) with threaded sockets, which can be screwed together. Sockets must be thoroughly cleaned, warmed up if necessary, and sealed with special adhesive and/or self-welding tapes. The diameter of the casing is determined on the basis of borehole diameter and of the instruments to be inserted (Section 4). Recent examples are diameters of 67 mm for two temperature sensor strings (e.g., Schilthorn, 2018) or 110 mm accommodating three temperature sensor strings and a smaller casing with an in-place inclinometer (e.g., Murtèl-Corvatsch, 2015). The polyethylene tubes installed at Aiguille du Midi with one thermistor chain each have an inner diameter of only 29 mm (Magnin et al., 2015).
The space between the casing and the substrate should allow room to inject some filling material (sand or grout) to improve the thermal contact between the sensors and the ground and to reduce non-conductive heat transport along the borehole. Tremie tubes are needed in loose material to prevent the material spreading into larger voids. Sand is simple to insert using a funnel between the borehole and the casing, but can be flushed away by subsurface lateral water fluxes, and if simply added from the surface, may not reach the bottom of the borehole. Grout is pumped into several tremie tubes that end at different depths, which can be taped to the outside of the casing before insertion into the borehole to ensure homogeneous distribution. Geotextiles or other fabrics, which can be taped to the casing, should be used in zones with large cavities to restrict the volume of grout pumped into the ground. Grout should be filled from the bottom up, and buoyancy of the casing must be properly addressed. Special permafrost-grout should be used, which sets at negative temperatures and produces less hydration heat. Traditional grout emits hydration heat over several weeks and can cause a substantial thermal disturbance for a few months. Traditional grout can lose integrity by freezing and crumbling before setting, preventing efficient thermal contact between the casing and the surrounding ground. For boreholes in deforming and ice-rich ground, the voids around the casing will be filled by the deformation of the landform, especially in the ice-rich part. However, large gaps between the casing and the boreholes in highly permeable matrix may favor non-conductive heat transport along the borehole, which may in turn lead to a disturbed temperature regime. Foam tubes may be used in boreholes without casing, but installation is more difficult, especially below ca. 10 m depth.
The influence of air convection within the borehole is considered negligible for a casing of smaller diameter (<115 mm) and for small temperature gradients with depth (<0.1°C m–1). This was demonstrated for boreholes in glacier ice (Zotikov, 1986; Haeberli and Funk, 1991), which is a comparable setting. Temperature sensors installed in- and outside of the casing in the first boreholes at Murtèl-Corvatsch showed very similar values (Vonder Mühll and Haeberli, 1990). The 2015-borehole at the same site was filled with sand inside the casing after a few months of operation without a significant effect on the temperatures. Insulation foam can be attached between the temperature sensors in the uppermost meters, where temperature gradients are largest, to prevent convection and to ensure better contact between the sensors and the casing by pressing the sensor string to the borehole wall.
5.4 Borehole Protection at the Ground Surface
Boreholes and instruments need to be protected at the surface. Preferably a short concrete chamber (manhole) with a cast iron lid as applied in civil engineering applications is installed (Figure 6). The concrete chamber should be walled into the surface material and be large enough to place a suspension for the sensor strings and, if required, to store instruments (e.g., data loggers and batteries, see below). The protection chamber must be drained downslope to prevent water from infiltrating into the borehole or from flooding instrumentation. Indeed, water infill and ice plugging can make (parts of) boreholes unusable (Figure 6D). The length of the borehole casing above the surface needs to be accounted for in the design of the sensor chains. The length of the exposed casing can increase with time in ice-rich ground due to subsidence, and cause the sensor wires to be trapped between the borehole and the lid, damaging the wires. This was observed at the Murtèl-Corvatsch borehole after around 30 years of operation (Figure 6B). The concrete segment had to be raised and supported to relieve the cables.
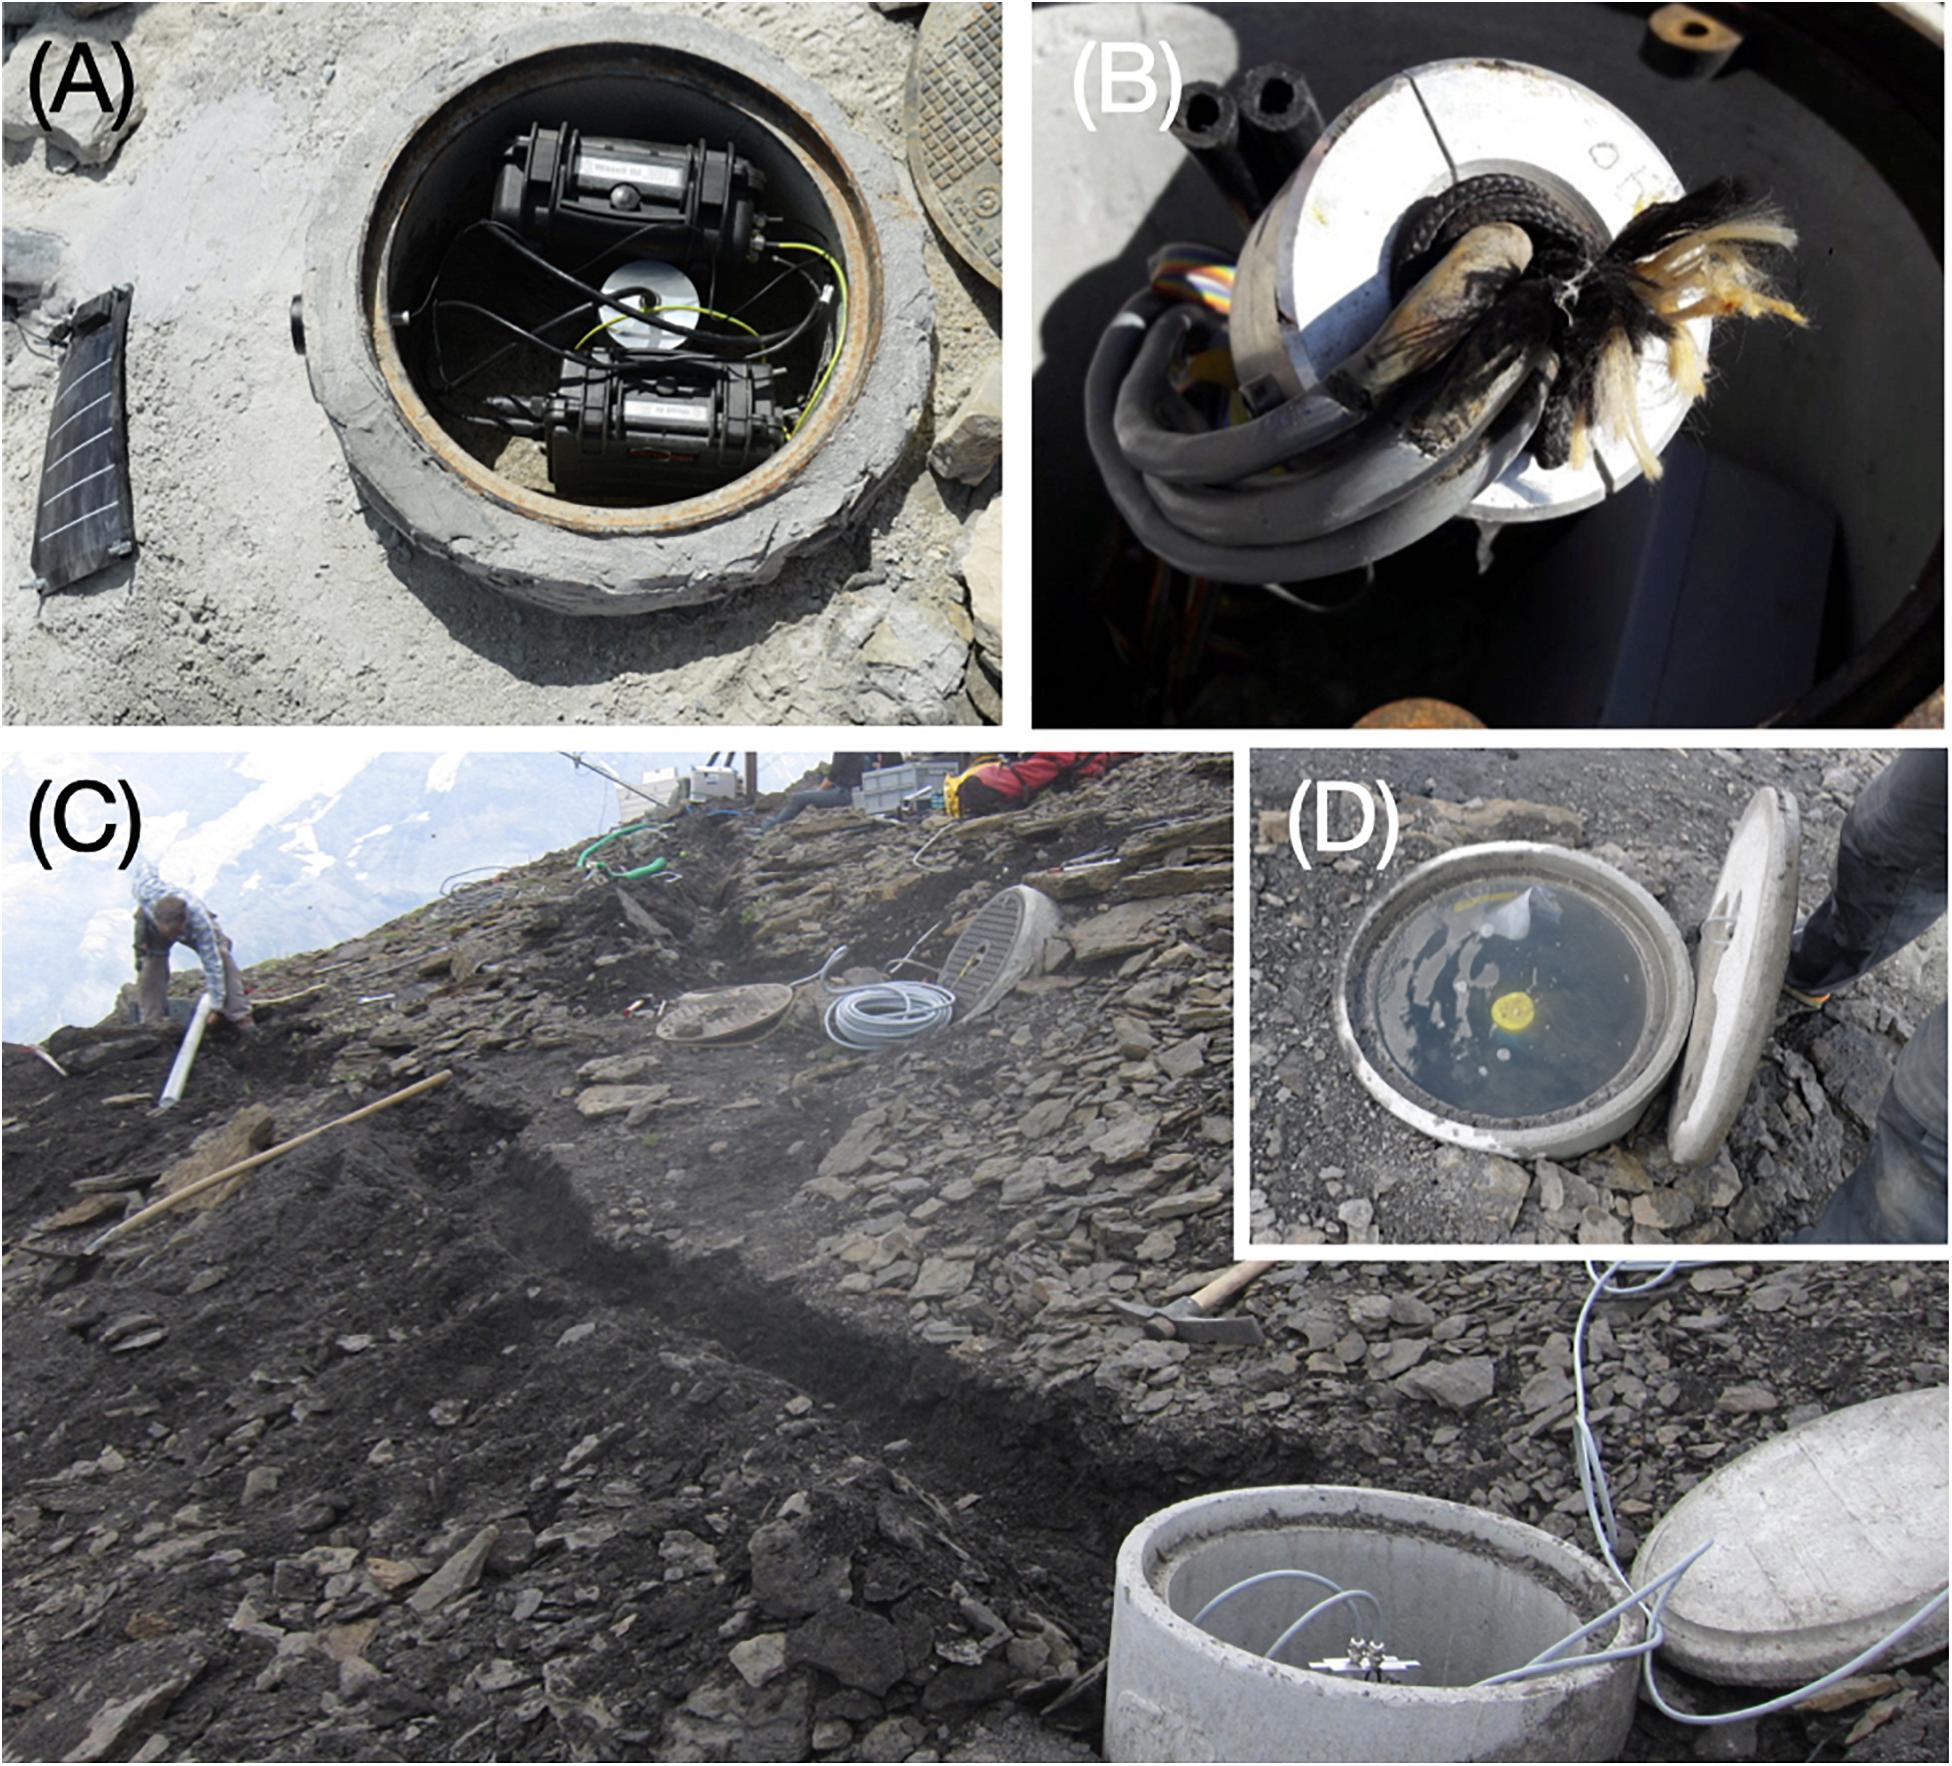
Figure 6. Battery and logging system in a concrete chamber on Wisse Schijen, Switzerland (A, photo: M. Phillips). Damaged cables due to pressure from the lid as a result of subsidence on Murtèl-Corvatsch, Switzerland (B, photo: A. Hasler). Trench and protective casing (white casing in background of the picture) for the cables between the borehole and the instrumentation on Schilthorn, Switzerland (C, photo: A. Hasler). Concrete chamber filled with water above the top of the borehole casing after snow melt on Schilthorn, Switzerland (D, photo: A. Hasler).
6. Temperature Measurement System
The instrumentation for long-term monitoring used must be robust, well-designed and tested to achieve a service life of at least 2–3 decades under harsh conditions where lightning, avalanches and rock falls, as well as large temperature fluctuations (e.g., between −25 and +25°C) are common. The temperature measurement system is required to record data autonomously and continuously with a focus on long-term stability, precision, reliability and maintainability. It includes:
1. the temperature sensors or transducers, which are compiled as one or more cabling configurations, so-called temperature sensor strings (Section 6.1), and
2. a data acquisition and logging system including suitable interface circuitry, digitizer subsystem, lightning protection, and data transmission (Section 6.2).
Calibration of the temperature measurement system is important to guarantee the quality of the data and should be carried out with a setup that models the conditions in the field and minimizes potential error sources (Section 6.3). The target accuracy of the complete measurement system near 0°C should be on the order of ±0.02°C for absolute values. The detection of temperature changes will be more accurate, because calibration issues do not have an impact. The long-term stability of the sensors and the precision of the measurement system should be significantly higher than the expected temperature changes, which are currently in the order of a few decimal degrees Celsius over a decade (Biskaborn et al., 2019; Etzelmueller et al., 2020).
6.1 Temperature Sensors and Strings
Key characteristics for the selection of the sensors are the temperature range, temperature coefficient, the accuracy and long-term stability as well as interchangeability. Temperature sensors suitable for permafrost observation have to cover the anticipated temperature range near the surface and must have their highest absolute accuracy at 0°C. Most industrial temperature sensors are designed for a much higher dynamic range and sensor ratings are typically given for higher temperatures than those required for applications in the cryosphere.
Thermistors are the most frequently used sensors for permafrost temperature measurements. Commonly, negative temperature coefficient thermistors (NTC) with high resistances of 10 to 100 kΩ at 0°C and a temperature coefficient of ca. 5% per°C are used in analog temperature sensor strings, e.g., TE connectivity 44031 (PERMOS, 2019). Positive temperature coefficient thermistors (PTC), such as PT100/1000 sensors, with considerably lower resistivities are often used in MTDs. The errors of the temperature measurements using thermistors depend on (1) the materials and model of the thermistor, (2) the circuitry used to measure the thermistor resistance, (3) the thermal coupling of the sensor to the measured object, (4) the conversion of the measured resistance to temperature, and (5) the aging of the sensor and related cabling, connections and electronics over time (cf. also Biskaborn et al., 2019). Calibration allows variations due to (1) and (2) to be corrected for. A number of linearization methods (4) exist for NTC measurements, for example the widely used Steinhart-Hart equation (Steinhart and Hart, 1968). Lawton and Patterson (2002) found low drift rates of <0.01 mK a–1 at 20°C for NTCs (5).
Thermistor strings are available commercially or can be custom built. Ideally, thermistors should be on individual wires instead of in a common ground wiring. This minimizes the interference of sensors in case of circuit damage and avoids losing all sensors due to a single wire failure, which is particularly important in terrain with considerable deformation. One or two reference resistors on the temperature sensor strings are recommended to measure alongside the thermistors as controls. Hermetic sealing of the strings is essential to prevent moisture ingress into wires, contacts and sensors. Moisture in the sensor cable can lead to disturbance in the measurement (cf. Chapter 7.2), resulting from parallel current or cable corrosion. Standard ways of configuring thermistor strings include the use of polyurethane cabling, heat shrink tubing, industrial potting compound and an integrated strain relief, as cable stretching can cause negative thermistor drift.
In addition to conventional analog thermistor strings, digital temperature strings are receiving increased attention for permafrost measurements in mountain regions. Digitization of the analog signal directly at the measurement point inside the borehole reduces inaccuracies that arise from analog signal transmission to a digitizer located at the surface in a logging box, reducing disturbances from different environmental temperature variations and signal transmission over long and asymmetric cable distances. In addition, such a system is less susceptible to moisture and lightning. Strings of digital sensors, however, are typically on one single cable, meaning that the entire chain fails in case of shearing. Distributed temperature sensing (DTS) using fiber optic cables have also been applied (Luethi and Phillips, 2016; Harrington and Hayashi, 2019), which would allow to measure temperatures over the whole length of the borehole. However, the high energy consumption and calibration requirements reported do not yet allow an implementation for continuous monitoring.
6.2 Data Acquisition and Logging System
Data are registered automatically using a data logger for continuous time series. The data logger runs a program that includes the measurement routine, data format definition, calibration information, conversion parameters, and allows for data storage. It is connected to the temperature sensor string directly or via a multiplexer allowing a larger number of sensors (depending on the logger type) and preferably allows remote access via mobile network, satellite or radio communication. A wide range of data loggers exists and must be selected based on the entire measurement system, e.g., CR1000 Campbell Scientific loggers are used in many newer boreholes in the European Alps. The calculation of mean values based on a sampling routine with multiple measurements per sensor channel and recorded value is theoretically helpful to reduce noise, but increases power consumption. For sensors close to the surface, noise is typically small compared to the high rates of temperature change. For sensors with low rates of temperature change a running mean calculation during post-processing has a similar effect.
Power is typically supplied by solar-panels and/or batteries. Solar panels can be mounted on a pole in avalanche-free locations, whereas they can be attached to the concrete chamber in avalanche terrain, where they only receive solar radiation in snow-free conditions, but are less exposed and vulnerable to damage.
Remote access to the data logger is highly recommended since it significantly reduces the risk and length of data gaps. It allows for rapid identification of potential technical problems as well as prompt intervention and repair (Section 7). Data gaps of several months or even a year can occur when data is manually collected once a year. Gap-filling routines are hardly applicable for such large gaps for temperatures measured above the ZAA. Automatic data transfer also allows for timely reporting of current permafrost conditions, which is increasingly demanded by stakeholders, the media and the public. Data transfer may be achieved via mobile data services. At locations where cell phone network coverage is problematic – which is often the case in mountain areas – satellite data may be an alternative. The data storage capacity of the on-site data logger should allow data storage for at least 1 or 2 years to allow for infrequent site visits.
Lightning protection is important at exposed high mountain sites and has to cover the entire borehole setup. The vulnerability of the measurement system to lightning damage can be significantly reduced. The length of cables at the ground surface should be kept minimal, and the system be grounded at one point only. A combination of temperature sensor strings and meteorological sensors with a multiplexer on the same data logger (as used for the PACE sites) as well as a setup with the data logger outside the concrete chamber is more susceptible to lightning damage. It is therefore not recommended and only applicable when reliable communication is available to regularly check the functioning of the system. In addition, shielding of the cables, insulation of susceptible components and surge protection for connections leaving the logging box are recommended. In general, lightning damage hardly affects well protected thermistor strings and occurs less frequently in the logger box than problems related to water and moisture intrusion.
The logging system must be protected from moisture and have watertight cables. If the logger box is installed directly in the concrete chamber (Figure 6A), it should be gas tight and equipped with replaceable desiccant units. Here it is also best protected against storms, rock fall, avalanches, animals or vandalism. In avalanche safe terrain, it may also be mounted on a mast together with solar panels, allowing for solar energy all year round, better mobile reception or easy access in winter (cf. Figure 1). Such un-shaded boxes in the free atmosphere should be well ventilated to prevent condensation inside the box. Short cables between the borehole and the logger box not only reduce lightning exposure, but also surface temperature variations influencing the measurement via heat conduction along the cables (Figure 6C).
6.3 Calibration Procedure
In general, the detection of temperature changes is more accurate than absolute temperature measurements because calibration errors have less impact. For the first, stability of the sensors is the determining factor. For the latter, precise calibration of the temperature sensors is required prior to installation using the same configuration of the measurement system (sensors, logger, multiplexer etc.) as will be installed in the field to achieve repeatable accuracy. The main interest for permafrost temperature measurements is best possible accuracy around the freezing point of water.
A single-point (or offset) calibration in a stirred ice-water bath at 0°C constitutes the most suitable calibration method. A precise reference thermometer should be used to check that the ice bath is properly mixed and at 0°C ± 0.01°C during the entire procedure (Wise, 1988). The entire sensor chain has to be well covered within the ice-water bath and must not touch any walls of the container. We recommend a double bath configuration (Figure 7). The calibration should be performed in cold atmospheric conditions (<10°C) without influence of solar radiation. An elaborate multiple-point calibration in an alcohol bath (Merlone et al., 2020) is not considered necessary for the available high precision thermistors with the focus on 0°C and on temperature changes. A quick, but highly practical field method to test sensor precision is to bury the temperature sensor chain in wet snow at 0°C. However, this method does not enable the same high accuracy to be evaluated as in the stirred ice-water bath due to potential problems with thermal coupling of the sensor or radiation influence. It is mainly useful to detect larger problems of the measurement system.
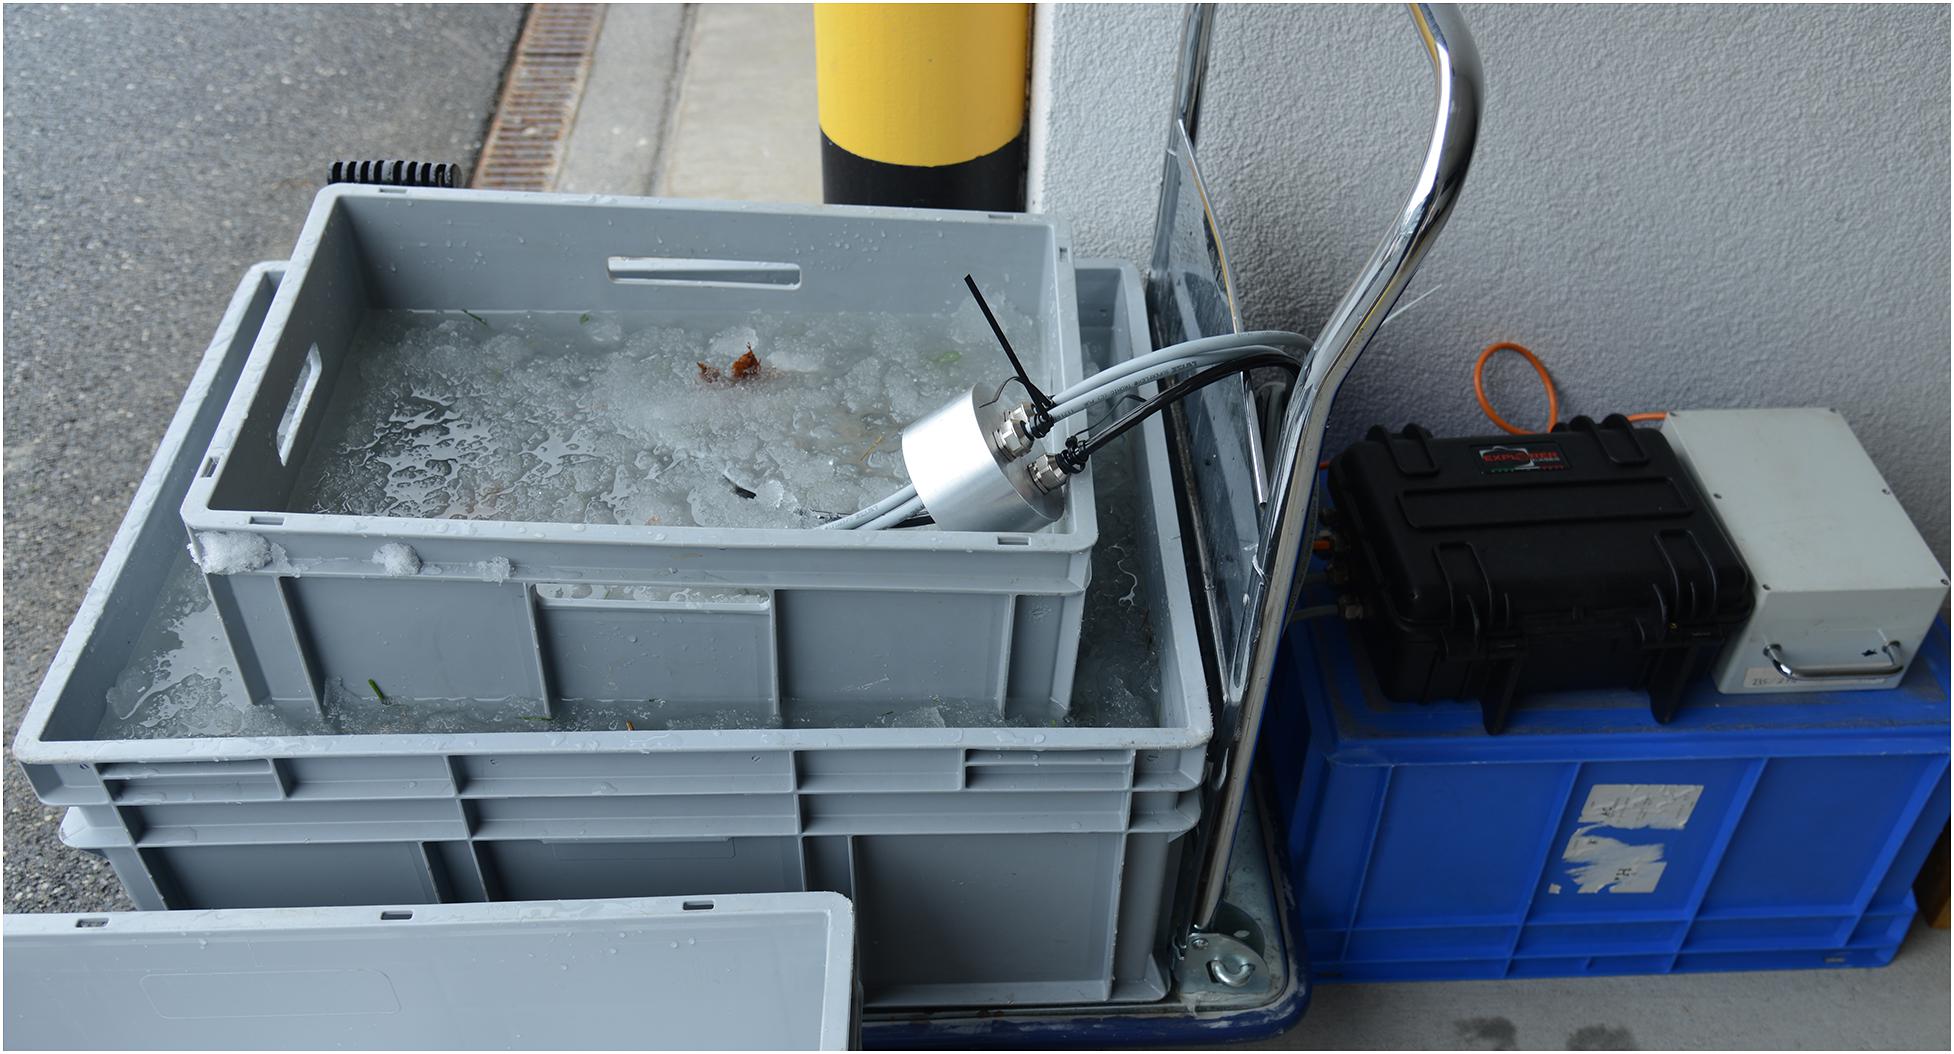
Figure 7. A 0°C crushed ice-water bath for calibration of temperature sensors. The use of a double bath minimizes external temperature influences. The ice-water mixture must be stirred constantly during calibration and the temperature controlled by a high-precision reference thermometer. Photo: M. Phillips.
6.4 Installation of the Measurement System
The installation of the measurement system in the field is a critical step and needs to be well prepared. If several strings or instruments are to be installed simultaneously, they have to be tied together to ensure relative alignment on a smooth surface such as a large parking lot (Figure 8A). Long instrument strings of several tens of meters length, connecting multiple instruments, have a significant weight so that a helicopter might be required for lifting and lowering them into the borehole (e.g., PACE drilling in Janssonhaugen, Svalbard or on Murtèl-Corvatsch, Switzerland in 2015, Figure 8B). It is crucial that the ground surface level (i.e., 0 m) and the top of the casing are clearly defined and documented and the temperature sensor string is placed accordingly. A suspension device for the instruments is required to secure the constant position of the string (Figure 8C). To prevent it from being pulled into the borehole and the wires from stretching, the weight and diameter of the string(s) must be considered during their design. Improvisation to reduce the length of the pre-fabricated sensor strings was required in some cases because boreholes were shorter than planned. In such a case, the lower end of the sensor chain must be folded upward. If this is not possible, the lower part has to be cut and sealed. Otherwise the more densely instrumented upper part of the sensor string cannot be placed inside the borehole and must rolled up and placed inside the concrete chamber (the new sensor depths must be noted!).
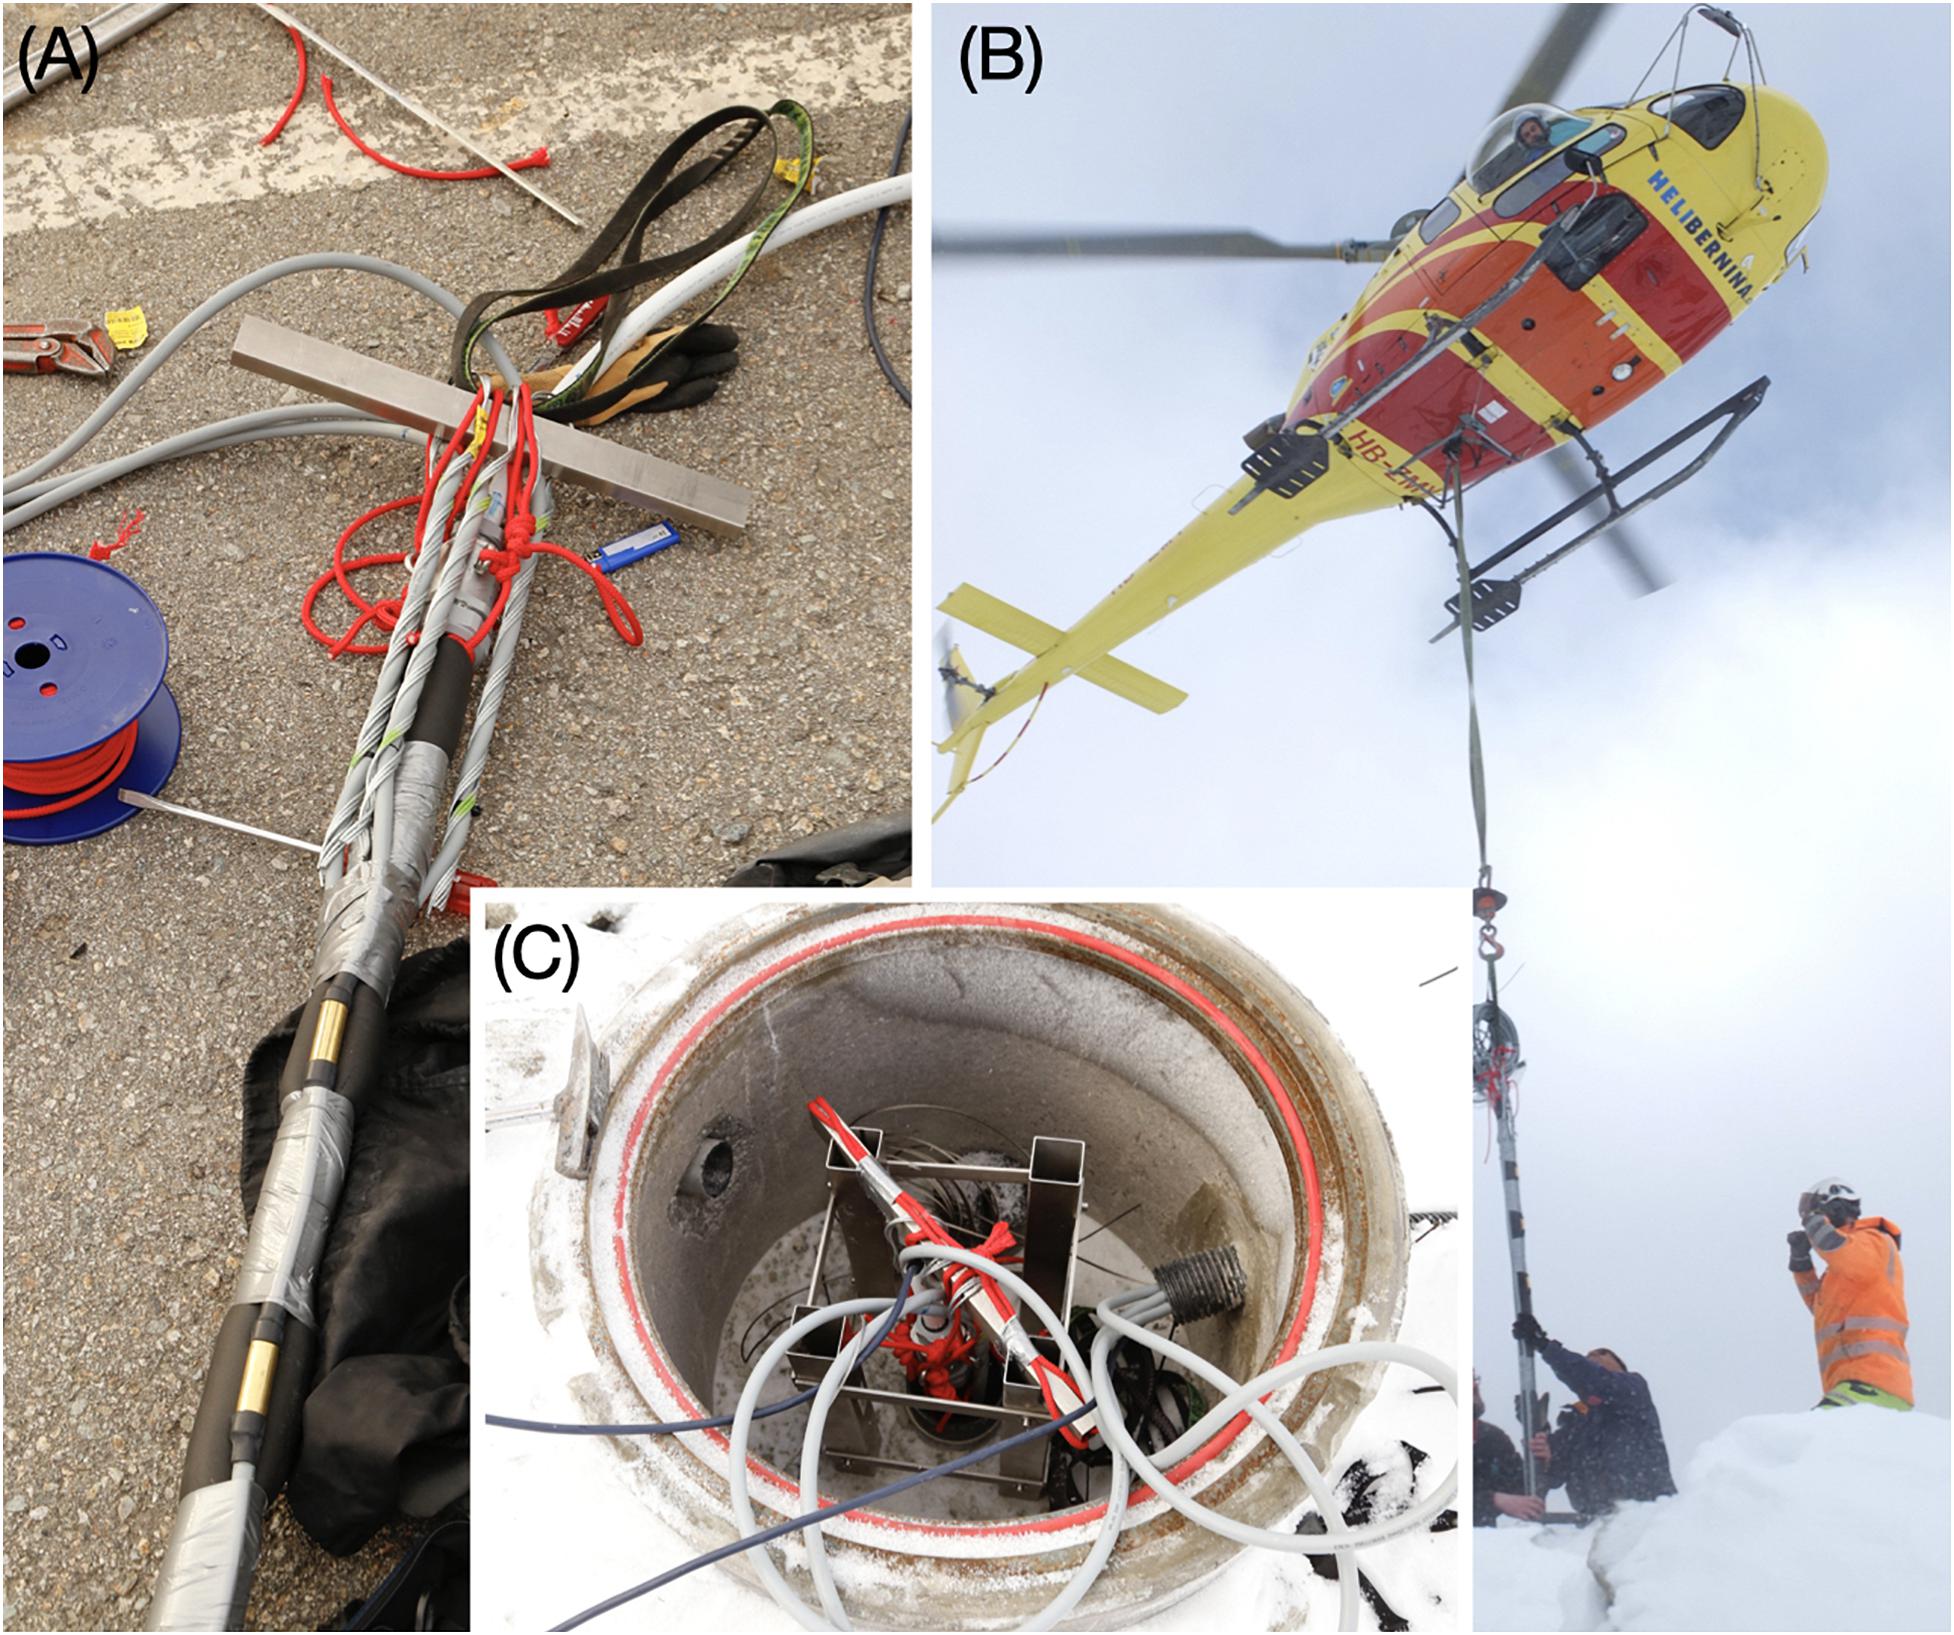
Figure 8. Installation of the sensor instruments into the borehole at Murtèl-Corvatsch in September 2015. Relative assembling of the three temperature sensor strings and the SAAF device (A, photo: A. Bast), installation in the borehole with a helicopter (B, photo: D. Wasser), and suspension device (C, photo: A. Bast).
7. Maintenance
7.1 Field Visits
Regular maintenance of the instruments is essential for successfully collecting continuous high-quality data, to repair or replace broken parts and to prolong the service life of the equipment. Maintenance includes at least one field visit per year with visual control of all parts of the measurement system, i.e., logger box, modem and antenna, cables at the surface and their connections and protection. Regular field visits are particularly important if there is no remote access. Taking photographs of each part of the measurement system and the conditions at the site at each visit for the documentation of the current state (and hence any changes) has proven key for future reference. A standardized field visit protocol helps with the full documentation of all the visits including the work completed and changes or updates made to the instruments or logger program (Supplementary Material 2). Without such information, later data control or homogenization is extremely difficult, requires time-consuming detective work or sometimes is even impossible. A station history was often not recorded systematically in science-driven monitoring networks leading to parts of long time series with inconsistencies that can no longer be resolved.
7.2 Regular Data Control
Regular, thorough and standardized data controls allow for fast intervention in case of interruption or problems, for example, noise or measurement instabilities due to external influences such as moisture, from inconsistencies due to changes or replacements in the measurement system (e.g., new logger, program, and rewiring) or from sensor drift. Regular visual data controls, e.g., once a month, can be achieved by online browsing tools with standardized overview and detail plots for each station if data is available online. Service variables such as battery voltage must be controlled, facilitating the detection of potential error sources.
Best practice for data control within PERMOS currently includes both visual checking and plausibility checks. Value range checks (i.e., testing whether values lie within acceptable limits) and checks on time consistency (i.e., testing on plausible rates of change and unrealistic data departures) are the most straight-forward basic quality control procedures to automatize (Zahumenský, 2004). Temperatures should also be evaluated in the context of the depth profile, i.e., is the gradient reasonable, do the temperatures change with depth and time with a realistic lag, and do thermal disturbances such as taliks behave as expected? Zero curtain calibration is important to validate temperature data in the active layer. However, it must be kept in mind that in low-porosity ground the zero curtain may equilibrate below 0°C. Reference resistors and duplicate measurements (see Section 4) are important to distinguish faulty measurements from real signals, which is sometimes very challenging because variability, rates or patterns can be similar.
For example, water and moisture fluxes can result in sudden warming/cooling spikes in the temperature data (e.g., Phillips et al., 2016; Figure 9) or high temperature variability at depth were only conductive signals are expected. It is difficult to differentiate whether such signals result from advective processes in the permafrost (correct measurement), from water intrusion into the borehole (correct measurement, but a problem linked to the installation) or moisture intrusion into the cables or sensors (erroneous measurement). Humidity was also found to exacerbate positive thermistor drift (Lawton and Patterson, 2002). Sensor drift must be distinguished from real temperature changes to prevent false interpretation of warming/cooling signals. Examples are given by Luethi and Phillips (2016) and in Figure 9. Long-term sensor drift, i.e., over several years, is mainly sensor specific, as shown by constant reference resistors, and can result from sealing effects of the temperature sensor string triggered by compression or moisture. A single drifting sensor can be detected through its anomalous trend compared to neighboring sensors or zero curtain calibration for sensors in the active layer (cf. above). Since the drifting rates are small and can be in the same range as expected warming rates, drift may only become apparent after a year or more, especially at shallow depths with large temperature variations. It is therefore crucial to assess the data quality in context of the previous data regularly, for example, annually before submission to (inter)national data centers.
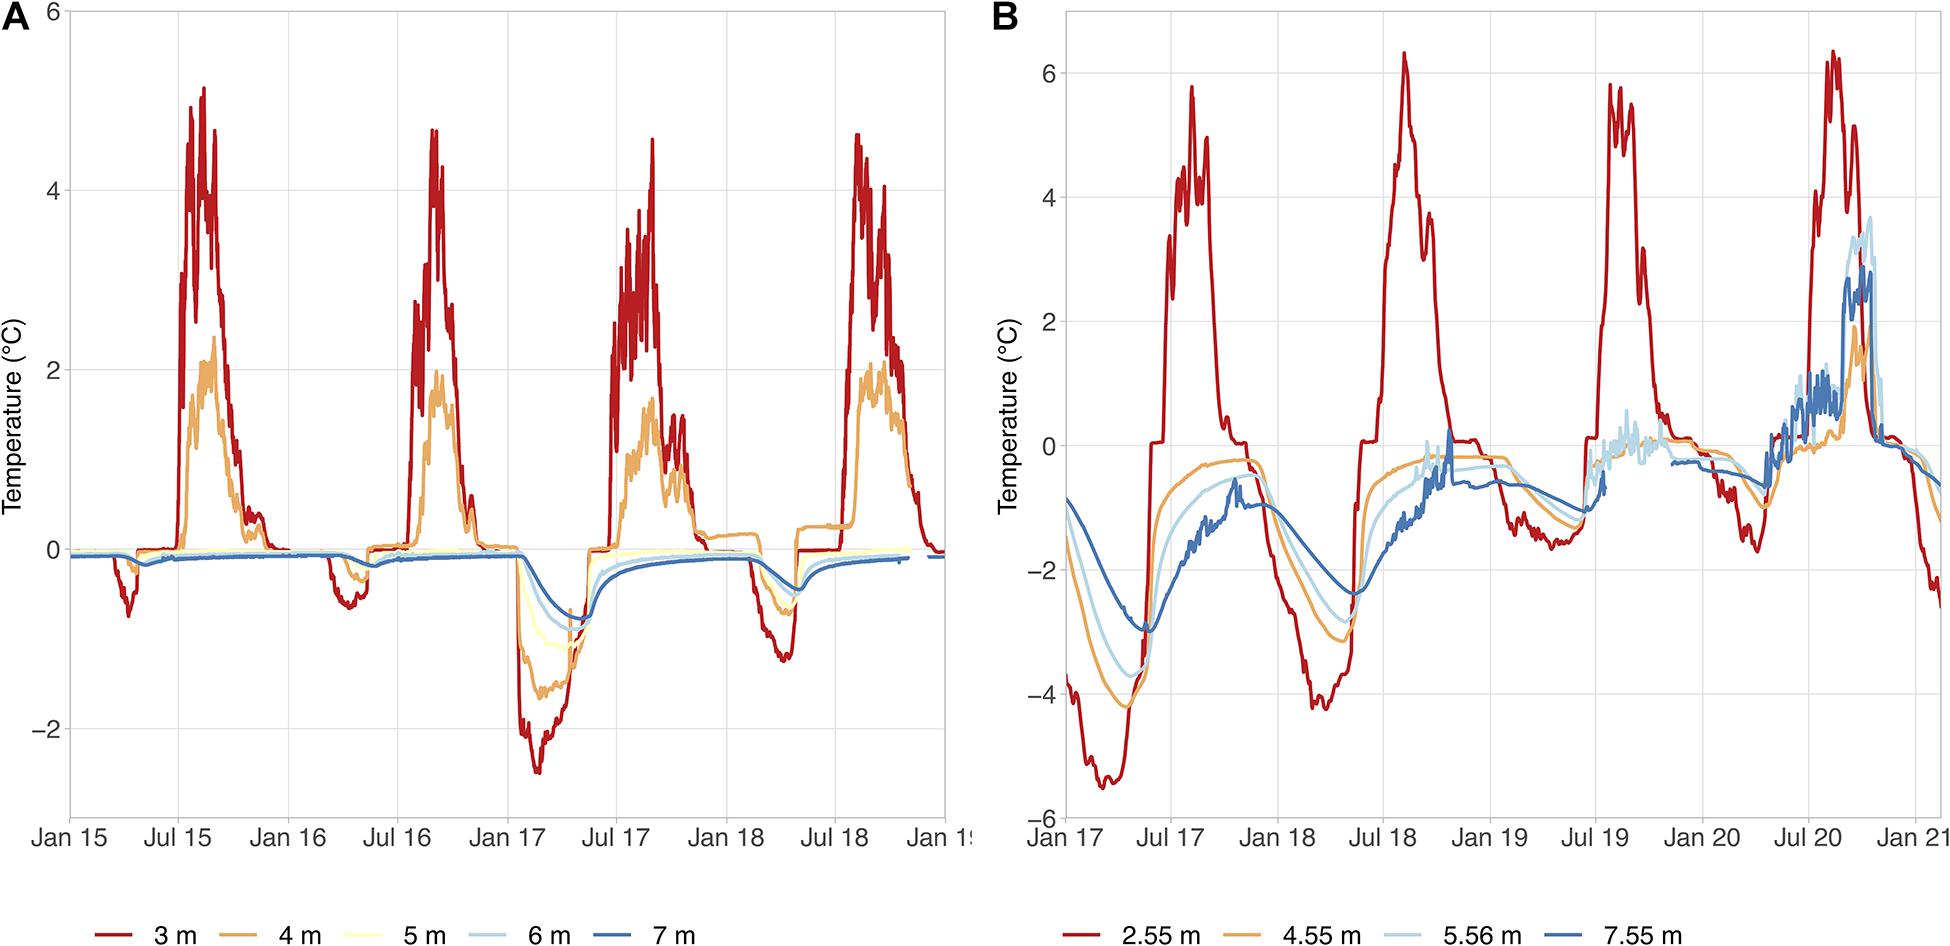
Figure 9. Two examples of permafrost temperature time series with questionable data, which was detected during data control and flagged as doubtful or erroneous. (A) Sensor drift at a depth of 4 m, which can be detected based on the zero curtain and comparison with neighboring sensors. (B) The sensors at 4.55, 5.56, and 7.55 m depth increasingly show positive temperature peaks, which is a typical effect attributed to liquid water. It is difficult to distinguish whether they are caused by advection inside the borehole or moisture effects in the electronics. Data source: PERMOS.
Quality control often includes site knowledge from the principal investigator and cross-correlation with measurements from neighboring sensors and stations to test for consistency. A quality assurance/quality control (QA/QC) protocol should be developed at the beginning of the monitoring program, all observations on data quality should be carefully and systematically documented and suspicious or faulty data should be flagged and masked accordingly. However, corresponding guidelines or standards for permafrost temperature observations in boreholes are hardly available and need to be developed in the future based on existing experience with national and international data collections.
7.3 Recalibration
Sensor recalibration is important to be able to identify measurement drift or other potential inaccuracies and is often mandatory in operational measurement networks (WMO, 2008). Recalibration is advisable after 5–10 years of operation for permafrost temperature measurements or subsequent to important changes in the measurement system, such as new junction boxes or logger replacement. It should follow the procedures described in Section 6.3. It is however important to stress that for permafrost boreholes in mountain regions re-calibration is often not feasible in practice due to blocked sensor strings. In addition, the risk of not being able to re-install the sensor string at exactly the same location in the borehole is high. In view of the long-term stability of high-quality temperature sensors, we therefore only recommend recalibration in case of persistent inconsistencies or measurement problems. If recalibration is impossible, plausibility checks and quality control as described above (Section 7.2) are the only options for data validation. In case of persistent problems and blocked instruments a new borehole may have to be drilled nearby to secure the continuation of the time series.
8. Re-Drilling of Boreholes
Four boreholes had to be replaced between 2015 and 2019 within the PERMOS network because of reduced data quality and lack of access to the sensors (PERMOS, 2019). Replacing a number of key boreholes by re-drilling may become increasingly necessary, since many of the borehole stations were installed 20–30 years ago and are thus likely reach the end of their service life. The goal of a re-drilling project is to secure the continuation of a long-term time series, and therefore permafrost conditions should be as similar to the original ones as possible. The new borehole should:
1. be located close to the old borehole with similar surface and subsurface characteristics (but without endangering the operation of the existing borehole),
2. be designed to measure at the same depths, ideally with the same total depth, and
3. allow for a temporal overlap with the original time series (GCOS, 2004) and a homogenization of the data.
First experiences with borehole replacement from the Swiss Alps show a high agreement of original and new borehole temperatures, both in their temporal evolution and in terms of the depth profile of annual mean temperatures (PERMOS, 2019). The longest time series from Murtèl-Corvatsch was successfully validated in this manner after 30 years of operation without recalibration due to lack of access to the sensors.
9. Conclusion and Outlook
We have described the best practices for the installation of boreholes for long-term observation of permafrost temperatures in mountain regions. These include the selection of the site and detailed drilling location, borehole drilling and casing, selection and calibration of the measurement system, installation of the field instruments, and, finally, regular maintenance and data control. The recommendations presented emerged mainly from experiences gained from activities in the European Alps and in the framework of the Swiss PERMOS network and relate to single sites as well as a network. However, we are convinced that many aspects presented are important for any permafrost borehole installation, be it in mountain regions or in polar lowlands. Standardized procedures are currently limited but necessary for a fully operational, global permafrost monitoring including international coordination and comparable data for all permafrost regions worldwide. Standardization and best practice recommendations will lead to less field interventions and longer service life as well as higher data quality. And they are indispensable for more robust scientific outcomes and greater opportunities to contribute to managing natural hazards affected by climate change.
We concluded based on experience gained that the major challenges for the drilling of a permafrost borehole in mountain regions are the stabilization of the borehole in loose material, inhomogeneous underground material including ice and rock and the cooling of the drilling bits with air to avoid that the permafrost’s temperature regime is affected. To ensure a service life of several decades, very high attention must be given to avoid water and moisture intrusion into the borehole and related measurement systems, and considerable slope deformation must be accounted for. In many cases, the temperature sensors were blocked after a few years and no longer accessible. These challenges are particularly important when drilling in talus slopes and rock glaciers. The major difficulties in steep solid bedrock relate to logistics (access, installation and safety of the drilling site). Hazards such as lightning, rock fall and avalanches are important threats, and may cause interruption of the time series or threaten the drilling campaign.
A thorough installation procedure with focus on long-term stability of the selected sensors and robustness of the measurement system as well as on waterproofing and lightning protection of all parts must be followed. This mainly includes (1) temperature sensor strings with a high accuracy, calibrated at 0°C and with an excellent long-term stability (±0.02°C at 0°C for the entire system), (2) duplication of sensors at important depths for data validation and as backup for erroneous sensors in case recalibration is not possible due to blocked instruments, (3) remote data access for both fast detection of potential problems and timely reporting, and (4) standardization, thorough documentation, and archiving of the maintenance procedures to minimize efforts of subsequent data processing and curing. Early planning of renovations or replacement with a new drilling is important to avoid data gaps and to ensure a suitable temporal overlap between measurement time series. Since permafrost research in mountain regions is a relatively young and dynamic field of research (Haeberli et al., 2010), best practices and standards for operational monitoring should be evaluated continuously, and adapted as new technologies and findings emerge.
The production of high-quality borehole temperature time series does not end with the raw data being collected on a logger. It crucially includes secure storage, quality control, data cleaning and gap-filling and, last but not least, the derivation of secondary products such as aggregations, active layer thickness, or warming rates. In part, available guidelines for meteorological data can be applied for the processing of permafrost temperature data. However, permafrost temperature data have to be treated with different statistical and gap-filling procedures, e.g., due to the time lag and dampening with depth or during phase change. Today, best practices and standards for the data processing are hardly available for time series of permafrost temperatures and should therefore be developed with high priority in the future. Modeling approaches may also be helpful for data validation, where sensor recalibration is not possible. By following the recommendations presented in this paper we believe the first critical step toward high quality monitoring of mountain permafrost can be achieved.
Data Availability Statement
Publicly available datasets were analyzed in this study. This data can be found here: All PERMOS borehole temperature data are subject to the PERMOS Data Policy (open access for non-commercial use) and available online via http://permos.ch/data.html. The latest DOI is 10.13093/permos-2021-01.
Author Contributions
JN and MP initiated the manuscript and designed the concept. JN wrote the initial manuscript, to which all authors contributed in several iterations to consolidate the recommendations. LA, AB, RD, DF, SG, AH, CH, MHo, WH, CL, JN, MP, SS, and DV were involved in the scientific leading of drilling campaigns in the Swiss Alps or within PACE, and/or have been the main person responsible for one or more PERMOS boreholes over many years. HG, AH, and MHi were involved in the technical design, renovation and maintenance of several permafrost boreholes in the Swiss Alps as well as in polar areas. All authors contributed to the article and approved the submitted version.
Funding
PERMOS is run by the six research institutions ETH Zurich, Universities of Fribourg, Lausanne and Zurich, University of Applied Sciences and Arts of Southern Switzerland, and the WSL Institute for Snow and Avalanche Research SLF, which contribute with considerable in-kind support. Substantial financial support for the PERMOS Network is provided by MeteoSwiss in the framework of GCOS Switzerland, the Federal Office for the Environment and the Swiss Academy of Sciences.
Conflict of Interest
LA was employed by BGC Engineering Inc., HG by Alpug GmbH, and AH by SensAlpin GmbH. These companies design and operate measuring systems in high mountain areas, including borehole stations for long-term observation of permafrost. SG was affiliated with a company distributing measuring systems in North America.
The remaining authors declare that the research was conducted in the absence of any commercial or financial relationships that could be construed as a potential conflict of interest.
Acknowledgments
This manuscript summarizes experiences with borehole temperature measurements for permafrost monitoring collected over 30 years in the Swiss Alps, and over 20 years in the framework of the Swiss Permafrost Monitoring Network PERMOS. This endeavor relied on a large number of scientists, technicians and helpers in the field in the framework of several research projects, and on the support of many institutions, who are not all in the author list of this manuscript. We highly appreciate all their work, collaboration and support. We also like to thank the two reviewers for their very useful and constructive comments.
Supplementary Material
The Supplementary Material for this article can be found online at: https://www.frontiersin.org/articles/10.3389/feart.2021.607875/full#supplementary-material
References
Allen, S. K., Fiddes, J., Linsbauer, A., Randhawa, S. S., Saklani, B., and Salzmann, N. (2016). Permafrost studies in kullu district, Himachal Pradesh. Curr. Sci. 111:550. doi: 10.18520/cs/v111/i3/550-553
Arenson, L. U. (2002). Unstable Alpine Permafrost: A Potentially Important Natural Hazard – Variations of Geotechnical Behaviour With Time and Temperature. Ph.D. thesis, Institute for Geotechnical Engineering, Swiss Federal Institute of Technology (ETH), Zürich.
Arenson, L., Hoelzle, M., and Springman, S. M. (2002). Borehole deformation measurements and internal structure of some rock glaciers in Switzerland. Permafr. Periglac. Process. 13, 117–135. doi: 10.1002/ppp.414
Arenson, L. U., Kääb, A., and O’Sullivan, A. (2016). Detection and analysis of ground deformation in permafrost environments: ground deformation in permafrost environments: detection and analysis. Permafr. Periglac. Process. 27, 339–351. doi: 10.1002/ppp.1932
Barsch, D. (1977). Alpiner permafrost – ein beitrag zur verbreitung, zum character und zur ökologie am beispiel der schweizer alpen. Abh. Akad. Wiss. Gött. Math. Phys. Kl 3, 118–141.
Barsch, D., Fierz, H., and Haeberli, W. (1979). Shallow core drilling and bore-hole measurements in the permafrost of an active rock glacier near the grubengletscher, wallis, Swiss Alps. Arct. Alp. Res. 11:215. doi: 10.2307/1550646
Biskaborn, B. K., Lanckman, J.-P., Lantuit, H., Elger, K., Dmitry, S., William, C., et al. (2015). The new database of the global terrestrial network for permafrost (GTN-P). Earth Syst. Sci. Data 7, 245–259. doi: 10.5194/essd-7-245-2015
Biskaborn, B. K., Smith, S. L., Noetzli, J., Matthes, H., Vieira, G., Streletskiy, D. A., et al. (2019). Permafrost is warming at a global scale. Nat. Commun. 10:264. doi: 10.1038/s41467-018-08240-4
Bojinski, S., Verstraete, M., Peterson, T. C., Richter, C., Simmons, A., and Zemp, M. (2014). The concept of essential climate variables in support of climate research, applications, and policy. Bull. Am. Meteorol. Soc. 95, 1431–1443. doi: 10.1175/BAMS-D-13-00047.1
Brown, J., Hinkel, K. M., and Nelson, F. E. (2000). The circumpolar active layer monitoring (CALM) program: research designs and initial results. Polar Geogr. 24, 166–258. doi: 10.1080/10889370009377698
Brown, N., Gruber, S., Pulsifer, P., and Stewart-Jones, E. (2020). Permafrost Data Workshop Final Report. Ottawa, ON: NSERC PermafrostNet. doi: 10.22215/pn/10120001
Buchli, T., Kos, A., Limpach, P., Merz, K., Zhou, X., and Springman, S. M. (2018). Kinematic investigations on the Furggwanghorn Rock Glacier, Switzerland. Permafr. Periglac. Process. 29, 3–20. doi: 10.1002/ppp.1968
Buchli, T., Merz, K., Zhou, X., and Kinzelbach, W. (2013). Characterization and monitoring of the furggwanghorn rock glacier, turtmann valley, Switzerland: results from 2010 to 2012. Vadose Zone J. 12, 1–15. doi: 10.2136/vzj2012.0067
Burgess, M. M., Smith, S. L., Brown, J., Romanovsky, V. E., and Hinkel, K. (2000). “The Global Terrestrial Network for Permafrost (GTNet-P): permafrost monitoring contributing to global climate observations”, Geological Survey of Canada. (in press).
Cicoira, A., Beutel, J., Faillettaz, J., Gärtner-Roer, I., and Vieli, A. (2019a). Resolving the influence of temperature forcing through heat conduction on rock glacier dynamics: a numerical modelling approach. Cryosphere 13, 927–942. doi: 10.5194/tc-13-927-2019
Cicoira, A., Beutel, J., Faillettaz, J., and Vieli, A. (2019b). Water controls the seasonal rhythm of rock glacier flow. Earth Planet Sci. Lett. 528:115844. doi: 10.1016/j.epsl.2019.115844
Delaloye, R. (2004). Contribution à L’étude du Pergélisol de Montagne en Zone Marginale. Ph.D. dissertation. Fribourg: University of Fribourg, 238.
Delaloye, R., Morard, S., Barboux, C., Abbet, D., Gruber, V., Riedo, M., et al. (2013). “Rapidly moving rock glaciers in mattertal,” in Jahrestagung der Schweizerischen Geomorphologischen Gesellschaft, ed. C. Graf (St. Niklaus: Eidg. Forschungsanstalt WSL), 21–31. doi: 10.1002/ppp.1960
Delaloye, R., and Vonder Mühll, D. (1998). “Concept for a Swiss permafrost observation network,” in Proceedings of the 7th International Conference on Permafrost Yellowknife, NT: 134–135.
Etzelmueller, B., Guglielmin, M., Hauck, C., Hilbich, C., Hoelzle, M., Isaksen, K., et al. (2020). Twenty years of european mountain permafrost dynamics – the PACE legacy. Environ. Res. Lett. 15:104070. doi: 10.1088/1748-9326/abae9d
GCOS (2004). Implementation Plan for the Global Observing System for Climate in support of the UNFCCC. Geneva: World Meteorological Organization (WMO TD 1219), 136.
Gisnas, K., Etzelmuller, B., Farbrot, H., Schuler, T. V., and Westermann, S. (2013). CryoGRID 1.0: permafrost distribution in norway estimated by a spatial numerical model. Permafr. Periglac. Process. 24, 2–19. doi: 10.1002/ppp.1765
Gruber, S., Burn, C. R., Arenson, L., Geertsema, M., Harris, S., Smith, S., et al. (2015). “Permafrost in mountainous regions of Canada,” in Proceedings of the GeoQuebec 2015 Conference, September 20-23 Quebec, ON.
Gruber, S., Fleiner, R., Guegan, E., Panday, P., Schmid, M.-O., Stumm, D., et al. (2017). Review article: inferring permafrost and permafrost thaw in the mountains of the Hindu Kush Himalaya region. Cryosphere 11, 81–99. doi: 10.5194/tc-11-81-2017
Gruber, S., and Haeberli, W. (2009). “Mountain permafrost,” in Permafrost Soils. Soil Biology. Margesin, R (Heidelberg: Springer), 33–44. doi: 10.1007/978-3-540-69371-0_3
Gruber, S., Hoelzle, M., and Haeberli, W. (2004a). Rock-wall temperatures in the Alps: modelling their topographic distribution and regional differences. Permafr. Periglac. Process. 15, 299–307. doi: 10.1002/ppp.501
Gruber, S., King, L., Kohl, T., Herz, T., Haeberli, W., and Hoelzle, M. (2004b). Interpretation of geothermal profiles perturbed by topography: the alpine permafrost boreholes at Stockhorn Plateau, Switzerland. Permafr. Periglac. Process. 15, 349–357. doi: 10.1002/ppp.503
Haeberli, W., and Funk, M. (1991). Borehole temperatures at the Colle Gnifetti core-drilling site (Monte Rosa, Swiss Alps). J. Glaciol. 37, 37–46. doi: 10.3189/s0022143000042775
Haeberli, W., Hoelzle, M., Keller, F., Schmid, W., Vonder Mühll, D., and Wagner, S. (1993). “Monitoring the long-term evolution of mountain permafrost in the Swiss Alps,” in Proceedings of the 6th International Conference on Permafrost Bejing, 214–219.
Haeberli, W., Huder, J., Keusen, H.-R., Pika, J., and Röthlisberger, H. (1988). “Core drilling through rock glacier-permafrost,” in Proceedings of the 5th International Conference on Permafrost Trondheim, 937–942.
Haeberli, W., Noetzli, J., Arenson, L., Delaloye, R., Gärtner-Roer, I., Gruber, S., et al. (2010). Mountain permafrost: development and challenges of a young research field. J. Glaciol. 56, 1043–1058. doi: 10.3189/002214311796406121
Harrington, J. S., and Hayashi, M. (2019). Application of distributed temperature sensing for mountain permafrost mapping. Permafr. Periglac. Process. 30, 113–120. doi: 10.1002/ppp.1997
Harris, C., Arenson, L., Christiansen, H. H., Etzelmüller, B., Frauenfelder, R., Gruber, S., et al. (2009). Permafrost and climate in Europe: monitoring and modelling thermal, geomorphological and geotechnical responses. Earth Sci. Rev. 92, 117–171. doi: 10.1016/j.earscirev.2008.12.002
Harris, C., Haeberli, W., Vonder Mühll, D., and King, L. (2001). Permafrost monitoring in the high mountains of Europe: the PACE Project in its global context. Permafr. Periglac. Process. 12, 3–11. doi: 10.1002/ppp.377
Hasler, A., Geertsema, M., Foord, V., Gruber, S., and Noetzli, J. (2015). The influence of surface characteristics, topography and continentality on mountain permafrost in British Columbia. Cryosphere 9, 1025–1038. doi: 10.5194/tc-9-1025-2015
Hilbich, C., Hauck, C., Hoelzle, M., Scherler, M., Schudel, L., Völksch, I., et al. (2008). Monitoring mountain permafrost evolution using electrical resistivity tomography: a 7-year study of seasonal, annual, and long-term variations at Schilthorn, Swiss Alps. J. Geophys. Res. 113:F01S90. doi: 10.1029/2007JF000799
Hock, R., Alder, C., Caceres, B., Gruber, S., Hirabayashi, Y., Jackson, M., et al. (2019). “High mountain areas,” in IPCC Special Report on the Ocean and Cryosphere in a Changing Climate, eds H.-O. Pörtner, D. C. Roberts, V. Masson-Delmotte, P. Zhai, M. Tignor, E. Poloczanska, et al. 131–202.
Hoelzle, M., Haeberli, W., Stocker-Mittaz, C., Phillips, M., Springman, S. M., and Arenson, L. (2003). “Miniature ground temperature data logger measurements 2000-2002 in the Murtèl-Corvatsch area,” in Proceedings of the 8th International Conference on Permafrost Zurich, 419–424.
Hoelzle, M., Wegmann, M., and Krummenacher, B. (1999). Miniature temperature dataloggers for mapping and monitoring of permafrost in high mountain areas: first experience from the Swiss Alps. Permafr. Periglac. Process. 10, 113–124. doi: 10.1002/(sici)1099-1530(199904/06)10:2<113::aid-ppp317>3.0.co;2-a
Isaksen, K., Holmlund, P., Sollid, J. L., and Harris, C. (2001). Three deep Alpine-permafrost boreholes in Svalbard and Scandinavia. Permafr. Periglac. Process. 12, 13–25. doi: 10.1002/ppp.380
Isaksen, K., Vonder Mühll, D., Gubler, H., Kohl, T., and Sollid, J. L. (2000). Ground surface-temperature reconstruction based on data from a deep borehole in permafrost at Janssonhaugen, Svalbard. Ann. Glaciol. 31, 287–294. doi: 10.3189/172756400781820291
Juliussen, H., and Christiansen, H. H. (2010). NORPERM, the Norwegian permafrost database–a TSP NORWAY IPY legacy. Earth Syst. Sci. Data 2, 235–246. doi: 10.5194/essd-2-235-2010
Kääb, A. (2002). Monitoring high-mountain terrain deformation from repeated air- and spaceborne optical data: examples using digital aerial imagery and ASTER data. ISPRS J. Photogramm. Remote Sens. 57, 39–52. doi: 10.1016/s0924-2716(02)00114-4
Karl, T., Bretherton, F., Easterling, W., Miller, C., and Trenberth, K. (1995). Long-term climate monitoring by the Global Climate Observing System (GCOS). Clim. Chang. 31, 135–147. doi: 10.1007/BF01095142
Kellerer-Pirklbauer, A., Kaufmann, V., Avian, M., and Lieb, G. K. (2017). “One decade of comprehensive permafrost monitoring in Austria by the graz permafrost monitoring network: A status report,” in Proceedings of the AK Permafrost Conference, Einsiedeln.
Kenner, R., Noetzli, J., Hoelzle, M., Raetzo, H., and Phillips, M. (2019a). Distinguishing ice-rich and ice-poor permafrost to map ground temperatures and ground ice occurrence in the Swiss Alps. Cryosphere 13, 1925–1941. doi: 10.5194/tc-13-1925-2019
Kenner, R., Phillips, M., Limpach, P., Beutel, J., and Hiller, M. (2018). Monitoring mass movements using georeferenced time-lapse photography: Ritigraben rock glacier, western Swiss Alps. Cold Reg. Sci. Technol. 145, 127–134. doi: 10.1016/j.coldregions.2017.10.018
Kenner, R., Pruessner, L., Beutel, J., Limpach, P., and Phillips, M. (2019b). How rock glacier hydrology, deformation velocities and ground temperatures interact: examples from the Swiss Alps. Permafr. Periglac. Process. 31, 3–14. doi: 10.1002/ppp.2023
Lachenbruch, A. H., and Marsall, B. V. (1986). Changing climate: geothermal evidence from permafrost in the Alaskan arctic. Science 234, 689–696. doi: 10.1126/science.234.4777.689
Lawton, K. M., and Patterson, S. R. (2002). Long-term relative stability of thermistors: part 2. Precis. Eng. 26, 340–345. doi: 10.1016/S0141-6359(02)00110-1
Luethi, R., and Phillips, M. (2016). Challenges and solutions for long-term permafrost borehole temperature monitoring and data interpretation. Geogr. Helvetica 71, 121–131. doi: 10.5194/gh-71-121-2016
Magnin, F., Deline, P., Ravanel, L., Noetzli, J., and Pogliotti, P. (2015). Thermal characteristics of permafrost in the steep alpine rock walls of the Aiguille du Midi (Mont Blanc Massif, 3842 m a.s.l). Cryosphere 9, 109–121. doi: 10.5194/tc-9-109-2015
Marmy, A., Rajczak, J., Delaloye, R., Hilbich, C., Hoelzle, M., Kotlarski, S., et al. (2016). Semi-automated calibration method for modelling of mountain permafrost evolution in Switzerland. Cryosphere 10, 2693–2719. doi: 10.5194/tc-10-2693-2016
Merlone, A., Sanna, F., Coppa, G., Massano, L., and Musacchio, C. (2020). Transportable system for on-site calibration of permafrost temperature sensors. Permafr. Periglac. Process 31, 610–620. doi: 10.1002/ppp.2063
Mittaz, C., Hoelzle, M., and Haeberli, W. (2000). First results and interpretation of energy-flux measurements over Alpine permafrost. Ann. Glaciol. 31, 275–280. doi: 10.3189/172756400781820363
Mollaret, C., Hilbich, C., Pellet, C., Flores-Orozco, A., Delaloye, R., and Hauck, C. (2019). Mountain permafrost degradation documented through a network of permanent electrical resistivity tomography sites. Cryosphere 13, 2557–2578. doi: 10.5194/tc-13-2557-2019
Monnier, S., and Kinnard, C. (2013). Internal structure and composition of a rock glacier in the Andes (upper Choapa valley, Chile) using borehole information and ground-penetrating radar. Ann. Glaciol. 54, 61–72. doi: 10.3189/2013AoG64A107
Noetzli, J., Biskaborn, B. K., Christiansen, H. H., Isaksen, K., Schoeneich, P., Smith, S., et al. (2019). Permafrost thermal state. Bull. Am. Meteorol. Soc. 100, 21–22. doi: 10.1175/2018BAMSStateoftheClimate.1
Noetzli, J., and Gruber, S. (2009). Transient thermal effects in Alpine permafrost. Cryosphere 3, 85–99. doi: 10.5194/tc-3-85-2009
Noetzli, J., Gruber, S., Kohl, T., and Salzmann, N. (2007). Three-dimensional distribution and evolution of permafrost temperatures in idealized high-mountain topography. J. Geophys. Res 112:F02S13. doi: 10.1029/2006JF000545
Noetzli, J., Hilbich, C., Hauck, C., Hoelzle, M., and Gruber, S. (2008). “Comparison of simulated 2D temperature profiles with time-lapse electrical resistivity data at the Schilthorn crest, Switzerland,” in Proceedings of the 8th International Conference on Permafrost Zurich, 1293–1298.
PERMOS (2019). “Permafrost in Switzerland 2014/2015 to 2017/2018,” in Glaciological Report (Permafrost) No. 16–9, eds J. Noetzli, C. Pellet, and B. Staub, Fribourg: Cryospheric Commission of the Swiss Academy of Sciences, 104. doi: 10.13093/permos-rep-2019-16-19
Phillips, M., Haberkorn, A., Draebing, D., Krautblatter, M., Rhyner, H., and Kenner, R. (2016). Seasonally intermittent water flow through deep fractures in an Alpine Rock Ridge: Gemsstock, Central Swiss Alps. Cold Reg. Sci. Technol. 125, 117–127. doi: 10.1016/j.coldregions.2016.02.010
Pogliotti, P., Guglielmin, M., Cremonese, E., di Cella, U. M., Filippa, G., Pellet, C., et al. (2015). Warming permafrost and active layer variability at Cime Bianche, Western European Alps. Cryosphere 9, 647–661. doi: 10.5194/tc-9-647-2015
Pruessner, L., Phillips, M., Farinotti, D., Hoelzle, M., and Lehning, M. (2018). Near-surface ventilation as a key for modeling the thermal regime of coarse blocky rock glaciers. Permafr. Periglac. Process. 29, 152–163. doi: 10.1002/ppp.1978
Romanovsky, V. E., Smith, S. L., and Christiansen, H. H. (2010). Permafrost thermal state in the polar northern hemisphere during the international polar year 2007-2009: a synthesis. Permafr. Periglac. Process. 21, 106–116. doi: 10.1002/ppp.689
Scapozza, C., Baron, L., and Lambiel, C. (2015). Borehole logging in Alpine periglacial talus slopes (Valais, Swiss Alps): Borehole logging in Alpine periglacial talus slopes. Permafr. Periglac. Process. 26, 67–83. doi: 10.1002/ppp.1832
Scapozza, C., Lambiel, C., Baron, L., Marescot, L., and Reynard, E. (2011). Internal structure and permafrost distribution in two alpine periglacial talus slopes, valais, Swiss Alps. Geomorphology 132, 208–221. doi: 10.1016/j.geomorph.2011.05.010
Schneider, S., Hoelzle, M., and Hauck, C. (2012). Influence of surface and subsurface heterogeneity on observed borehole temperatures at a mountain permafrost site in the Upper Engadine, Swiss Alps. Cryosphere 6, 517–531. doi: 10.5194/tc-6-517-2012
Schoeneich, P., Bodin, X., Krysiecki, J.-M., Deline, P., and Ravanel, L. (2010). Permafrost in France. Grenoble: PermaFrance Network.
Smith, S., Brown, J., Nelson, F. E., Romanovsky, V., Zhang, T., Christiansen, H. H., et al. (2009). Permafrost and Seasonally Frozen Ground. Rome: Global Terrestrial Observing System.
Springman, S. M., Arenson, L., Yamamoto, Y., Maurer, H., Kos, A., Buchli, T., et al. (2012). Multidisciplinary investigations on three rock glaciers in the Swiss Alps: legacies and future perspectives. Geogr. Ann. Ser. Phys. Geogr. 94, 215–243. doi: 10.1111/j.1468-0459.2012.00464.x
Steinhart, J. S., and Hart, S. R. (1968). Calibration curves for thermistors. Deep Sea Res. Oceanogr. Abstr. 15, 497–503. doi: 10.1016/0011-7471(68)90057-0
Streletskiy, D. A., Biskaborn, B. K., Smith, S., Noetzli, J., Vieira, G., and Schoeneich, P. (2017). Strategy and Implementation Plan 2016–2020 for the Global Terrestrial Network for Permafrost GTN-P. Washington DC: The George Washington University, 42.
Strozzi, T., Caduff, R., Jones, N., Barboux, C., Delaloye, R., Bodin, X., et al. (2020). Monitoring rock glacier kinematics with satellite synthetic aperture radar. Remote Sens. 12:559. doi: 10.3390/rs12030559
Vonder Mühll, D. (1992). Evidence of intrapermafrost groundwater flow beneath an active rock glacier in the Swiss Alps. Permafr. Periglac. Process. 3, 169–173. doi: 10.1002/ppp.3430030216
Vonder Mühll, D. (1996). Drilling in Alpine permafrost. Nor. J. Geogr. 50, 17–24. doi: 10.1080/00291959608552348
Vonder Mühll, D., Arenson, L., and Springman, S. (2003). “Temperature conditions in two Alpine rock glaciers,” in Proceedings of the 8th International Conference. on Permafrost Zurich, 1195–1200.
Vonder Mühll, D., and Haeberli, W. (1990). Thermal characteristics of the permafrost within an active rock glacier (Murtèl/Corvatsch, Grisons, Swiss Alps). J. Glaciol. 36, 151–158. doi: 10.3189/s0022143000009382
Vonder Mühll, D., Noetzli, J., and Roer, I. (2008). “PERMOS - a comprehensive monitoring network of mountain permafrost in the Swiss Alps,” in Proceedings of the 9th International Conference on Permafrost (Fairbanks: AK), 1869–1874.
Wani, J. M., Thayyen, R. J., Gruber, S., Ojha, C. S. P., and Stumm, D. (2020). Single-year thermal regime and inferred permafrost occurrence in the upper Ganglass catchment of the cold-arid Himalaya, Ladakh, India. Sci. Total Environ. 703, 134631. doi: 10.1016/j.scitotenv.2019.134631
Weber, S., Beutel, J., Da Forno, R., Geiger, A., Gruber, S., Gsell, T., et al. (2019). A decade of detailed observations (2008–2018) in steep bedrock permafrost at the Matterhorn Hörnligrat (Zermatt, CH). Earth Syst. Sci. Data 11, 1203–1237. doi: 10.5194/essd-11-1203-2019
Wirz, V., Beutel, J., Buchli, B., Gruber, S., and Limpach, P. (2013). “Temporal characteristics of different cryosphere-related slope movements in high mountains,” in Margottini, C., Canuti, P., Sassa, K. eds Landslide Science and Practice (Berlin: Springer), 383–390. doi: 10.1007/978-3-642-31337-0_49
Wise, J. A. (1988). Liquid-in-Glass Thermometer Calibration Service. Gaithersburg, MD: University of North Texas Libraries, UNT Digital Library. Available online at: https://digital.library.unt.edu/ark:/67531/metadc502604/ (accessed April 15, 2021).
WMO (2008). Guide to Meteorological Instruments and Methods of Observation. Geneva: World Meteorological Organization, 584.
Zahumenský, I. (2004). “Guidelines on quality control procedures for data from automatic weather stations,” in Commission for Basic Systems (Geneva: World Meteorological Organization), 9.
Zemp, M. (2011). The Monitoring of Glaciers at Local, Mountain, and Global Scale. Habilitation, Department of Geography. Zurich: University of Zurich, 72.
Zhao, L., Wu, Q., and Marchenko, S. S. (2010). Thermal state of permafrost and active layer in central Asia during the international polar year. Permafr. Periglac. Process 21, 198–207. doi: 10.1002/ppp.688
Keywords: permafrost, borehole temperatures, high mountain areas, long-term monitoring, best practices
Citation: Noetzli J, Arenson LU, Bast A, Beutel J, Delaloye R, Farinotti D, Gruber S, Gubler H, Haeberli W, Hasler A, Hauck C, Hiller M, Hoelzle M, Lambiel C, Pellet C, Springman SM, Vonder Muehll D and Phillips M (2021) Best Practice for Measuring Permafrost Temperature in Boreholes Based on the Experience in the Swiss Alps. Front. Earth Sci. 9:607875. doi: 10.3389/feart.2021.607875
Received: 18 September 2020; Accepted: 06 April 2021;
Published: 11 May 2021.
Edited by:
Qingbai Wu, Northwest Institute of Eco-Environment and Resources, Chinese Academy of Sciences (CAS), ChinaReviewed by:
Baptiste Dafflon, Lawrence Berkeley National Laboratory, United StatesAndrea Fischer, Austrian Academy of Sciences (OeAW), Austria
Copyright © 2021 Noetzli, Arenson, Bast, Beutel, Delaloye, Farinotti, Gruber, Gubler, Haeberli, Hasler, Hauck, Hiller, Hoelzle, Lambiel, Pellet, Springman, Vonder Muehll and Phillips. This is an open-access article distributed under the terms of the Creative Commons Attribution License (CC BY). The use, distribution or reproduction in other forums is permitted, provided the original author(s) and the copyright owner(s) are credited and that the original publication in this journal is cited, in accordance with accepted academic practice. No use, distribution or reproduction is permitted which does not comply with these terms.
*Correspondence: Jeannette Noetzli, jeannette.noetzli@slf.ch