Uncertainty Analysis of Standardized Precipitation Index Due to the Effects of Probability Distributions and Parameter Errors
 Ying Zhang
 Zhanling Li
- MOE Key Laboratory of Groundwater Circulation and Environmental Evolution, School of Water Resources and Environment, China University of Geosciences (Beijing), Beijing, China
The standardized precipitation index (SPI) is widely used in drought assessments due to its simple data requirement and multiscale characteristics. However, there are some uncertainties in the process of its calculation. This study, taking the Heihe River basin in northwest of China as the study area, mainly focuses on the uncertainty issues both in SPI calculation and in drought characteristics associated with the probability distributions and parameter estimation errors. Ten probability distributions (two- and three-parameter log-logistic and log-normal, generalized extreme value, Pearson type III, burr, gamma, inverse Gaussian, and Weibull) are employed to estimate the SPI. Maximum likelihood estimation is used to estimate distribution parameters. Randomly generating parameters based on the normality assumption is applied to quantify the uncertainty of parameter estimations. Results show that log-logistic–type distribution presents quite close performance with the benchmark gamma distribution and thus is recommended as an alternative in fitting the precipitation data over the study area. Effects of both uncertainty sources (probability distribution functions and parameter estimation errors) are more reflected on extreme droughts (extremely dry or wet). The more extreme the SPI value, the greater uncertainties caused by both sources. Furthermore, the drought characteristics vary a lot from different distributions and parameter errors. These findings highlight the importance of uncertainty analysis of drought assessments, given that most studies in climatology focus on extreme values for drought analysis.
Introduction
Drought is one of the most common natural disasters usually with a high degree of damage and a wide range of influences (Xu et al., 2005; Mishra and Singh, 2010; Wang et al., 2012), which has become a hot topic in the fields of ecology, meteorology, and hydrology (Lynch et al., 2018; Zhou and Liu, 2018). Drought index is a useful tool in drought researches and drought assessments. Among the drought indices, standardized precipitation index (SPI) is widely used (Moreira, 2015; Zhang et al., 2017; Merabti et al., 2018; Oliveira-Júnior et al., 2018; Tirivarombo et al., 2018) because it can determine drought at different time scales and only requires precipitation data (Ma et al., 2013). However, some uncertainties exist in its calculation due to the probability distribution functions in fitting the precipitation data, parameter estimation methods and errors, time scales and data length, and so on (e.g., Wu et al., 2005; Stagge et al., 2015; Vergni et al., 2017; Beyaztas et al., 2018). McKee et al. (1993), the proposers of SPI, suggested using gamma distribution to fit the cumulative precipitation in calculating this index, whereas many scholars such as like Cindrić et al. (2012), Hong et al. (2013), Gabriel and Monica (2015), Wu et al. (2016), and Vergni et al. (2017) indicated that the applicability of theoretical distributions in describing the cumulative precipitation was inconsistent across different regions. Specifically, Guttman (1999) verified that the Pearson type III distribution is a better universal model in America; Sienz et al. (2012) concluded that the Weibull-type distributions give distinctly improved fits compared to gamma in Europe; Angelidis et al. (2012) found that the log-normal distribution gives almost the same results as gamma in the calculation of SPI at 12- and 24-month scales in Guadiana (Portugal); Gabriel and Monica (2015) demonstrated that the generalized normal distribution presents the best performance in fitting precipitation series in Brazil.
In estimating the distribution parameters, some literatures preferred to investigate the validity of different parameter estimation methods (e.g., Thai et al., 2013; Beguería et al., 2014). Thai et al. (2013) compared maximum likelihood estimation (MLE) and restricted MLE (RMLE) in estimating the parameters in linear mixed-effects model and found that RMLE is advantageous when data are limited. Beguería et al. (2014) contrasted MLE and unbiased probability weighted moments method in estimating parameters in three-parameter log-logistic distribution and concluded that these two methods yield similar results, whereas the calculation of MLE is ~2-fold more time consuming. Carbone et al. (2018) discussed the relationship between the stability of parameter estimation and data record length and found that the stability in parameter estimation increases non-linearly as record length increases.
As to the input data, a large number of studies have concerned about the uncertainties associated with input data sources, data length, and sampling uncertainty in the calculation of drought index (e.g., Hao et al., 2014, 2016; Liu et al., 2014; Hu et al., 2015; Katiraie-Boroujerdy et al., 2016; Vergni et al., 2017; Zambrano et al., 2017; Beyaztas et al., 2018; Carbone et al., 2018). Vu et al. (2018) compared the performance of rain-gauge data and gridded precipitation data in the calculation of SPI over Vietnam. Carbone et al. (2018) demonstrated that the SPI estimates derived from 30-year record have considerably more uncertainty than those from the 60-year record. Liu et al. (2014), Hu et al. (2015), Vergni et al. (2017), and Beyaztas et al. (2018) quantified the sampling uncertainties and their effects on the estimation of drought index.
All the above studies have made great contributions in enriching the uncertainty analysis in drought assessments, whereas most of them were concerned about the influences of uncertainty sources on the drought index itself and lack of the consideration of their effects on drought events and drought characteristics. Therefore, this study aims to investigate the effects of uncertainty sources on both SPI values and drought characteristics, specifically drought intensity, peak, number, duration, and frequency. Two uncertainty sources are mainly considered; one is the different probability distribution functions, and the other is parameter estimation errors, which would also cause the uncertainty in drought assessments, while it was seldom concerned in literatures.
To be specific, as many as 10 probability distribution functions are employed here, including five three-parameter distributions and five two-parameter distributions. Maximum likelihood estimation approach is used to estimate the distribution parameters, and a large set of randomly generated parameters, which are based on the normality assumption, is used to quantify the uncertainties of parameter estimations. These methods will be described in the next section, preceded by a brief description of the case study area and data sets. The results and discussion will then be presented, and the conclusions from this study will be given in the last section.
Materials and Methods
Study Area and Data Description
The Heihe River basin (97° 37′-102° 06′ E, 37° 44′-42°40'N) is the second largest inland river basin in northwest of China, with a drainage area of nearly 1.429 × 10⁵ km2. The Heihe River flows through Qinghai, Gansu, and Inner Mongolia provinces from south to north, spanning three different geographical regions: semiarid to semi-humid, semiarid, and extreme arid desert (Feng et al., 2001). The annual mean precipitation amounts to 400 to 500 mm in the southern mountainous area of the upper reach, 100 to 150 mm in the middle reach, and <50 mm in the lower reach, whereas the evaporation rate is much higher, ranging from 1,000 to 2,200 mm from the upper reach to the lower reach (Li, 2010). In recent years, temperatures show upward trends for the whole basin (Liu et al., 2017). Droughts have great effects on the local economic and social development and also on the fragile ecological environment over the basin.
There are nine national meteorological stations in the basin, Tuole (TL), Yeniugou (YNG), and Qilian (QL) stations in the upper reach; Sandan (SD), Zhangye (ZY), Jiuquan (JQ), Gaotai (GT), and Dingxin (DX) in the middle reach; and Ejinaqi (EJNQ) station in the lower reach (Figure 1). The name in the parentheses is the abbreviated name of each station. Precipitation data covering the period of 1960–2015 at these nine stations are used for the drought analysis, without missing or outliers and with good quality. All data used in the study is available from China Meteorological Data Network (http://data.cma.cn/).
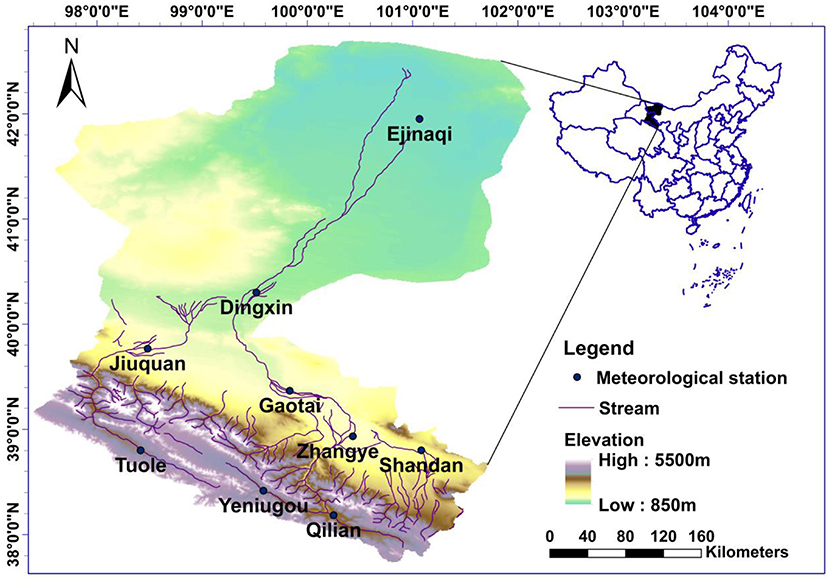
Figure 1. Meteorological stations in Heihe River basin.
The Standardized Precipitation Index
The SPI requires only precipitation data and can be used for drought assessments on different time scales (e.g., 3, 6, 12-months). It is calculated by fitting the cumulative precipitation with an appropriate probability density function to characterize the deficit of precipitation. As recommended by McKee et al. (1993), the two-parameter gamma distribution is used as a probability function to fit the cumulative precipitation for each month. The calculation process is as follows (McKee et al., 1993; Angelidis et al., 2012):
Establishing cumulative precipitation sequences at different time scales:
where xi, j is the precipitation, i is the specified year, j is the month, and is the cumulative precipitation when the time scale is k. The time scales vary from 1 to 48-months (generally include1, 3, 6, 12, 24, or 48-months). Shorter time scales (3 or 6-months) can best represent soil moisture and are more conducive to the discovery of agricultural drought (Komuscu, 1999; Sims et al., 2002). Longer time scales are considered to better monitor the surface water resources (12-month) or the aquifer water state with slow response to drought (24 or 48-months) (Hayes et al., 1999). The time scale of 12-months is selected in this study.
The probability density function of gamma distribution is formulated as
where α and β are the shape and scale parameters, respectively, x is the cumulative precipitation, and Γ(α) is a gamma function.
The cumulative probability for a given length of time can be calculated as
It is possible to have several zero values in a precipitation data, so the cumulative probability function of gamma distribution with the x = 0 case is modified to
where q is the probability of zero precipitation.
Finally, the cumulative probability distribution is normalized to produce an SPI:
where c0 = 2.515517, c1 = 0.802853, c2 = 0.010328, d1 = 1.432788, d2 = 0.189269, and d3 = 0.001308.
The SPI values are classified into seven grades following the classification criteria in the SPI User Guide (http://www.wamis.org/agm/pubs/SPI/WMO_1090_EN.pdf) and are given in Table 1.
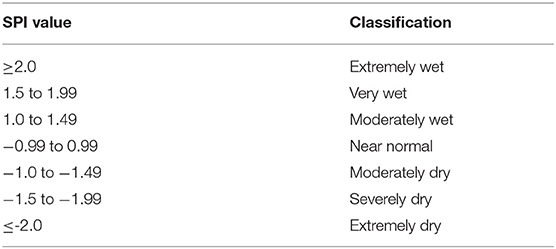
Table 1. Drought classification according to SPI values.
Probability Distributions in Fitting SPI
As illustrated above, SPI requires a theoretical probability distribution to fit the cumulative precipitation process. McKee et al. (1993) suggested using a two-parameter gamma distribution when they first proposed this index. However, this distribution is not always the optimal choice when considering practical reasons such as different research areas or research needs (Guttman, 1999; Angelidis et al., 2012; Sienz et al., 2012; Gabriel and Monica, 2015).
In this study, as many as 10 distributions are selected for comparative analysis, including three-parameter log-logistic (LL3), three-parameter log-normal (LN3), generalized extreme value (GEV), Pearson type III (PE3), Burr, gamma, two-parameter log-logistic (LL2), two-parameter log-normal (LN2), inverse Gaussian (IG), and Weibull. The name in the parentheses is the abbreviated name of each distribution. The former five- are three-parameter distributions and the latter five are two-parameter distributions. The probability density function of each distribution is shown in Table 2.
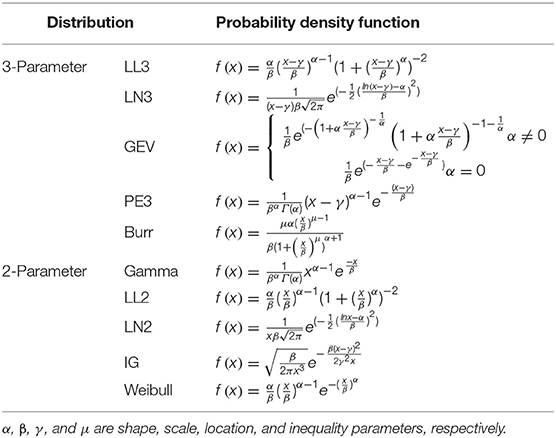
Table 2. Probability density function of each distribution.
Method for Quantifying the Effects of Parameter Estimation Errors
Maximum likelihood estimation is one of the most commonly used approaches to estimate parameters in probability distribution functions and has been verified to be preferable when the sample size is more than 50 (Madsen et al., 1997). Thus, it is employed to estimate the parameters of gamma distribution in this research. The theory of MLE states that for large sample sizes n and a k-dimensional parameter vector, MLE estimators are approximately distributed as a multivariate normal. Thus, the uncertainties of distribution parameters are then quantified by randomly generating parameters based on the multivariate asymptotic normality assumption (Nixon et al., 2010; Degeling et al., 2017). The detailed process is as follows:
• fitting the original cumulative precipitation data set X = (x1, x2, …, xn) (n is the length of the data set) with gamma distribution and obtaining the optimal parameter sets (α*, β*) and the variance–covariance matrix;
• randomly generating N sets of parameters [(α1, β1), (α2, β2),…, (αN, βN)] based on the optimal parameter sets and the variance–covariance matrix under the assumption of asymptotic normality (N can be set, in this study N = 1000);
• calculating N sets of SPI values according to Equations (2) to (5) with N sets of parameters; and
• identifying the (a/2)th and (1- a/2)th percentiles based on N sets of SPI values, which are assumed to be the lower and upper bounds of SPI confidence intervals (CIs). a is set to be 0.05 herein.
Drought Characteristics
Drought event can be characterized by multiple variables, for example, drought event number, intensity, peak, duration, and frequency. All these characteristics are often suggested to be used for drought assessments (e.g., Loukas and Vasiliades, 2004; Sheffield and Wood, 2008; He et al., 2018) and thus selected in this analysis. According to the Run theory (Yevjevich, 1967), when SPI is below the threshold value, for example, −1, a drought event is considered to have occurred. The intensity of a drought event is defined as the mean value of a drought index below the threshold level. The peak is the minimum value of a drought index below the threshold value. Duration is the amount of time that a drought index is continuously below the threshold level. Drought frequency is defined as the ratio of drought event number to the total length of the time series. It is calculated with the formula of , in which N means the total number of SPI values, and n means the total number of SPI values belonging to each grade.
Results
Effects of Probability Distributions
Performance of Different Probability Distributions
Figure 2, taking the 12-month cumulative precipitation in January at Tuole station as an example, shows the comparison of the empirical cumulative probability distribution and the 10 theoretical ones. Note that the abbreviated names of stations and distributions are used in all figures for convenience. No clear differences are observed from Figure 2, and all the alternative distributions seem to give satisfactory fits to the series. For evaluating the performance of different probability distributions in more details, goodness-of-fit tests including the Kolmogorov–Smirnov (K-S) and Anderson–Darling (A-D) tests are carried out (Svensson et al., 2017; Vergni et al., 2017). Also taking the cumulative precipitation data in January as an example, the calculated statistic values for both tests are given in Table 3. The critical values equal 0.18 and 2.50 at 0.05 significance level for K-S and A-D tests, respectively. If the statistic value is lower than the critical value, it indicates that the data set passes the corresponding test at 0.05 significance level; otherwise, it fails.
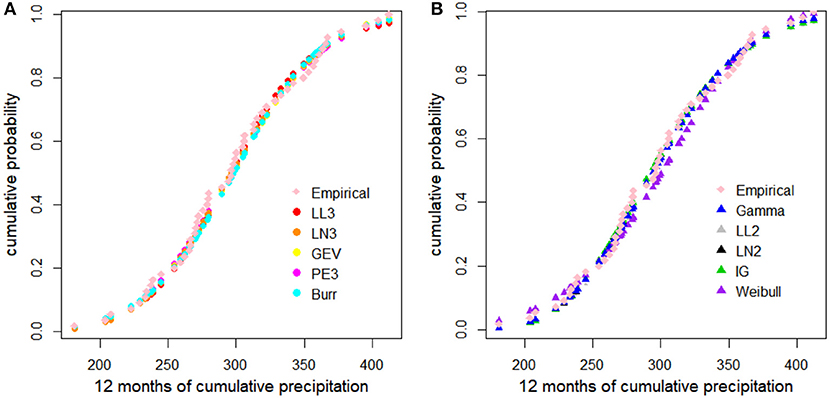
Figure 2. Cumulative probability for 12-month cumulative precipitation in January at Tuole station (LL3, LL2, LN3, LN2, GEV, PE3, and IG represent the three- and two-parameter log-logistic and log-normal, generalized extreme value, Pearson-III, and inverse Gaussian distributions, respectively). (A) The cumulative probability of empirical and three-parameter theoretical distributions. (B) The cumulative probability of empirical and two-parameter theoretical distributions.
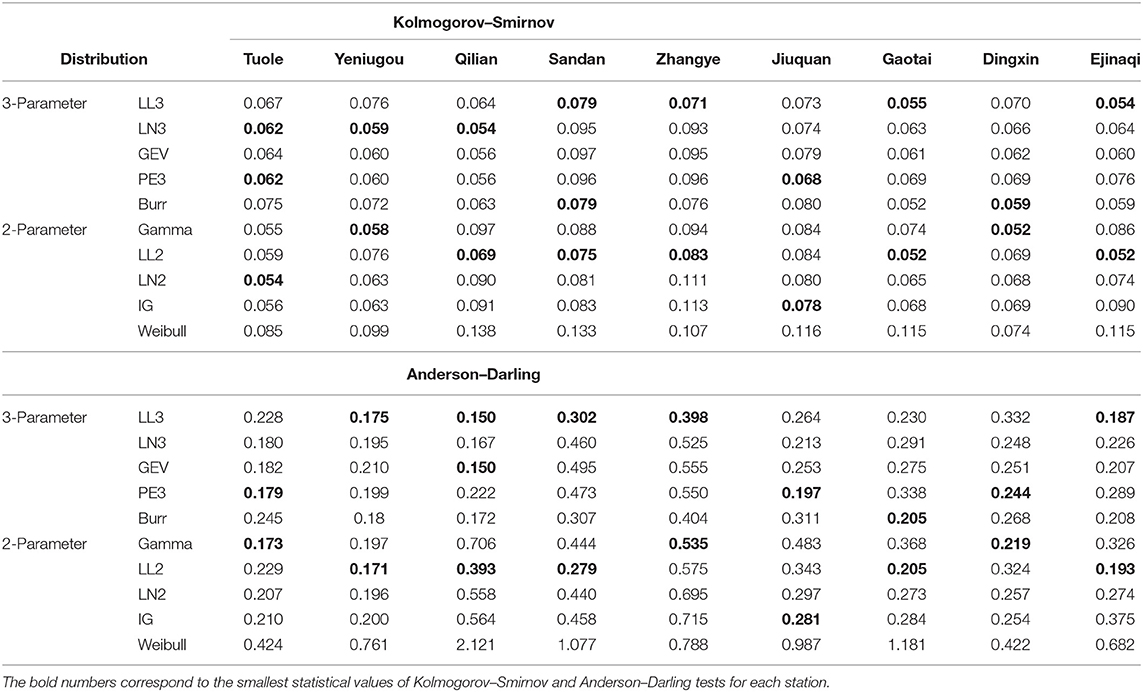
Table 3. The statistic values of Kolmogorov–Smirnov and Anderson–Darling tests for January cumulative precipitation series at a of 0.05.
According to Table 3, all the statistic values are lower than the critical values, indicating that all the alternative distributions can provide satisfactory performance in fitting the cumulative precipitations. Comparatively, the three-parameter distributions show better than those two-parameter ones. Among the three-parameter distributions, three-parameter log-logistic performs the best, with 9 of 18 critical values being the smallest (in bold in Table 3). Among the two-parameter distributions, two-parameter log-logistic performs the best, with 10 of 18 critical values being the smallest, and Weibull performs the worst, with the highest statistic values.
The same work is done for the precipitation data of other months. The results still demonstrate that three- and two-parameter log-logistics perform best among the three-parameter and two-parameter distributions, respectively, with 67 and 95 smallest critical values of the total, accounting for 31 and 44%. By contrast, three-parameter log-logistic performs better than the two-parameter one owing to the smaller critical values of K-S and A-D tests. That is, log-logistic–type distribution can be used as alternatives in fitting the cumulative precipitation across the study area. In contrast, gamma performs moderately, with 25% of the critical values being the smallest in this case. Note that among all the precipitation data and all the distributions only Burr fails to fit the data in August at Jiuquan station.
Effects of Probability Distributions to SPI
Figure 3 shows the SPI values derived from the 10 different probability distributions. The blue line is from the benchmark gamma distribution, and other colored lines are from the other nine alternative distributions. Most of the lines coincide with each other as a whole, and the differences are generally observed at the lower and upper limits of SPI values (extremely dry and extremely wet conditions). For example, more wet conditions (higher SPI values) are detected from Weibull distribution at Qilian station in 1999, and more dry conditions (smaller SPI values) are detected from Pearson type III at Qilian station in 1971.
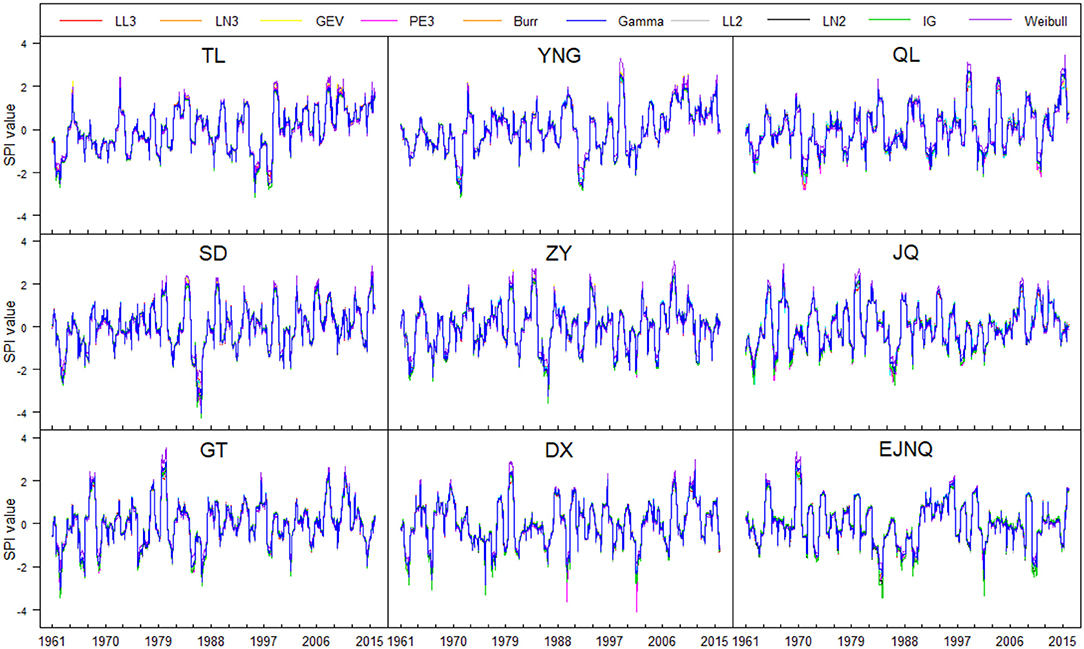
Figure 3. SPI values modeled by different probability distributions (LL3, LL2, LN3, LN2, GEV, PE3, and IG represent the three- and two-parameter log-logistic and log-normal, generalized extreme value, Pearson-III, and inverse Gaussian distributions, respectively; TL, YNG, QL, SD, ZY, JQ, GT, DX, and EJNQ are Tuole, Yeniugou, Qilian, Sandan, Zhangye, Jiuquan, Gaotai, Dingxin, and Ejinaqi stations, respectively).
In order to further analyze the inconsistency of SPI values obtained from the various probability distributions, the differences calculated from SPIalternative minus SPIgamma are presented in Figure 4 (SPIalternative and SPIgamma mean the SPI values derived from the nine alternative distributions and from the benchmark gamma distribution, respectively). Clearly, the differences are minimal for normal and moderate classifications (corresponding to −1.5 < SPI < 1.5), conditions nearly within the range of ± 0.1. As the SPI values vary to the extremes, the differences become lager. The more extreme (dry or wet) the events, the greater the differences, and the more dispersed the scatter points (Figure 4). These indicate that although little effects are on the normal and moderate classifications, greater effects are on the extreme classifications (extremely dry or wet) from the different probability distributions in SPI calculation. Note that the differences derived from Burr distribution vary greatly for Jiuquan station (in cyan in Figure 4) due to the fact that Burr fails to pass the tests in fitting the August cumulative precipitation at this station.
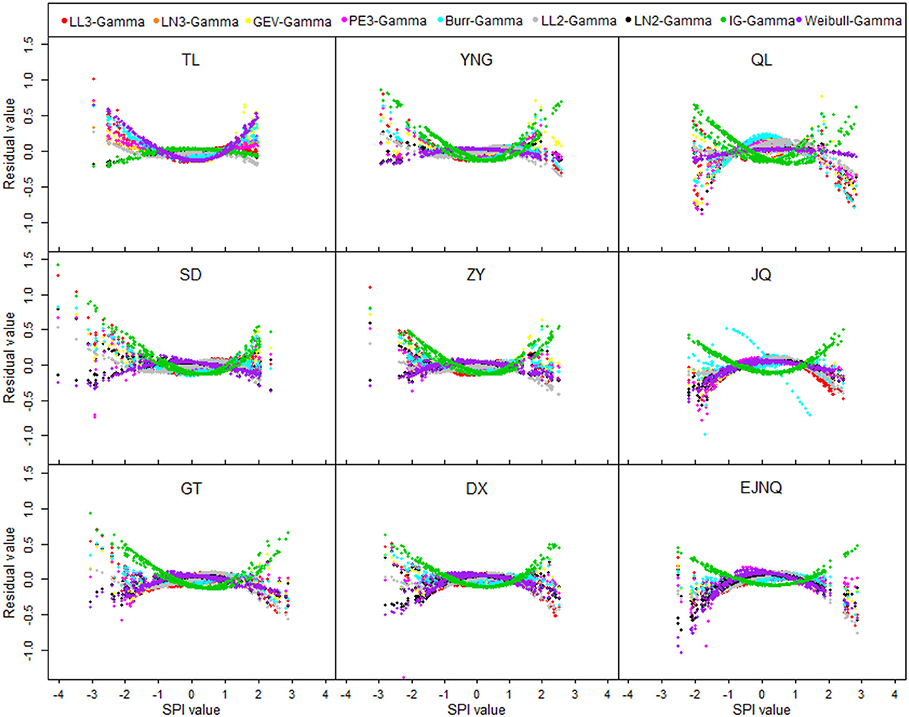
Figure 4. The differences of SPI modeled by gamma and alternative distributions (the abbreviations are the same as in Figure 3).
Effects of Probability Distribution to Drought Characteristics
The drought assessment based on drought characteristics is more informative than the numerical value itself for most practical applications (Guttman, 1999). Five characteristics of drought events are considered here: intensity, peak, event number, the maximum and total duration, and frequency. As observed in Figure 5, the drought characteristics derived from the different probability distributions differ greatly. Inverse Gaussian distribution tends to derive the droughts with higher drought intensity and peak, two-parameter log-logistic derives more droughts with longer drought duration, whereas Weibull derives more droughts with lower intensity, lower peak, and shorter duration. As to the maximum drought duration, most distributions detect longer duration than gamma. As to the drought event number, the performance of different distributions at different stations is inconsistent.
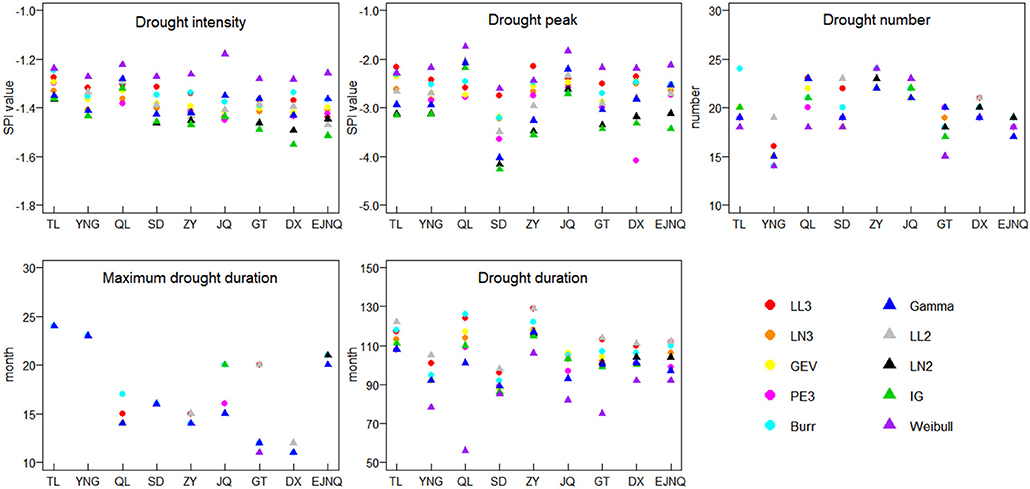
Figure 5. Drought characteristics derived from different probability distributions (the abbreviations are the same as in Figure 3).
Figure 6 presents the drought frequency of each drought grade. As observed, differences can be found in drought frequency derived from different probability distributions, especially at the extremely wet and extremely dry levels. When SPI ≥2.0 (extremely wet), for example, the occurrence frequency is 2.3% from gamma for Jiuquan station, whereas 0% from three-parameter log-logistic and 4.4% from Weibull. When SPI ≤-2.0 (extremely dry), the occurrence frequency is 0.6% from gamma for Jiuquan station and 3.0% from Pearson type III. Comparatively, Weibull distribution detected more extreme wet and almost no extreme dry in this study. The findings of great effects on extreme droughts from different probability distributions highlight the importance of the selection of suitable probability distribution in the calculation of SPI, because extremes (rather than the moderate) are usually the main focuses of many meteorological and disaster researches.
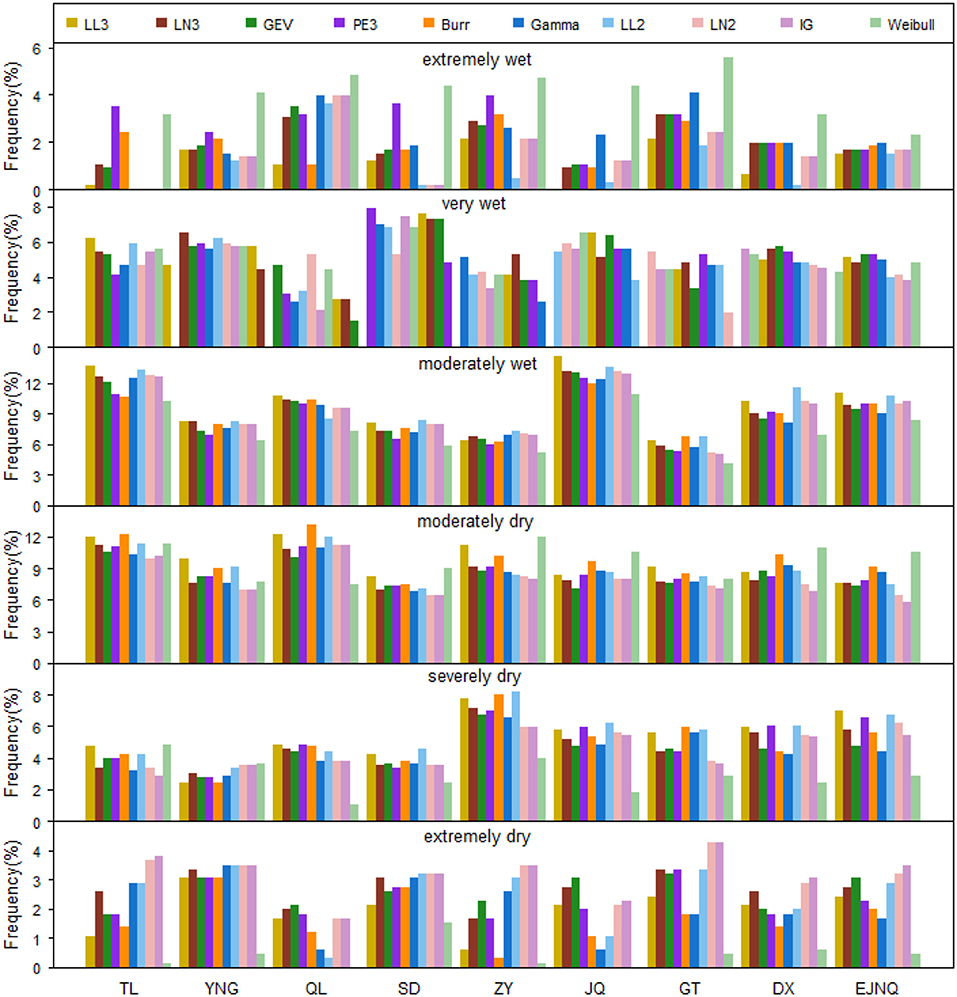
Figure 6. Drought frequency of SPI modeled by different probability distributions (the abbreviations are the same as in Figure 3).
Effects of Parameter Estimation Errors
Parameter Estimation and Its Uncertainty
The shape and scale parameters in gamma distribution are estimated by the MLE method, with the results shown in Figure 7. The optimal shape parameters vary greatly at different stations, whereas the scale parameters are relatively close. Method of L moment is used as well for comparison. Clearly, these two methods give quite close parameter estimations as a whole.
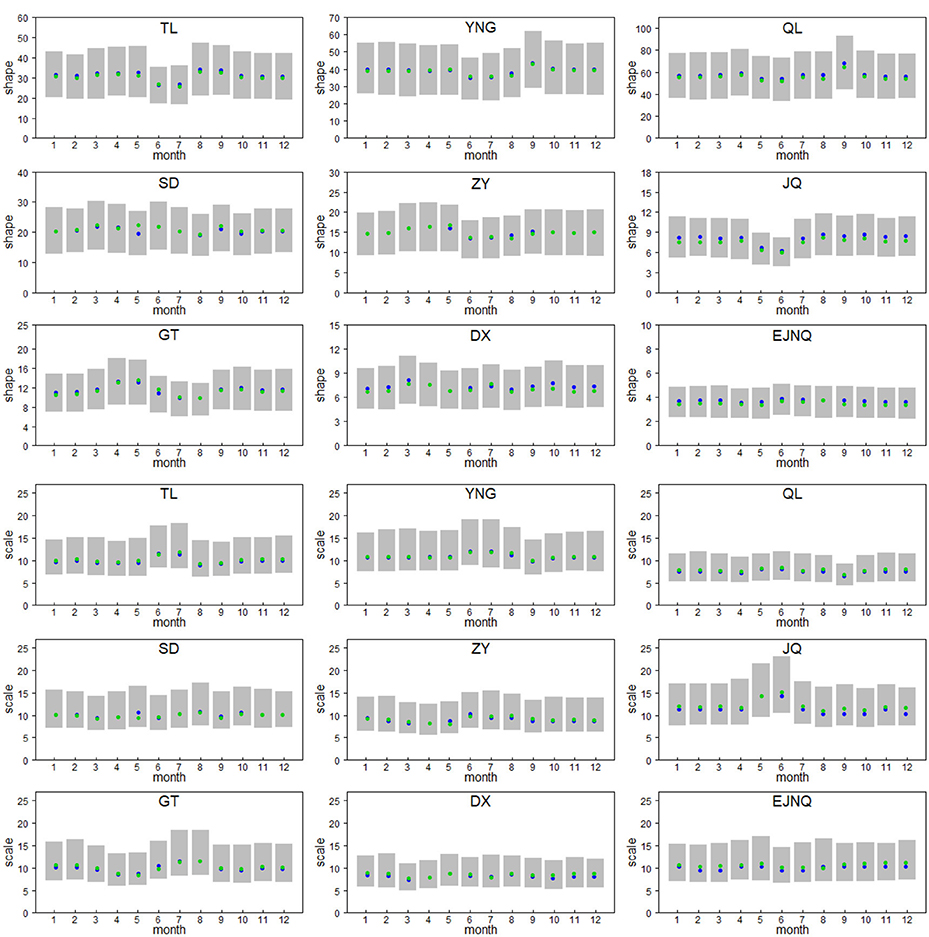
Figure 7. The optimal values and 95% CIs for shape and scale parameters in gamma distribution (the gray shade represents the 95% CIs; the blue and green points represent the optimal parameters from MLE and L moment methods, respectively; the abbreviated names of stations are the same as in Figure 3).
Figure 7 also shows the 95% CIs of each parameter derived from the standard errors, with the normality assumption according to MLE. The width of 95% CIs of a given variable is usually used as a measure of its uncertainty (Liu et al., 2014; Hu et al., 2015; Vergni et al., 2017). From the figure, the uncertainties range from 16.93 to 47.40, 21.70 to 61.90, 33.71 to 92.64, 12.12 to 30.42, 8.51 to 22.43, 3.92 to 11.79, 6.04 to 18.10, 4.36 to 18.10, and 2.18 to 5.09 for shape parameters at Tuole, Yeniugou, Qilian, Sandan, Zhangye, Jiuquan, Gaotai, Dingxin, and Ejinaqi stations and range from 6.36 to 18.23, 6.81 to 19.24, 4.35 to 12.50, 6.63 to 17.15, 5.56 to 16.67, 7.14 to 25.00, 5.91 to 18.51, 4.98 to 13.25, and 6.67 to 16.67 for scale parameters at each station.
Effects of Parameter Estimation Errors to SPI
Figure 8 gives the SPI estimations, and their 95% CIs resulted from the parameter estimation errors. It is observed that the 95% CIs are wider for extreme events than for other cases, no matter extremely wet or extremely dry. In order to investigate the uncertainty of SPI values originating from parameter estimation errors in more details, the widths of 95% CIs of SPI are presented in Figure 9, together with the mean absolute error (MAE) values, which are derived from the equation of , where n is the total sample size, Xi is the ith original SPI value, and Yi is the ith SPI value considering the parameter estimation errors. For making Figure 9 more clearly, we fix the widths of 95% CIs and MAE facing down when the SPI values are negative, and vice versa.
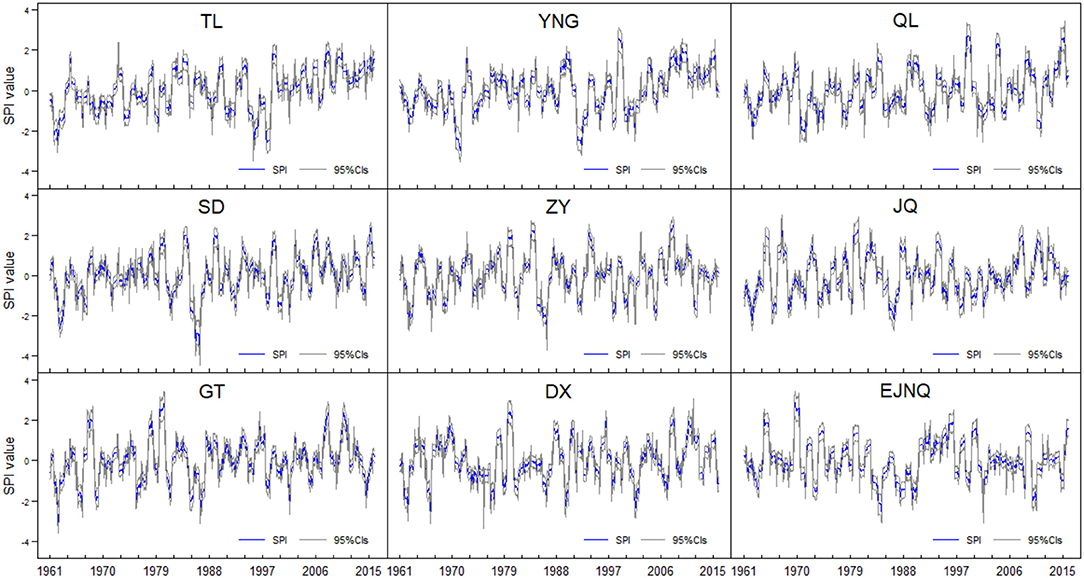
Figure 8. SPI values and their 95% CIs estimations considering the parameter estimation errors (the abbreviated names of stations are the same as in Figure 3).
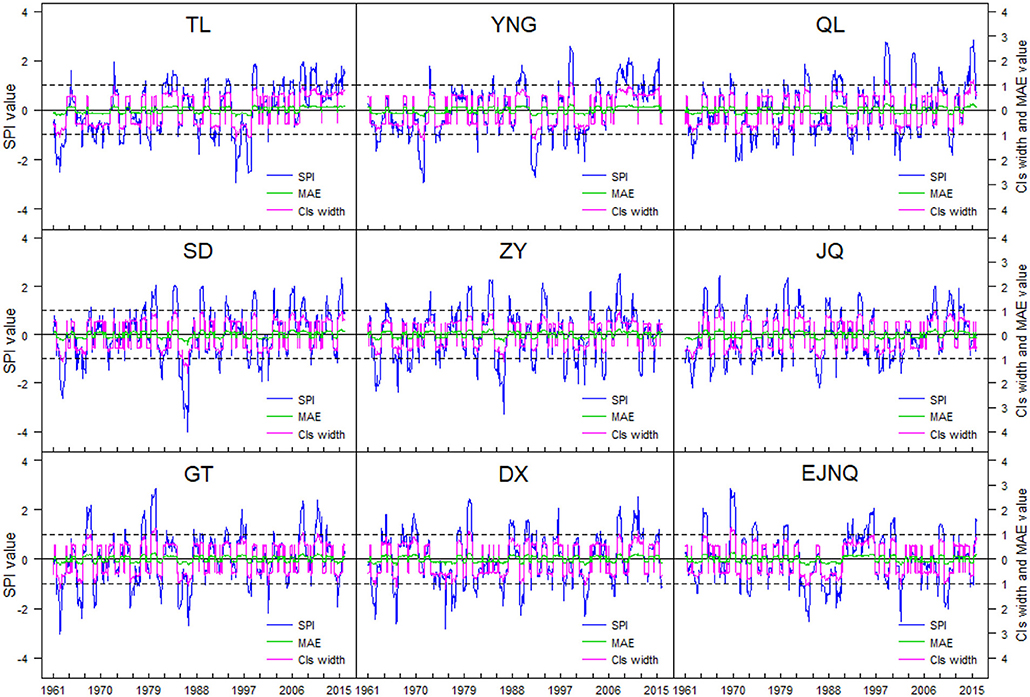
Figure 9. SPI 95% CIs width of and the MAE value considering the parameter estimation errors (the black dotted lines correspond to SPI value of ± 0.99; the abbreviated names of stations are the same as in Figure 3).
It can be seen that the fluctuations of the curves for 95% CIs width (in pink) are close to those of SPI values, showing increasing (getting larger) with SPI values changing to the extremes. For example, the average widths of 95% CIs vary from 0.58 to 0.87 for Qilian station when −1.99 ≤ SPI ≤ 1.99 and increase to 1.10 when SPI ≥2.0 and 0.95 when SPI ≤-2.0. The more extreme the SPI value, the larger the average width. The widest 95%CIs (1.24, 1.24, 1.24, 1.59, 1.13, 1.11, 1.31, 1.21, and 1.29 for Tuole, Yeniugou, Qilian, Sandan, Zhangye, Jiuquan, Gaotai, Dingxin, and Ejinaqi stations) are nearly twice of the average widths of 95% CIs (0.65, 0.65, 0.65, 0.64, 0.65, 0.54, 0.65, 0.66, and 0.64, respectively) at each station. The fluctuations of the curves for MAE (in green) also show similar tendency with the 95% CIs curves, getting larger with the SPI increasing or decreasing to the extremes.
Effects of Parameter Estimation Errors to Drought Characteristics
The intervals of each drought characteristic caused by parameter estimation uncertainty are shown in Table 4. Consistent with the results caused by different probability distributions, drought peak, event number, and drought duration are greatly affected. The deviation amounts to 0.10 to 0.29 for drought intensity, 0.93 to 1.60 for drought peak, 8 to 18 times for drought event number, 4 to 15-months for the maximum drought duration, and 68 to 123-months for the total duration. Specifically, Jiuquan station experienced the largest difference in drought event number (18 times), Sandan station experienced the largest difference in both drought peak (1.60) and the maximum drought duration (15-months), and Qilian station experienced the largest difference in the total drought duration (123-months). In addition, the intervals of drought event number and the maximum drought duration caused by parameter estimation errors are larger than those caused by different probability distributions.
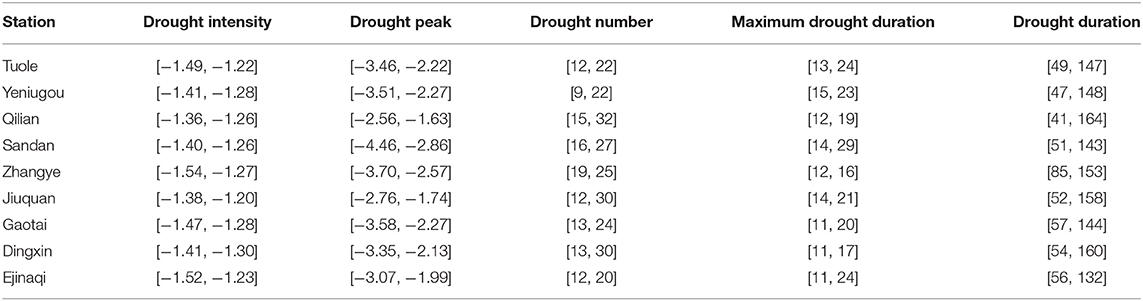
Table 4. The intervals of drought characteristics considering parameter estimation errors.
Figure 10 displays the frequency of seven drought grades associated with the uncertainty of parameter estimations. As expected, the classification results for the upper and lower limits of 95%CIs are different. For instance, when SPI ≥2.0, the extremely wet frequency is 6.5% from the upper limit for Jiuquan station, and it is 0 from the lower limit. When SPI ≤-2.0, the extremely dry frequency is 0.2% from the upper limit for Zhangye station and increases to 6.1% from the lower limit. This difference occurs not only in extremes, but also in other cases. For example, the frequency of moderate drought (corresponding to −1.5 < SPI ≤ −1.0) is 5.3% from the upper limit and reaching 15.5% from the lower limit at Qilian station. This reminds us that we should not ignore the effects of parameter estimation errors on drought index calculation, because they probably affect the classifications of drought grades, which associates closely to the decision-making of the local drought management.
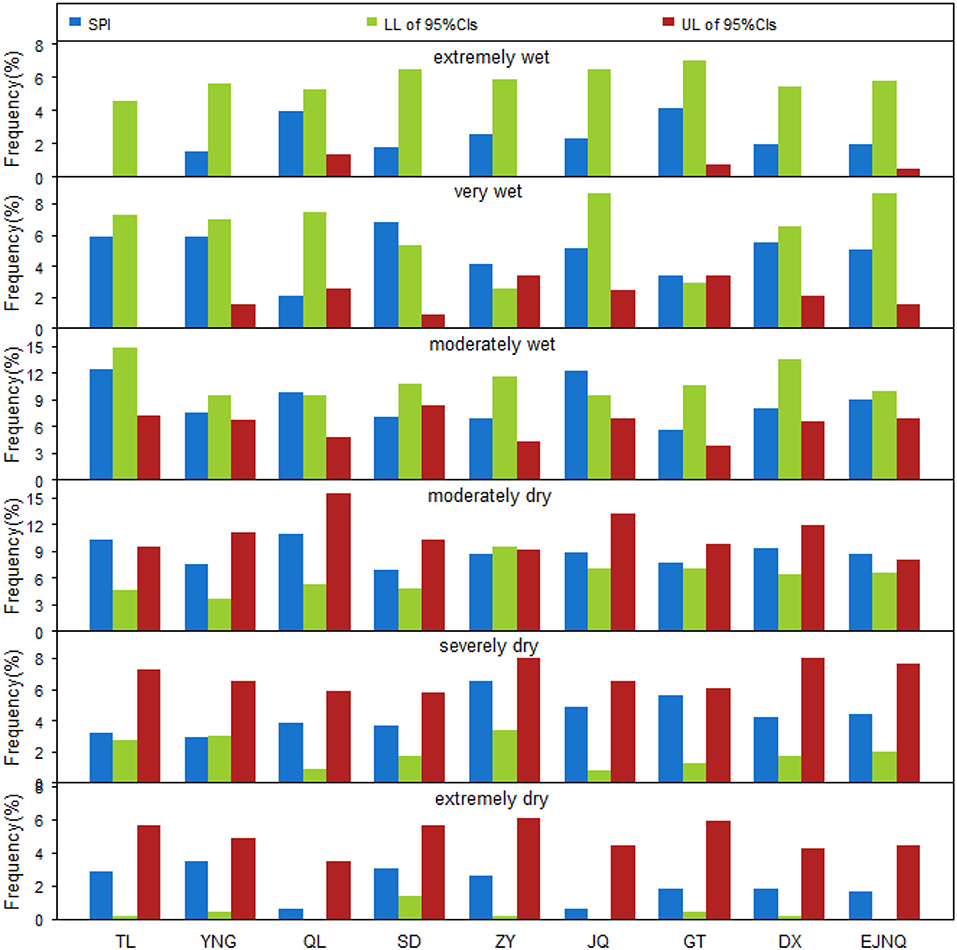
Figure 10. Drought classification frequency based on SPI values considering parameter estimation errors (LL and UL are the lower and upper limits of 95% CIs, respectively; the abbreviated names of stations are the same as in Figure 3).
Discussion
Drought index is an important indicator for drought researches. However, uncertainties exist in its calculation. This study discusses the effects of probability distributions and parameter estimation errors on both SPI values and drought characteristics.
It is found that the three-parameter distributions show better performance in fitting the precipitation data than those two-parameter distributions. This result keeps consistent with the finding of Vergni et al. (2017), who concluded that the two-parameter gamma distribution provides less reliable estimates of the precipitation probability than the three-parameter Pearson type III and the generalized normal distribution in their study case. Cindrić et al. (2012) suggested that as to the choice of the most appropriate distribution for a particular region the ratio of skewness and the coefficient of variation for the precipitation data can be used as an indicator. Angelidis et al. (2012) and Stagge et al. (2015) deemed that the suitable probability distribution is related with the time scale of precipitation data to be fitted. Angelidis et al. (2012) found that the log-normal distribution can produce almost the same results with gamma for 12- or 24-months SPI. Stagge et al. (2015) compared the seven probability distributions and concluded that the gamma distribution produces the most consistently good fit for the long-accumulation precipitation (>6-months), whereas Weibull is consistently the best for the short accumulation (1–3-months). In our case, log-logistic–type distribution can be used as alternatives in fitting the cumulative precipitation across the study area. Even though for avoiding the interpretability issues and potential extrapolation issues with complex distributions that may be overfit, to use a single and simple distribution may be a good choice (Stagge et al., 2015).
Considering the effects of different probability distributions on SPI and drought characteristics, less influence is found for normal and moderate classifications, while as the SPI values vary to the extremes, the influence becomes lager. This conclusion keeps in line with those from Angelidis et al. (2012) and Vergni et al. (2017), who concluded that the consistency of the SPI calculated with different distributions is good for normal periods, while becoming poor for very dry or very wet periods. It is also found in our case that different probability distributions lead to great differences in drought peak, event number, duration, and frequency.
With regard to the effects of parameter estimation errors on SPI values and drought characteristics, the resulted 95% CIs are becoming larger with the SPI value increasing or decreasing to the extremes. Furthermore, the intervals of drought event number and the maximum drought duration caused by parameter estimation errors are even larger than those caused by different probability distributions. As stated by Wu et al. (2005), the parameter estimates with little confidence would result in the SPI values with little confidence. To ensure the parameter estimates with high confidence, a long record of precipitation data is usually required for the analysis, because MLE presents unstable behavior for small samples (Martins and Stedinger, 2000), and preferable performance when the sample size becomes larger (more than 50) (Beguería et al., 2014). McKee et al. (1993) regarded that a continuous period of at least 30-years seems ideal in the SPI calculation, while Guttman (1994) found that ~40 to 60-years of record is needed for parameter estimation stability in the central part of the distribution and ~70 to 80-years of record for stability in the tails. Carbone et al. (2018) suggested that record lengths of 60-years are basically enough in general, which typically results in stable parameters and representative SPI values. In addition, the minimum length of record also depends on whether the precipitation pattern changes (Wu et al., 2005). Carbone et al. (2018) found that extreme events also have a significant influence on SPI estimates, even over 60-years of records.
Conclusions
The estimation of SPI involves uncertainties originated from many aspects. This article mainly focuses on the effects of two uncertainty sources (probability distribution functions and parameter estimation errors) on both the calculation of SPI of 12-months and drought characteristics.
Five three-parameter and five two-parameter distributions were employed. Results indicate that the log-logistic–type distribution (2-parameter and 3-parameter) presents the best performance in fitting the cumulative precipitation series over the Heihe River basin, better than the suggested gamma distribution, whereas Burr and Weibull present the worst. Results also show that the influences of different probability distributions on SPI values and on droughts are mainly manifested in the extreme classifications (extremely dry and extremely wet conditions with SPI ≤-2.0 and SPI ≥2.0), rather than in the normal and moderate classifications (corresponding to −1.5 < SPI < 1.5). This finding highlights the importance of selecting the suitable probability distribution in the calculation of SPI, because extremes are usually the primary focuses of many meteorological and disaster researches.
The effects of parameter estimation errors illustrate that the more extreme the SPI value (more drought or the more wet), the wider the 95% CIs, and the greater the uncertainty caused by parameter estimation errors. The parameter estimation errors also result in different drought characteristics. It indicates that the effects of parameter estimation errors should not be ignored because it probably affects the decision-making on drought analysis. A long record of precipitation data is essential to ensure that the parameter error is small. As to how long the records are sufficient over the study area will be discussed in the future analysis. Noted that, because all the findings here are in the context of the SPI at 12-month scale and limited stations, more works should be extended over further scales and regions, to define the most appropriate statistical distribution to fit precipitation data and properly characterize drought.
To sum up, both the probability distribution functions and parameter errors lead to the uncertainties in the estimation of SPI values and drought assessments, especially in the extreme values, which is just the focus of many extreme studies. Consequently, we should be vigilant about the uncertainty issues in drought assessment and strengthen the researches on quantifying and reducing such uncertainties, which will help decision-making becoming more confident.
Data Availability Statement
All data used in the study is available from China Meteorological Data Network (http://data.cma.cn/).
Author Contributions
YZ calculated the drought index, performed the uncertainty analysis using R programming language, and wrote the first draft of the manuscript. ZL provided the original data, helped to analyze and interpret the results, reviewed, and revised the manuscript.
Funding
This study was supported by the Fundamental Research Funds for the Central Universities (No. 35832015028) and NSFC (No. 41101038).
Conflict of Interest
The authors declare that the research was conducted in the absence of any commercial or financial relationships that could be construed as a potential conflict of interest.
Acknowledgments
The authors thank the financial support of the China Scholarship Council and China University of Geosciences (Beijing). We also acknowledge the editor and reviewers for carefully reading the manuscript and providing comments, which have improved the quality of the paper.
References
Angelidis, P., Maris, F., Kotsovinos, N., and Hrissanthou, V. (2012). Computation of drought index SPI with alternative distribution functions. Water Resour. Manage. 26, 2453–2473. doi: 10.1007/s11269-012-0026-0
Beguería, S., Vicente-Serrano, S. M., Reig, F., and Latorre, B. (2014). Standardized precipitation evapotranspiration index (SPEI) revisited: parameter fitting, evapotranspiration models, tools, datasets and drought monitoring. Int. J. Climatol. 34, 3001–3023. doi: 10.1002/joc.3887
Beyaztas, U., Arikan, B. B., Beyaztas, B. H., and Kahya, E. (2018). Construction of prediction intervals for palmer drought severity index using bootstrap. J. Hydrol. 559, 461–470. doi: 10.1016/j.jhydrol.2018.02.021
Carbone, G. J., Lu, J., and Brunetti, M. (2018). Estimating uncertainty associated with the standardized precipitation index. Int. J. Climatol. 38, 607–616. doi: 10.1002/joc.5393
Cindrić, K., Juras, J., and Pasarić, Z. (2012). “Statistical distributions for the SPI computation,” in EMS Annual Meeting AbstractsBerlin: EMS (Berlin). GF48: EMS2012-316.
Degeling, K., Ijzerman, M. J., Koopman, M., and Koffijberg, H. (2017). Accounting for parameter uncertainty in the definition of parametric distributions used to describe individual patient variation in health economic models. BMC Med. Res. Methodol. 17:170. doi: 10.1186/s12874-017-0437-y
Feng, Q., Cheng, G. D., and Endo, K. N. (2001). Towards sustainable development of the environmentally degraded River Heihe basin, China. Hydrobiol. Sci. J. 46, 647–658. doi: 10.1080/02626660109492862
Gabriel, C. B., and Monica, C. M. (2015). Inadequacy of the gamma distribution to calculate the standardized precipitation index. Rev. Bras. Eng. Agríc. Ambient. 19, 1129–1135. doi: 10.1590/1807-1929/agriambi.v19n12p1129-1135
Guttman, N. B. (1994). On the sensitivity of sample L moments to sample size. J. Climatol. 7, 1026–1029. doi: 10.1175/1520-0442(1994)007<1026:OTSOSL>2.0.CO;2
Guttman, N. B. (1999). Accepting the standardized precipitation index:a calculation algorithm. J. Am. Water Res. Assoc. 35, 311–322. doi: 10.1111/j.1752-1688.1999.tb03592.x
Hao, G., Anming, B., Tie, L., Sheng, C., and Felix, N. (2016). Evaluation of PERSIANN-CDR for meteorological drought monitoring over China. Remote Sens. 8:379. doi: 10.3390/rs8050379
Hao, Z., Aghakouchak, A., Nakhjiri, N., and Farahmand, A. (2014). Global integrated drought monitoring and prediction system. Sci. Data 1:140001. doi: 10.1038/sdata.2014.1
Hayes, M. J., Svoboda, M. D., Wilhite, D. A., and Vanyarkho, O. V. (1999). Monitoring the 1996 drought using the standardized precipitation index. Bull. Am. Meteorol. Soc. 80, 429–438. doi: 10.1175/1520-0477(1999)080<0429:MTDUTS>2.0.CO;2
He, Z. H., Liang, H., Yang, C. H., Huang, F. S., and Zeng, X. B. (2018). Temporal-spatial evolution of the hydrologic drought characteristics of the karst drainage basins in South China. Int. J. Appl. Earth Obs. Geoinf. 64, 22–30. doi: 10.1016/j.jag.2017.08.010
Hong, X. J., Guo, S. H. L., and Zhou, Y. L. (2013). Applicability of standardized precipitation index with alternative distribution functions. J. Water Res. Res. 2, 33–41. doi: 10.12677/JWRR.2013.21006
Hu, Y. M., Liang, Z. M., Liu, Y. W., Wang, J., Yao, L., and Ning, Y. W. (2015). Uncertainty analysis of SPI calculation and drought assessment based on the application of bootstrap. Int. J. Climatol. 35, 1847–1857. doi: 10.1002/joc.4091
Katiraie-Boroujerdy, P. S., Nasrollahi, N., Hsu, K. L., and Sorooshian, S. (2016). Quantifying the reliability of four global datasets for drought monitoring over a semiarid region. Theor. Appl. Climatol. 123, 387–398. doi: 10.1007/s00704-014-1360-3
Komuscu, A. U. (1999). Using the SPI to analyze spatial and temporal patterns of drought in Turkey. Drought Network News, 49.
Li, W. P. (2010). Regulation and Optimization of Water Resources in Typical Inner Basin in Northwest China – A Case Study of Heihe Basin. Beijing: Geological Press.
Liu, L., Liu, L. L., and Suo, Y. (2017). Spatiotemporal evolution of hydro-meteorological variables in the Heihe River Basin in recent 53 years. Arid Zone Res. 34, 465–478. doi: 10.13866/j.azr.2017.03.01
Liu, Y. W., Wang, W., Hu, Y. M., and Liang, Z. M. (2014). Drought assessment and uncertainty analysis for dapoling basin. Nat. Hazards 74, 1613–1627. doi: 10.1007/s11069-014-1259-4
Loukas, A., and Vasiliades, L. (2004). Probabilistic analysis of drought spatiotemporal characteristics in Thessaly region, Greece. Nat. Hazards Earth Syst. Sci. 4, 719–731. doi: 10.5194/nhess-4-719-2004
Lynch, D. T., Leasure, D. R., and Magoulick, D. D. (2018). The influence of drought on flow-ecology relationships in Ozark highland streams. Freshw. Biol. 63, 946–968. doi: 10.1111/fwb.13089
Ma, H. J., Yan, D. H., Weng, B. S., Fang, H. Y., and Shi, X. L. (2013). Applicability of typical drought indexes in the Luanhe River Basin. Arid Zone Res. 30, 728–734. doi: 10.13866/j.azr.2013.04.016
Madsen, H., Rasmussen, P. F., and Rosbjerg, D. (1997). Comparison of annual maximum series and partial duration series methods for modeling extreme hydrologic events: 1. At-site modeling. Water Resour. Res. 33, 747–757. doi: 10.1029/96WR03848
Martins, E. S., and Stedinger, J. R. (2000). Generalized maximum-likelihood generalized extreme-value quantile estimators for hydrologic data. Water Resour. Res. 36, 737–744. doi: 10.1029/1999WR900330
McKee, T. B., Doesken, N. J., and Kleist, J. (1993). “The relationship of drought frequency and duration to time scales,” in: Proceedings of the 8th Conference on Applied Climatology, ed P. J. Lamb (Anaheim, CA: American Meteorological Society), 179–184.
Merabti, A., Martins, D. S., Meddi, M., and Pereira, L. S. (2018). Spatial and time variability of drought based on SPI and RDI with various time scales. Water Resour. Manage. 32, 1087–1100. doi: 10.1007/s11269-017-1856-6
Mishra, A. K., and Singh, V. P. (2010). A review of drought concepts. J. Hydrol. 391, 202–216. doi: 10.1016/j.jhydrol.2010.07.012
Moreira, E. E. (2015). SPI drought class prediction using log-linear models applied to wet and dry seasons. Phys. Chem. Earth A/B/C 94, 136–145. doi: 10.1016/j.pce.2015.10.019
Nixon, R. M., Wonderling, D., and Grieve, R. D. (2010). Non-parametric methods for costeffectiveness analysis: the central limit theorem and the bootstrap compared. Health Econ. 19, 316–333. doi: 10.1002/hec.1477
Oliveira-Júnior, J. F. D., Gois, G. D., Terassi, P. M. D. B., Junior, C. A. D. S., Blanco, C. J. C., Sobral, B. S., et al. (2018). Drought severity based on the SPI index and its relation to the ENSO and PDO climatic variability modes in the regions North and Northwest of the State of Rio de Janeiro - Brazil. Atmos. Res. 212, 91–105. doi: 10.1016/j.atmosres.2018.04.022
Sheffield, J., and Wood, E. F. (2008). Global trends and variability in soil moisture and drought characteristics, 1950–2000, from observation-driven simulations of the terrestrial hydrologic cycle. J. Clim. 21, 432–458. doi: 10.1175/2007JCLI1822.1
Sienz, F., Bothe, O., and Fraedrich, K. (2012). Monitoring and quantifying future climate projections of dryness and wetness extremes: SPI bias. Hydrol. Earth Syst. Sci. 16, 2143–2157. doi: 10.5194/hess-16-2143-2012
Sims, A. P., Niyogi, D. D. S., and Raman, S. (2002). Adopting drought indices for estimating soil moisture: a North Carolina case study. Geophys. Res. Lett. 29, 24-1–24-4. doi: 10.1029/2001GL013343
Stagge, J. H., Tallaksen, L. M., Gudmundsson, L., Van Loon, A. F., and Stahl, K. (2015). Candidate distributions for climatological drought indices (SPI and SPEI). Int. J. Climatol. 35, 4027–4040. doi: 10.1002/joc.4267
Svensson, C., Hannaford, J., and Prosdocimi, I. (2017). Statistical distributions for monthly aggregations of precipitation and streamflow in drought indicator applications. Water Resour. Res. 53, 999–1018. doi: 10.1002/2016WR019276
Thai, H. T., France, M., Holford, N. H. G., Veyrat-Follet, C., and Comets, E. (2013). A comparison of bootstrap approaches for estimating uncertainty of parameters in linear mixed-effects models. Pharm. Stat. 12, 129–140. doi: 10.1002/pst.1561
Tirivarombo, S., Osupile, D., and Eliasson, P. (2018). Drought monitoring and analysis: standardised precipitation evapotranspiration index (SPEI) and standardised precipitation index (SPI). Phys. Chem. Earth A/B/C 106, 1–10. doi: 10.1016/j.pce.2018.07.001
Vergni, L., Di, L. B., Todisco, F., and Mannocchi, F. (2017). Uncertainty in drought monitoring by the standardized precipitation index: the case study of the Abruzzo region (Central Italy). Theor. Appl. Climatol. 128, 13–26. doi: 10.1007/s00704-015-1685-6
Vu, T. M., Raghavan, S. V., Liong, S. Y., and Mishra, A. K. (2018). Uncertainties of gridded precipitation observations in characterizing spatio-temporal drought and wetness over Vietnam. Int. J. Climatol. 38, 2067–2081. doi: 10.1002/joc.5317
Wang, J. S., Li, Y. H., Wang, R. Y., Feng, J. Y., and Zhao, Y. X. (2012). Preliminary analysis on the demand and review of progress in the field of meteorological drought research. J. Arid Meteorol. 30, 497–508.
Wu, H., Hayes, M. J., Wilhite, D. A., and Svoboda, M. D. (2005). The effect of the length of record on the standardized precipitation index calculation. Int. J. Climatol. 25, 505–520. doi: 10.1002/joc.1142
Wu, S. F., Zhang, X., Wang, J. X., Liu, J. F., and Pan, G. Y. (2016). Calculation of the SPI based on the best fitted distribution functions to the precipitation series. Arid Land Geogr. 39, 555–564.
Xu, Q. Y., Zhang, Q., Zhang, C. J., Yin, X. Z., Guo, H., Zhang, D. Q., et al. (2005). Research on drought early warning system of China. J. Desert Res. 25, 785–789. doi: 10.3321/j.issn:1000-694X.2005.05.028
Yevjevich, V. (1967). An Objective Approach to Definitions and Investigations of Continental Hydrologic Droughts, Vol. 6. Fort Collins, CO: Colorado State University, 23–30.
Zambrano, F., Wardlow, B., Tadesse, T., Lillo-Saavedra, M., and Lagos, O. (2017). Evaluating satellite- derived long-term historical precipitation datasets for drought monitoring in Chile. Atmos. Res. 186, 26–42. doi: 10.1016/j.atmosres.2016.11.006
Zhang, Y. H., Li, W. W., Chen, Q. H., Pu, X., and Xiang, L. (2017). Multi-models for SPI drought forecasting in the north of Haihe River Basin, China. Stoch. Environ. Res. Risk Assess. 31, 2471–2481. doi: 10.1007/s00477-017-1437-5
Keywords: standardized precipitation index, uncertainty, probability distribution, drought assessment, Heihe River basin, China
Citation: Zhang Y and Li Z (2020) Uncertainty Analysis of Standardized Precipitation Index Due to the Effects of Probability Distributions and Parameter Errors. Front. Earth Sci. 8:76. doi: 10.3389/feart.2020.00076
Received: 21 November 2019; Accepted: 02 March 2020;
Published: 02 April 2020.
Edited by:
Xingcai Liu, Institute of Geographic Sciences and Natural Resources Research (CAS), ChinaCopyright © 2020 Zhang and Li. This is an open-access article distributed under the terms of the Creative Commons Attribution License (CC BY). The use, distribution or reproduction in other forums is permitted, provided the original author(s) and the copyright owner(s) are credited and that the original publication in this journal is cited, in accordance with accepted academic practice. No use, distribution or reproduction is permitted which does not comply with these terms.
*Correspondence: Zhanling Li, zhanling.li@cugb.edu.cn