Integrating X-Ray Computed Tomography With Chemical Imaging to Quantify Mineral Re-crystallization From Granulite to Eclogite Metamorphism in the Western Italian Alps (Sesia-Lanzo Zone)
 Luca Corti
 Michele Zucali1,2
  Roberto Visalli
 Lucia Mancini
- 1Department of Earth Sciences, University of Milano, Milan, Italy
- 2Department of Earth and Atmospheric Sciences, University of Houston, Houston, TX, United States
- 3Department of Biological, Geological and Environmental Sciences, University of Catania, Catania, Italy
- 4Elettra-Sincrotrone Trieste S.C.p.A., Trieste, Italy
- 5Geological Survey of Finland, Espoo, Finland
Metamorphic transformations and fabric evolution are the consequence of thermo-dynamic processes, lasting from thousands to millions of years. Relative mineral percentages, their grain size distribution, grain orientation, and grain boundary geometries are first-order parameters for dynamic modeling of metamorphic processes. To quantify these parameters, we propose a multidisciplinary approach integrating X-ray computed microtomography (μ-CT) with X-ray chemical mapping obtained from an Electron MicroProbe Analyzer (EMPA). We used a metapelitic granulite sample collected from the Alpine HP-LT metamorphic rocks of the Mt. Mucrone (Eclogitic Micaschists Complex, Sesia-Lanzo Zone, Western Alps, Italy). The heterogeneous Alpine deformation and metamorphism allowed the preservation of pre-alpine structural and mineralogical features developed under granulite-facies conditions. The inferred granulitic mineral association is Grt + Bt + Sil + Pl + Qtz ± Ilm ± Kfs ± Wm. The subsequent pervasive static eclogite-facies re-equilibration occurred during the alpine evolution. The inferred alpine mineral association is Wm + Omp ± Ky + Qtz + Grt though local differences may occur, strongly controlled by chemistry of microdomains. X-ray μ-CT data extracted from centimeter-sized samples have been analyzed to quantify the volumetric percentage and shape preferred orientation (SPO) for each mineral phase. By combining tomographic phase separation with chemical variation and microstructures (i.e., different grain-size classes for the same phase and morphology of different pre-alpine microdomains) the pre-alpine mineralogical phases from the alpine overprint have been distinguished and quantified. Moreover, the sample preserves 100% of the pre-alpine granulite fabric, which surprisingly corresponds to less than 22% of the corresponding pre-alpine metamorphic assemblages, while the alpine eclogitic static assemblage corresponds to 78% though no new fabric is developed. This contribution demonstrates that the combined use of EMPA X-ray chemical mapping with the X-ray μ-CT shape analysis permits a dynamic approach to constrain the chemistry of the mineral phases linked to the development of metamorphic-related static and dynamic fabrics.
Introduction
The knowledge of crust and mantle dynamics is mostly based on the study of fabric elements, metamorphic assemblages and their relationships within the rock-volume, now exposed after the subduction- and collision-related processes. The metamorphic basements are usually affected by strong heterogeneities in the degree of fabric and metamorphic evolution (Salvi et al., 2010; Corti et al., 2017), mainly due to the strain partitioning and consequent heterogeneous distribution of metamorphic assemblages (e.g., Myers, 1970; Mørk, 1985; Spalla and Zucali, 2004; Spalla et al., 2005; Pearce and Wheeler, 2010). Detailed multiscale correlation between deformation and metamorphism has been shown to be of primary importance to constrain the relationships between fabric and metamorphism (e.g., Turner and Weiss, 1963; Park, 1969; Hobbs et al., 1976, 2010; Williams, 1985; Lardeaux and Spalla, 1990; Passchier et al., 1990; Johnson and Vernon, 1995; Spalla et al., 1999; Salvi et al., 2010; Gosso et al., 2015; Corti et al., 2017).
Classical structural geology studies have been progressively reinforced by a collection of quantitative data through texture analysis (e.g., Zucali et al., 2014a; Frassi et al., 2017), synchrotron X-ray computed microtomography (e.g., Zucali et al., 2014a) and chemical mapping of superimposed structures in metamorphic rocks (Lanari et al., 2014; Ortolano et al., 2014a; Visalli, 2017). In this view, the quantitative analysis of the metamorphic textures related to the superimposed fabrics allows the evaluation of the mechanically and chemically reacting volume percentage, during successive tectono-metamorphic stages. In particular, the estimation of relative mineral percentages, their grain size distribution, grain orientation, and grain boundary geometries for each tectono-metamorphic stage are the first-order parameters for dynamic modeling of metamorphic processes.
To quantitatively investigate the textural and chemical heterogeneities developing during deformation and metamorphism partitioning we propose a novel approach integrating X-ray computed microtomography (μ-CT) with X-ray chemical mapping obtained from an Electron MicroProbe Analyzer (EMPA). This procedure combines (1) the quantitative calibration of the X-ray chemical map for selected microdomains using the Q-XRMA (i.e., Quantitative X-Ray Map Analyzer) statistical approach (Ortolano et al., 2018) to determine different compositional regions within the rock and minerals associated to the superposed metamorphic assemblages; (2) the high-resolution thin section optical scanning to determine the mineral grain-size distribution and perform the orientation analysis using the Min-GSD (Mineral-Grain Size Distribution) method (Visalli, 2017); and (3) the X-ray μ-CT capability to resolve the three-dimensional (3D) shape and spatial distribution of minerals marking different fabrics in metamorphic rocks (e.g., Denison et al., 1997; Huddlestone-Holmes and Ketcham, 2010; Voltolini et al., 2011; Baker et al., 2012; Sayab et al., 2015; Macente et al., 2017).
We applied this approach to a metapelitic granulite sample (i.e., kinzigite gneiss) surfacing within the poly-deformed metamorphic basements of the Mt. Mucrone, Eclogitic Micaschists Complex, Sesia-Lanzo Zone, Western Alps (Hy, 1984; Koons et al., 1987; Ridley, 1989; Ildefonse et al., 1990; Zucali et al., 2002; Babist et al., 2006; Cenki-Tok et al., 2011; Delleani et al., 2013). The sample pervasively records the pre-alpine granulite fabric, but the original pre-alpine granulite mineral assemblages were extensively replaced by static eclogite facies minerals, recording the alpine subduction-related evolution.
In this contribution, we show how to quantify the modal percentage, the mineral chemical variation, the grain-size distribution, the grain orientation, and the grain boundary geometries of the mineral phases recording the metamorphic evolution from pre-alpine granulitic- to the eclogitic-facies conditions. This approach allows a detailed and reliable discrimination of these parameters for the pre-alpine and alpine stages.
Materials and Methods
Geological Outline
The Sesia-Lanzo Zone, in the Western Alps (SLZ, Figures 1A,B), is a portion of continental crust, which recorded high pressure (HP) metamorphic conditions during the alpine subduction (e.g., Dal Piaz et al., 1972; Compagnoni et al., 1977; Pognante, 1991; Babist et al., 2006; Meda et al., 2010; Roda et al., 2012; Regis et al., 2014). Its alpine metamorphic history comprises a prograde blueschist- to eclogite-facies stage followed by blueschist- and greenschist-facies retrograde re-equilibrations (e.g., Compagnoni and Maffeo, 1973; Compagnoni, 1977; Gosso, 1977; Lardeaux, 1981; Lardeaux et al., 1982a, 1983; Spalla et al., 1983; Pognante, 1989a; Castelli and Rubatto, 2002; Zucali et al., 2004; Rebay and Messiga, 2007; Zanoni et al., 2008; Zucali and Spalla, 2011; Giuntoli and Engi, 2016; Corti et al., 2018; Giuntoli et al., 2018a; Roda et al., 2018a, 2019). The metamorphic evolution ended at Oligocene with the intrusion of large intrusive bodies which produced contact metamorphic aureole (Zanoni et al., 2008). The alpine eclogite-facies peak has been dated between 90 and 65 Ma (Rubatto et al., 1999; Cenki-Tok et al., 2011; Regis et al., 2014; Giuntoli et al., 2018b; Halama et al., 2018). The early-alpine HP imprints range between 500–625°C and 1.3–2.5 GPa (see Roda et al., 2012 for a review of P-T estimates). The eclogitized ophiolitic relics of the Liguria-Piedmont Ocean, the Piedmont Zone, bound the external margin of the SLZ, while the SLZ internal margin is a thick mylonitic belt (the Canavese Line) (Figure 1); the Canavese Line puts in contact the SLZ from the lower crustal rocks of the Southalpine Ivrea Zone (e.g., Bigi et al., 1990; Rebay et al., 2018; Balestro et al., 2019). The SLZ is subdivided into four main units (Figure 1B): the Eclogitic Micaschist Complex (EMC), the Gneiss Minuti Complex (GMC), the II Dioritic–Kinzigitic Zone (IIDK) and the Rocca Canavese Thrust Sheets (RCT) (e.g., Compagnoni et al., 1977; Pognante, 1989a, b; Spalla et al., 1991; Cantù et al., 2016; Roda et al., 2018a, 2019). Eclogitic parageneses are widely described both in EMC and GMC with a strong difference in relative volume affected by the retrograde greenschist re-equilibration. The GMC is widely re-equilibrated under greenschist facies conditions, while the EMC, constituting the internal part of the SLZ, records the greenschist-facies re-equilibration along discrete shear zones (Spalla et al., 1983, 1991; Stünitz, 1989; Giuntoli and Engi, 2016). The IIDK consists of kilometric lenses of paragneisses, marbles and metabasites between EMC and GMC. The pre-alpine high-temperature evolution is well preserved and the alpine eclogitic assemblages are described only in the Vogna Valley, where the tectonic contact between IIDK and EMC is marked by eclogitic mylonites (Lardeaux, 1981; Lardeaux et al., 1982b).

Figure 1. (A) Tectonic outline of the major domain of the alpine chain. (B) Tectonic scheme of the Western Alps with the different metamorphic complexes of the Sesia-Lanzo Zone. The studied area is located. (C) Rock-types and foliation trajectories around the Mt. Mucrone. The metapelitic granulite sample is located. (D) P-T-d-t path modified after Zucali et al. (2002) and Delleani et al. (2013).
The EMC protoliths, composed by high-grade paragneisses, granulites, amphibolites and minor marbles and quartzites, constitute the country rocks of the Permian granitoids and gabbros (Compagnoni and Maffeo, 1973; Callegari et al., 1976; Compagnoni et al., 1977; Lardeaux, 1981; Oberhänsli et al., 1985; Castelli, 1987; Bussy et al., 1998; Cenki-Tok et al., 2011; Zucali, 2011; Corti et al., 2017); the Mt. Mucrone is one of these Permian bodies and the most renown. The deformation history of EMC, in the area of Mt. Mucrone and studied samples, comprises four generations of alpine folds (Figure 1C), two of which are associated with the HP mineral assemblages, and two generations of shear zones synchronous with the blue- and greenschist-facies re-equilibration, respectively (Hy, 1984; Zucali et al., 2002; Delleani et al., 2012, 2013).
A pre-alpine polyphasic metamorphic evolution, from granulite- to amphibolite-facies conditions, has been recognized in marbles, metapelites, metagranitoids and metabasics of the SLZ (Compagnoni et al., 1977; Lardeaux et al., 1982b; Castelli, 1991; Lardeaux and Spalla, 1991; Rebay and Spalla, 2001). This pre-alpine stage, marked by biotite-, sillimanite-, garnet-rich foliation in paragneiss (pre-D1 in Figure 1D), is found as relict in paragneiss close to the Mt. Mucrone (i.e., metapelitic granulite sample in Figure 1C). The pre-alpine stage has been constrained at T = 730–830°C P = 0.7–0.9 GPa for acid and basic granulites surfacing in other localities of the SLZ (Lardeaux and Spalla, 1991). Pre-D1 has been interpreted as the result of an extension-related uplift of a portion of the Variscan crust; this extensional tectonics is inferred to be of Permian–Triassic time, during the lithospheric thinning leading to the Tethys opening (e.g., Lardeaux and Spalla, 1991; Marotta et al., 2009; Roda et al., 2018b).
Sample Description
The analyzed samples are pre-alpine granulite-facies metapelites, characterized by gneissic fabric (i.e., kinzigite). They were collected from the EMC, NW of the Lago del Mucrone (Figure 1C, UTM32N – WGS84 417517.69 m E, 5053493.35 m N). They occur as lenses within the eclogitic gneisses and micaschists, country rocks of the Permian Mt. Mucrone metaintrusive body (Eclogitic Micaschists Complex, Sesia-Lanzo Zone, Western Alps). The heterogeneous alpine deformation and metamorphism allowed the preservation of pre-alpine granulite-facies relicts in country rocks, preserving a foliation (pre-S1 in Figure 1C) at meter-scale, wrapped by the eclogite-facies S1 and S2 foliations (Figure 1C). The pre-alpine fabrics are mostly defined by alternating microfilms and microlithons, which are marked, respectively, by red-brown biotite, elongated ex-sillimanite domain, ilmenite, rare white mica and garnet porphyroblasts, K-feldspars, ex-plagioclase domain, quartz, and decussate arcs of red-brown biotite (Figure 2A). The pre-S1 foliation (Figure 2A) is characterized by S-C-like geometry where the C planes, spaced by 2–3 mm, deflect the S planes marked by biotite and ex-sillimanite domains, the latter being characterized by diagnostic columnar shape and transversal fractures (Figure 2D). Garnet porphyroclasts are wrapped by the pre-S1 foliation; they are commonly associated with biotite, quartz and white mica (WmI) inclusions (Figures 2B,C). Ex-plagioclase domains are characterized by thin-grained aggregates of white mica and/or a high-relief mineral (omphacite) and may occur as elongated domain, mainly parallel to the S-planes, locally wrapping porphyroblasts, or as coronas of the garnet porphyroblasts (Figure 2B). Biotite also marks the pre-S1 foliation; biotite is well preserved in microfilm domains and displays (001) cleavage mainly parallel to the foliation; its red-color at parallel nicols suggests a preserved composition, probably related to the pre-alpine high-temperature conditions (e.g., Hayama, 1959; Wu and Chen, 2015). Locally, isolated grains of white mica co-exist with biotite, suggesting also a pre-alpine age for the white mica (WmI in Figure 2E). The pre-S1 pre-alpine fabric is pervasively replaced by static eclogite facies mineral association, namely garnet, white mica, omphacite, kyanite, and rutile. Alpine generation of garnet (GrtII in Figure 2B) occurs as corona over garnet porphyroblasts (GrtI) or biotite (Figure 2B) or as new grains (Figure 2). Alpine white mica (WmII, Figures 2C,E) defines thin-grained aggregates likely replacing feldspar, biotite or white mica pre-alpine domains. Omphacite (OmpI) fine-grained aggregates replace pre-alpine plagioclase (Figure 2B); large individuals may also occur as in Figure 2D. Kyanite occurs as fine-grained aggregates replacing sillimanite in ex-sill domains (Figure 2D). The fine grain-size made the recognition of optical characters sometimes hard. The different alpine metamorphic assemblages or replacements seem to be strongly controlled by the chemistry of microdomains. Typical examples are kyanite and omphacite that preferentially grow only in specific pre-alpine domains. This is also confirmed by the comparison of the eclogitic assemblages of these rocks with those of eclogitic micaschists where no kyanite occur, likely due to the effect of chemical homogenization of the alpine deformation. The inferred eclogitic mineral association WmII + OmpI ± KyI + Qtz + GrtII + Rt indicate T = 500–600°C and P ≥ 1.5–2.2 GPa conditions (Zucali et al., 2002) while the pre-alpine granulitic stage is characterized by the mineral assemblage GrtI + BtI + SillI + Pl + Qtz ± Ilm ± Kfs ± WmI, but no thermo-barometric estimates are available so far.
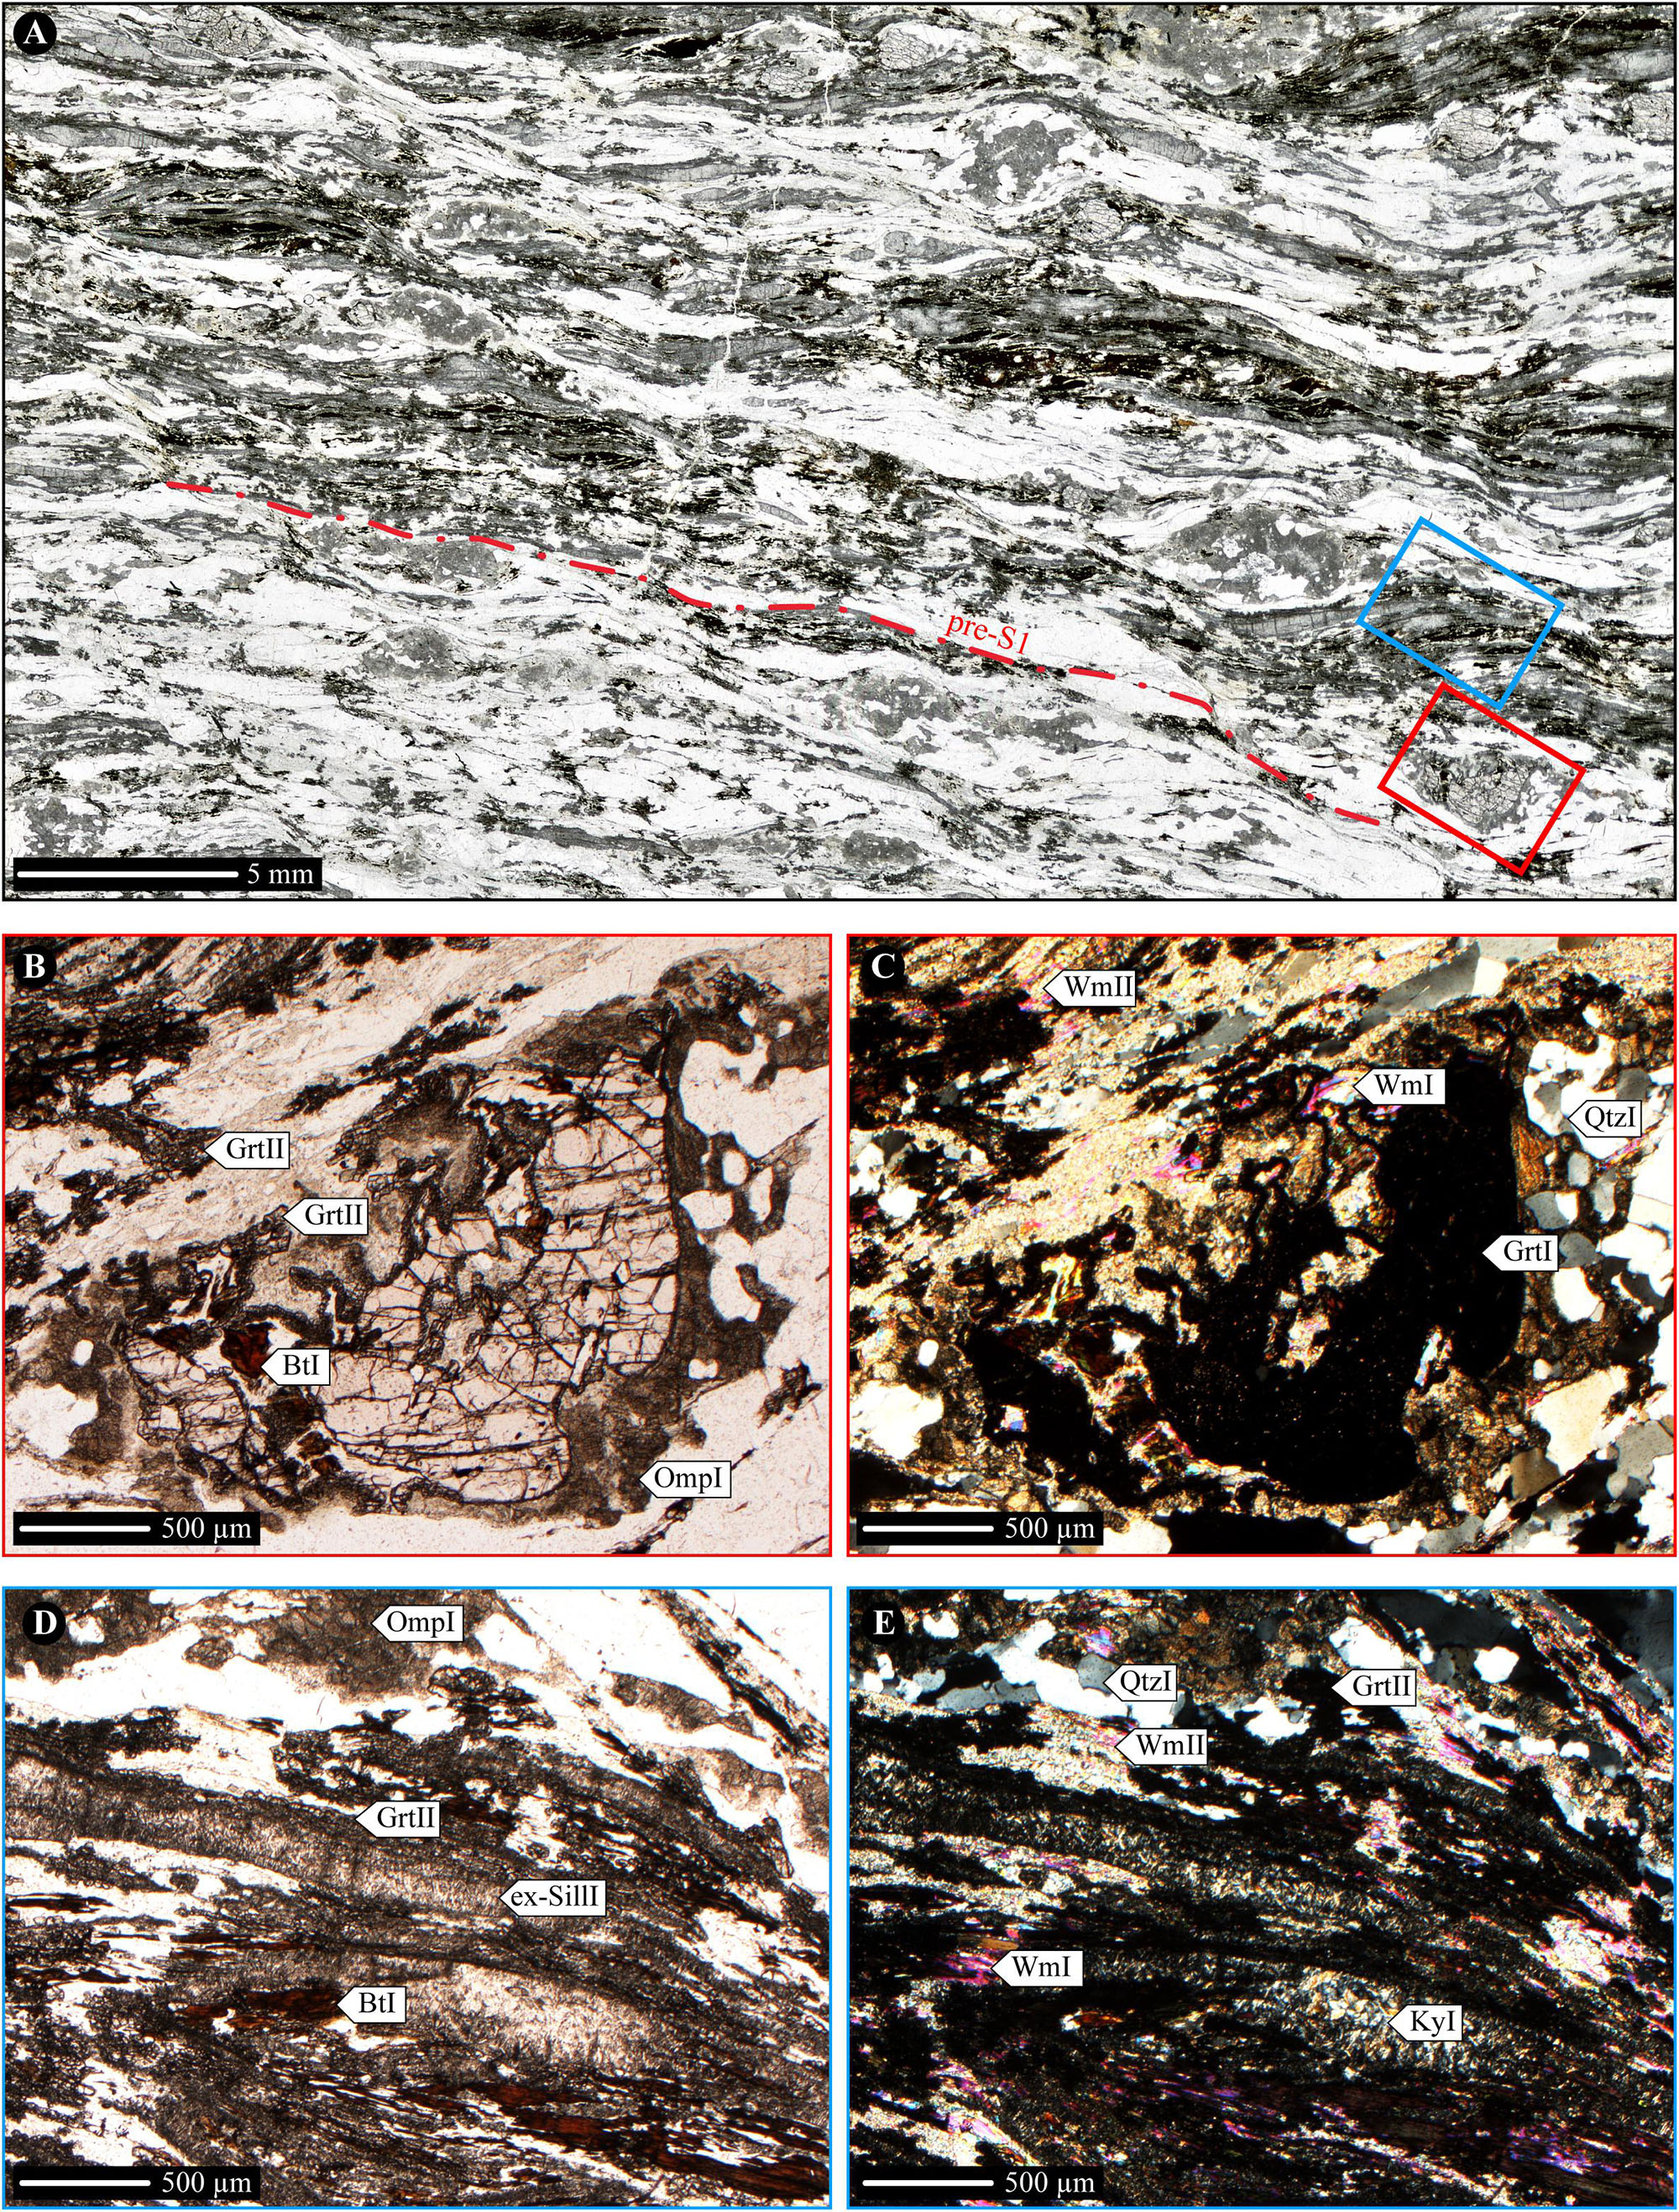
Figure 2. (A) High-resolution optical scan of the entire thin section characterized by well-developed pre-S1 foliation, plane polarized light. (B) pre-alpine Grt microdomains, plane polarized light. (C) pre-alpine Grt microdomains, crossed polars. (D) pre-alpine Sill and Pl microdomains, plane polarized light. (E) pre-alpine Sill and Pl microdomains, crossed polars.
Methods
Chemical Imaging and Fabric Analysis
Three different image processing tools (i.e., GSD, Q-XRMA and Min-GSD) developed at the Geoinformatics and Image Analysis Lab of the Biological, Geological, and Environmental Sciences Department at the University of Catania (Italy), have been applied both at the scale of the entire thin section and of the microdomain one. In this last case, two microdomains (i.e., C1, C2) have been selected as the best candidates to execute the tools. These tools are based on various scripts and functions adopted for images analysis, implemented within the most common GIS software, which have been increasingly used in solving various geoscientific issues (e.g., Li et al., 2010; DeVasto et al., 2012; Pradhan, 2013; Ortolano et al., 2014a, b; Belfiore et al., 2016; Fiannacca et al., 2017; Berrezueta et al., 2019).
The first tool adopted is the Grain Size Detector (GSD – Visalli, 2017). Such tool permits the users to trace a map of polygonal features representative of the grains composing the rock, by processing high-resolution thin section optical scans. In such a way, a database containing several data of grain sizes and shapes (e.g., area, axial ratio, orientation with respect the foliation and others) is obtained. With this aim, a 24 bit-depth optical scan has been acquired with a resolution of 4800 dpi via an Epson V750 dual lens system scanner. According to Visalli (2017), the above scan resolution was selected as the best setting for acquiring an image at high quality, reducing, at the same time, the required hard drive space storage and image processing time.
The analytical procedure of the tool is based on the sequential application of four image-processing steps, within the GIS environment: (i) the filtering step, to improve the quality of the input scan, by emphasizing grains boundaries and reducing noise; (ii) the image segmentation step, required to distinguish, select and extract boundaries of different grains; (iii) the vectorization step, needed to create polygon features that trace the original grains of the thin section; and, finally, (iv) the quantification step, useful to calculate grain sizes and shape parameters.
The second tool applied is the Quantitative X-Ray Map Analyzer (Q-XRMA – Ortolano et al., 2018). In this case, users are able to classify rock-forming minerals starting from an array of X-ray maps as well as to calibrate these maps for deriving pixel-based chemical data and end-member fraction maps, by using a sufficient number of spot chemical analyses as internal standards (De Andrade et al., 2006). With this aim, major element X-ray maps (i.e., Al, Ca, Cr, Fe, K, Mg, Mn, Na, Si, Ti) of the entire thin section (c. 38∗20 mm) have been acquired using a JEOL 8200 electron microprobe equipped with five WDS spectrometers located at the Department of Earth Science, University of Milan. Operating conditions were 160 ms dwell time, 15 kV accelerating voltage and a probe current of 100 nA. A spatial resolution of about 60 μm in both x and y directions was used for acquiring an image with a resolution of 360 × 610 pixels. X-ray maps of the C1 and C2 microdomains were acquired with a dwell time of 130 ms and pixel matrices of 650 × 700 and 600 × 770, where the pixel size was equaled to 4 and 5 μm, respectively. Spot chemical analyses used as internal standards to calibrate X-ray maps were performed using the JEOL 8200 EMPA. Operating conditions were: ∼1 μm beam spot, 15 kV accelerating voltage, and 5 nA beam current. Natural minerals and synthetic oxides were used as standards. Adopted mineral abbreviations are from Siivola and Schmid (2007), whereas mineral formulae were calculated according to Deer et al. (1992) by the jPTGUI software (Zucali, 2005). Representative mineral analyses and structural formulae of garnet, biotite, pyroxene and white mica are given as Supplementary Table S1. The analytical procedure of the Q-XRMA tool is subdivided into three different cycles: (i) the first cycle consists of various stages implying a multivariate statistical data handling of the X-ray maps, based on the sequential application of the Principal Components Analysis (PCA) and the supervised Maximum Likelihood Classification (MLC) (Ortolano et al., 2014b). As a result, users can distinguish mineral phases constituting the analyzed thin section/microdomain as well as extrapolate the associated modal percentages; (ii) the second cycle comprises two sub-procedure allowing to perform, on one hand, an in-depth analysis of a selected phase identified during the first cycle for detecting occurrences of sub-phases (e.g., mineral zoning) and, on the other hand, to calibrate native X-ray maps through a multiple linear regression algorithm. In this last case, the element concentration values (expressed as atoms per formula unit, a.p.f.u) can be predicted for each pixel representative of a specific investigated mineral phase; (iii) the third cycle permits users to manage the calibrated X-ray maps obtained during the second cycle, for constructing maps of end-member proportions as well as quantifying chemical variations within the investigated phases.
The third tool adopted is the Mineral Grain Size Detector (Min-GSD – Visalli, 2017). This tool allows users to merge together the outputs of the GSD and Q-XRMA in order to label each grain polygon feature with the appropriate mineral name, as the GSD tool alone is not capable to make any division between grains of the same/different minerals, unless the user manually renames each polygon. The analytical procedure requires the sequential application of three different steps: (i) a preliminary manual georeferencing stage, in ArcGIS® environment, between the GSD and Q-XRMA outputs. This is in order to ensure a valid overlap between the two images; (ii) a raster to point conversion of the Q-XRMA output, with the aim to convert each classified pixel in a point feature storing the datum of the mineral name; and finally, (iii) a spatial join operation between the GSD output and the Q-XRMA point converted image in order to attach the correct mineral name to each polygon feature. In this view, the tool calculates the highest frequency of the pixels having the same label enclosed within a polygon.
X-Ray Computed Tomography
X-ray computed microtomography (μ-CT) is a non-destructive technique based on the 3D mapping of the X-ray attenuation coefficient across the investigated sample (Baruchel et al., 2000). Using X-ray μ-CT based on a cone-beam geometry it is possible to achieve a maximum spatial resolution close to the focal spot size of the microfocus X-ray source. Moreover, it has been demonstrated (Wilkins et al., 1996) that by using a tomographic instrument based on a microfocus source, it is possible to take advantage of phase-contrast effects at the edges of the different features present within the sample volume (phase objects). This could allow to improve the contrast and spatial resolution in the images, obtaining sharper borders of the sample features and detecting details smaller than the pixel size of the detector (Mancini et al., 1998). Phase-contrast X-ray μ-CT measurements based on synchrotron and microfocus X-ray sources applied in the Earth science domain represent a powerful tool for the non-destructive characterization of the internal microstructures and the mineral phases separation thanks to their different density and/or chemical composition (Polacci et al., 2010; Zandomeneghi et al., 2010; Baker et al., 2012; Cnudde and Boone, 2013). Through virtual slicing of the sample volume and applying image processing and analysis 3D tools, it is possible to achieve a quantitative shape preferred orientation (SPO) analysis by means of the extraction of geometrical, morphological, and orientation parameters (Voltolini et al., 2011; Zucali et al., 2014b).
Phase-contrast X-ray μ-CT data have been acquired on centimeter-sized samples at the TomoLab station at the Elettra synchrotron facility in Basovizza (Trieste, Italy)1. This station is equipped with a sealed microfocus source (Hamamatsu, Japan) which guarantees a minimum focal spot size of 5 μm. For each sample, a set of 2400 projections was acquired over a total scan angle of 360°. A water-cooled, 12-bit, 4008 × 2672 pixels CCD camera (Photonic Science, United Kingdom) was used as detector applying a 2 × 2 binning to the pixels. Scanning acquisition conditions were: Voltage = 130 kV, current = 61 μA, filter = 1.5 mm of Al, exposure time per projection = 6.5 s, source-to-sample distance = 220 mm and source-to-detector distance = 311 mm. The reconstruction of the tomographic slices was done using the commercial software COBRA (Exxim, United States) with an isotropic voxel size of 17.7 μm. The reconstructed slices were visualized by using the freeware ImageJ (Schneider et al., 2012), while the 3D visualization, through volume rendering procedure, was obtained by the Pergeos software2. PerGeos software allows the mineral quantification through user-friendly 3D visual imaging and mineral phases segmentation by mapping gray value to specific colors. To reduce imaging noise, the reconstructed μ-CT data (Figure 3A) was pre-filtered using variance weighted mean filter (Figure 3B; noise variance = 400, radius = 2 pixels; Gonzalez and Woods, 2002). Prior to the volume data processing, we crop out a sub-volume (VOI: Volume of Interest) suitable for the analysis avoid the dark background masking the slices with respect to the outer region of the sample. The mineral phases are separated from each other using 3D Marked-Watershed segmentation (MBW; Meyer and Beucher, 1990). The algorithm is based on semi-automatic thresholding, where the boundary between mineral is defined by using the gradient function (i.e., the local deviation) as the gray-values delimiters (Figures 3C,D). The material to be segmented is marked using the manual Interactive Overlay Thresholding function seeded with local maxima of distance map. During the procedure it is possible to have areas with multiple adjacent local maxima. This issue can be minimized taking only the largest local maxima (Sayab et al., 2017). The MBW algorithm then expand the seeded markers over the related mineral phases (Figures 3E,F) using a landscape function which is defined by the gradient volume (i.e., active contours algorithm). Once the segmentation is achieved post-segmentation filtering was needed to improve the edge preservation and to remove the background voxels. The filtering was retained to a minimum level to preserve the shape of the objects. In this view, we used the closing procedure for avoid dark “unclassified” voxels (Sayab et al., 2016). Thanks to this imaging analysis we separated seven mineral phases: garnet, pyroxene, kyanite, quartz, micas, and opaque minerals. The 3D grain size distribution and the SPO analysis for each mineral phase have been calculated along with the entire rock volume and for each XY plane thanks to the Separate Object procedure using the Skeleton algorithm. Through the labeling tool it is possible to extract the useful parameters, i.e., length, width, volume, orientation angles, eigenvalue, and eigenvector, for each object.
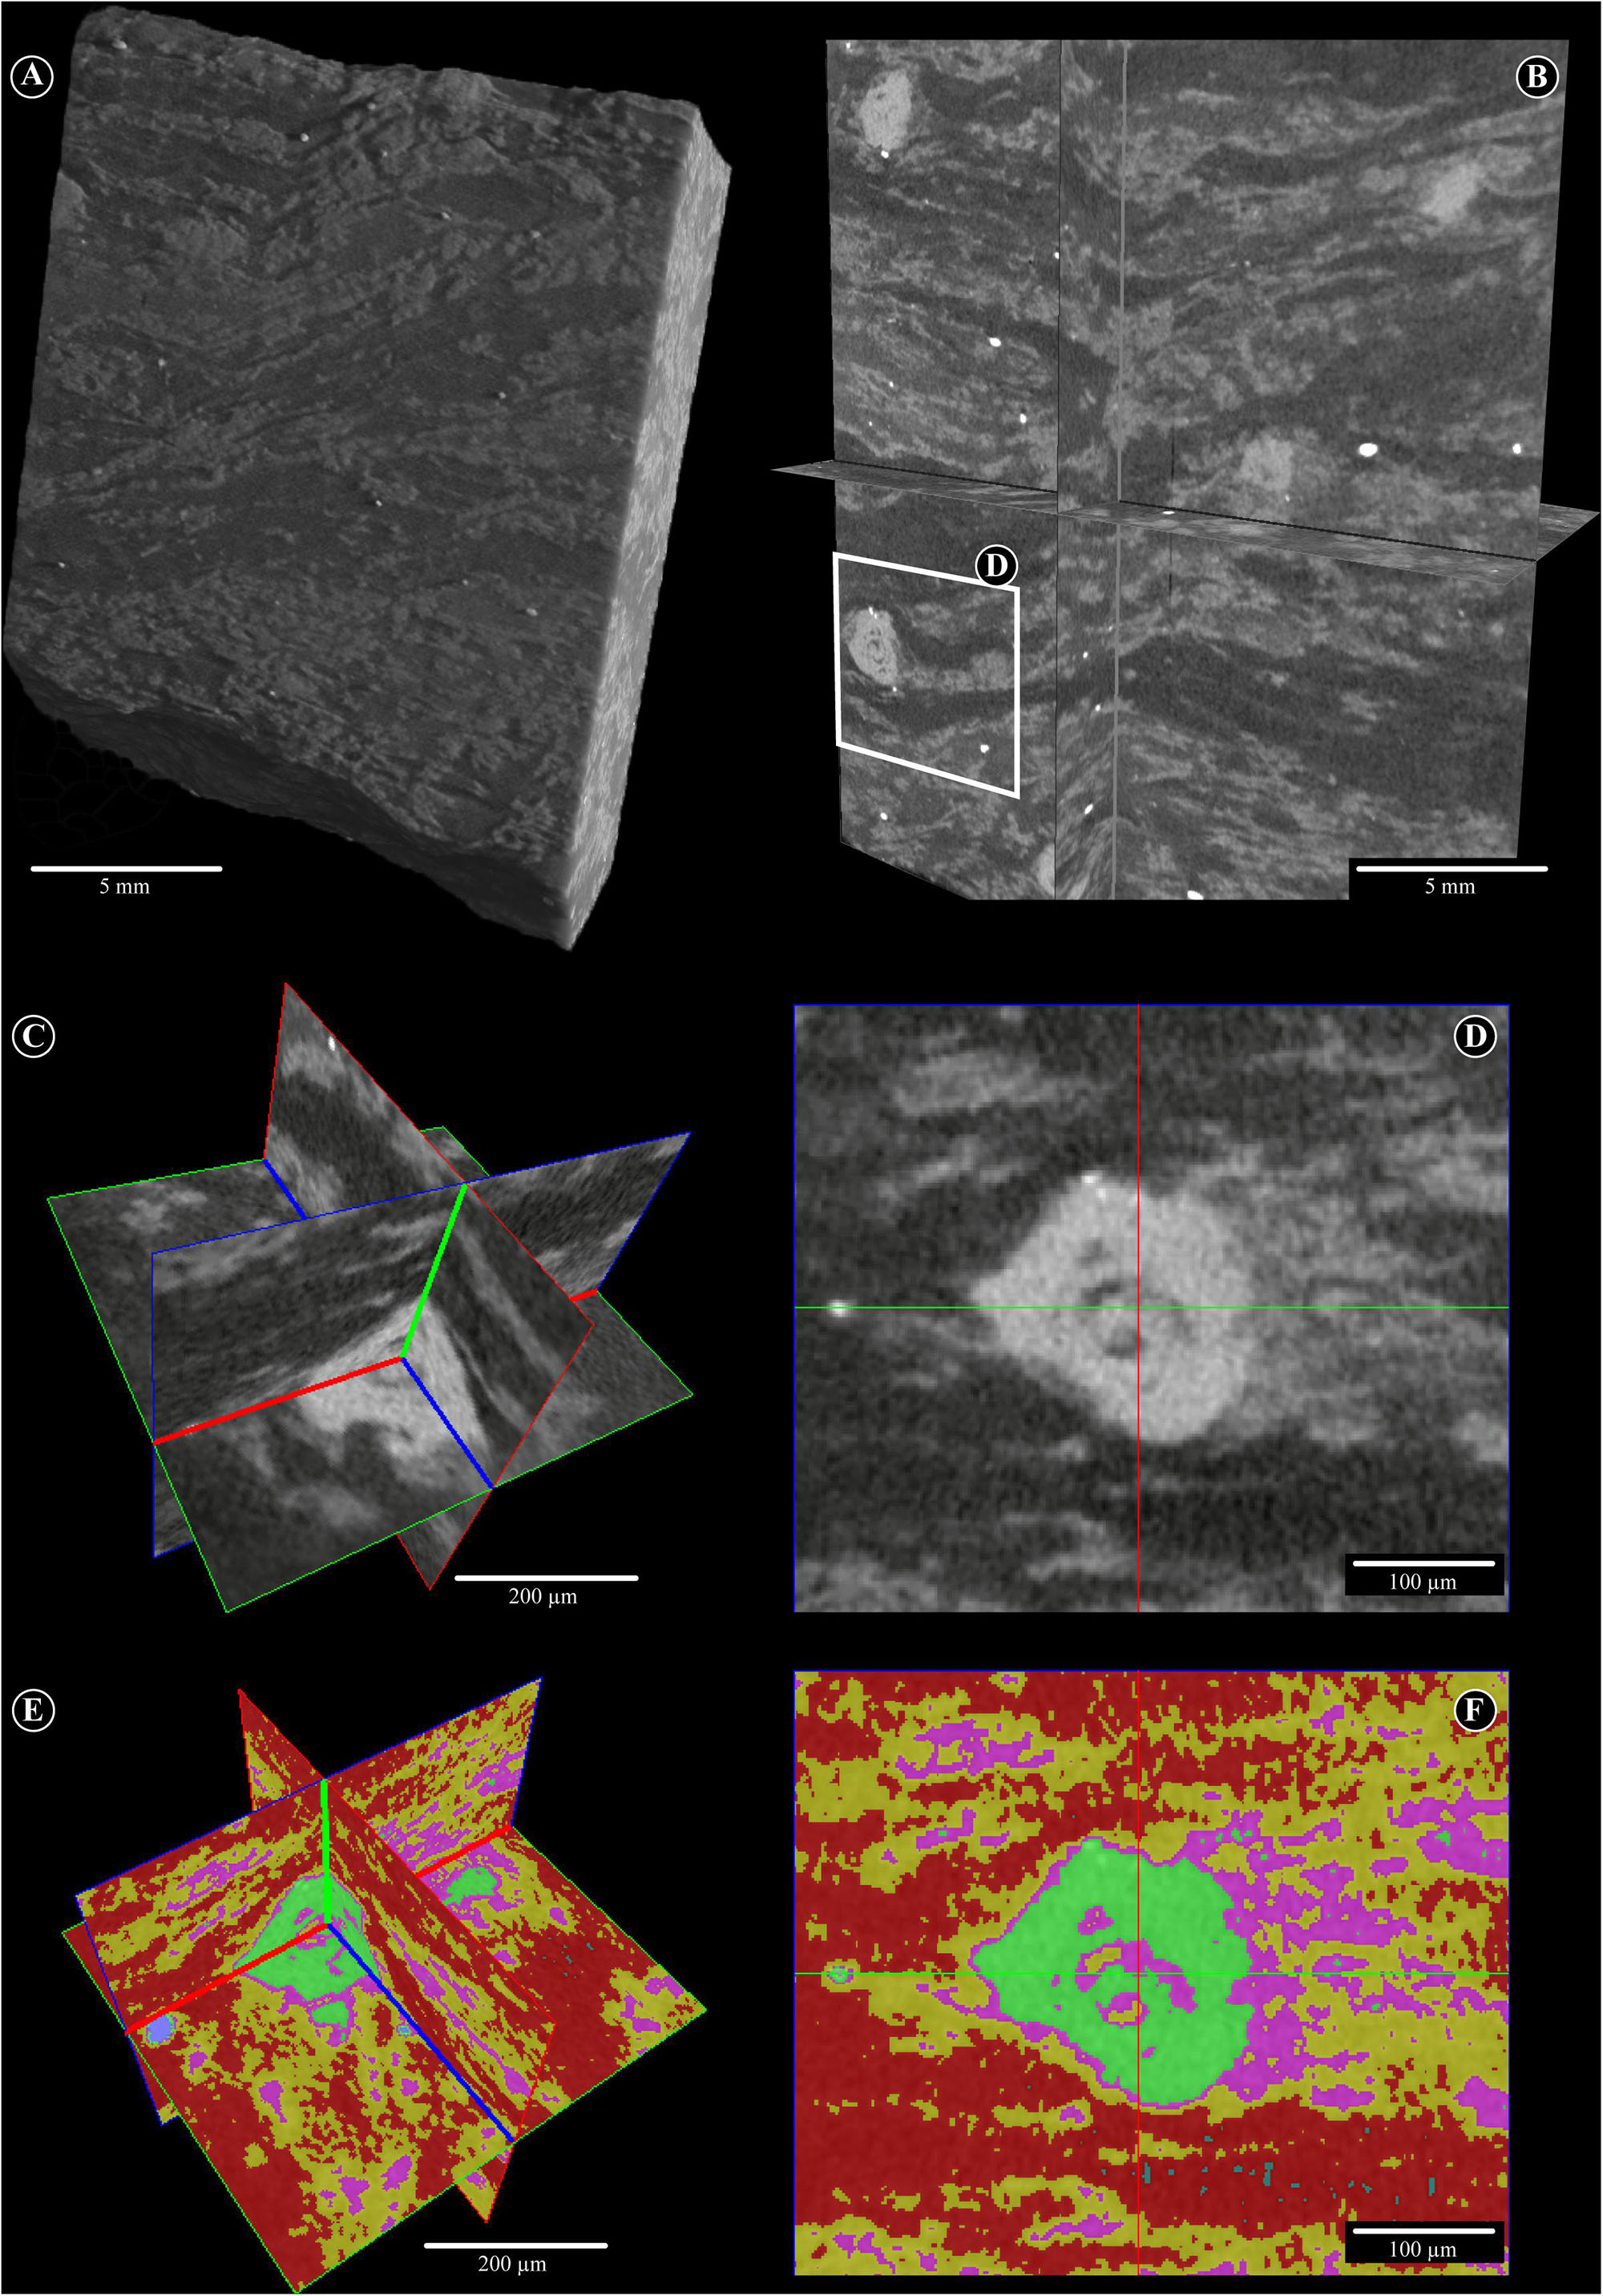
Figure 3. Segmentation procedure. (A) Volume rendering of the original VOI obtained from the X-ray microtomography experiments. (B) Visual inspection of the gray levels related to the mineral phases. The sub-volume used as a target for the segmentation is located (white rectangle). Visual inspection of the gray levels related to the mineral phases within the (C) sub-volume and along (D) XZ plane. 3D Marked-Watershed segmentation procedure for the target (E) sub-volume and along (F) XZ plane.
Results
2D Chemical and Fabric Results
The first cycle of Q-XRMA allows the modal percentage of the entire thin section (98.41% classified pixels) to be calculated. The identified mineral phases are Qtz (43.04%), Cpx (23.45%), Wm (12.35%), Bt (8.99%), Ky (6.61%), Op (Ilm) (1.64%), Pl (1.38%), and Grt (0.95%) (Figure 3), which correspond to the pre-alpine Bt, Qtz, Grt, Op, Pl, and alpine Qtz, Cpx, Wm, Ky, Grt mineral associations.
Combining the mineral classification (Figure 4) with the grain size distribution (i.e., GSD output) using the Min-GSD, all grains were clustered as a function of each rock-forming mineral (Figure 4A). The procedure can distinguish 35,138 Qtz-grains, 32,030 Cpx-grains, 11,380 Wm-grains, 8,006 Ky-grains, 6,916 Bt-grains, 1,124 Op-grains, 731 Pl-grains, and 249 Grt-grains. This technique allows the quantitative estimation of the mineral orientation with respect to the pre-S1 foliation and the calculation of the mineral shape parameters (e.g., grain-size, width, length, and aspect-ratio; see Supplementary Table S1 for details). The orientation analysis shows as the pre-alpine fabric (i.e., pre-S1 foliation and S-C fabric) is the most preserved. Although the alpine metamorphic mineral association is the most diffused, the orientation analysis reveals that the forming-minerals are still organized in the pre-alpine S-C-like geometry (Figure 5). In particular, the Bt, Wm, Qtz, Ky, and Cpx grains show two orientation clusters that can be correlated to the S and C structures. The S-related includes 28–35% of grains aligned at 2–13° with respect to the pre-S1. The C-related comprising 20–23% of grains laying at 34–46° from the pre-S1 orientation. The microstructural knowledge about the different microsites and about the variation in size and in shape of every mineral species it is crucial to archive the processed mineral grains to the alpine or pre-alpine metamorphic assemblage. For example, Figure 5B shows the quantification of the Grt generations (i.e., GrtI and GrtII) in relation to their grainsize and microstructural positions.
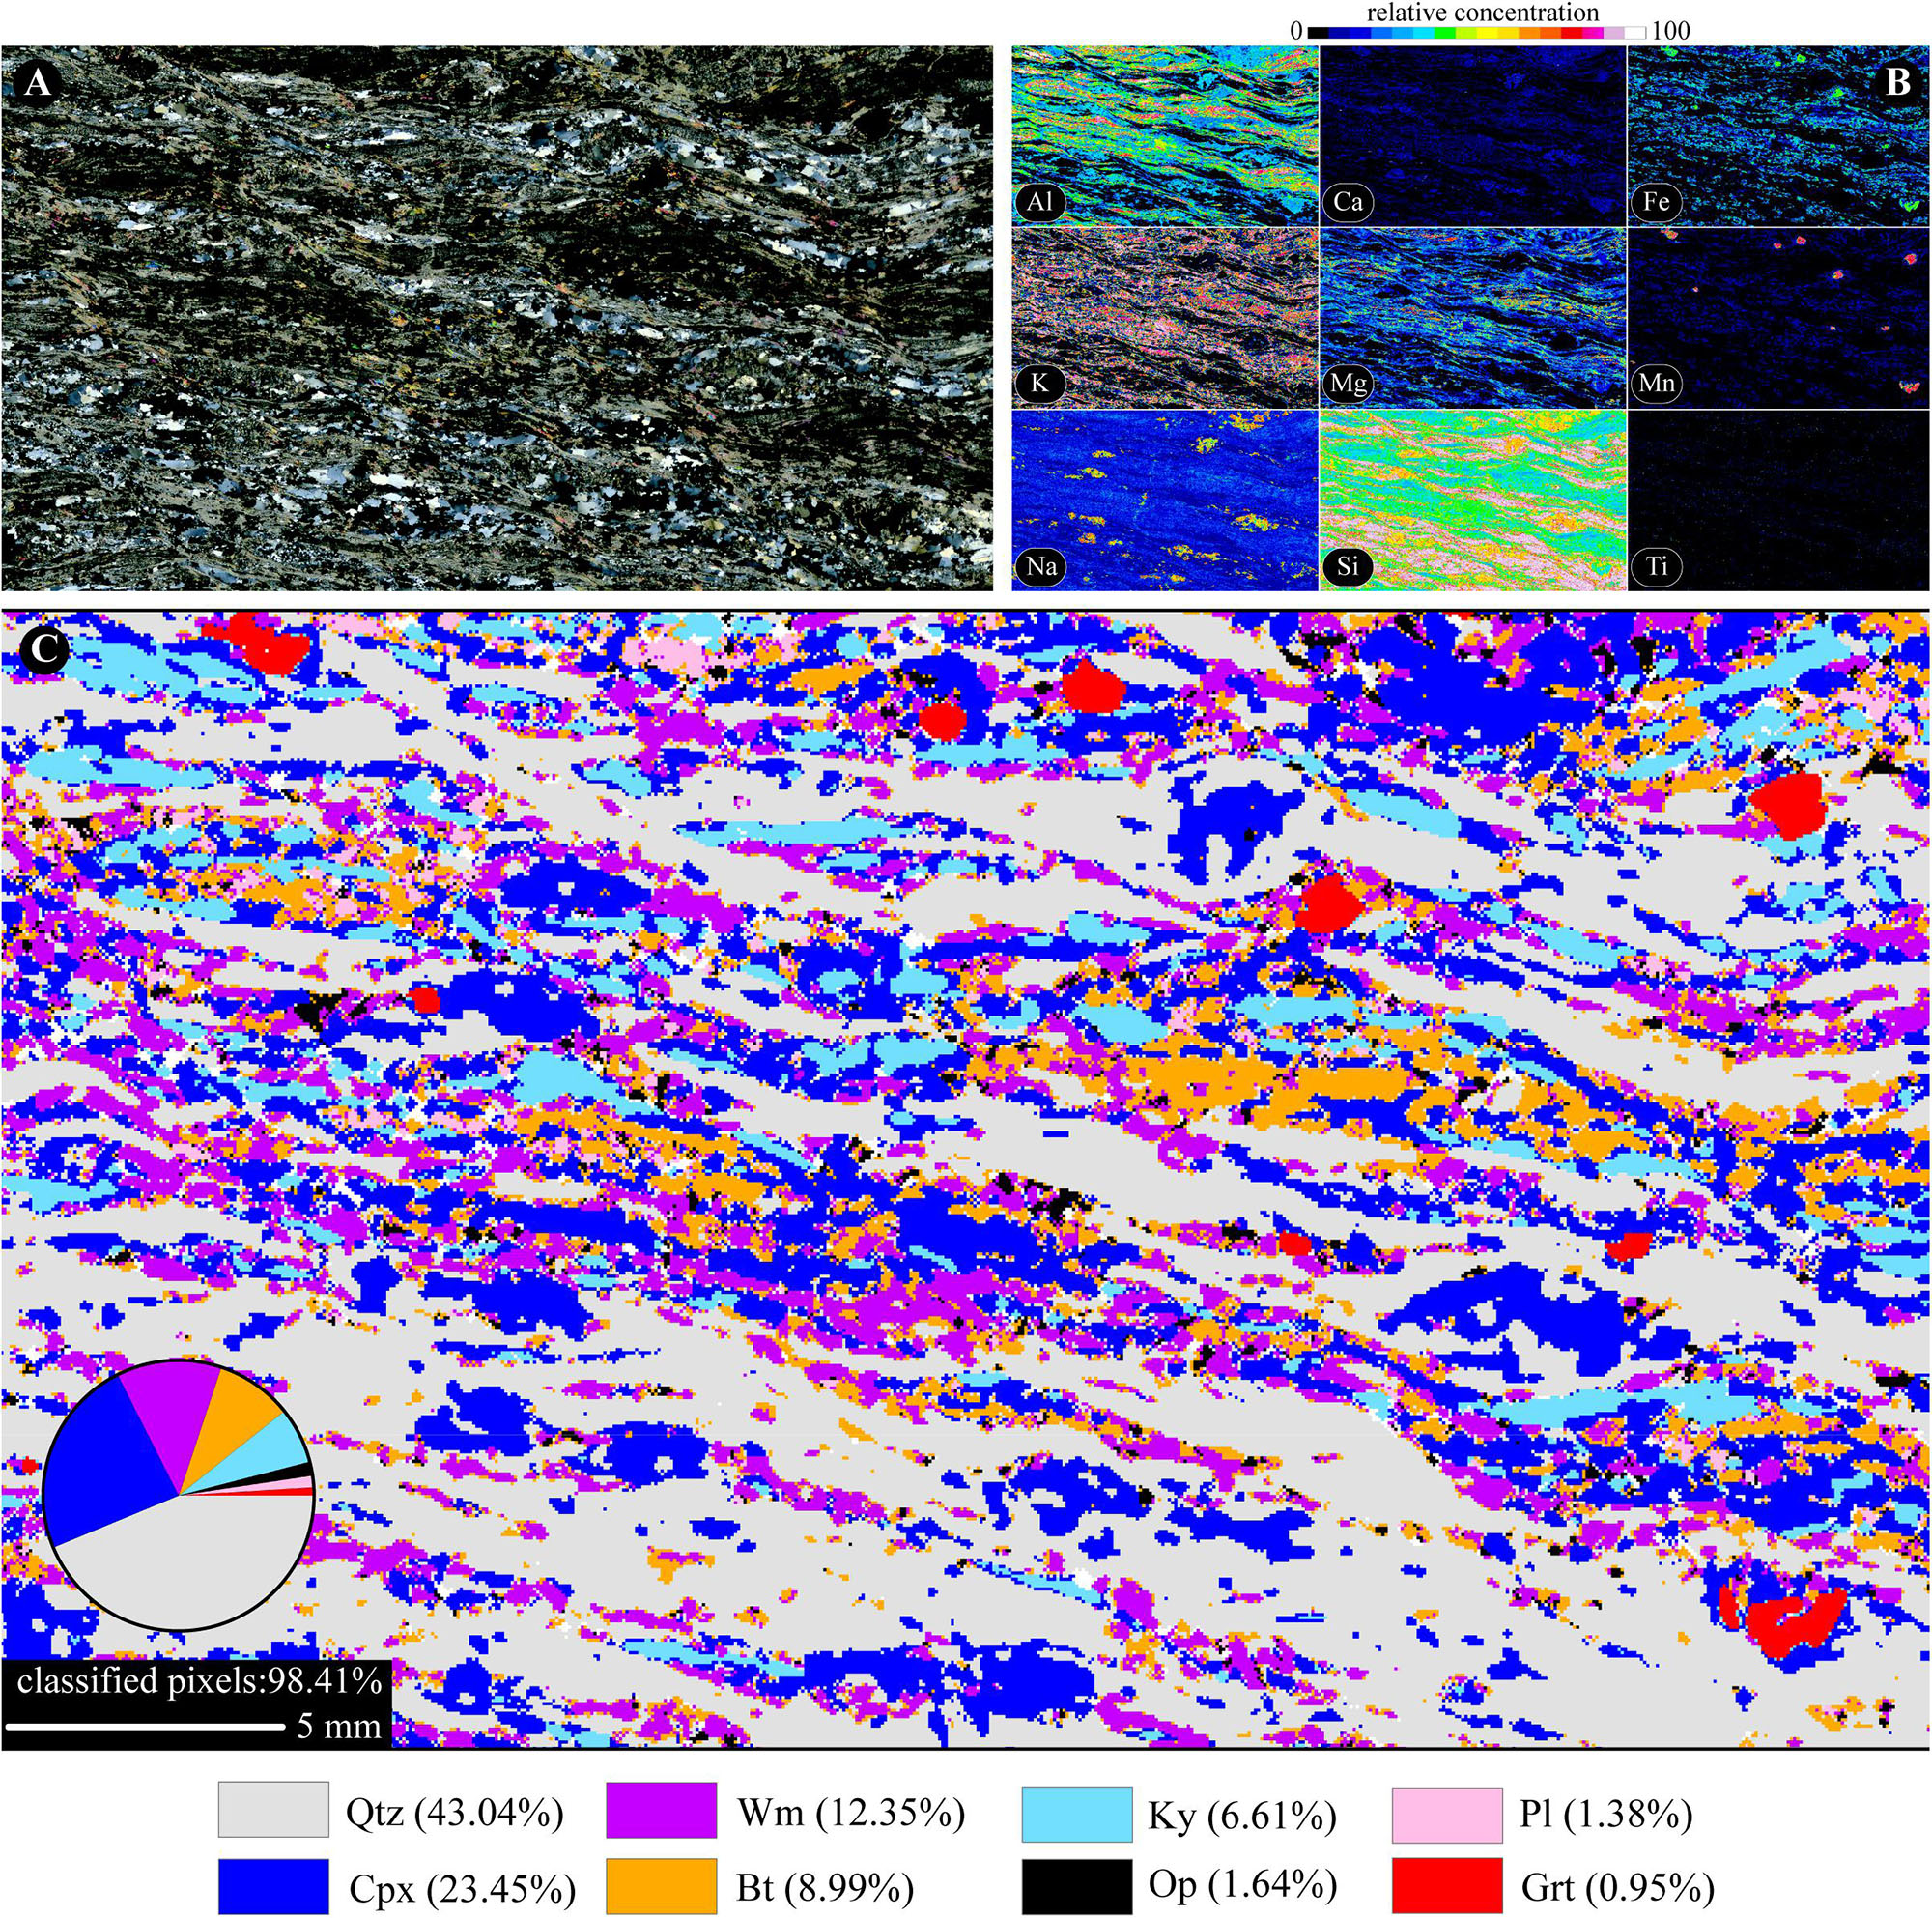
Figure 4. (A) High-resolution optical scan of entire thin section characterized by well-developed pre-S1 foliation, crossed polars. (B) X-Ray maps of entire thin section (i.e., Al, Ca, Fe, K, Mg, Mn, Na, Si, and Ti). (C) Results of Q-XRMA first cycle classification and mineral modal percentage.
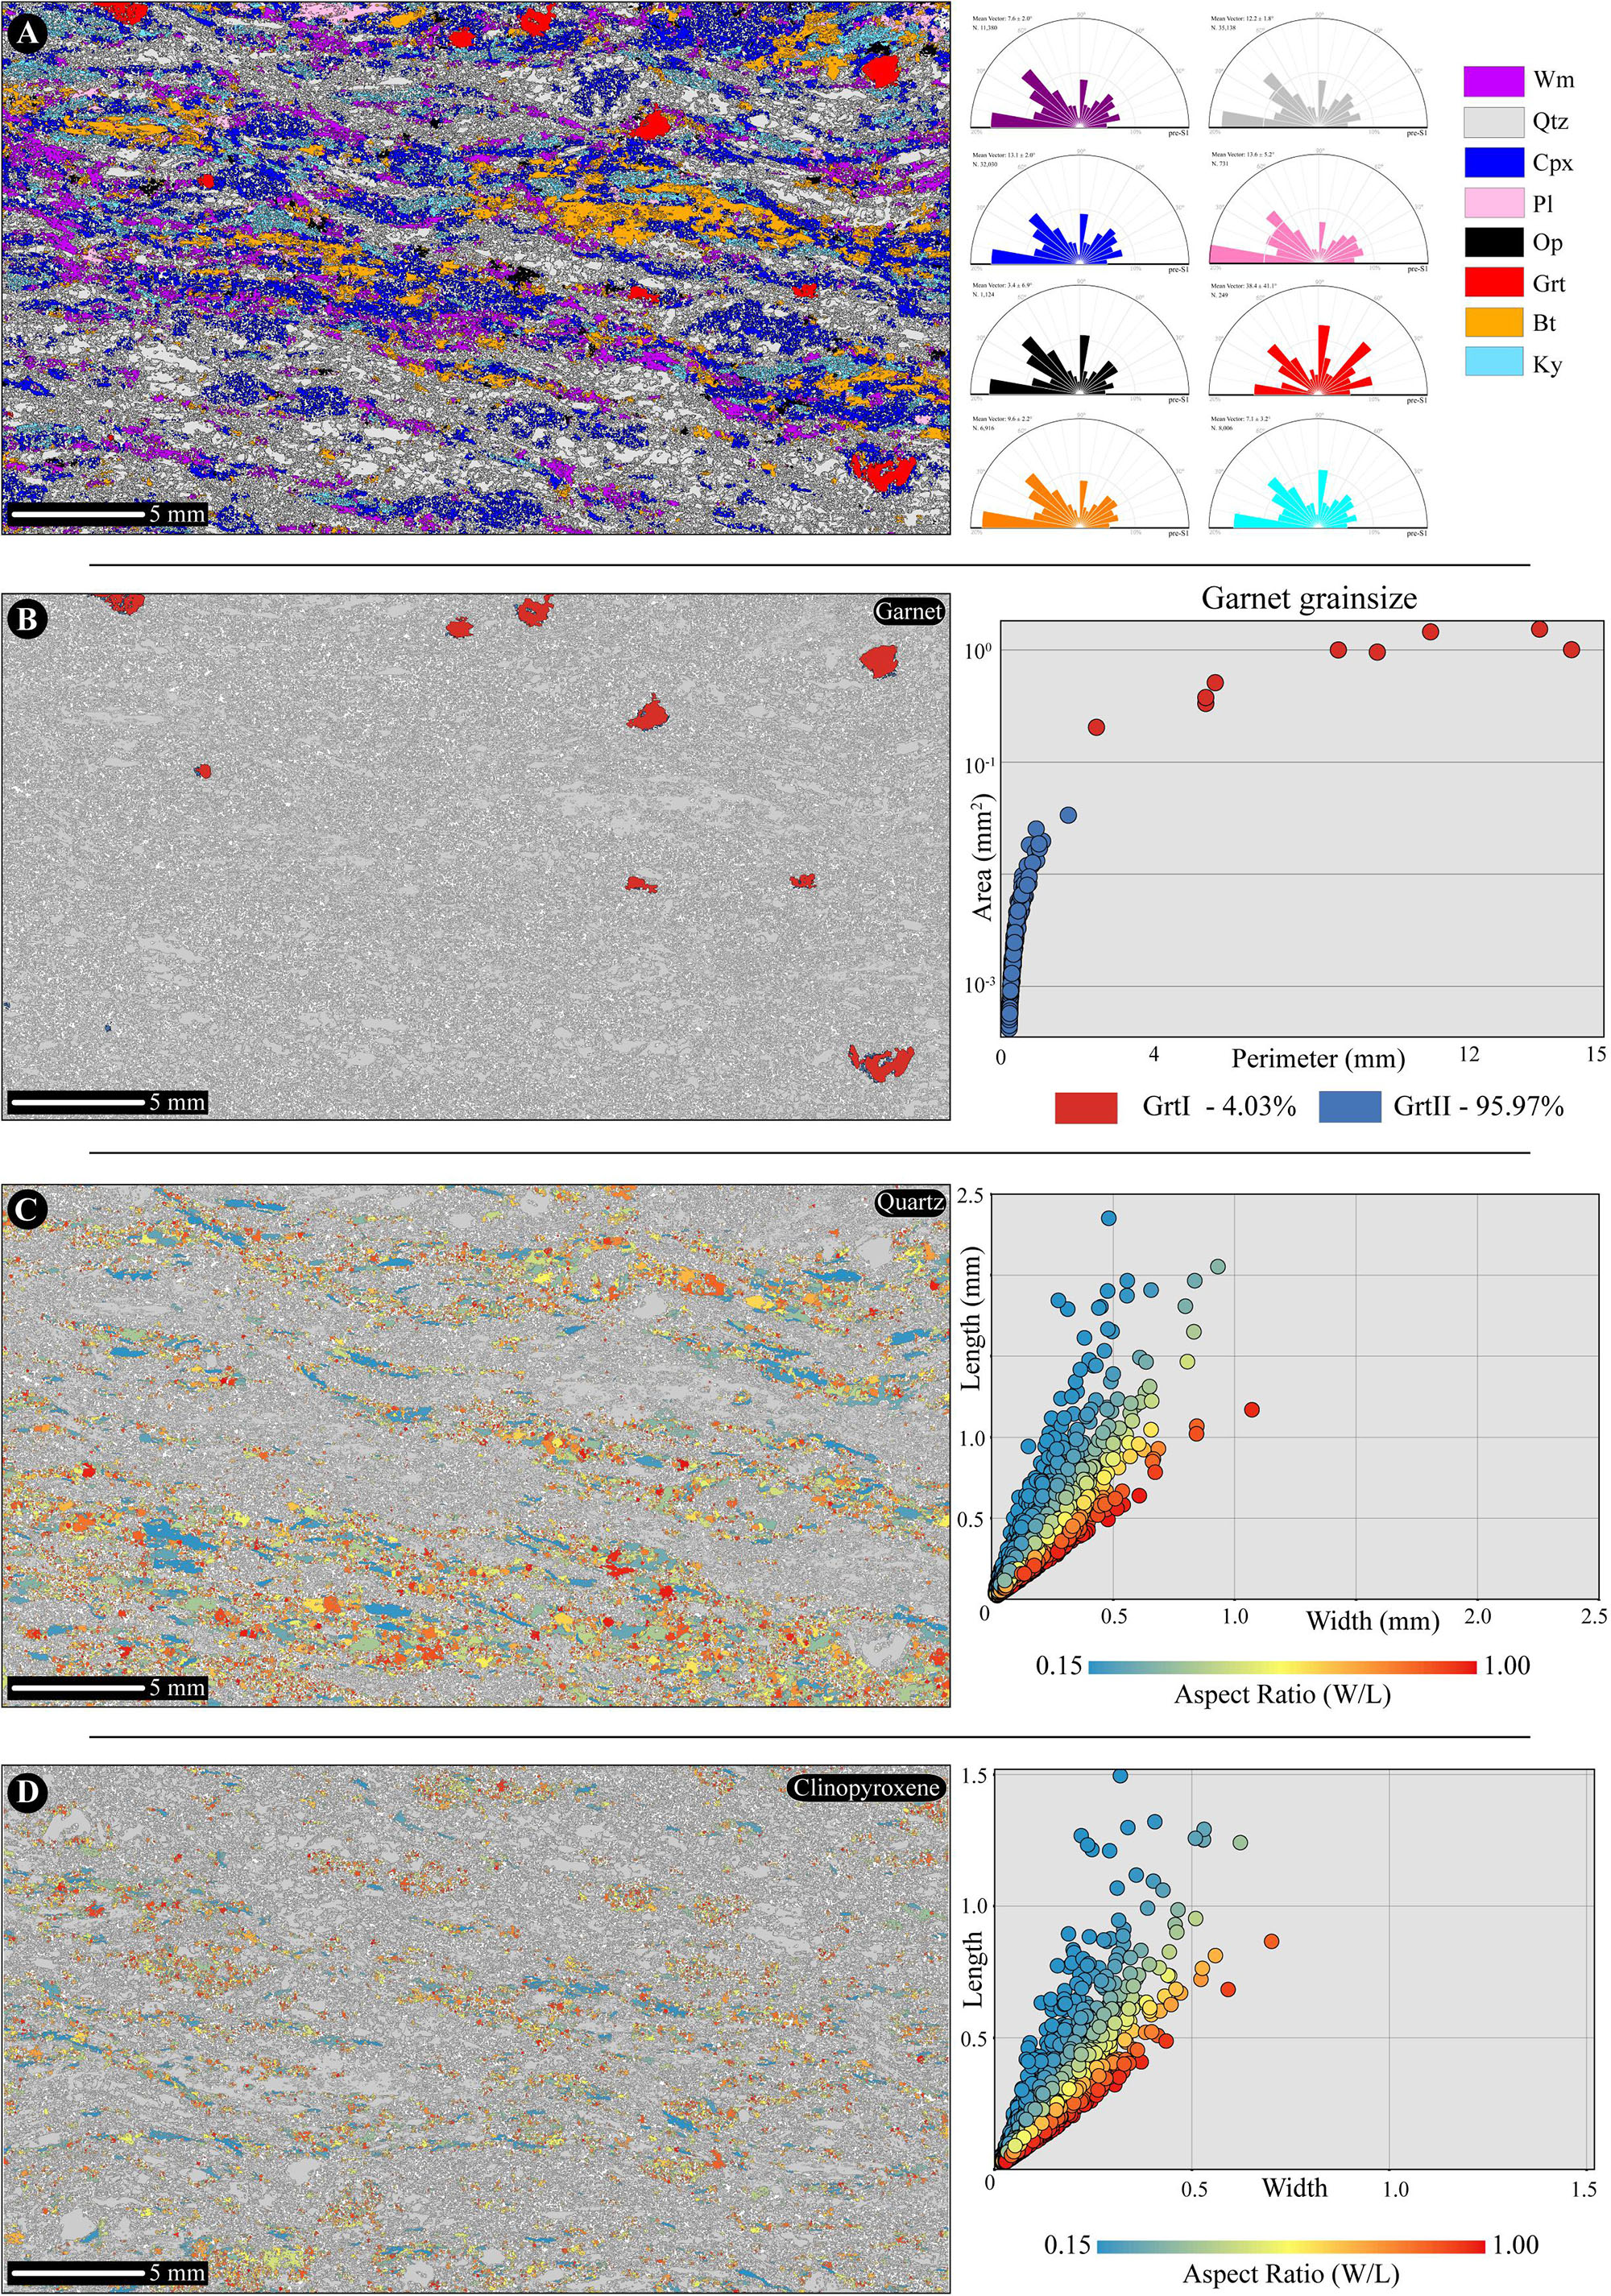
Figure 5. (A) Results of Min-GSD and grains orientation with respect to pre-S1 foliation for each mineral phase. (B) Garnet grainsize map and grainsize vs. perimeter plot. (C) Aspect Ratio map of Qtz and Length vs. Width plot for all Qtz grains. (D) Aspect Ratio map of Cpx and Length vs. Width plot for all Cpx grains.
The microstructural analysis allows to assume the 0.1 mm2 as the area-threshold value between the pre-alpine and alpine garnets and to estimate that only the 4.03% of the Grt grains refers to the pre-alpine metamorphic assemblage. Furthermore, the ArcGIS classification functions are useful to obtain 2D maps of the Aspect Ratio (AsR) for the different mineralogical species. The AsR visualization and estimation are shown for the Qtz (Figure 5C) and Cpx (Figure 5D) grains. The 60.17% of Qtz grains are characterized by the AsR equals to 0.70 ± 0.10 and the 60.80% of Cpx grains have an AsR of 0.70 ± 0.10 denoting a low degree of alpine fabric evolution at the grain-scale.
The mineral chemical variation of the pre-alpine and alpine paragenesis are quantitatively explored in the GrtI (C1; Figure 6A) and ex-Sill (C2; Figure 6B) microdomains using the Q-XRMA software. The C1 forming-minerals and their modal percentage (Figure 6C) are Grt (32.50%), Qtz (28.24%), Wm (23.68%), Cpx (12.86%), Bt (2.18%), Ky (0.11%), Ap (0.05%), and Ep (0.02%). The C2 classified minerals and their modal abundance (Figure 6D) are Wm (32.31%); Grt (18.69%), Ky (15.66%), Qtz (12.99%), Bt (9.09%), Cpx (8.71%), Pl (1.38%), Ap (0.74%), and Rt (0.05%).

Figure 6. (A) BSE image of pre-alpine Grt microdomain. (B) BSE image of pre-alpine Sill microdomain. (C) Results of Q-XRMA first cycle classification and mineral modal percentage for pre-alpine Grt microdomain. (D) Results of Q-XRMA first cycle classification and mineral modal percentage for pre-alpine Sill microdomain.
Garnet and clinopyroxene were selected due to their chemical composition distribution and as target minerals to highlight pre-alpine and alpine metamorphic evolution, respectively. With the aim of highlighting the maximum range of compositional variability in the selected zoned garnet porphyroblast and the garnet coronae, 35 spot analyses (Supplementary Table S2) were acquired in both the chosen microdomains.
For each calculated pixel, the stoichiometry is in agreement with the structural formula of garnet [i.e., X3Y2(ZO4)3]. In the same manner, X-Ray maps of clinopyroxene were calibrated using 20 spot analyses (Supplementary Table S3) of different grains to highlight and quantify mineral chemical variations in relation to which pre-alpine microsite they replaced. The sum of cations is coherent with the structural formula of clinopyroxene (i.e., XYZ2O6).
Figure 7 shows the modal percentage of the Grt and Cpx sub-phase within the C1 microdomain and their calibrated chemical composition. The results of the calibration process for Grt divalent cations (Figure 7A; i.e., Ca, Fe, Mg, and Mn) highlight four distinct Grt sub-phases. The pre-alpine GrtI covers the 51% of the C1-garnets and it is characterized by high Fe content (2.31 ± 0.04 a.p.f.u.), the higher Mn content (0.23 ± 0.03 a.p.f.u.), Mg content of 0.37 ± 0.03 a.p.f.u., and the lowest Ca content (0.10 ± 0.05 a.p.f.u.). The three-type of alpine Grt show a wider chemical variability in depends on the microstructural location. Higher Ca content (i.e., maximum value of 1.23 a.p.f.u.) is observed where GrtII developed in contact with Cpx. Toward the pre-alpine biotite, GrtII is characterized by a continuous decrease of Mn and Fe contents and a corresponding increase of Mg and Ca contents. The GrtII grown in the pre-alpine Sill microdomain increase their Mg and Fe contents up to 0.89 and 1.91 a.p.f.u., respectively.

Figure 7. Results of second cycle of Q-XRMA procedure for pre-alpine Grt microdomain. (A) Grt sub-phases classification and their modal percentage. Calibration maps of Ca, Fe, Mg, and Mn contents in Grt. (B) Cpx sub-phases classification and their modal percentage. Calibration maps of Ca, Fe, Mg, and Na contents in Cpx.
This mineral chemical variability was probably caused by differential diffusive exchange of the divalent cations in relation with pre-alpine microdomains replaced. Cpx replacing pre-alpine plagioclase microdomains (e.g., CpxI) displays two chemical trends. Figure 7B shows these trends by the calibrated maps of Ca, Fe, Mg, and Na, occupying the X and Y site in CpxI. They show higher Na content (0.89 ± 0.07 a.p.f.u.) in CpxI grown with Qtz than Cpx grown close to pre-alpine Grt porphyroblasts.
Figure 8 shows the modal percentage of the Grt and Cpx sub-phase within the C1 microdomain and their calibrated chemical composition. The calibrated elemental maps of the Grt show a continuous Ca content enrichment and Mg and Fe contents depletion from the pre-alpine Sill and Bt to the Pl microdomains (Figure 8A). In details, the Grt IIc is characterized by the highest Mg content (0.61 ± 0.13 a.p.f.u.) and the lowest Ca content (0.05 ± 0.03 a.p.f.u.). The Ca content reaches the maximum values of 0.68 a.p.f.u. and minimum Fe content (i.e., 1.86 a.p.f.u.) at the contact with the ex-Pl microdomains which is replace by the Cpx and Qtz assemblage during the alpine metamorphic evolution.
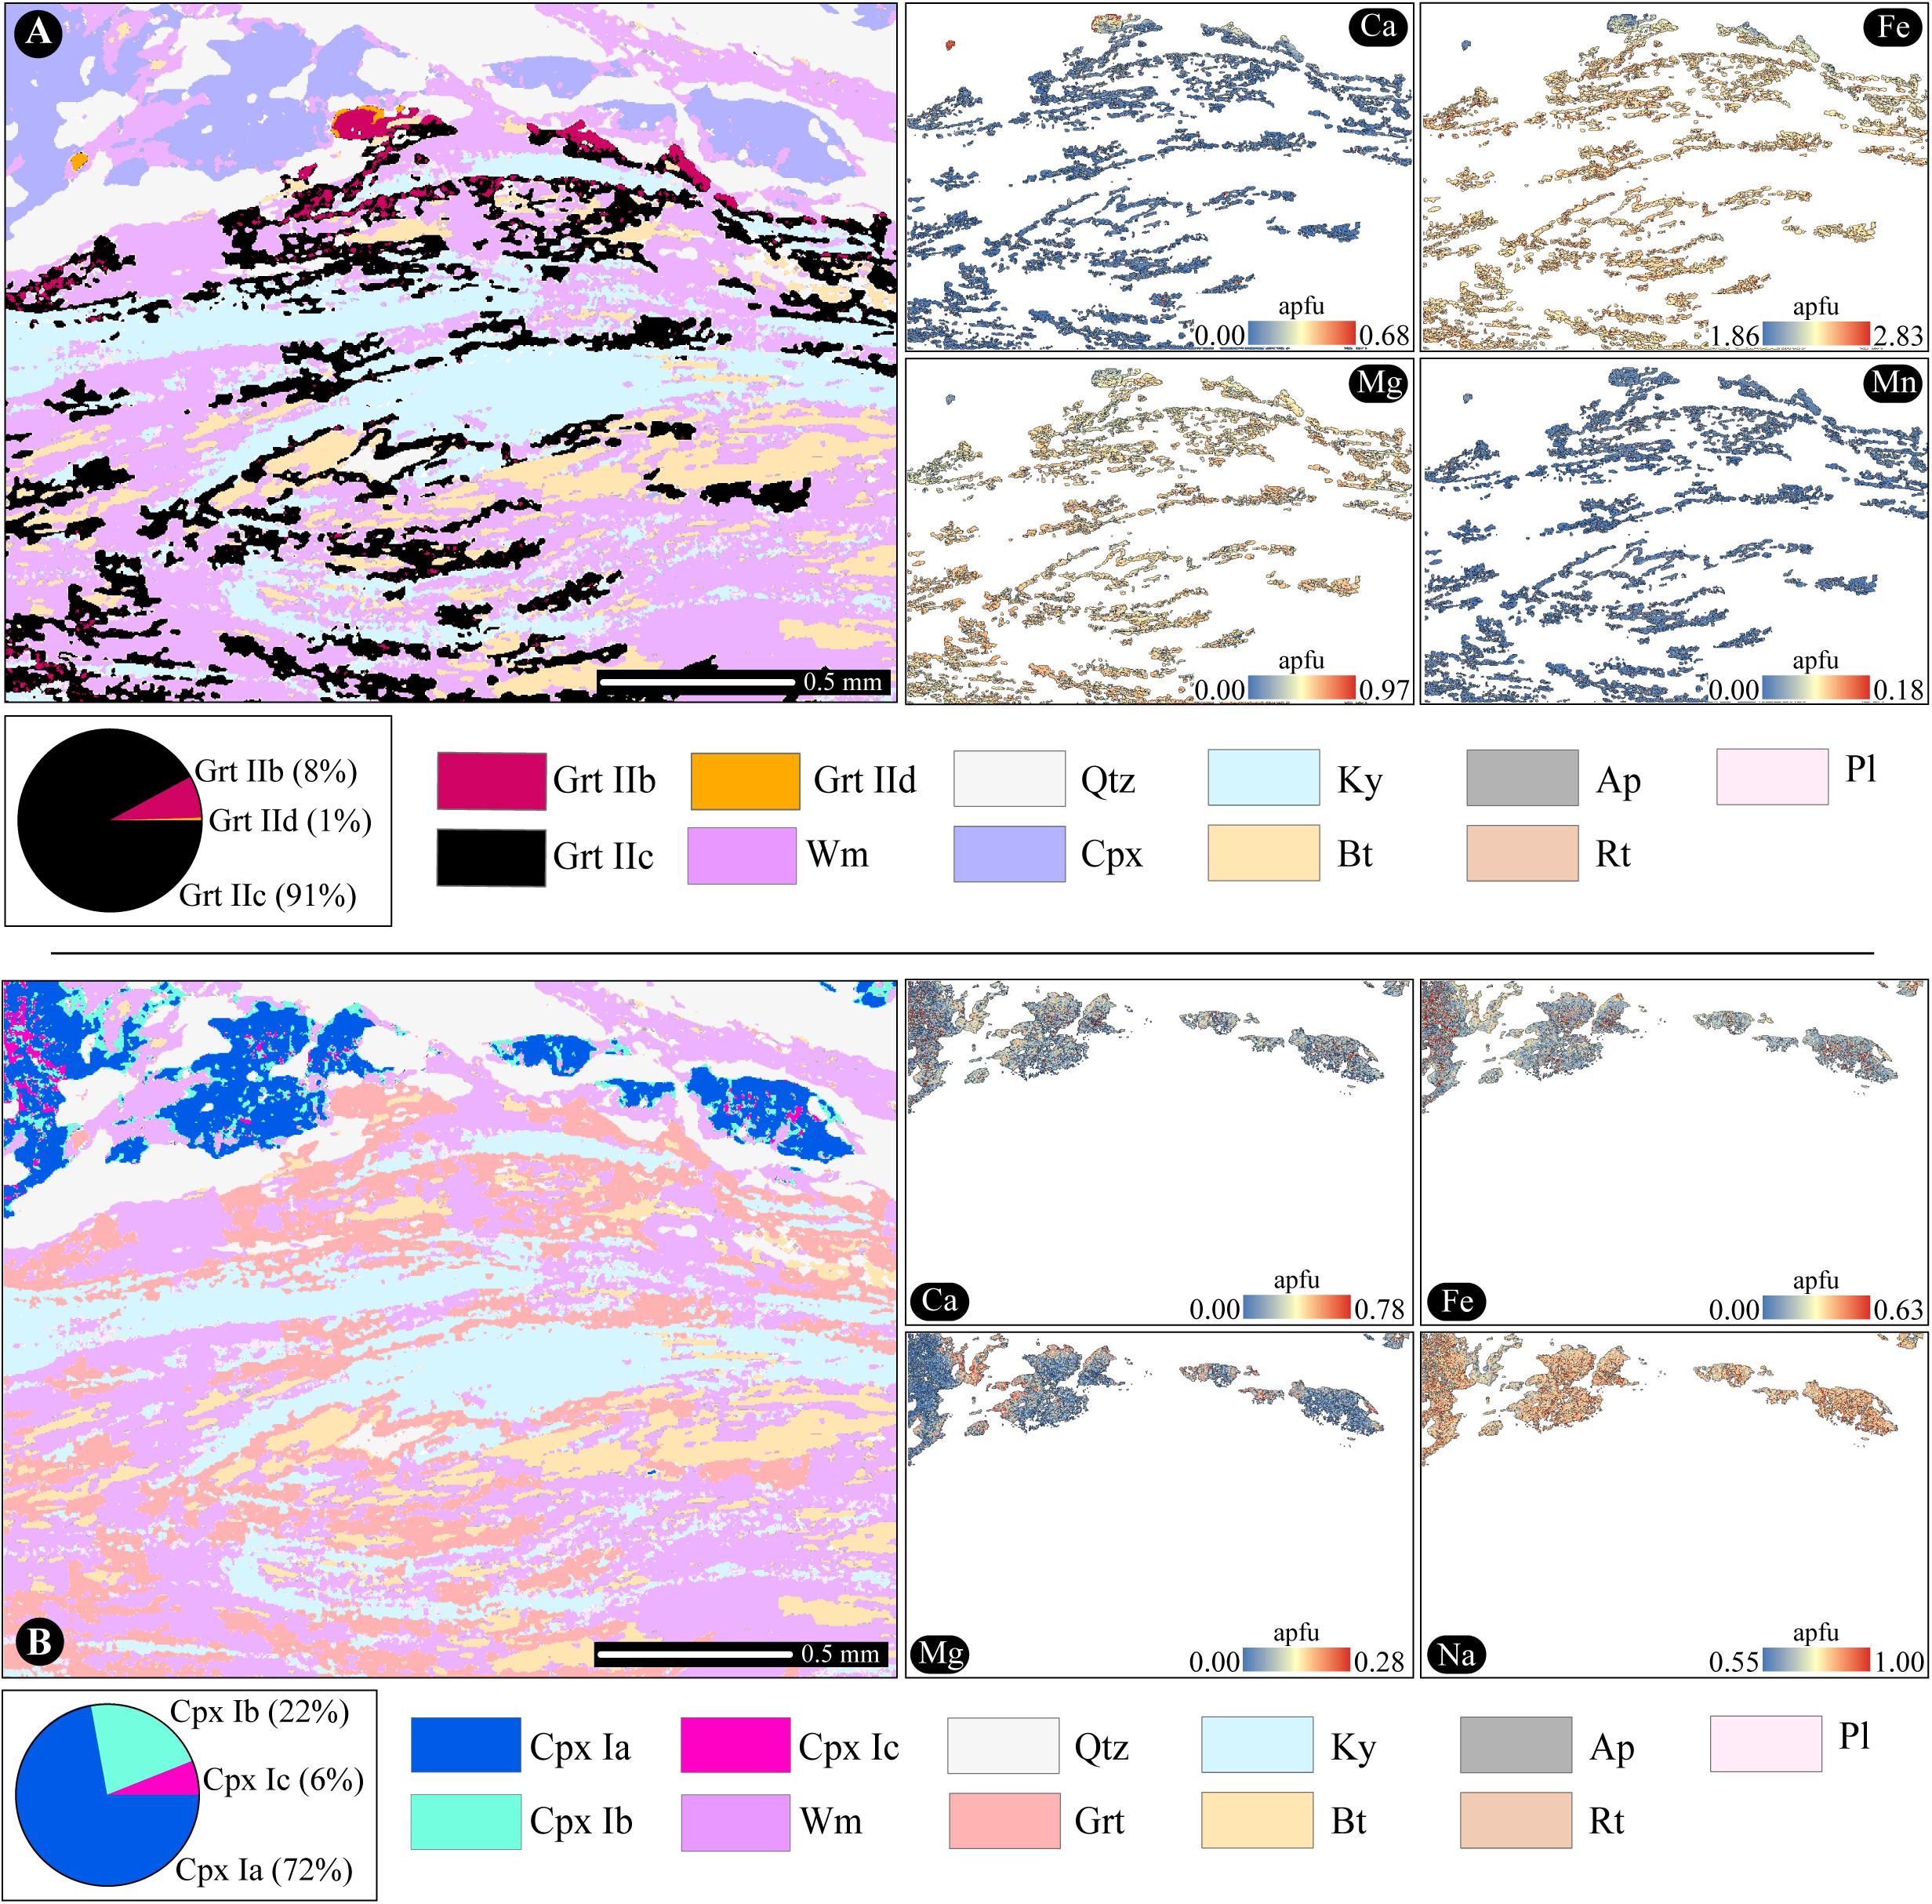
Figure 8. Results of second cycle of Q-XRMA procedure for pre-alpine Sill microdomain. (A) Grt sub-phases classification and their modal percentage. Calibration maps of Ca, Fe, Mg, and Mn contents in Grt. (B) Cpx sub-phases classification and their modal percentage. Calibration maps of Ca, Fe, Mg, and Na contents in Cpx.
The results of the calibration process for Cpx (Figure 8B; Ca, Fe, Mg, and Mn) highlight three sub-phases. Cpx Ia are characterized by the higher Na content (0.91 ± 0.07 a.p.f.u.) than the Cpx Ib (0.68 ± 0.05 a.p.f.u.) and the Cpx Ic (0.57 ± 0.04 a.p.f.u.). The Fe content of 0.61 ± 0.02 a.p.f.u., the Ca content of 0.69 ± 0.06 a.p.f.u., and the absence of Mg content distinguish the Cpx Ic, whereas the Mg enrichment up to 0.28 a.p.f.u. discriminate the Cpx Ib. The third analytical cycle of Q-XRMA allow to obtain for C1 microdomain (Figure 9A) the end-member maps of Grt (Figure 9B; almandine, grossular, pyrope, and spessartine) and the end-member maps of Cpx (Figure 9C; diopside, hedenbergite, and jadeite) which were also used to extract chemical profiles (Figure 9D) from the calibrated outputs.
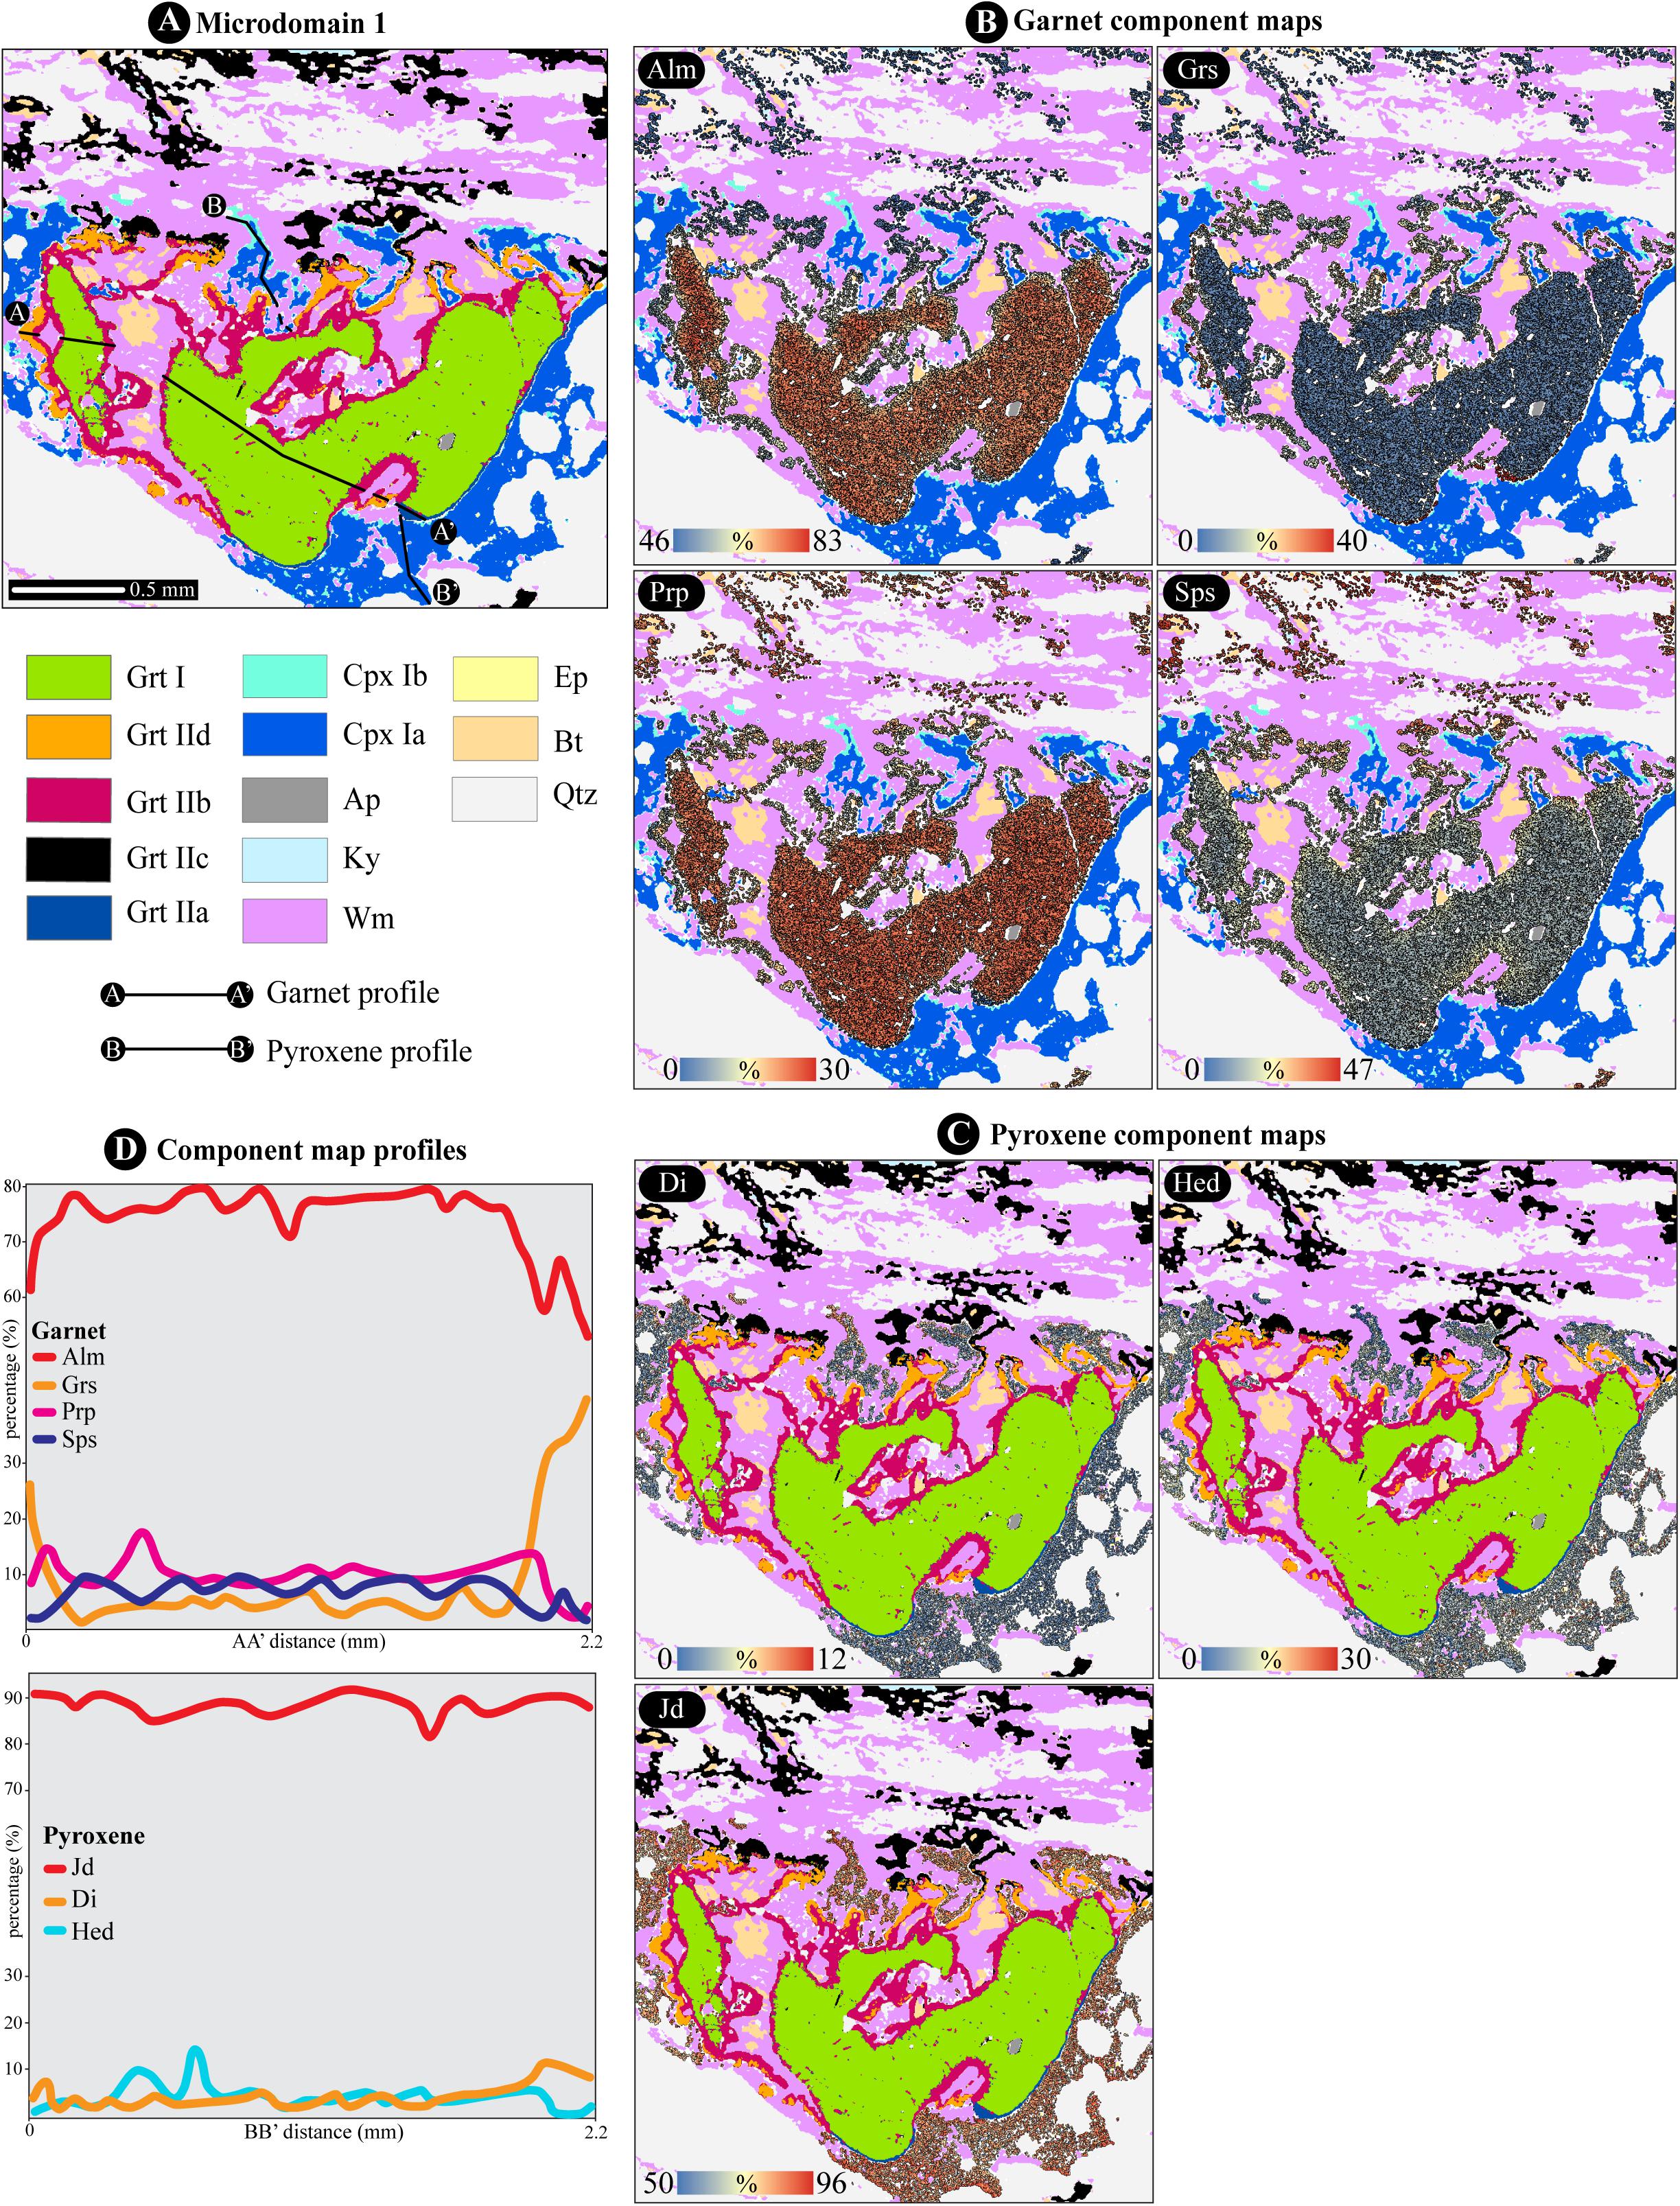
Figure 9. (A) Results of third cycle of Q-XRMA for pre-alpine Grt microdomain and localization of chemical profiles. (B) Component maps for Grt (i.e., Alm, almandine; Grs, grossular; Prp, pyrope; Sps, spessartine). (C) Component maps for Cpx (i.e., Di, diopside; Hed, hedenbergite; Jd, jadeite). (D) Component profiles for Grt and Cpx.
The GrtI is high in almandine content and low in the other three endmembers ranging from Alm83Grs0Prp11Sps6 to Alm73Grs5Prp13Sps9. The Grt IIa is characterized by a sharp discontinuity defined by a steep increase in grossular content and simultaneous depletion in almandine content, clearly visible in the compositional profile of Figure 9D. Toward the ex-Pl microdomain, the Grt IIa compositions vary from Alm56Grs31Prp11Sps2 to Alm50Grs40Prp4Sps6. The Grt IIb and Grt IId consist in a continuous corona around Grt I and Bt grains and they are generally characterized by gradual decrease in Alm content and increase in Prp and in Grs contents, respectively. Grt IIb developed toward Grt I and Bt grains exhibiting an average composition of Alm59Grs9Prp24Sps8. Whereas, Grt IId growth between the Grt I and the pre-alpine Sill microdomains shows an end-member composition of Alm53Grs30Prp11Sps6. The Grt IIc is developed outside of Grt I microdomain showing a gradual reduction of almandine and grossular components and enrichment in Prp and Sps contents toward pre-alpine Sill microdomain. The composition ranging from Alm47Grs2Prp30Sps21 to Alm46Grs2Prp5Sps47. The clinopyroxene phase mostly consists in jadeite component ranging from 50 to 96%. When Cpx is developed in contact with garnet shows a Jd contents up to 78% with an average value of 93%. Toward pre-alpine Sill microdomain, the Cpx is characterized by low content in Jd and corresponding enrichment in Hed and Di end-members up to 30 and 12%, respectively.
The end-member components variation for garnet and clinopyroxene within the C2 microdomain (Figure 10A) has been explored through the Q-XRMA third cycle. The garnet component maps (Figure 10B) and chemical profile (Figure 10D) highlight a gradual enrichment in grossular and depletion in almandine and pyrope from Grt IIc (average composition: Alm70Grs0Prp29Sps1) to Grt IIb (average composition: Alm66Grs9Prp23Sps2).
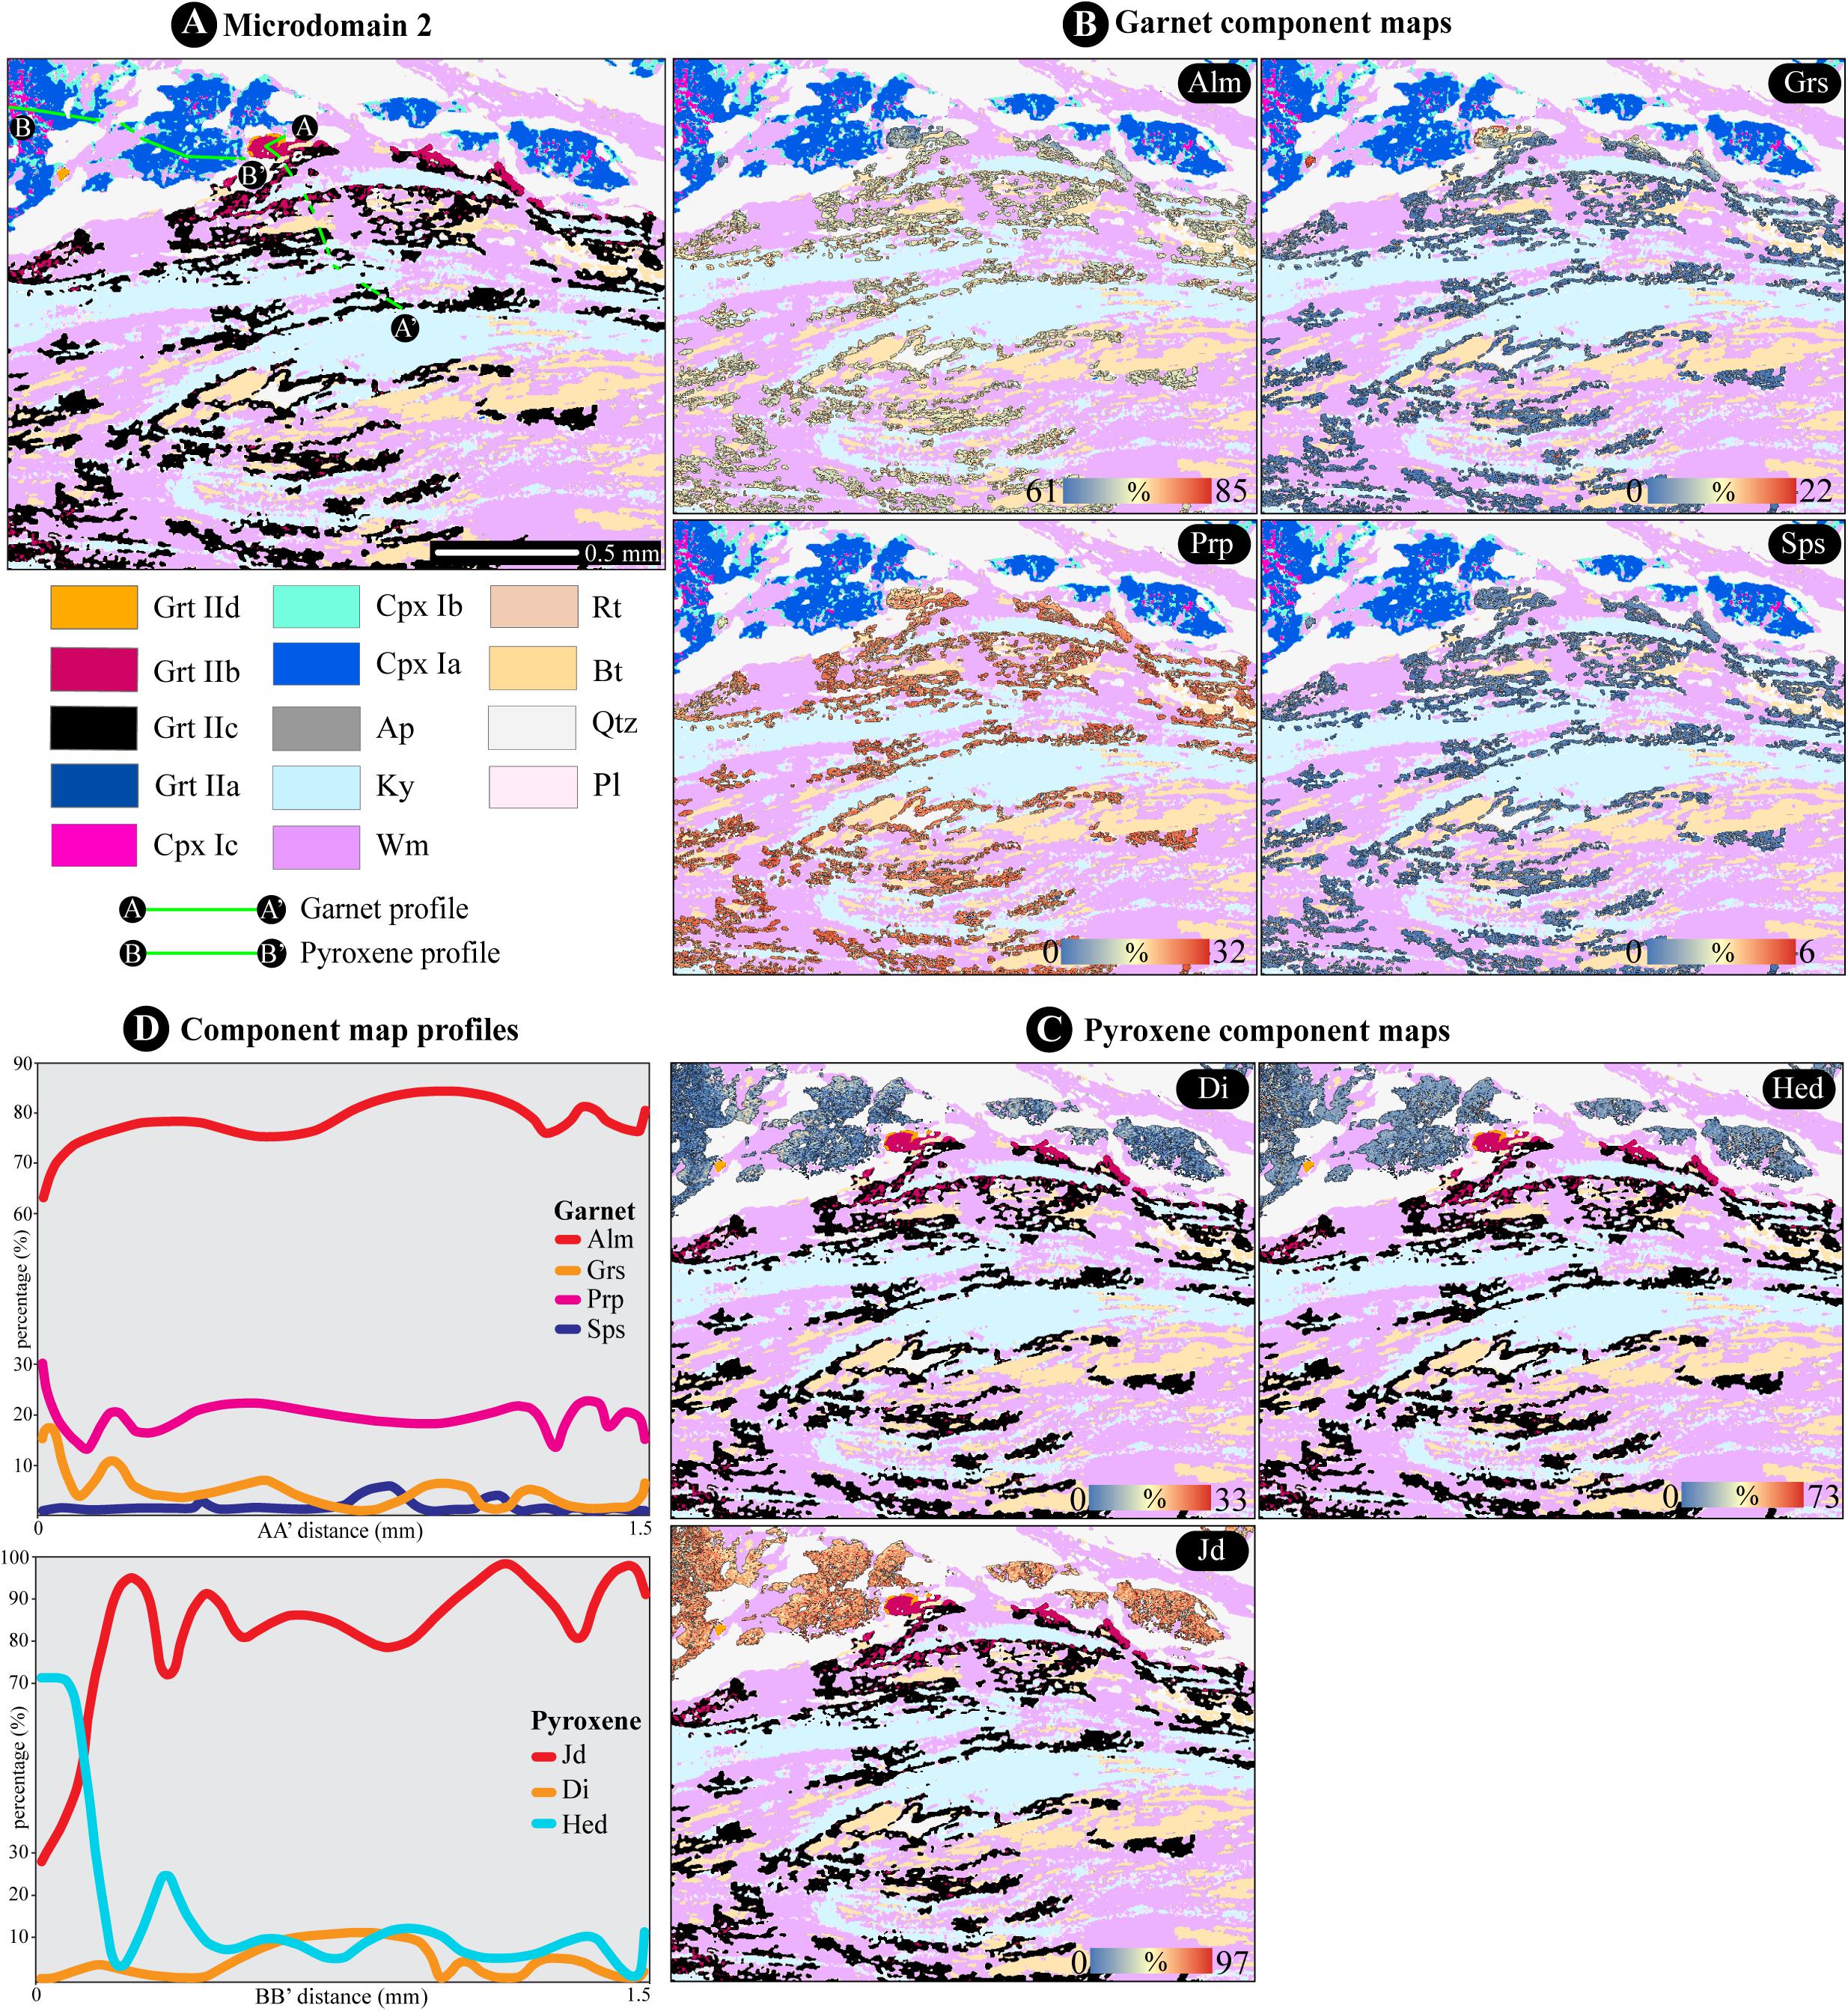
Figure 10. (A) Results of third cycle of Q-XRMA for pre-alpine Sill microdomain and localization of chemical profiles. (B) Component maps for Grt (i.e., Alm, almandine; Grs, grossular; Prp, pyrope; Sps, spessartine). (C) Component maps for Cpx (i.e., Di, diopside; Hed, hedenbergite; Jd, jadeite). (D) Component profiles for Grt and Cpx.
Grt IId developed in contact with clinopyroxene and quartz assemblage and it is characterized by a sharp discontinuity defined by a steep increase in grossular and simultaneous decrease in almandine and pyrope contents. The Grt IId component composition varies from Alm63Grs18Prp18Sps1 to Alm61Grs22Prp15Sps2.
The assemblage consists of clinopyroxene plus quartz developed within the pre-alpine Pl-microdomains. Although the clinopyroxene is generally high in jadeite composition, the component maps (Figure 10C) show a composition variability related to the distance from the pre-alpine biotite and alpine garnet. Cpx Ia is characterized by a gradual increase of Jd content from 82% at the core to 97% at the rim in contact with Grt IId. Cpx Ib develop in contact with white-mica and it is characterized by a Di content of 33%, whereas Cpx Ic shows a sharp discontinuity defined by a steep increase of Hed up to 73% and simultaneous depletion in Jd content (i.e., minimum value of 27%), clearly visible in the compositional profile of Figure 10D.
3D Fabric and Metamorphic Results
The X-ray μ-CT data can be segmented into six components. The brightest regions in the images have been attributed to opaque and garnet, followed by the clinopyroxene-kyanite-micas (i.e., biotite and white mica) aggregates, and the darkest layers to quartz. Figure 11A shows the volume rendering of the segmented phases and the volumetric quantification of each phase processed with the PerGeos software. The segmentation of the Qtz volume (Figure 11B) allows to observe how the pre-alpine S-C-like geometry is well-preserved and the pervasive mylonitic fabric is overprinted by static alpine re-equilibration. By combining mineral phase segmentation based on gray-scale threshold with the characterization of microstructures (i.e., different grain-size classes for the same phase and morphology of different pre-alpine microdomains) allowed to distinguish the pre-alpine mineralogical phases from the alpine overprint and to quantify their ratio (Supplementary Table S4). For instance, the volume rendering of the specimen with 127,073 highlighted garnets (Figure 11C) and the garnet grainsize analysis (Figure 11D) clearly display two distinct classes (Supplementary Table S5). The Grt I is characterized by a volume of 108 μm3 and a more marked anhedral morphology than Grt II, as can be visualized by high pseudo-grain surface (Figure 11D). Using this approach for each segmented mineralogical phase permits to quantify the volume of pre-alpine assemblage (Grt I + Wm I + Bt I) and the alpine overprints. The volumetric analysis shows that the pre-alpine-related phases represent 21.91% of the volume (Figure 11A) and mostly consist in Bt I and Wm I. The alpine-related phases, comprising the 78.09% of the volume, involve Wm II/Bt II (41.73%), Qtz (30.46%), Cpx (3.86%), Ky (2.04%), and Grt II (0.01%).
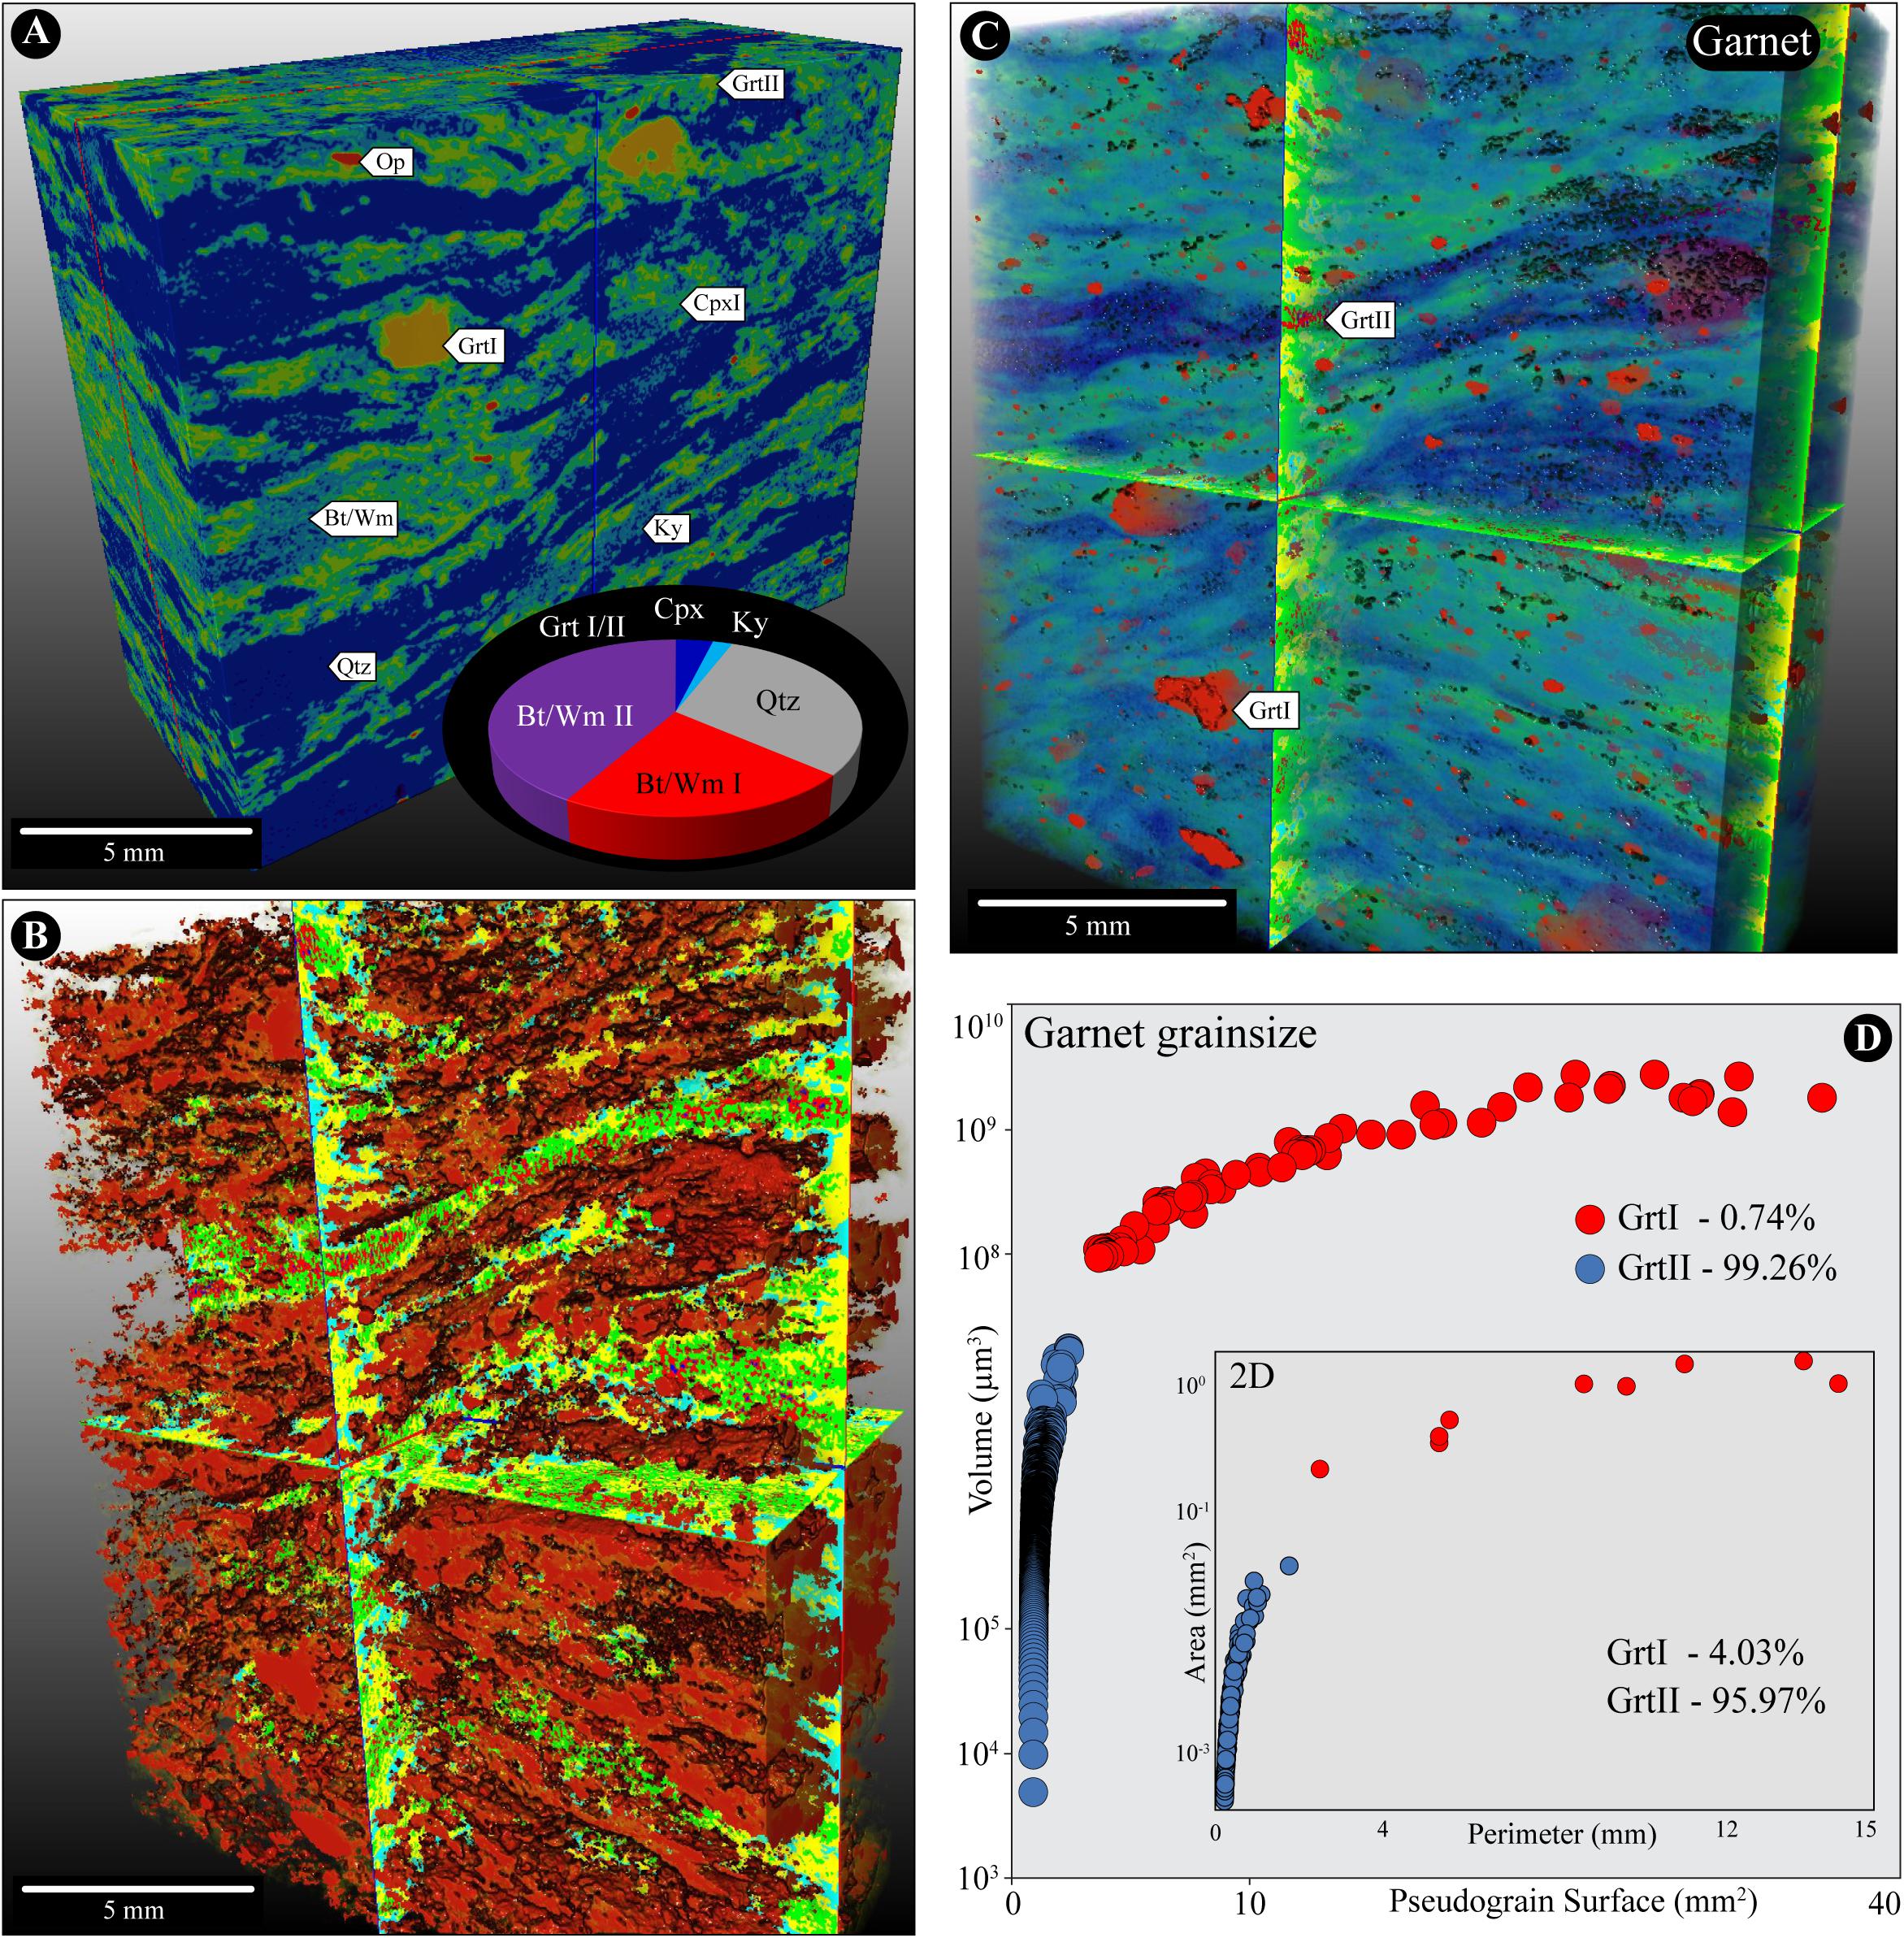
Figure 11. (A) Volume rendering of the segmented phases and the volumetric quantification of each phase. (B) Example of mineral segmentation (e.g., Qtz) showing the preservation of pre-S1 fabric. (C) Garnet pseudo-grains are highlighted within the entire rock-volume. (D) Grainsize vs. surface of Grt pseudo-grains.
The distribution patterns, and the SPO analysis for Qtz and Cpx are shown in Figures 1, 12, and Supplementary Table S5. 3D grain-shape anisotropy and orientation were measured using best-fit ellipsoids to Qtz and Cpx outer surfaces, from which the mean radius was calculated based on a spherical geometry (i.e., X, Y, and Z from longest to shortest axis). A total of 65,5361 quartz and 92,0316 clinopyroxene were measured as enclosed within the sample volume (Figures 12A,B) and are both characterized by an aspect ratio (Z/X) ranging from 0.15 to 1.00 (Figures 12C,D). The distribution of Cpx and Qtz aspect ratios (Figures 13A,B) has an average value of 0.52 ± 0.19 and 0.67 ± 0.26, respectively, persisting among all grain-size classes (Figures 12C,D).
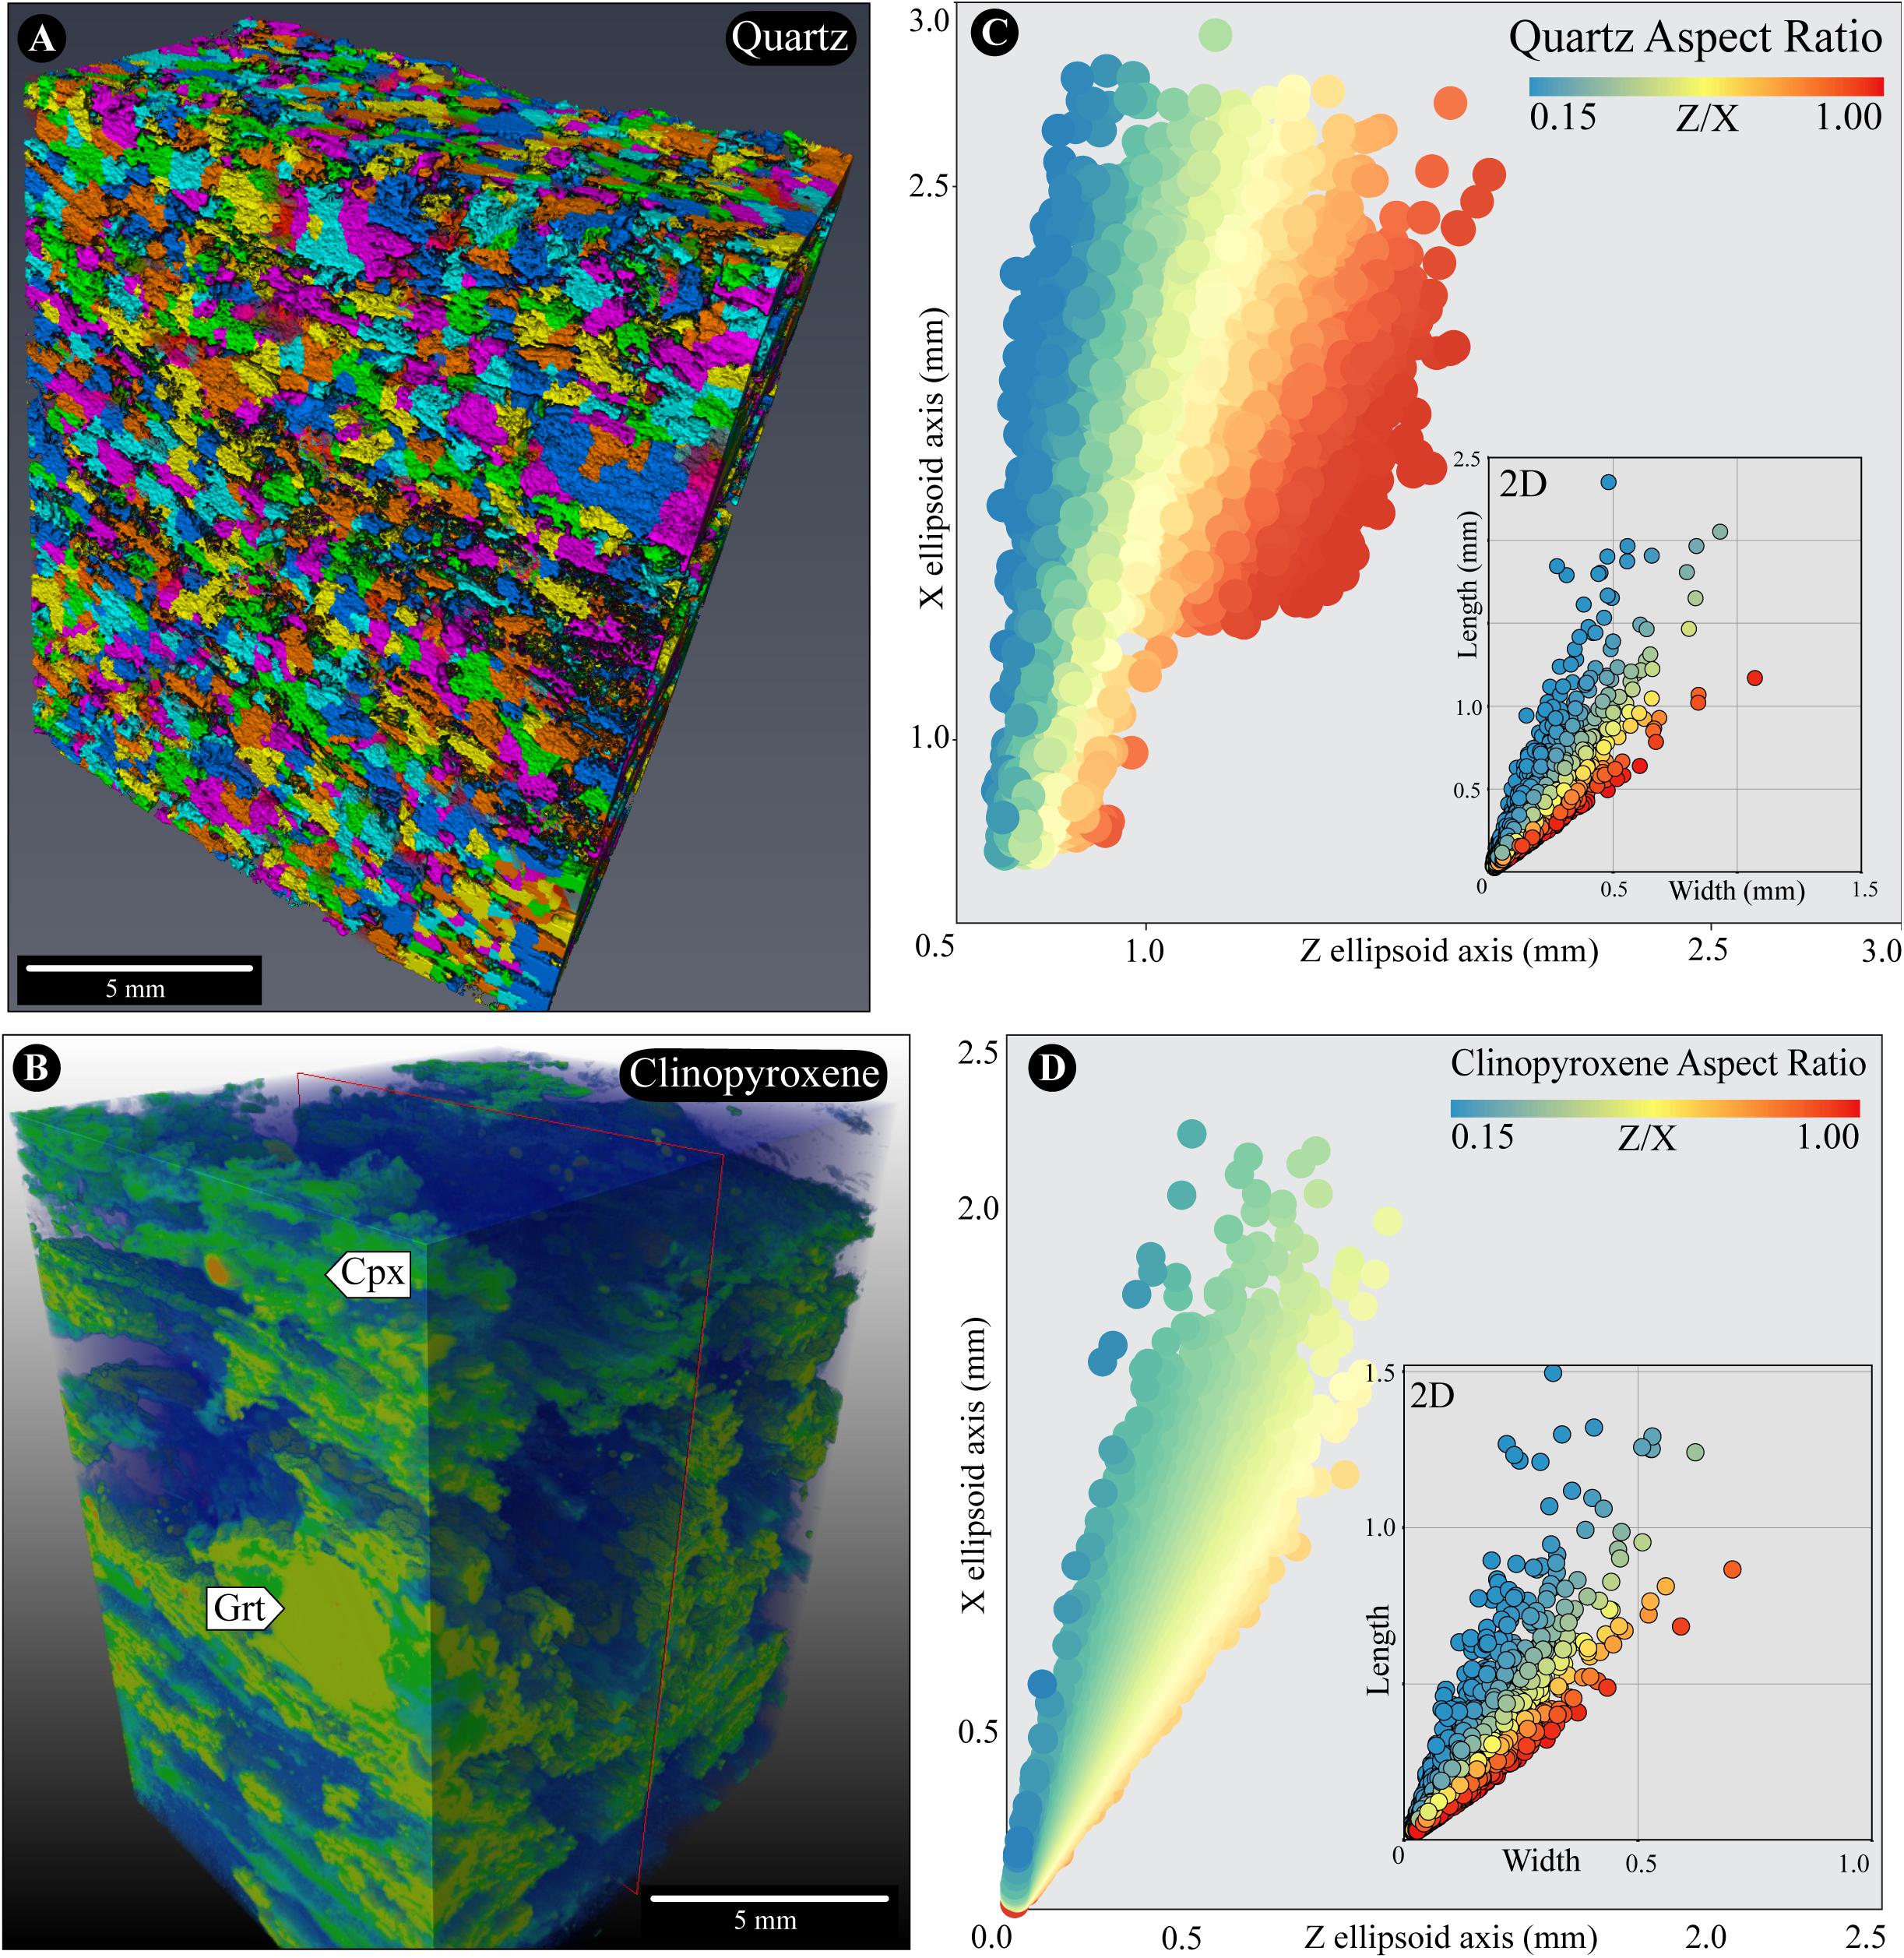
Figure 12. (A) 3D visualization of the Qtz pseudo-grains arrangement. (C) Qtz aspect ratio plot defined by the Z ellipsoid axis and X ellipsoid axis ratio. The 2D aspect ratio plot is reported. (B) 3D visualization of the Grt (yellow), Qtz (blue), and Cpx (green) relationships. (D) Cpx aspect ratio plot defined by the Z ellipsoid axis and X ellipsoid axis ratio. The 2D aspect ratio plot is reported.
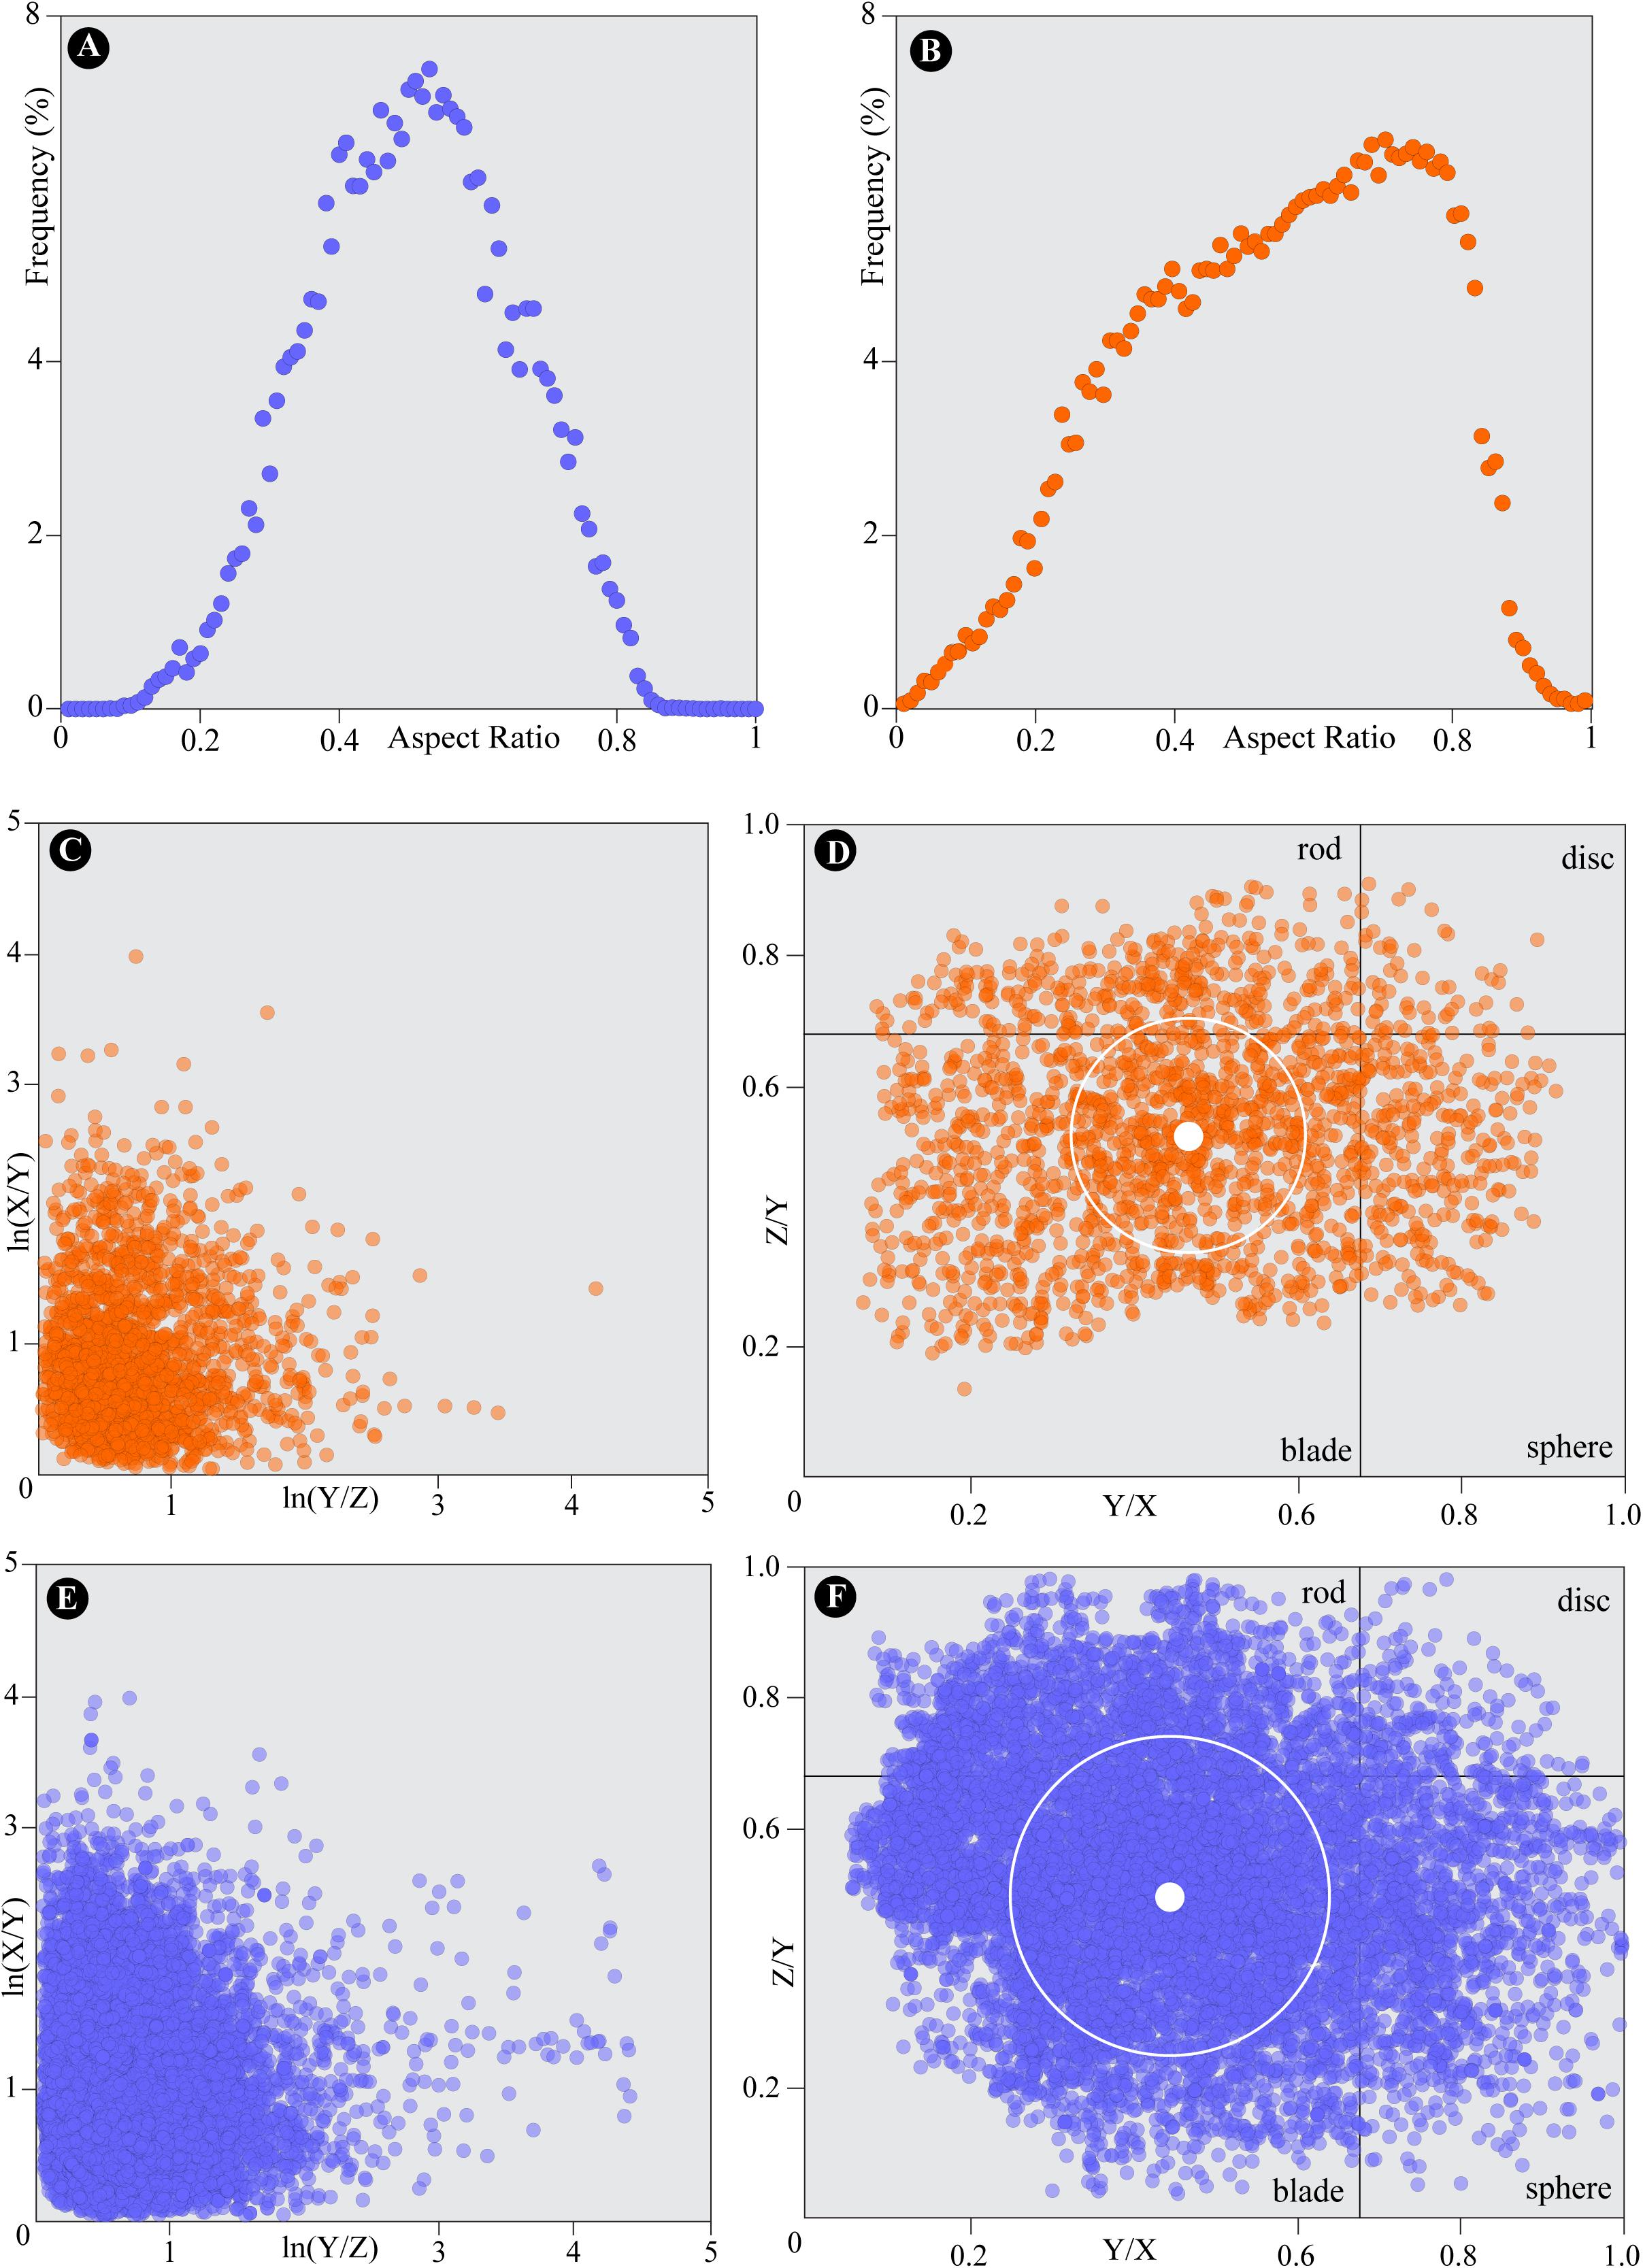
Figure 13. 3D quantitative fabric analysis. (A) Frequency of Cpx aspect ratio. (B) Frequency of Qtz aspect ratio. (C) Flinn diagram of Qtz pseudo-grains. (D) Zingg diagram of Qtz pseudo-grains. The average and the standard deviation are reported. (E) Flinn diagram of Cpx pseudo-grains. (F) Zingg diagram of Cpx pseudo-grains. The average and the standard deviation are reported.
Qtz and Cpx shapes can be summarized with a Flinn plot (Figures 13C,E) and Zingg shape diagram (Figures 13D,F), which suggest a weak planar-type fabric orientation of pseudo-grains roughly distributed among blade-like shapes. Even though the weak SPO and the blade-like shape arrangement of alpine Cpx and Qtz pseudo-grains, the anisotropic aspect ratios may be the results of pre-alpine high SPO inheritance. The SPO and the volumetric measurements verified and quantified the observed weak grain-shape anisotropy and high metamorphic overprint during the alpine tectono-metamorphic evolution.
Discussion and Conclusion
Micro-Scale and Kinetics Implications
The 3D visualization and analysis of fabrics and metamorphic minerals achieved by the X-ray μ-CT are well constrained by the 2D micro-structural analysis. In fact, despite the large gap between the two techniques in terms of number of analyzed grains, the results are comparable as shown by 2D vs. 3D description of shape parameters (Figures 12, 13). The reproducibility shown by the comparison of the shape analysis results allowed us to improve mineral phases identification, during the segmentation procedure, thanks to the knowledge from the 2D analysis, where not only shape parameters were known but also optical properties and mineral chemistry. Consequently, the quantitative chemical information obtained by the Q-XRMA tool were extended to the whole 3D volume.
Figures 11, 12 may also be used to quantitatively support the pervasiveness of the pre-alpine fabrics (100% of the rock fabric) within the investigated volume. Even though the pre-alpine fabric is so well preserved the pre-alpine minerals surprisingly correspond only to less than 22% (Figure 11A). Pre-alpine minerals mostly consist of GrtI, BtI and WmI and their compositions are known, and the P-T estimates might be easily depicted and used as first-order input data for dynamic numerical modeling for geodynamic reconstructions (e.g., Roda et al., 2012).
Similar contrasting relations between degree of fabric development and mineral associations have been described for eclogitized rocks in the same area, where Permian intrusive preserve their igneous fabrics, estimated as >90% of the rock fabric (Zucali et al., 2002; Zucali, 2011), but the mineral association related to the magmatic stage is almost totally replaced by eclogite facies minerals, up to 80–90% of the investigated portions (Koons, 1982; Zucali et al., 2002; Corti et al., 2017).
In the investigated case, the alpine-related mineral phases, comprising the 78.09% of the volume, involve WmII/BtII (41.73%), Qtz (30.46%), Cpx (3.86%), Ky (2.04%), and GrtII (0.01%), and do not mark a new fabric, but statically replace specific pre-alpine microdomains. The static replacement is also quantitatively shown by the heterogeneous grain-size distribution (Figures 11, 12), suggesting a dominant control of the growth domain over dynamic recrystallization that would have induced more pronounced shapes preferred orientations (Bell and Hayward, 1991). For example, GrtII grows as corona over GrtI, or Ky grows as aggregates replacing pre-alpine Sill-microdomains. The volumetric reconstruction of the shape and spatial distribution of alpine-related phases clearly demonstrate that metamorphic reactions may occur even in absence of deformation, and in the virtual absence of fluid as chemical medium. This was demonstrated by the unchanged bulk chemistry within the selected microsites. As an example, GrtII increases its Fe and Ca content in the ex-sillimanite domain and ex-plagioclase domains, respectively. Similarly, the Ky phase only occurs as pseudomorphic fine-grained aggregates in ex-sill domains. In the same way, the symplectite textures occurring in the ex-Pl domains are defined by high Jd contents (82–97%) Cpx, Ca-rich Grt (highest Grs component around 22%), and Qtz. All these features suggest that even at low temperature conditions (nominally below 550°C) and in low-strain domains the activation energy of many metamorphic reactions, energetically less favored (e.g., sillimanite to kyanite reaction), may be overstepped.
General Implications
A relative age of the two generations of minerals (i.e., pre-alpine and alpine) can be inferred, using their chemistry and microstructural relationships. In fact, GrtII, Cpx and WmII mineral chemistry strongly overlap with those expected for similar phases growth at eclogite-facies conditions (Zucali et al., 2002; Zucali and Spalla, 2011), attributed to an age range of 80–60 Ma (Cenki-Tok et al., 2011; Regis et al., 2014). The chemistry of GrtI and BtI overlaps the compositions known for similar rocks, as the Ivrea-Zone (e.g., Barboza and Bergantz, 2000), the Serie di Valpelline and the Dent-Blance Unit (Manzotti et al., 2012; Manzotti and Zucali, 2013), and other Austroalpine or Southalpine slices which they preserve the pre-alpine (Permian) high-temperature imprint (Roda et al., 2018c).
The investigated 3D microstructures exhibit complex overprinting relationships that are only partially reflected by outcrop-scale structures. In particular, the Bt, Wm, Qtz, Ky, and Cpx grains show two orientation clusters that can be correlated to the S and C mylonitic structures. The S-related structure includes 35% of grains aligned at 2–13° with respect to the pre-S1. The C-related structure comprises 23% of grains laying at 34–46° from the pre-S1 orientation. These S-C fabrics may be compared to pre-alpine features described by previous authors at the map-scale (Zucali, 2002; Corti et al., 2017) and preserved in similar low-strain volumes of the Sesia-Lanzo Zone. Still remains unclear how those meter-scale domains might preserve such clean fabrics even where no mechanical barriers have been described at the map-scale.
In conclusion, similar to what described at km-scale by 3D geological modeling (e.g., Salvi et al., 2010; Zucali et al., in press), a volumetric quantification is fundamental to improve our knowledge of the tectono-metamorphic evolution of active margins (e.g., subduction zone). In particular, the 3D reconstruction of grain shape distribution through X-ray microtomography on centimeters-sized samples allows to improve the knowledge of the metamorphic texture development. Moreover, the combined use of EMPA X-ray chemical mapping with the X-ray μ-CT technique can further permit to dynamically constrain the chemistry of the mineral phases linked to the metamorphic transformation.
Data Availability Statement
All datasets generated for this study are included in the article/Supplementary Material.
Author Contributions
LC and MZ conceived the presented idea. MZ, LM, and LC carried out the experiment. LM, RV, and MS verified the analytical methods. MZ, RV, LM, and MS contributed to the interpretation of the results. LC wrote the manuscript with support from MZ, RV, LM, and MS. All authors discussed the results and contributed to the final manuscript.
Conflict of Interest
The authors declare that the research was conducted in the absence of any commercial or financial relationships that could be construed as a potential conflict of interest.
Funding
This work was funded by Ph.D. School in Earth Sciences from University of Milan; Elettra Proposal (SYRMEP) #20170147, “Toward a geologically meaningful quantification of 3D grains shape distribution in natural rocks” to MZ and the University of Milano: Linea 2, Azione A – fondi giovani ricercatori “Analisi strutturale delle catene collisionali” (PSR2018_DZANONI). Results here presented have been developed in the frame of the MIUR Project “Dipartimenti di Eccellenza 2017 – Le Geoscienze per la società: risorse e loro evoluzione (work-package 3, tasks 3.3, and 3.4).” Elettra Sincrotrone Trieste is acknowledged for financial support to open access publication.
Acknowledgments
The authors thank A. Risplendente for assistance during the WDS/EDS-EPMA analysis and Dr. J. Kuva for support during the tomography data analysis with PerGeos in GTK.
Supplementary Material
The Supplementary Material for this article can be found online at: https://www.frontiersin.org/articles/10.3389/feart.2019.00327/full#supplementary-material
Footnotes
- ^ https://www.elettra.trieste.it/it/lightsources/labs-and-services/tomolab/tomolab.html
- ^ https://www.thermofisher.com/electron-microscopy
References
Babist, J., Handy, M. R., Konrad-Schmolke, M., and Hammerschmidt, K. (2006). Precollisional, multistage exhumation of subducted continental crust: the Sesia Zone, western Alps. Tectonics 25:TC6008. doi: 10.1029/2005TC001927
Baker, D. R., Mancini, L., Polacci, M., and Higgins, M. D. (2012). An introduction to the application of X-ray microtomography to the three-dimensional study of igneous rocks. Lithos 148, 262–276. doi: 10.1016/j.lithos.2012.06.008
Balestro, G., Festa, A., and Dilek, Y. (2019). Structural architecture of the Western alpine ophiolites, and the Jurassic Seafloor spreading tectonics of the alpine Tethys. J. Geol. Soc. 176, 913–930. doi: 10.1144/jgs2018-099
Barboza, S. A., and Bergantz, G. W. (2000). Metamorphism and anatexis in the mafic complex contact Aureole, Ivrea Zone, Northern Italy. J. Petrol. 41, 1307–1327. doi: 10.1093/petrology/41.8.1307
Baruchel, J., Buffiere, J. Y., and Maire, E. (2000). X-ray Tomography in Material Science. Paris: Hermes science publications.
Belfiore, C. M., Fichera, G. V., Ortolano, G., Pezzino, A., Visalli, R., and Zappalà, L. (2016). Image processing of the pozzolanic reactions in Roman mortars via X-Ray map analyser. Microchem. J. 125, 242–253. doi: 10.1016/j.microc.2015.11.022
Bell, T. H., and Hayward, N. (1991). Episodic metamorphic reactions during orogenesis: the control of deformation partitioning on reaction sites and reaction duration. J. Metamorph. Geol. 9, 619–640. doi: 10.1111/j.1525-1314.1991.tb00552.x
Berrezueta, E., Domínguez-Cuesta, M. J., and Rodríguez-Rey, Á. (2019). Semi-automated procedure of digitalization and study of rock thin section porosity applying optical image analysis tools. Comput. Geosci. 124, 14–26. doi: 10.1016/j.cageo.2018.12.009
Bigi, G., Castellarin, A., Coli, M., Dal Piaz, G. V., Sartori, R., Scandone, P., et al. (1990). Structural Model of Italy, Sheets 1-2. In: Progetto Finalizzato Geodinamica del CNR. Firenze: SELCA.
Bussy, F., Venturini, G., Hunziker, J., and Martinotti, G. (1998). U–Pb ages of magmatic rocks of the western Austroalpine Dent-Blanche-Sesia Unit. Schweitz. Mineral. Petrogr. Mitt. 78, 163–168.
Callegari, E., Compagnoni, R., Dal Piaz, G. V., Frisatto, V., Gosso, G., and Lombardo, B. (1976). Nuovi affioramenti di metagranitoidi nella zona Sesia-Lanzo. Rend. Soc. Ital. Miner. Petrol. 32, 97–111. doi: 10.1140/epjc/s10052-018-6290-2
Cantù, M., Spaggiari, L., Zucali, M., Zanoni, D., and Spalla, M. I. (2016). Structural analysis of a subduction-related contact in southern Sesia-Lanzo Zone (Austroalpine Domain, Italian Western Alps). J. Maps 12, 22–35. doi: 10.1080/17445647.2016.1155925
Castelli, D. (1987). Il Metamorfismo Alpino delle Rocce Carbonatiche della Zona Sesia-Lanzo (Alpi Occidentali). Ph.D. thesis, Consorzio Universitario di CA-GE-TO, Ragusa.
Castelli, D. (1991). Eclogitic metamorphism in carbonate rocks: the example of impure marbles from the Sesia-Lanzo Zone, Italian Western Alps. J. Metam. Geol. 9, 61–77. doi: 10.1111/j.1525-1314.1991.tb00504.x
Castelli, D., and Rubatto, D. (2002). Stability of Al- and F-rich titanite in metacarbonate: petrologic and isotopic constraints from a polymetamorphic eclogitic marble of the internal Sesia Zone (Western Alps). Contrib. Miner. Petrol. 142, 627–639. doi: 10.1007/s00410-001-0317-6
Cenki-Tok, B., Oliot, E., Rubatto, D., Berger, A., Engi, M., and Janots, E. (2011). Preservation of Permian allanite within an alpine eclogite facies shear zone at Mt Mucrone, Italy: mechanical and chemical behavior of allanite during mylonitization. Lithos 125, 40–50. doi: 10.1016/j.lithos.2011.01.005
Cnudde, V., and Boone, M. N. (2013). High-resolution X-ray computed tomography in geosciences: a review of the current technology and applications. Earth Sci. Rev. 123, 1–17. doi: 10.1016/j.earscirev.2013.04.003
Compagnoni, R. (1977). The Sesia-Lanzo zone: high-pressure low-temperature metamorphism in the Austroalpine continental margin. Ren. Soc. Ital. Miner. Petrol. 33, 335–374.
Compagnoni, R., Dal Piaz, G. V., Hunziker, J. C., Gosso, G., Lombardo, B., and Williams, P. F. (1977). The Sesia Lanzo zone, a slice of continental crust with alpine high pressure-low temperature assemblages in the Western Italian Alps. Rend. Soc. It. Min. Petr. 33, 281–334.
Compagnoni, R., and Maffeo, B. (1973). Jadeite bearing metagranites ls. and related rocks in the Mount Mucrone Area (Sesia-Lanzo zone, Western Italian Alps). Schweiz. Mineral. Petrogr. Mitt. 53, 355–378.
Corti, L., Alberelli, G., Zanoni, D., and Zucali, M. (2017). Analysis of fabric evolution and metamorphic reaction progress at Lago della Vecchia-Valle d’Irogna, Sesia-Lanzo Zone, Western Alps. J. Maps 13, 521–553. doi: 10.1080/17445647.2017.1331177
Corti, L., Alberelli, G., Zanoni, D., and Zucali, M. (2018). Tectonometamorphic evolution of the Lago della Vecchia metaintrusive and its country rocks, Sesia-Lanzo Zone, Western Alps. Ital. J. Geosci. 137, 188–207. doi: 10.3301/IJG.2018.08
Dal Piaz, G. V., Hunziker, J. C., and Martinotti, G. (1972). La Zona Sesia-Lanzo e l’evoluzione tettonico-metamorfica delle Alpi Nord-occidentali interne. Mem. Soc. Geol. Ltal. 11:433.
De Andrade, V., Vidal, O., Lewin, E., O’Brien, P., and Agard, P. (2006). Quantification of electron microprobe compositional maps of rock thin sections: an optimized method and examples. J. Metamorph. Geol. 24, 655–668. doi: 10.1111/j.1525-1314.2006.00660.x
Deer, W., Howie, R., and Zussman, J. (1992). An Introduction to the Rock-Forming Minerals. Essex: Longman Scientific and Technology.
Delleani, F., Spalla, M. I., Castelli, D., and Gosso, G. (2012). Multiscale structural analysis in the subducted continental crust of the internal Sesia-Lanzo Zone (Monte Mucrone, Western Alps). J. Vir. Explor. 41:7. doi: 10.3809/jvirtex.2011.00287
Delleani, F., Spalla, M. I., Castelli, D., and Gosso, G. (2013). A new petro-structural map of the Monte Mucrone metagranitoids (Sesia-Lanzo Zone, Western Alps). J. Maps 9, 410–424. doi: 10.1080/17445647.2013.800004
Denison, C., Carlson, W. D., and Ketcham, R. A. (1997). Three-dimensional quantitative textural analysis of metamorphic rocks using high-resolution computed X-ray tomography: Part I. Methods and techniques. J. Metamorph. Geol. 15, 29–44. doi: 10.1111/j.1525-1314.1997.00006.x
DeVasto, M. A., Czeck, D. M., and Bhattacharyya, P. (2012). Using image analysis and ArcGIS® to improve automatic grain boundary detection and quantify geological images. Comp. Geosci. 49, 38–45. doi: 10.1016/j.cageo.2012.06.005
Fiannacca, P., Ortolano, G., Pagano, M., Visalli, R., Cirrincione, R., and Zappalà, L. (2017). IG-Mapper: a new ArcGIS® toolbox for the geostatistics-based automated geochemical mapping of igneous rocks. Chem. Geol. 470, 75–92. doi: 10.1016/j.chemgeo.2017.08.024
Frassi, C., Musumeci, G., Zucali, M., Mazzarini, F., Rebay, G., and Langone, A. (2017). The Cotoncello Shear Zone (Elba Island, Italy): the deep root of a fossil oceanic detachment fault in the Ligurian ophiolites. Lithos 278, 445–463. doi: 10.1016/j.lithos.2017.02.015
Giuntoli, F., and Engi, M. (2016). Internal geometry of the central Sesia Zone (Aosta Valley, Italy): HP tectonic assembly of continental slices. Swiss. J. Geosci. 109, 445–471. doi: 10.1007/s00015-016-0225-4
Giuntoli, F., Lanari, P., and Engi, M. (2018a). Deeply subducted continental fragments – Part 1: fracturing, dissolution–precipitation, and diffusion processes recorded by garnet textures of the central Sesia Zone (western Italian Alps). Solid Earth 9, 167–189. doi: 10.5194/se-9-167-2018
Giuntoli, F., Lanari, P., Burn, M., Kunz, B. E., and Engi, M. (2018b). Deeply subducted continental fragments - Part 2: insight from petrochronology in the central Sesia Zone (western Italian Alps). Solid Earth 9, 191–222. doi: 10.5194/se-9-191-2018
Gonzalez, R., and Woods, R. (2002). Digital Image Processing. Upper Saddle River, NJ: Prentice Hall, doi: 10.1016/0734-189X(90)90171-Q
Gosso, G. (1977). Metamorphic evolution and fold history in the eclogite micaschists of the upper Gressoney valley (Sesia-Lanzo zone, Western Alps). Rend. Soc. It. Mineral. Petrol. 33, 389–407.
Gosso, G., Rebay, G., Roda, M., Spalla, M. I., Tarallo, M., Zanoni, D., et al. (2015). Taking advantage of petrostructural heterogeneities in subduction-collisional orogens, and effect on the scale of analysis. Per. Miner. 84:779. doi: 10.2451/2015PM0452
Halama, R., Glodny, J., Konrad-Schmolke, M., and Sudo, M. (2018). Rb-Sr and in situ 40Ar/39Ar dating of exhumation-related shearing and fluid-induced recrystallization in the Sesia zone (Western Alps, Italy). Geosphere 14, 1425–1450. doi: 10.1130/GES01521.1
Hayama, Y. (1959). Some considerations on the color of biotite and its relation to metamorphism. J. Geol. Soc. Jpn 65, 21–30. doi: 10.5575/geosoc.65.21
Hobbs, B. E., Means, W. D., and Williams, P. F. (1976). An Outline of Structural Geology. New York, NY: Wiley.
Hobbs, B. E., Ord, A., Spalla, M. I., Gosso, G., and Zucali, M. (2010). The interaction of deformation and metamorphic reactions. Geol. Soc. Lond. Special Pub. 332, 189–223. doi: 10.1144/SP332.12
Huddlestone-Holmes, C. R., and Ketcham, R. A. (2010). An X-ray computed tomography study of inclusion trail orientations in multiple porphyroblasts from a single sample. Tectonophysics 480, 305–320. doi: 10.1016/j.tecto.2009.10.021
Hy, C. (1984). Métamorphisme Polyphasé et Evolution Tectonique dans la Croûte Continentale Éclogitisée: les Series Granitiques et Pélitiques du Monte Mucrone (zone Sesia-Lanzo, Alpes italiennes). Ph.D. thesis, Université Paris VI, Paris.
Ildefonse, B., Lardeaux, J. M., and Caron, J. M. (1990). The behavior of shape preferred orientations in the metamorphic rocks: amphiboles and jadeites from the Monte Mucrone Area (Sesia-Lanzo Zone, Italian Western Alps). J. Struct. Geol. 12, 1005–1011. doi: 10.1016/0191-8141(90)90096-H
Johnson, S. E., and Vernon, R. H. (1995). Inferring the timing of porphyroblast growth in the absence of continuity between inclusion trails and matrix foliations; can it be reliably done? J. Struct. Geol. 17, 1203–1206. doi: 10.1016/0191-8141(95)00021-5
Koons, P. O. (1982). An Investigation of Experimental and Natural High-Pressure Assemblages From Sesia Zone, Western Alps, Italy. Ph.D. thesis, ETH Zürich, Zurich.
Koons, P. O., Rubie, D. C., and Frueh-Green, G. (1987). The effects of disequilibrium and deformation on the mineralogical evolution of quartz-diorite during metamorphism in the eclogite facies. J. Petrol. 28, 679–700. doi: 10.1093/petrology/28.4.679
Lanari, P., Vidal, O., De Andrade, V., Dubacq, B., Lewin, E., Grosch, E. G., et al. (2014). XMapTools: a MATLAB© -based program for electron microprobe X-ray image processing and geothermobarometry. Comp. Geosci. 62, 227–240. doi: 10.1016/j.cageo.2013.08.010
Lardeaux, J. M. (1981). Evolution Tectono-Métamorphique de la Zone Nord du Massif de Sesia-Lanzo (Alpes Occidentales): Un exemple d’éclogitisation de croûte continentale. Ph.D. thesis, Université Paris VI, Paries.
Lardeaux, J. M., Gosso, G., Kienast, J. R., and Lombardo, B. (1982a). Chemical variations in phengitic micas of successive foliations within the Eclogitic Micaschists complex, Sesia-Lanzo zone (Italy, Western Alps). Bull. Minéral. 106, 673–689. doi: 10.3406/bulmi.1983.7689
Lardeaux, J. M., Gosso, G., Kienast, J. R., and Lombardo, B. (1982b). Relations entre le métamorphisme et la déformation dans la zone Sésia-Lanzo (Alpes Occidentales) et le problème de l’éclogitisation de la croûte continentale. Bull. Soc. Géol. Fr. 7, 793–800. doi: 10.2113/gssgfbull.s7-xxiv.4.793
Lardeaux, J. M., Lombardo, B., Gosso, G., and Kienast, J. R. (1983). Découverte de paragenèses à ferro-omphacites dans les orthogneiss de la zone Sesia-Lanzo septentrionale (Alpes Italiennes). C. R. Acad. Sci. Paris 296:453.
Lardeaux, J. M., and Spalla, M. I. (1990). Tectonic significance of P-T-t paths in metamorphic rocks: examples from ancient and modern orogenic belts. Mem. Soc. Geol. Ital. 45, 51–69.
Lardeaux, J. M., and Spalla, M. I. (1991). From granulites to eclogites in the Sesia zone (Italian western Alps): a record of the opening and closure of the Piedmont ocean. J. Metam. Geol. 9, 35–59. doi: 10.1111/j.1525-1314.1991.tb00503.x
Li, X., Di, L., Han, W., Zhao, P., and Dadi, U. (2010). Sharing geoscience algorithms in a Web service-oriented environment (GRASS GIS example). Comp. Geosci. 36, 1060–1068. doi: 10.1016/j.cageo.2010.03.004
Macente, A., Fusseis, F., Menegon, L., Xiao, X., and John, T. (2017). The strain-dependent spatial evolution of garnet in a high-P ductile shear zone from the Western Gneiss Region (Norway): a synchrotron X-ray microtomography study. J. Metamorph. Geol. 35, 565–583. doi: 10.1111/jmg.12245
Mancini, L., Reinier, R., Cloetens, P., Gastaldi, J., Härtwig, J., Schlenker, M., et al. (1998). Investigation of structural defects and inhomogeneities in Al-Pd-Mn icosahedral quasicrystals by combined synchrotron X-ray topography and phase radiography. Phil. Mag. 78, 1175–1194. doi: 10.1080/01418619808239982
Manzotti, P., Rubatto, D., Darling, J., Zucali, M., Cenki-Tok, B., and Engi, M. (2012). From Permo-Triassic lithospheric thinning to Jurassic rifting at the Adriatic margin: petrological and geochronological record in Valtournenche (Western Italian Alps). Lithos 146, 276–292. doi: 10.1016/j.lithos.2012.05.007
Manzotti, P., and Zucali, M. (2013). The pre-alpine tectonic history of the Austroalpine continental basement in the Valpelline unit (Western Italian Alps). Geol. Mag. 150, 153–172. doi: 10.1017/S0016756812000441
Marotta, A. M., Spalla, M. I., and Gosso, G. (2009). Upper and lower crustal evolution during lithospheric extension: numerical modelling and natural footprints from the European Alps. Geol. Soc. Lond. Spec. Publ. 321, 33–72. doi: 10.1144/SP321.3
Meda, M., Marotta, A. M., and Spalla, M. I. (2010). The role of mantle hydration into the continental crust recycling in the wedge region. Geol. Soc. Lond. Spec. Pub. 332, 149–172. doi: 10.1144/SP332.10
Meyer, F., and Beucher, S. (1990). Morphological segmentation. J. Vis. Commun. Image Represent. 1, 21–46. doi: 10.1016/1047-3203(90)90014-M
Mørk, M. B. (1985). A gabbro eclogite transition of Flemsoy, Suamore, western Norway. Chem. Geol. 50, 283–310. doi: 10.1016/0009-2541(85)90125-1
Myers, J. S. (1970). Gneiss types and their significance in the repeatedly deformed and metamorphosed Lewisian complex of Western Harris, Outer Hebrides. Scot. J. Geol. 6, 186–199. doi: 10.1144/sjg06020186
Oberhänsli, R., Hunziker, J. C., Martinotti, G., and Stern, W. B. (1985). Geochemistry, geochronology and petrology of Monte Mucrone: an example of Eo-alpine eclogitization of Permian granitoids in the Sesia-Lanzo Zone, Western Alps, Italy. Chem. Geol. 52, 165–184. doi: 10.1016/0168-9622(85)90016-8
Ortolano, G., Visalli, R., Godard, G., and Cirrincione, R. (2018). Quantitative X-ray Map Analyser (Q-XRMA): a new GIS-based statistical approach to Mineral Image Analysis. Comp. Geosci. 115, 56–65. doi: 10.1016/j.cageo.2018.03.001
Ortolano, G., Zappalà, L., and Mazzoleni, P. (2014a). X-Ray Map Analyser: a new ArcGIS® based tool for the quantitative statistical data handling of X-ray maps (Geo-and material-science applications). Comp. Geosci. 72, 49–64. doi: 10.1016/j.cageo.2014.07.006
Ortolano, G., Visalli, R., Cirrincione, R., and Rebay, G. (2014b). PT-path reconstruction via unraveling of peculiar zoning pattern in atoll shaped garnets via image assisted analysis: an example from the Santa Lucia del Mela garnet micaschists (northeastern Sicily-Italy). Period. Mineral. 83, 257–297. doi: 10.2451/2013PM0015
Park, R. G. (1969). Structural correlations in metamorphic belts. Tectonophysics 7, 323–338. doi: 10.1016/0040-1951(69)90077-8
Passchier, C. W., Myers, J. S., and Kroner, A. (1990). Field Geology of High-Grade Gneiss Terrains. Berlin: Springer.
Pearce, M. A., and Wheeler, J. (2010). Modelling grain-recycling zoning during metamorphism. J. Metam. Geol. 28, 423–437. doi: 10.1111/j.1525-1314.2010.00872.x
Pognante, U. (1989a). Lawsonite, blueschist and eclogite formation in the southern Sesia Zone (Western Alps, Italy). Eur. J. Miner. 1, 89–104. doi: 10.1127/ejm/01/1/0089
Pognante, U. (1989b). Tectonic implications of lawsonite formation in the Sesia zone (Western Alps). Tectonophysics 162, 219–227. doi: 10.1016/0040-1951(89)90245-X
Pognante, U. (1991). Petrological constraints on the eclogite- and blueschist-facies metamorphism and P-T-t paths in the Western Alps. J. Metam. Geol. 9, 5–17. doi: 10.1111/j.1525-1314.1991.tb00501.x
Polacci, M., Mancini, L., and Baker, D. R. (2010). The contribution of synchrotron X-ray computed microtomography to understanding volcanic processes. J. Synchrotron Rad. 17, 215–221. doi: 10.1107/S0909049509048225
Pradhan, B. (2013). A comparative study on the predictive ability of the decision tree, support vector machine and neuro-fuzzy models in landslide susceptibility mapping using GIS. Comp. Geosci. 51, 350–365. doi: 10.1016/j.cageo.2012.08.023
Rebay, G., and Messiga, B. (2007). Prograde metamorphic evolution and development of chloritoid-bearing eclogitic assemblages in subcontinental metagabbro (Sesia-Lanzo Zone, Italy). Lithos 98, 275–291. doi: 10.1016/j.lithos.2007.04.002
Rebay, G., and Spalla, M. I. (2001). Emplacement at granulite facies conditions of the Sesia–Lanzo metagabbros: an early record of Permian rifting? Lithos 58, 85–104. doi: 10.1016/S0024-4937(01)00046-9
Rebay, G., Zanoni, D., Langone, A., Luoni, P., Tiepolo, M., and Spalla, M. I. (2018). Dating of ultramafic rocks from the Western Alps ophiolites discloses Late Cretaceous subduction ages in the Zermatt-Saas Zone. Geol. Mag. 155, 298–315. doi: 10.1017/S0016756817000334
Regis, D., Rubatto, D., Darling, J., Cenki-Tok, B., Zucali, M., and Engi, M. (2014). Multiple metamorphic stages within an eclogite-facies terrane (Sesia Zone, Western Alps) revealed by Th–U–Pb petrochronology. J. Petrol. 55, 1429–1456. doi: 10.1093/petrology/egu029
Ridley, J. (1989). Structural and metamorphic history of a segment of the Sesia-Lanzo Zone, and its bearing on the kinematics of alpine deformation in the Western Alps. Geol. Soc. Lond. Spec. Publ. 45, 189–201. doi: 10.1144/GSL.SP.1989.045.01.10
Roda, M., De Salvo, F., Zucali, M., and Spalla, M. I. (2018a). Structural and metamorphic evolution during tectonic mixing: is the Rocca Canavese Thrust Sheet (Italian Western Alps) a subduction-related melange? Ital. J. Geosci. 137, 311–329. doi: 10.3301/IJG.2018.17
Roda, M., Regorda, A., Spalla, M. I., and Marotta, A. M. (2018b). What drives alpine Tethys opening? Clues from the review of geological data and model predictions. Geol. J. 54, 2646–2664. doi: 10.1002/gj.3316
Roda, M., Zucali, M., Li, Z., and Spalla, M. I. (2018c). Pre-alpine contrasting tectono-metamorphic evolutions within the Southern Steep Belt, Central Alps. Lithos 310, 31–49. doi: 10.1016/j.lithos.2018.03.025
Roda, M., Spalla, M. I., and Marotta, A. M. (2012). Integration of natural data within a numerical model of ablative subduction: a possible interpretation for the alpine dynamics of the Austroalpine crust. J. Metam. Geol. 30, 973–996. doi: 10.1111/jmg.12000
Roda, M., Zucali, M., Regorda, A., and Spalla, M. I. (2019). Formation and evolution of a subduction-related mélange: the example of the Rocca Canavese Thrust Sheets (Western Alps). Geol. Soc. Am. Bull. doi: 10.1130/B35213.1
Rubatto, D., Gebauer, D., and Compagnoni, R. (1999). Dating of eclogite-facies zircons: the age of alpine metamorphism in the Sesia-Lanzo zone (western Alps). Earth Planet. Sci. Lett. 167, 141–158. doi: 10.1016/S0012-821X(99)00031-X
Salvi, F., Spalla, M. I., Zucali, M., and Gosso, G. (2010). Three-dimensional evaluation of fabric evolution and metamorphic reaction progress in polycyclic and polymetamorphic terrains: a case from the Central Italian Alps. Geol. Soc. Lond. Spec. Pub. 332, 173–187. doi: 10.1144/SP332.11
Sayab, M., Miettinen, A., Aerden, D., and Karell, F. (2017). Orthogonal switching of AMS axes during type-2 fold interference: insights from integrated X-ray computed tomography, AMS and 3D petrography. J. Struct. Geol. 103, 1–16. doi: 10.1016/j.jsg.2017.09.002
Sayab, M., Suuronen, J. P., Hölttä, P., Aerden, D., Lahtinen, R., and Kallonen, A. P. (2015). High-resolution X-ray computed microtomography: a holistic approach to metamorphic fabric analyses. Geology 43, 55–58. doi: 10.1130/G36250.1
Sayab, M., Suuronen, J. P., Molnár, F., Villanova, J., Kallonen, A., et al. (2016). Three-dimensional textural and quantitative analyses of orogenic gold at the nanoscale. Geology 44, 739–742. doi: 10.1130/G38074.1
Schneider, C. A., Rasband, W. S., and Eliceiri, K. W. (2012). NIH Image to ImageJ: 25 years of image analysis. Nat. Methods 9, 671–675. doi: 10.1038/nmeth.2089
Siivola, J., and Schmid, R. (2007). Recommendations by the IUGS Subcommission on the Systematics of Metamorphic Rocks: List of Mineral Abbreviations. Web Version 01.02.07. Available at: http://www.bgs.ac.uk/scmr/docs/papers/paper_12.pdf (accessed February 26, 2019).
Spalla, M. I., Carminati, E., Ceriani, S., Oliva, A., and Battaglia, D. (1999). Influence of deformation partitioning and metamorphic re-equilibration on P-T path reconstruction in the pre-alpine basement of central Southern Alps (Northern Italy). J. Metam. Geol. 17, 319–336. doi: 10.1046/j.1525-1314.1999.00199.x
Spalla, M. I., De Maria, L., Gosso, G., Miletto, M., and Pognante, U. (1983). Deformazione e metamorfismo della Zona Sesia-Lanzo meridionale al contatto con la falda piemontese e con il massiccio di Lanzo, Alpi occidentali. Mem. Soc. Geol. Ital. 26, 499–514.
Spalla, M. I., Lardeaux, J. M., Dal Piaz, G. V., and Gosso, G. (1991). Metamorphisme et tectonique a la marge externe de la Zone Sesia - Lanzo (Alpes Occidentales). Mem. Sci. Geol. Padova. 43, 361–369.
Spalla, M. I., and Zucali, M. (2004). Deformation vs. metamorphic re-equilibrium heterogeneities in polymetamorphic rocks; a key to infer quality P-T-d-t path. Period. Mineral. 73, 249–257.
Spalla, M. I., Zucali, M., Di Paola, S., and Gosso, G. (2005). A critical assessment of tectono-thermal memory of rocks and definition of tectonometamorphic units: evidence from fabric and degree of metamorphic transformation. Geol. Soc. Lond Spec. Publ. 243, 227–247. doi: 10.1144/GSL.SP.2005.243.01.16
Stünitz, H. (1989). Partitioning of Metamorphism and Deformation in the Boundary Region of the “Seconda Zona Diorito-Kinzigitica”, Sesia Zone, Western Alps. Ph.D. thesis, ETH, Zurich.
Turner, F. J., and Weiss, L. E. (1963). Structural Analysis of Metamorphic Tectonites. New York, NY: MacGraw-Hill.
Visalli, R. (2017). Innovative Numerical Petrological Methods for Definition of Metamorphic Timescale Events of Southern European Variscan Relicts via Thermodynamic and Diffusion Modelling of Zoned Garnets. Ph.D. Thesis, University of Catania, Catania.
Voltolini, M., Zandomeneghi, D., Mancini, L., and Polacci, M. (2011). Texture analysis of volcanic rock samples: quantitative study of crystals and vesicles shape preferred orientation from X-ray microtomography data. J. Volcanol. Geoth. Res. 202, 83–95. doi: 10.1016/j.jvolgeores.2011.02.003
Wilkins, S. W., Gureyev, T. E., Gao, D., Pogany, A., and Stevenson, A. W. (1996). Phase-contrast imaging using polychromatic hard X-rays. Nature 384, 335–338. doi: 10.1038/384335a0
Williams, P. F. (1985). Multiply deformed terrains - problems of correlation. J. Struct. Geol. 7, 269–280. doi: 10.1016/0191-8141(85)90035-5
Wu, C. M., and Chen, H. X. (2015). Revised Ti-in-biotite geothermometer for ilmenite-or rutile-bearing crustal metapelites. Sci. Bull. 60, 116–121. doi: 10.1007/s11434-014-0674-y
Zandomeneghi, D., Voltolini, M., Mancini, L., Brun, F., Dreossi, D., and Polacci, M. (2010). Quantitative analysis of X-ray microtomography images of geomaterials: application to volcanic rocks. Geosphere 6, 793–804. doi: 10.1130/GES00561.1
Zanoni, D., Bado, L., Spalla, M. I., Zucali, M., and Gosso, G. (2008). Structural analysis of the Northeastern margin of the Tertiary intrusive stock of Biella (Western Alps, Italy). Ital. J. Geosci. 127, 125–140.
Zucali, M. (2002). Foliation map of the “Eclogitic Micaschists Complex” (Monte Mucrone-Monte Mars-Mombarone, Sesia-Lanzo Zone, Italy). Mem. Sci. Geol. 54:86.
Zucali, M. (2005). JPT-Mineral Formula Calculation and Geo-Thermobarometry. Available at: https://michelezucali.wixsite.com/michelezucali/jpt (accessed March 10, 2019).
Zucali, M. (2011). Coronitic microstructures in patchy eclogitised continental crust: the Lago della Vecchia Permian metagranite (Sesia-Lanzo Zone, Western Italian Alps). J. Virtual. Expl. 38:7. doi: 10.3809/jvirtex.2011.00286
Zucali, M., Barberini, V., Voltolini, M., Ouladdiaf, B., Chateigner, D., and Mancini, L. (2014a). Quantitative 3D microstructural analysis of naturally deformed amphibolite from the Southern Alps (Italy): microstructures, CPO and seismic anisotropy from a fossil extensional margin. From: Faulkner, D. R., Mariani, E., and Mecklenburgh, J. (Eds). Rock Deformation from Field, Experiments and Theory: a Volume in Honour of Ernie Rutter. Geol. Soc. 409, 201–222. doi: 10.1144/SP409.5
Zucali, M., Voltolini, M., Ouladdiaf, B., Mancini, L., and Chateigner, D. (2014b). The 3D quantitative lattice and shape preferred orientation of a mylonitised metagranite from Monte Rosa (Western Alps): combining neutron diffraction texture analysis and synchrotron X-ray microtomography. J. Struct. Geol. 63, 91–105. doi: 10.1016/j.jsg.2014.02.011
Zucali, M., and Spalla, M. I. (2011). Prograde lawsonite during the flow of continental crust in the alpine subduction: strain vs. metamorphism partitioning, a field-analysis approach to infer tectonometamorphic evolutions (Sesia-Lanzo Zone, Western Italian Alps). J. Struct. Geol. 33, 381–398. doi: 10.1016/j.jsg.2010.12.006
Zucali, M., Spalla, M. I., and Gosso, G. (2002). Strain partitioning and fabric evolution as a correlation tool: the example of the eclogitic micaschists complex in the Sesia-Lanzo Zone (Monte Mucrone-Monte Mars, Western Alps, Italy). Schweiz. Miner. Petrogr. Mitt. 82, 429–454.
Zucali, M., Spalla, M. I., Gosso, G., Racchetti, S., and Zulbati, F. (2004). Prograde Lws-Ky transition during subduction of the alpine continental crust of the Sesia-Lanzo Zone: the Ivozio Complex. J. Virtual. Expl. 16, 1–21. doi: 10.3809/jvirtex.2004.00105
Keywords: X-ray microtomography, X-ray chemical maps, shape preferred orientation, granulite metamorphism, pre-alpine fabrics, Sesia-Lanzo Zone
Citation: Corti L, Zucali M, Visalli R, Mancini L and Sayab M (2019) Integrating X-Ray Computed Tomography With Chemical Imaging to Quantify Mineral Re-crystallization From Granulite to Eclogite Metamorphism in the Western Italian Alps (Sesia-Lanzo Zone). Front. Earth Sci. 7:327. doi: 10.3389/feart.2019.00327
Received: 23 July 2019; Accepted: 27 November 2019;
Published: 19 December 2019.
Edited by:
Scott Andrew Whattam, King Fahd University of Petroleum and Minerals, Saudi ArabiaCopyright © 2019 Corti, Zucali, Visalli, Mancini and Sayab. This is an open-access article distributed under the terms of the Creative Commons Attribution License (CC BY). The use, distribution or reproduction in other forums is permitted, provided the original author(s) and the copyright owner(s) are credited and that the original publication in this journal is cited, in accordance with accepted academic practice. No use, distribution or reproduction is permitted which does not comply with these terms.
*Correspondence: Luca Corti, luca.corti@unimi.it