Shoreline Dynamics Along a Developed River Mouth Barrier Island: Multi-Decadal Cycles of Erosion and Event-Driven Mitigation
 Christopher J. Hein1*
  Andrew R. Fallon1 Peter Rosen2
  Porter Hoagland3
  Ioannis Y. Georgiou4
  Duncan M. FitzGerald5 Michael Morris6 Sarah Baker7,8
  George B. Marino7,9
  Gregory Fitzsimons10
- 1Department of Physical Sciences, Virginia Institute of Marine Science, William & Mary, Williamsburg, VA, United States
- 2College of Science, Northeastern University, Boston, MA, United States
- 3Marine Policy Center, Woods Hole Oceanographic Institution, Falmouth, MA, United States
- 4Department of Earth and Environmental Sciences, The University of New Orleans, New Orleans, LA, United States
- 5Department of Earth & Environment, Boston University, Boston, MA, United States
- 6Storm Surge: The Merrimack Valley Coastal Adaptation Workgroup, Newburyport, MA, United States
- 7Department of Geology, William & Mary, Williamsburg, VA, United States
- 8Department of Earth and Ocean Sciences, University of North Carolina Wilmington, Wilmington, NC, United States
- 9Department of Geography, University of South Carolina, Columbia, SC, United States
- 10Graduate School of Education, University of Massachusetts Lowell, Lowell, MA, United States
Human modifications in response to erosion have altered the natural transport of sediment to and across the coastal zone, thereby potentially exacerbating the impacts of future erosive events. Using a combination of historical shoreline-change mapping, sediment sampling, three-dimensional beach surveys, and hydrodynamic modeling of nearshore and inlet processes, this study explored the feedbacks between periodic coastal erosion patterns and associated mitigation responses, focusing on the open-ocean and inner-inlet beaches of Plum Island and the Merrimack River Inlet, Massachusetts, United States. Installation of river-mouth jetties in the early 20th century stabilized the inlet, allowing residential development in northern Plum Island, but triggering successive, multi-decadal cycles of alternating beach erosion and accretion along the inner-inlet and oceanfront beaches. At a finer spatial scale, the formation and southerly migration of an erosion “hotspot” (a setback of the high-water line by ∼100 m) occurs regularly (every 25–40 years) in response to the refraction of northeast storm waves around the ebb-tidal delta. Growth of the delta progressively shifts the focus of storm wave energy further down-shore, replenishing updrift segments with sand through the detachment, landward migration, and shoreline-welding of swash bars. Monitoring recent hotspot migration (2008–2014) demonstrates erosion (>30,000 m3 of sand) along a 350-m section of beach in 6 months, followed by recovery, as the hotspot migrated further south. In response to these erosion cycles, local residents and governmental agencies attempted to protect shorefront properties with a variety of soft and hard structures. The latter have provided protection to some homes, but enhanced erosion elsewhere. Although the local community is in broad agreement about the need to plan for long-term coastal changes associated with sea-level rise and increased storminess, real-time responses have involved reactions mainly to short-term (<5 years) erosion threats. A collective consensus for sustainable management of this area is lacking and the development of a longer-term adaptive perspective needed for proper planning has been elusive. With a deepening understanding of multi-decadal coastal dynamics, including a characterization of the relative contributions of both nature and humans, we can be more optimistic that adaptations beyond mere reactions to shoreline change are achievable.
Introduction
Developed beaches exist in a dynamic, coupled state, impacted by natural forcings (e.g., waves, tides, and storms) acting upon sedimentary landscapes that reflect the legacy of millennia of climate change and hundreds of years of local and distant human alterations (Figure 1). For example, the delivery of river-derived sediment to the coast has been altered by land-use/land-cover changes, sediment quarrying and mining, embankment installation, land reclamation and river engineering, and damming (e.g., Wang et al., 2007; Milliman and Farnsworth, 2011; Yang et al., 2011; Frings et al., 2015). Coupled with long-term impacts from accelerating sea-level rise (Nerem et al., 2018), updrift shoreline hardening, and storms which are likely increasing in both frequency and intensity (Donnelly et al., 2015), human alterations have caused widespread beach erosion and land loss (e.g., Inman and Jenkins, 1984; Jiménez and Sánchez-Arcilla, 1993; Van Rijn, 2011; El Mrini et al., 2012; Houston and Dean, 2015). Along beaches where development has encroached upon backbarrier or ocean-front shores, this erosion is responsible for ca. $500 million per year in property losses (land losses and structure damages) in the United States alone (The Heinz Center, 2000; NOAA Office of Ocean and Coastal Resource Management, 2013).
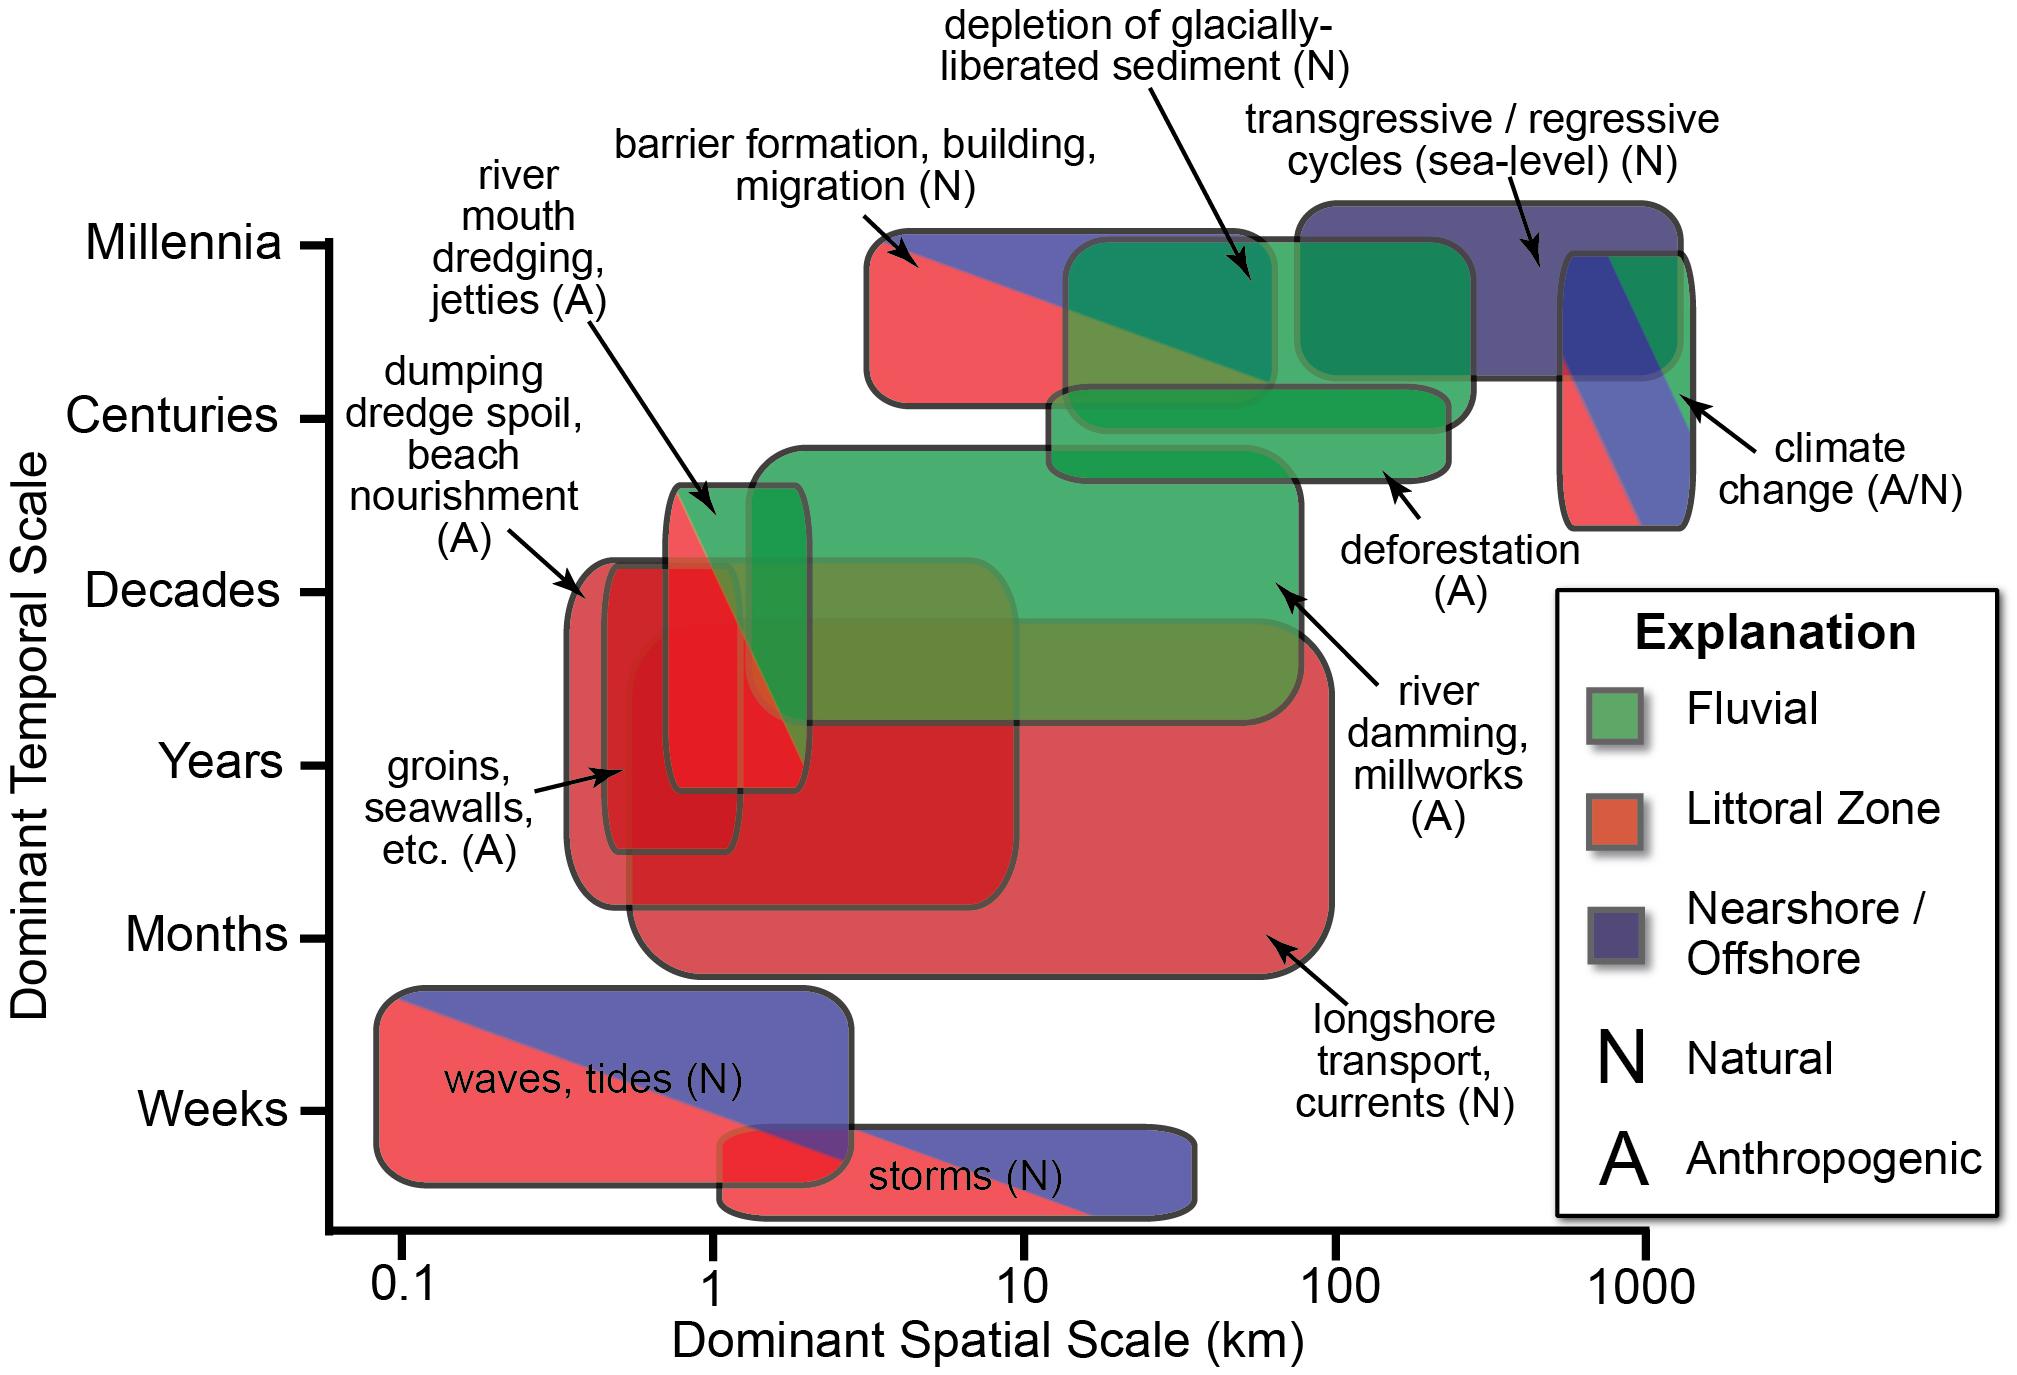
Figure 1. Conceptual model of the natural and anthropogenic factors influencing sediment delivery to and along coastal zones across spatial and temporal scales.
When natural processes place human populations and infrastructure at risk, the traditional response is to try to mitigate damages to property and communities. Coastal communities may be forced to respond to erosional conditions triggered by global-scale climate change either by reacting in the short-term or by adapting in the long-term. Short-term reactions have occurred typically at timescales of years to decades, involving the emplacement of artificial hard-protection structures [jetties, groins, sea walls, bluff-stabilization measures, breakwaters, etc.; see Pilkey and Wright (1988), French (2001), and Taylor et al. (2004) for discussion of engineering approaches and environmental consequences] and application of soft engineering solutions (beach nourishment, scraping, and draining). In contrast, longer-term adaptation, including possibly a retreat from the coast, often has been seen as a policy of last resort, to be avoided at all cost. Adaptation to a changing coastal landscape would involve accepting the loss of infrastructure, proactively moving infrastructure, or encouraging flooding of low-lying areas to promote creation of wetlands and riparian zones as a “natural” defense (Cooper and McKenna, 2008).
In high-density urban areas, the values of human welfare and protected infrastructure typically outweigh the costs of emplacing hard structures (e.g., New Orleans, Greater New York area; Granja and Carvalho, 2000; Cooper and McKenna, 2008). The same cannot always be said for more vulnerable, but often less economically relevant, coasts situated distal to major urban centers; these nonetheless may be of high ecological value (Armaroli et al., 2012). Unfortunately, a clear understanding of the natural system, including potential changes to ecosystem services, often has been lacking in these decision-making processes (Gowan et al., 2006). As a result, the first option is generally physical intervention, often using some of the same techniques responsible for disrupting natural sedimentation patterns in the first place. These interventions have largely disrupted the natural pathways for redistribution of sediments within the littoral zone (Pilkey and Clayton, 1989; Nordstrom, 2000; Charlier et al., 2005; Defeo et al., 2009), resulting in localized erosion and deposition hotspots, modification of overall beach geomorphology (McLachlan, 1996; Fallon et al., 2015) and increased risk of local flooding (Bernatchez et al., 2011).
Here, we present the results of a case study of beach morphologic change over timescales of months to multiple decades along one such developed and stabilized beach-inlet system: Plum Island and the Merrimack River Inlet, Massachusetts (United States). Using a combination of historical shoreline-change mapping, sedimentology, monthly three-dimensional beach surveys, and hydrodynamic modeling of nearshore and inlet processes, we reconstruct the causes for alternating erosion and accretion along this inlet-beach system, and explore the history of reactionary, and occasionally counter-intuitive, community responses to these changes.
A Coupled River-Mouth Inlet and Beach: Plum Island, Massachusetts (United States)
Coastal Geologic Setting
Plum Island is a 13-km long, mixed-energy, tide-dominated barrier island located along the formerly glaciated western coast of the Gulf of Maine (Figure 2). To the north, the island abuts the Merrimack River, which has a seasonal discharge ranging from 50 m3/s during late summers to 1,500 m3/s during spring freshets (Ralston et al., 2010). Behind Plum Island are a number of small estuaries that feed into the Great Marsh and Plum Island Sound (Hein et al., 2012). The mean tidal range near the mouth of the Merrimack River is 2.5 m, reaching a maximum of 4 m during spring tides (Ralston et al., 2010), and in the backbarrier, tidal range is attenuated by 10–15% (Zhao et al., 2010). Tidal currents near the mouth of the river and tidal inlet system commonly exceed ∼1 m/s (Ralston et al., 2010). Along the coast, Zhao et al. (2010) reported residual currents nearing 1 m/s directed south around the Merrimack River ebb-tidal delta, which in turn cause a recirculation zone in the nearshore areas of Plum Island. Residual currents in the central portion of the island reach ∼0.3 m/s directed toward the north, and increase to ca. 0.5–0.7 m/s in the northern portion of the island, near the Merrimack River mouth. The average significant wave height along this coast is ca. 1 m (Abele, 1977) and predominant waves are from the east-southeast (90–180°) during low-energy periods (late spring through summer). However, dominant wave energy is associated with the passage of ca. 15–20 extratropical storms (northeast storms, or “nor’easters”) during winter and early spring, producing waves from the northeast (0–90°) with offshore wave heights of 4–8 m (Li et al., 2018). A wave analysis for these large storms (Woods Hole Group, 2017) revealed that the highest energy events (42% of total; wave heights of ∼6–8 m) approach from 55–100 azimuth degrees.
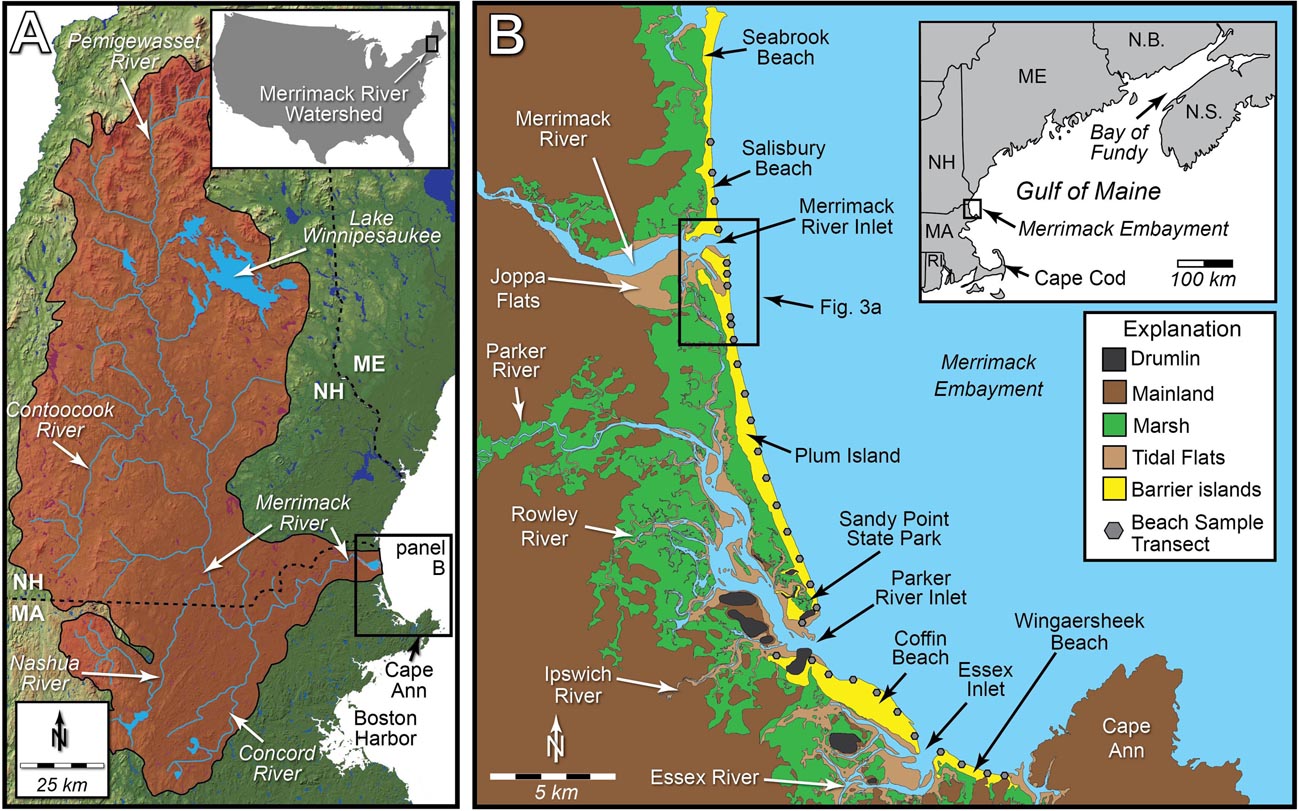
Figure 2. Study area: Plum Island, MA. (A) Drainage basin of the Merrimack River, which delivers an average annual bedload (sand) volume of 4.16 × 10⁴ m3/yr to the coast since at least the mid-1900s (Hein et al., 2012). Modified from Hein et al. (2014). (B) The mixed-energy, tide-dominated coast of the Merrimack Embayment in northern Massachusetts, United States (western Gulf of Maine), showing locations of beach sediment sampling transects. Modified from Hein et al. (2012).
Plum Island built from sediment derived from nearshore marine deposits and upstream glacial-fluvial deposits sourced from the Merrimack River, which disgorges through the Merrimack River Inlet at the northern end of the barrier. The geologic evolution of Plum Island was strongly influenced by a complex sea-level history that resulted from the combined forcings of global eustatic sea-level rise and regional glacio- and hydro-isostatic adjustments (Hein et al., 2012, 2014). Plum Island stabilized in its modern position about 3,500–4,000 years ago, following a deceleration of relative sea-level rise to near modern rates, and has since undergone 3,000 years of aggradation, elongation, and progradation within a regime of relative stability (non-migration) (Hein et al., 2012).
Shoreline-Change and
Sediment-Transport Patterns
Over centennial timescales, Plum Island remains relatively stable, eroding at the statistically insignificant rate of 0.09 ± 0.60 m yr-1 (Executive Office of Energy and Environmental Affairs [EOEEA], 2010; Thieler et al., 2013). This largely reflects the continued input of sand-sized sediment from the Merrimack River (average freshwater discharge = 6.5 km3 yr-1; Milliman and Farnsworth, 2011). Headed in the White Mountains of New Hampshire (Figure 2A), this river drains regions dominated by granitic plutons that have been eroded to quartzose, sandy glacial deposits (FitzGerald et al., 2005; Hein et al., 2014). The Merrimack River empties into a drowned river valley that contains extensive tidal flats composed of sand and mud. Sediment discharge (largely sand and fine gravel) is episodic, dominated by high-discharge events associated with the passage of hurricanes and extratropical storms (Hill et al., 2004) and by spring freshets produced by melting snow accompanying high precipitation events (FitzGerald et al., 2002; Brothers et al., 2008). Ebb-dominated bedforms at the inlet and southeasterly oriented sandwaves on the ebb delta indicate seaward and southerly sand transport. This corroborates sedimentologic evidence of a southerly fining trend across the ebb delta (FitzGerald et al., 1994) and is supported by simulated residual currents within the inlet and around the ebb-delta showing strong currents to the east (∼0.3–0.4 m/s) and south (∼1 m/s), respectively (Zhao et al., 2010).
The southern ∼10 km of Plum Island (Figure 2B) is preserved from development as part of the Parker River National Wildlife Refuge (PRNWR; United States Fish and Wildlife Federation) and the Sandy Point State Reservation (Commonwealth of Massachusetts), which together draw nearly 250,000 recreational visitors each year (Sexton et al., 2012). However, over the past century, the northern 3 km of Plum Island—that bordering the Merrimack River Inlet—have been developed extensively with ca. 1200 residential properties and >100 roads (Fallon et al., 2017) as parts of the towns of Newburyport (northern half, including the inlet-facing “Reservation Terrace” beach) and Newbury (southern ca. 2.3 km of ocean-facing beach) (Figure 3A). Historically, the Merrimack River Inlet underwent a series of major ebb-delta breaching events on an approximate centennial timescale in response to the development of a hydraulically inefficient southerly deflection of the main ebb channel caused by a longshore transport driven by dominant northeast storms (Nichols, 1942; FitzGerald, 1993; Watts and Zarillo, 2013; Hein et al., 2016). Sand released from inlet channel-margin linear bars and swash bars during the most recent of these events in the early 1800s migrated onshore, eventually welding to Plum Island. By 1851, the remnant ebb-delta sand shoals formed a narrow, northward-elongating, subaerial, arcuate bar (“New Point”), which has since elongated to the north and prograded, largely in response to artificial stabilization of the inlet mouth, enhancing sediment delivery through a local reversal of longshore transport immediately downdrift of the inlet (FitzGerald, 1993; Hein et al., 2016). Navigation hazards associated with these inlet dynamics prompted the United States Army Corps of Engineers (USACE) to construct two inlet-stabilizing jetties, beginning in 1883 and completed in 1905 (South Jetty) and 1914 (North Jetty). These have required semi-regular maintenance, including 14 times between 1900 and 1938 (United States Army, Corps of Engineers [USACE], 1973) and again in the 1960s and 2013–2014 (Li et al., 2018). The USACE continues to dredge the Merrimack River Inlet on roughly a decadal basis (Plumb, 2010), removing over the last ca. 100 years an annual average of 4.16 × 10⁴ m3 of fine sand to fine gravel (Hein et al., 2012).
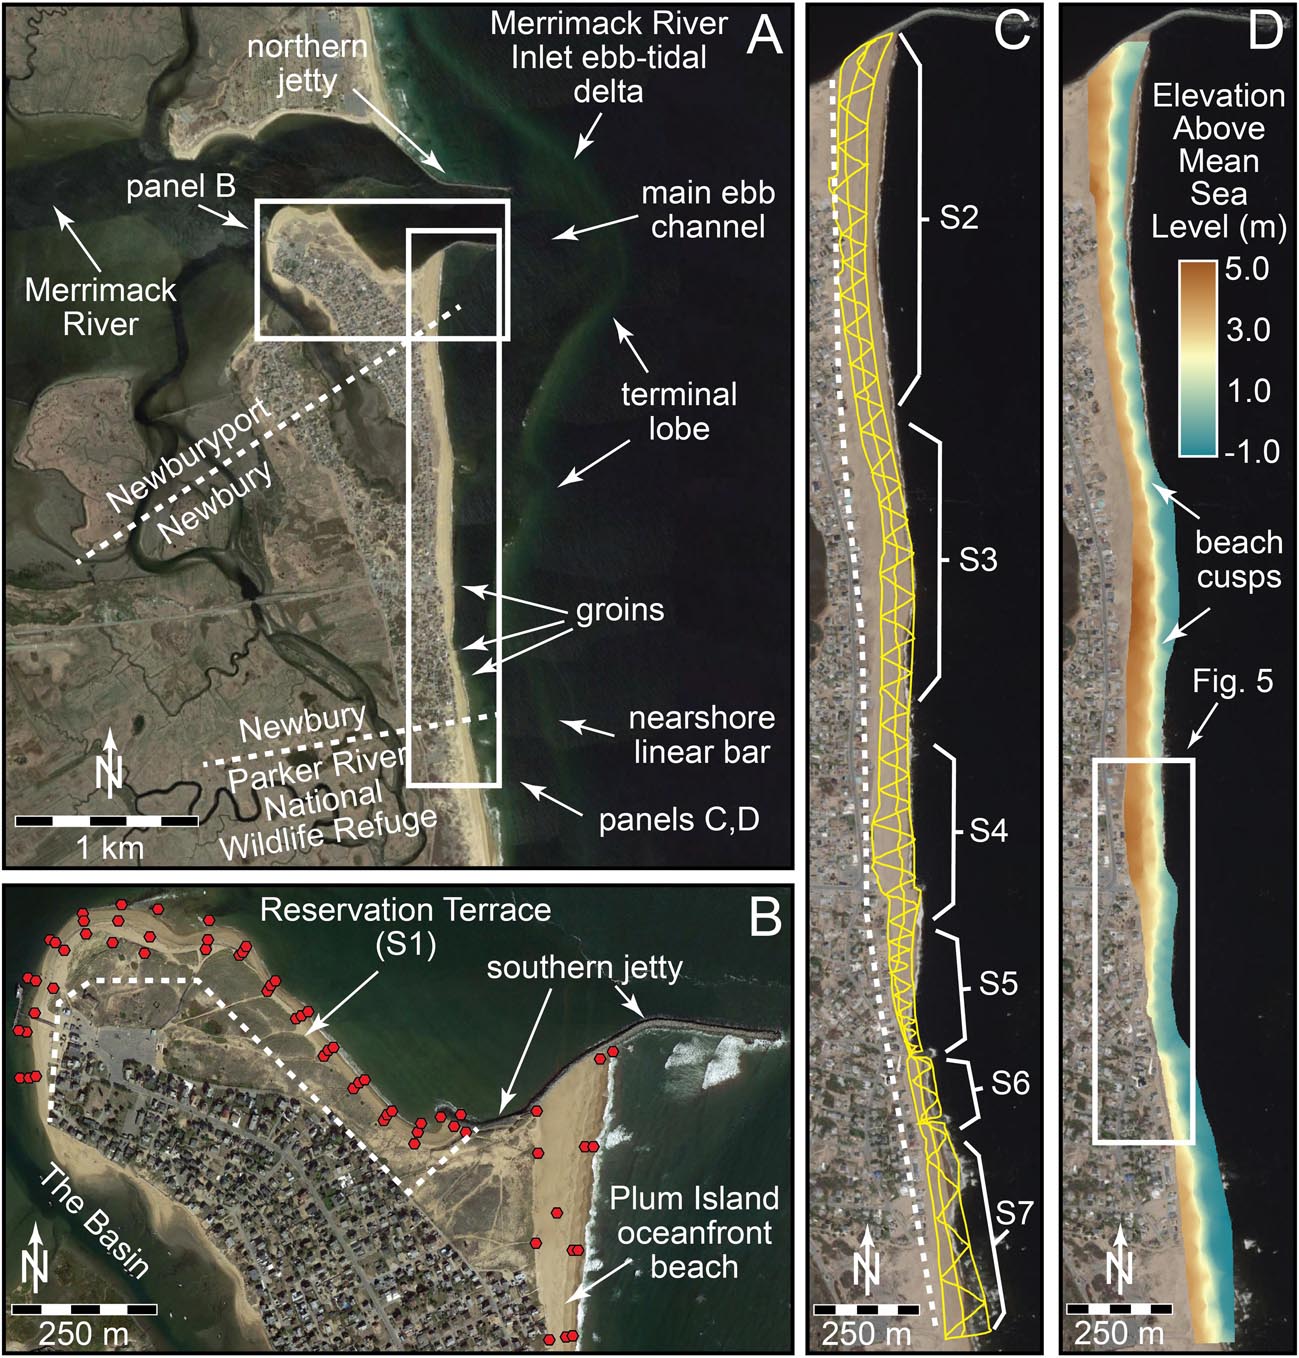
Figure 3. (A) Overview map of northern Plum Island and the Merrimack River Inlet. Background Landsat image: April 27, 2016, from Google EarthTM. (B) Reservation Terrace, located within the Merrimack River Inlet, west-northwest of the southern jetty. Locations of dune toe, mid-beach, and low-tide-terrace samples are shown as red polygons. Background Landsat image is from October 05, 2016, 3 months following sample collection. (C) RTK-GPS transects from May 06, 2014 survey. (D) Post-processed, interpolated digital terrain model for May 06, 2014. Background in (C,D) is 60 cm resolution 2018 Landsat ArcGIS Basemap imagery. Dashed white lines in (B,C) demark landward extent of beach area mapping (Figure 4C). Beach sectors (S) shown in (B,C) are: (S1) Reservation Terrace; (S2) Right Prong; (S3) Salient; (S4) Center Island; (S5) Annapolis Way; (S6) Fordham Way; and (S7) Refuge.
Methods
Historical Shoreline-Change Mapping
Following the methodology of Thieler et al. (2013), historical high-water line (HWL) positions were mapped at 1:1000 scale along the northern, developed, ocean-facing 2.9 km of Plum Island for 19 time periods between 1912 and 2018 (Supplementary Table S1), and for 22 time periods between 1912 and 2018 along the 1.5 km long inlet-facing beach (“Reservation Terrace”; Supplementary Table S2). Historical shorelines (pre-satellite imagery) were derived from digitization of georeferenced NOAA T-sheets. Early T-sheets mark only the drawn boundary of land and water, interpreted as a HWL, but with a higher error than other mapping approaches (Thieler et al., 2013). Two techniques were used to consistently identify the HWL on recent (1970s to present) satellite and georeferenced aerial imagery. First, where possible, the division between dark and light sands on the beach was mapped, indicating the extent of wave run-up during the previous high tide. In the cases where the sand division was either not apparent or the imagery resolution was too poor, the HWL was mapped as the seaward edge of the wrack line.
Along both the northern oceanfront Plum Island beach and Reservation Terrace, we also calculated the beach area between the HWL and a baseline landward of the landward-most mapped historical shorelines (proximal to the seaward extent of development) for each year between 1952 and 2018 (Figures 3B,C, 4). Beach volumes at each time step were then estimated using the United States Army Corps of Engineers guideline that 1 ft2 (0.93 m2) of beach area equals 1 yd3 (0.76 m3) of sand (Figure 4C).
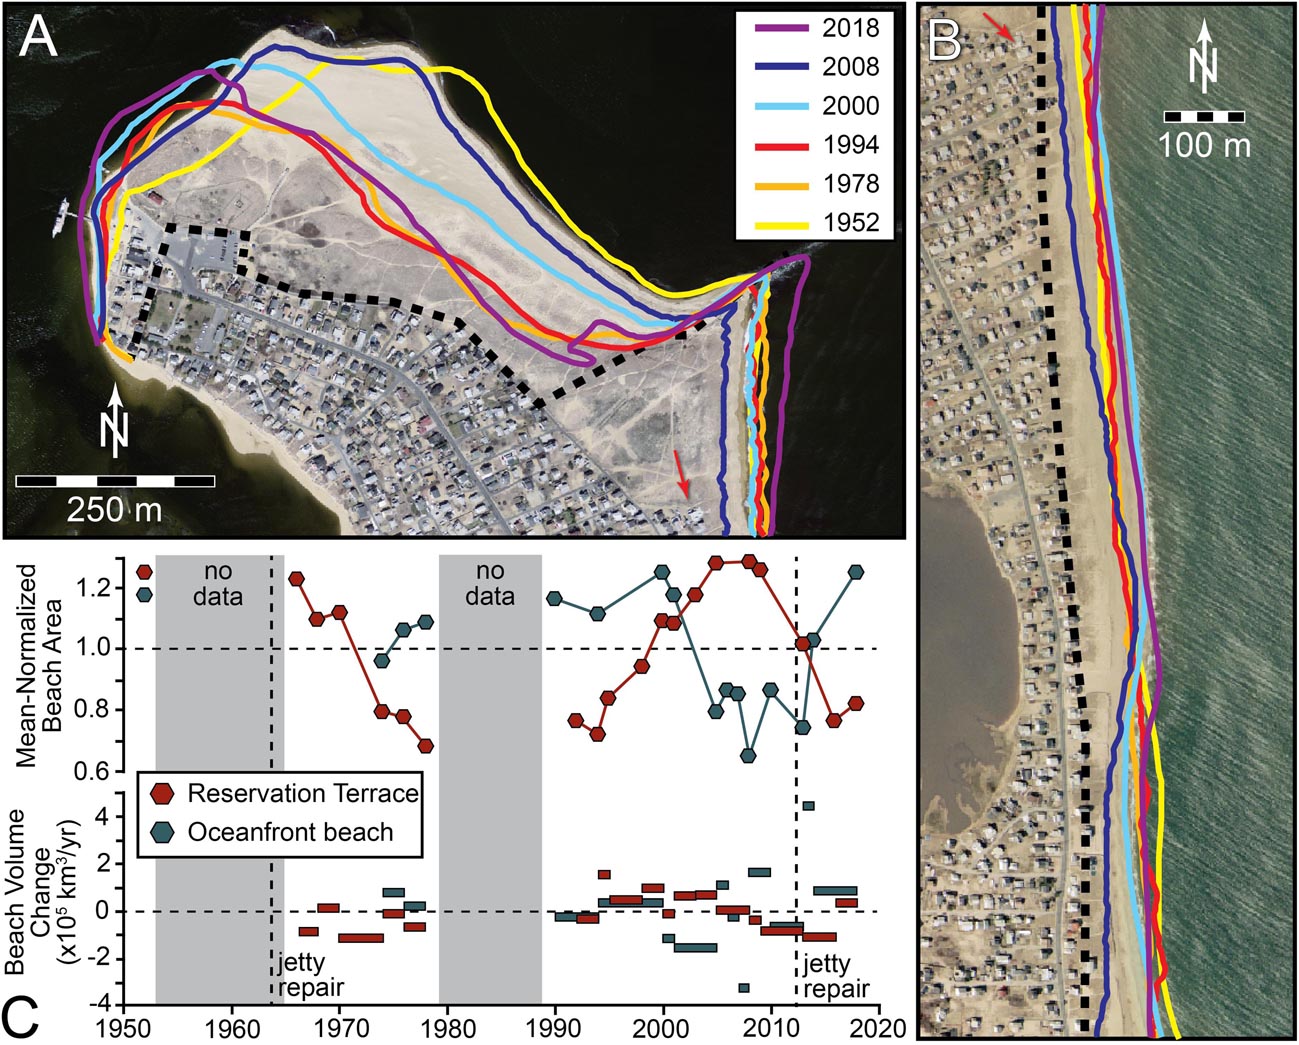
Figure 4. Historical shorelines (1952–2018) along (A) Reservation Terrace (S1); and (B) the Right Prong (S2), Salient (S3), and northern Center Island (S4) portions of Plum Island beach, overlain on 2008 and 2001 imagery (times of near-maximum beach extent for each region), respectively. Scales of (A,B) are the same and red arrow in each points to the same house. Changes in beach area through time (C, top) are normalized to long-term mean area of mapped beach extents [dashed black line in (A,B)]. Annual beach volume fluxes are calculated following the United States Army Corps of Engineers beach area-volume guideline (1 ft2 beach area = 1 yd3 sand).
Mapping uncertainties (Supplementary Tables S1, S2) are estimated based on mapping resolution, historical uncertainty, and, if applicable, rectification image uncertainty, following the methods of Hapke et al. (2011) and Thieler et al. (2013). These are treated as a compilation for each shoreline, thereby creating a single uncertainty value for each paleo-shoreline position. Horizontal shoreline mapping uncertainty is in a range of 0.5–4.3 m, depending on the source. Notably, even the larger error value is well within the range of horizontal shoreline position change (10 s of meters between mapped years).
Beach Surveys
Short-term shoreline-change analysis was conducted via real-time kinematic geographic positioning system (RTK-GPS) surveys collected monthly between December 2013 and January 2015, and a final survey in March 2015. Continuous horizontal and vertical position data along and across the northern, 2.8 km of ocean-fronting Plum Island beach was collected using a Topcon Hiper II RTK-GPS (Figure 3C). Each survey consisted of approximately shore-parallel transects along three primary cross-shore slope knickpoints: dune toe, mid-beach (beach berm, where applicable), and low-tide terrace. These were connected through oblique, crossing tie lines (Figure 3C). Survey point spacing was 1 m; each survey consisted of ca. 15,000 discrete data points. Resulting RTK-GPS data were post-processed (data reduction, base-station correction) and then interpolated via variogram-based kriging [model based on the spatial autocorrelation between data points to account for directional biases (e.g., seaward-sloping beach face); Stein, 2012] in a GIS framework to develop three-dimensional Digital Terrain Models (DTMs) of the survey area. DTMs from each of the 15 months were used to calculate sediment budgets and analyze hotspot-associated and seasonal variations in beach morphology. All DTMs were clipped to the same spatial extent (0.25 km2: 2.9 km along shore, 50–150 m cross-shore; Figure 3D), equivalent to the maximum common area mapped in all 15 surveys. Beach volumes at each time step were calculated as the difference between the beach elevation surface and a horizontal plane (clipped to same extent) at 1.0 m below mean sea level (lowest mapped elevation of low-tide terrace).
Monthly RTK-GPS data have an average error of 0.028 m horizontally and 0.048 m vertically from sampling. Root mean square errors for DTM-based beach sediment volumes is 0.013–0.021, depending on the survey month, reflecting the density of data collected for each survey and along-shore consistency in beach morphology. DTM sediment volume errors are ca.±25,000 m3, less than 5% of the minimum monthly beach volume (605,000 m3). Volume changes of <10% (given an assumed maximum beach volume error of ±5%) are considered insignificant and omitted from analysis.
Sediment Sampling
Near-surface sediments were sampled from the northern, developed, oceanfront Plum Island beach monthly along five transects between June 2014 and December 2014, concurrent with beach surveys. These transects were re-occupied during a supplemental August 2015 sampling period, during which additional samples were collected at ca. 1 km intervals (27 transects total) along the full length of the ocean-facing Plum Island beach and from adjacent beaches (Castle Neck, Coffins Beach, Wingaersheek Beach) (Figure 2B). A final set of surface samples was collected in July 2016 along 21 transects (spacing: ca. 100 m) from Reservation Terrace (Figure 3B). Samples (ca. 100 g dry sand) were collected from 10 cm below the sediment surface from three stations along each transect: central low-tide terrace, beach berm, and the base of the foredune. Where no berm or other break-in-slope was present, samples were collected from the approximate midpoint between the low tide line and the foredune toe.
Samples were dried, split, and organic debris and shell hash were removed by hand-picking. Textural analysis was conducted using a Rapid Sediment Analyzer (settling tube), which estimates grain-size distributions from -1 to 4 φ in 0.125 φ bins based on Stokes’ settling velocities. Grain-size statistics were calculated as per Folk (1968).
Hydrodynamic Modeling
A hydrodynamic model (Delft3D; Lesser et al., 2004), previously developed and validated with deployments in Plum Island Sound, was used to provide time-dependent water level and current velocities in the vicinity of the Merrimack River Inlet. The model resolution varies from ca. 2 km offshore, to 20 m in Plum Island Sound. For this effort, we added a higher-resolution nested domain covering the study focus (northern 3 km of Plum Island and along Reservation Terrace) to examine the role of nearshore waves on observed erosional trends. Selected storm wave conditions, derived from analysis of offshore waves, were simulated to evaluate wave transformation over the nearshore bars and in the inlet, and to elucidate mechanisms that contribute to Plum Island and Reservation Terrace erosion.
Results: Shoreline Change on Northern Plum Island From Months to Decades
Developed portions of Newbury and Newburyport (northern Plum Island) are sub-divided into seven shoreline sectors, from north to south (Figures 3B,C): (S1) Reservation Terrace (beach inside the Merrimack River Inlet; 1,100 m); (S2) Right Prong (850 m); (S3) Salient (600 m); (S4) Center Island (450 m); (S5) Annapolis Way (150 m); (S6) Fordham Way (150 m); and (S7) Refuge (300 m).
Multi-Decadal Shoreline Change
Beaches of Reservation Terrace and oceanfront Plum Island have each undergone periods of advance and retreat since the 1960s (Figure 4). (Low data density prior to this time does not allow for full analysis of decadal shoreline-change trends). Along Reservation Terrace (Figure 4A), the shoreline has migrated such that the undeveloped portion of the Plum Island beach within the Merrimack River Inlet has three times changed in area by a factor of two since the 1960s (Figure 4C), such that the shoreline was in nearly identical positions in 1966 and 2005 and in 1976 and 2018. Although we are unable to locate high-quality shoreline data (high-resolution satellite imagery, shoreline position maps, and aerial imagery) for the 1980s, low-resolution satellite imagery available through the Google Earth Engine1 reveal little shoreline change along Reservation Terrace during this period. Erosion of the northeast-facing, eastern Reservation Terrace beach by up to ca. 250 m is commonly associated with the growth of the smaller, northwestern beach by up to ca. 150 m. However, erosive periods represent a net volume loss of an estimated 8.0 × 10⁵ m3 of sand from Reservation Terrace as compared with periods of near-maximum beach area.
Area change along the oceanfront Plum Island beach (Figure 4B) is similarly cyclical since the 1950s. During most of this time, it is characterized by a stable (non-migrating) dune fronted by a 50–150 m supratidal beach. Erosion of the beach of up to 120 m has occurred a number of times in the past, including in 1912, 1952, and 1974–1976 (Fallon et al., 2015). Our data best capture this as a widespread erosion event between 2008 and 2014 (Figure 4C) when the oceanfront beach volume was reduced by up to ∼8.3 × 10⁵ m3 from its 1990s long-term mean. Following each period of erosion, this shoreline has returned to a long-term, steady state position, during which periods the beach is generally straight and near its maximum width. In contrast, periods of retreat are rarely uniform along the beach. For example, in 1952, an apparent period of near-maximum beach area (Figure 4C), the beach extended up to 150 m from the dune toe (nearly double its 2018 width) near Center Island (S4), but was at its narrowest (ca. 60 m narrower than in 2018) along much of the Right Prong (S2) and Refuge (S7) section of beach. Most commonly, retreat takes the form of a southerly migrating erosion “hot spot” (cf. Kraus and Galgano, 2001), in which more severe (up to 100 m in width) erosion is focused along a beach length of ca. 300–800 m. These are best captured in shoreline data from 1974 to 1978 (Figure 5A) and in the more recent 2008–2018 period (Figure 5B). In both instances, a section of Center Island (S4) beach 300 m (2008) to 450 m (1974) long retreated by 90–100 m from its pre-erosion HWL position. Over the following 4–5 years, this hotspot migrated ca. 600 m south along Annapolis Way (S5), eventually becoming pinned north of the Annapolis Way Groin. During the more severe 2013–2018 erosion period, erosion extended to south of the Fordham Way Groin, the southern-most on the island (Figure 5B).
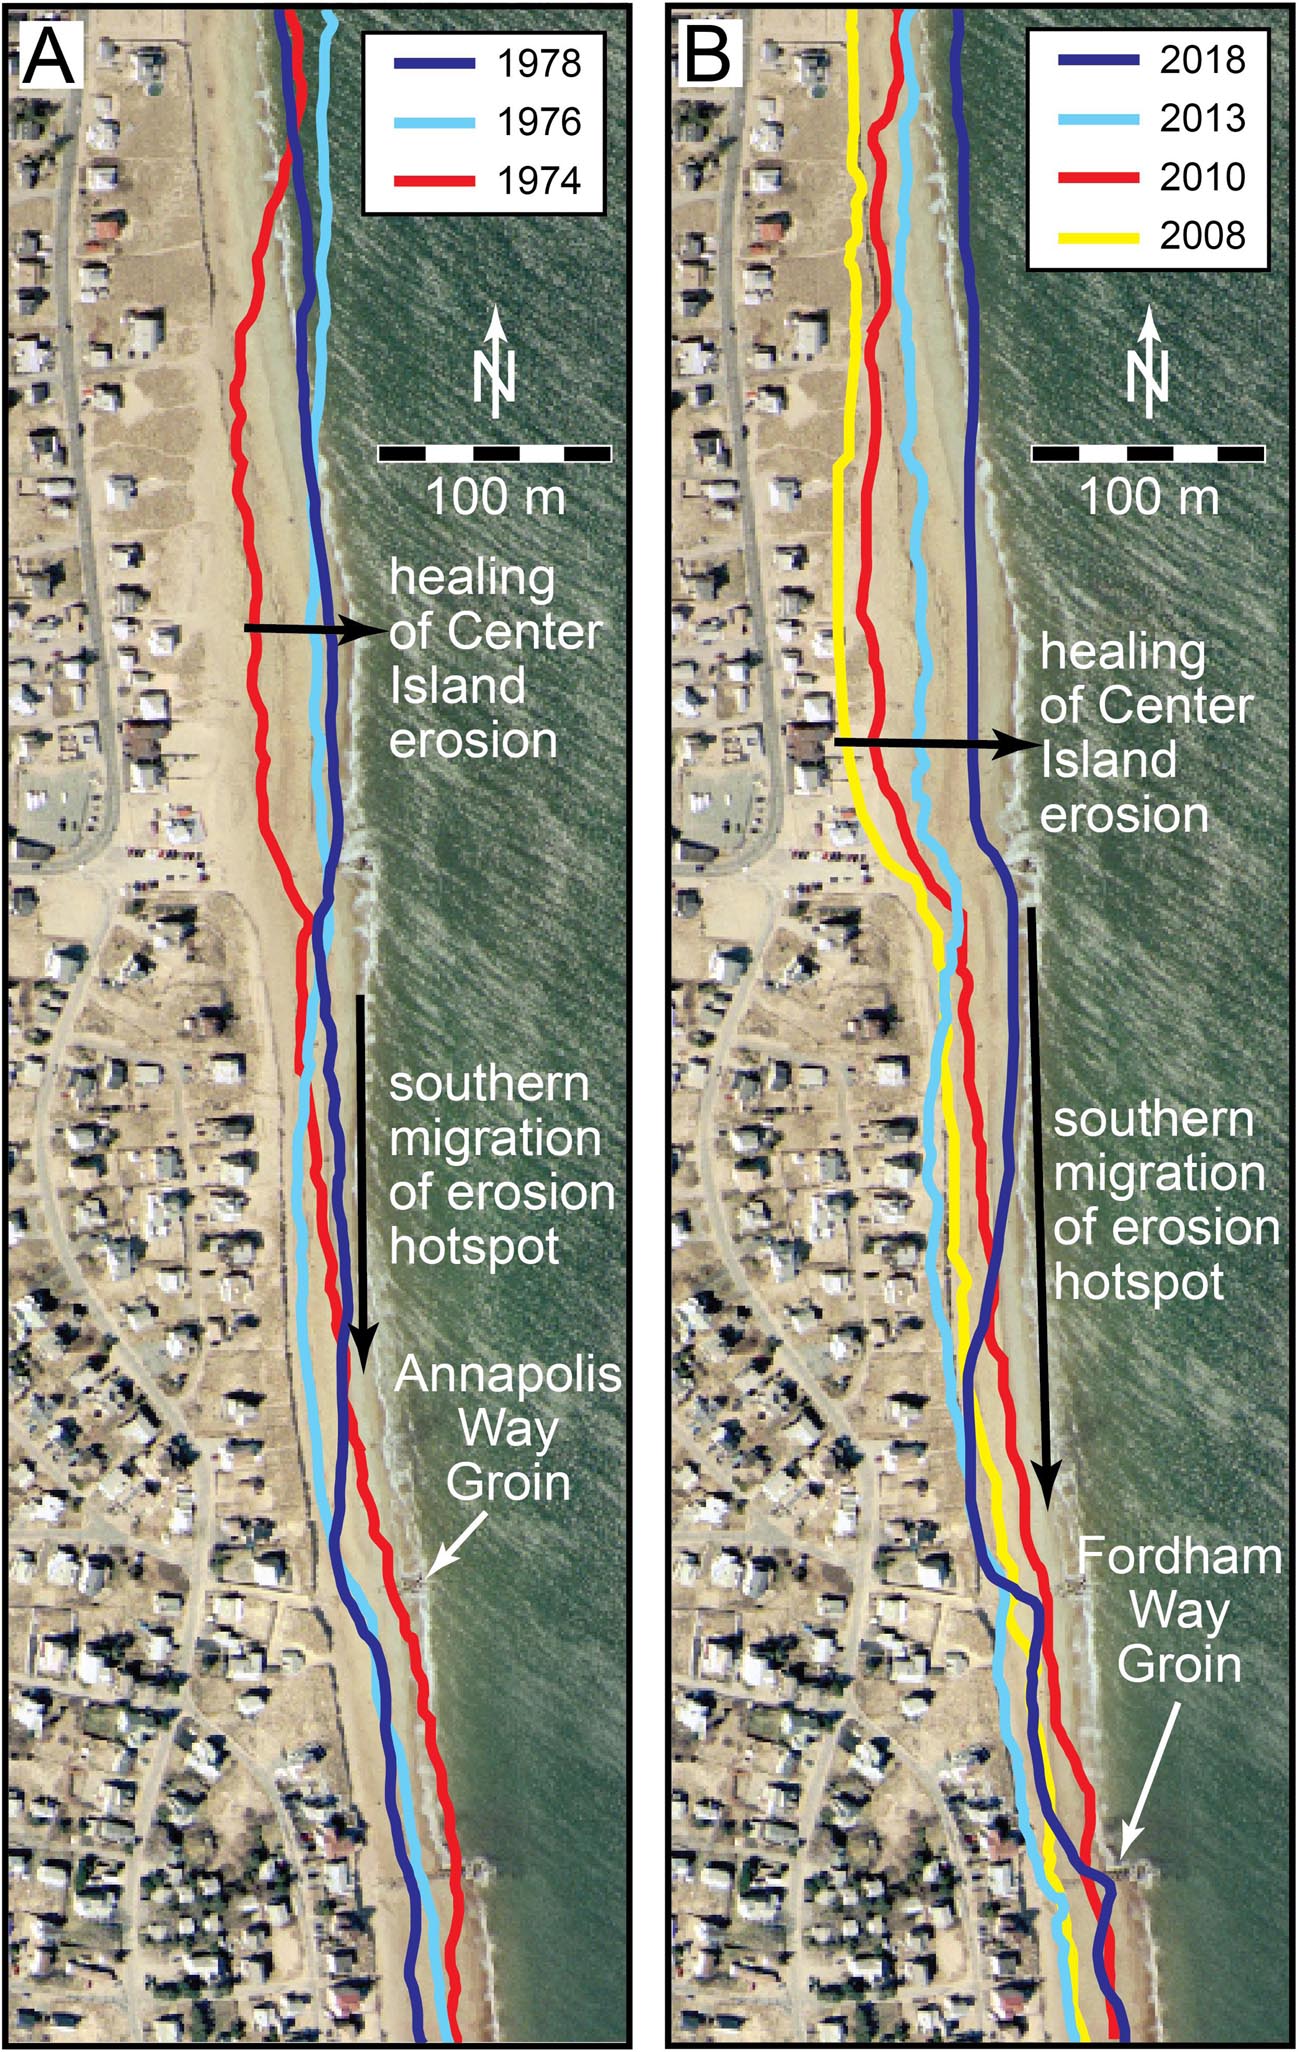
Figure 5. Two phases of erosion hotspot formation and southerly migration along Plum Island beach, as captured in historical high-water shorelines between 1974 and 1978 (A) and 2008 and 2018 (B). Background imagery is 2001 color orthophotos from MassGIS (Commonwealth of Massachusetts EOEA).
Short-Term Beach Volume Changes
During the course of the 16 months of beach surveys conducted between December 2013 and March 2015, the volume of the oceanfront Plum Island beach within the study area changed by 9.5 × 10⁵ m3. The largest change occurred during a period marked by the impact of several nor’easters between November and December 2014 when all sectors of the oceanfront beach experienced erosion; this was followed by a near complete recovery during the relatively calm period between December 2014 and January 2015 (Figure 6A). Normalizing the volume of each subsection of the beach by the volumetric change of the entire beach for that same time period (Figure 6B) allows us to account for changes in beach volume in response to seasonality and storm impacts (which would be expected to impact the whole beach equally) and examine short-term alongshore trends in erosion and accretion. This reveals that the largest month-to-month changes for the Salient (S3), Center Island (S4), Annapolis Way (S5), Fordham Way (S7), and Refuge (S7) sections are 70 m3/m (January 2015), 140 m3/m (January 2014), -75 m3/m (September 2014), 175 m3/m (November 2014) and -139 m3/m (March 2015), respectively. Most notably, between August and September 2014, the beach fronting Annapolis Way (S5) experienced ca. 25,500 m3 (70 m3/m) of accretion as the Fordham Way beach immediately to the south (S6) simultaneously experienced ca. 12,000 m3 (87 m3/m) of net sediment loss (Figure 6B). In the months that followed, the beach fronting Annapolis Way continued to grow: between September 2014 and March 2015, ca. 30,000 m3 (82 m3/m) of sediment accreted along Annapolis Way (Figure 7). The beach fronting Fordham Way also grew through deposition of ca. 8,000 m3 (57 m3/m) of sand during this period, notably along the low-tide terrace, despite the impact of eight storms with wave heights >4 m between September and March surveys (Figure 7).
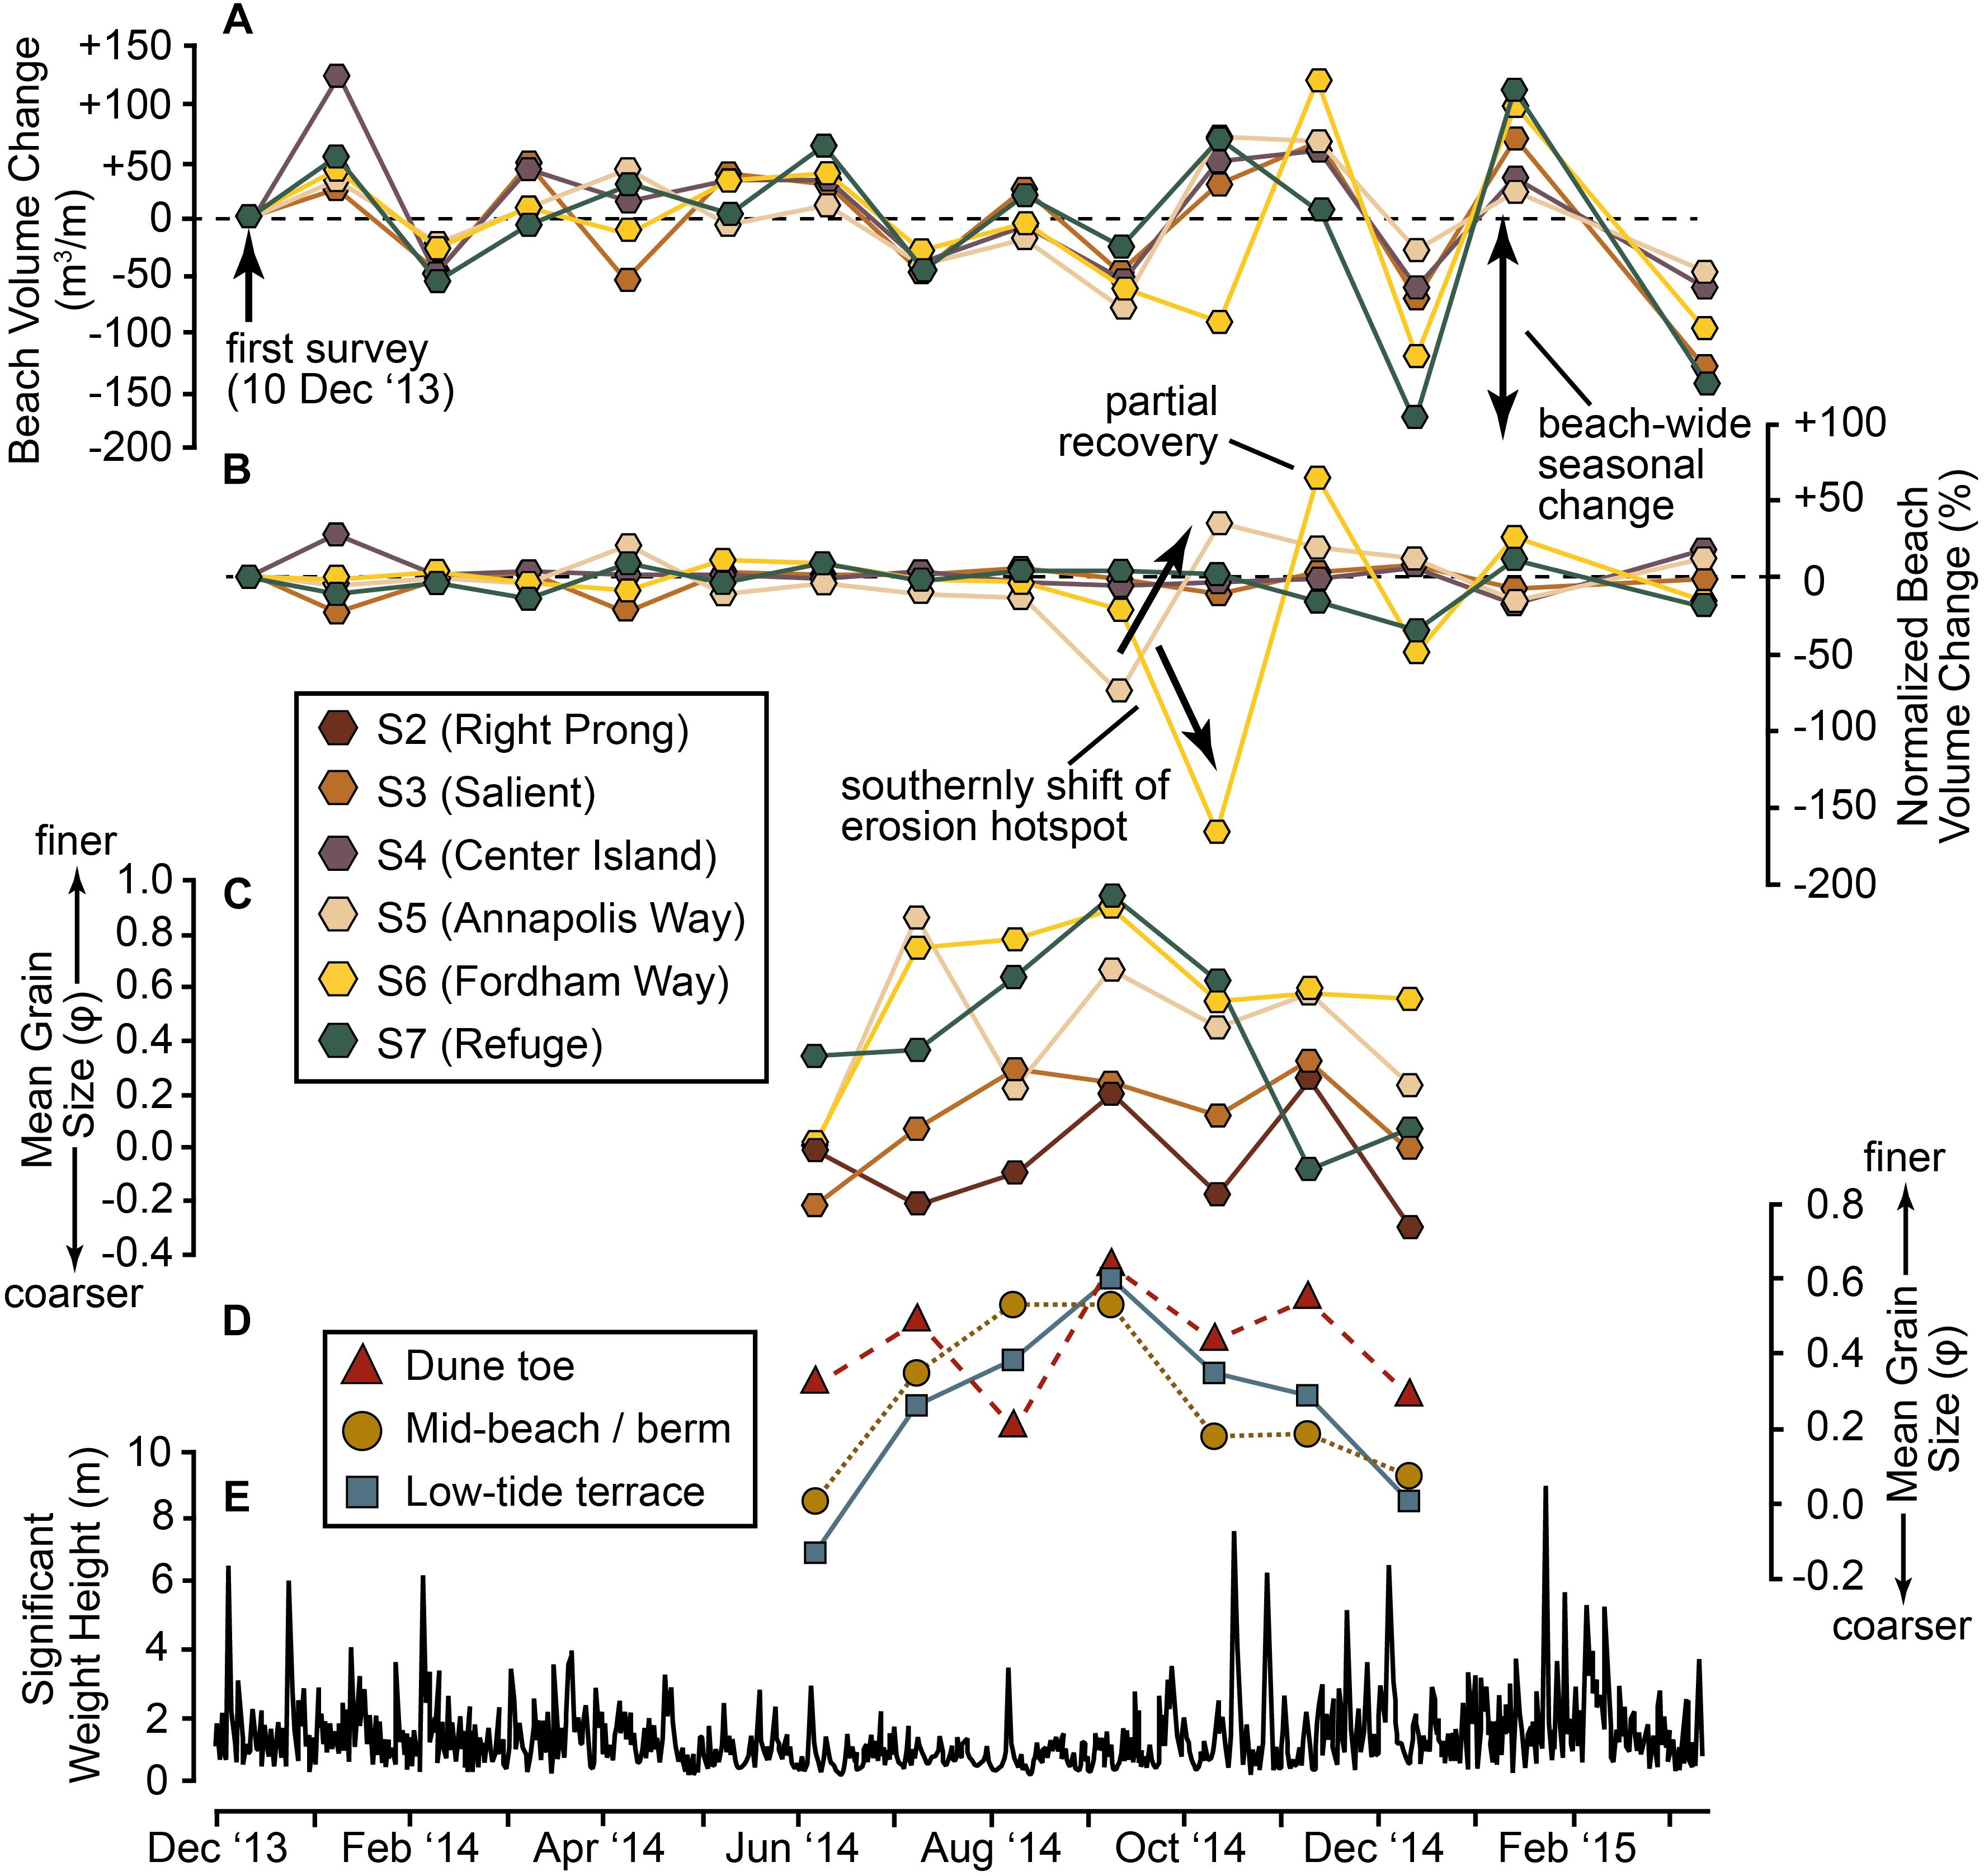
Figure 6. Short-term changes along the northern, ocean-facing Plum Island. (A) Monthly change (difference from previous survey) in beach volume per meter alongshore for northern Plum Island sectors S3–S7. (B) Monthly percent change (difference from previous survey) in beach volume, normalized by volumetric change across the full northern 2.8 km of Plum Island (sectors S2–S7). (C) Average (three sampling stations per transect) monthly mean grain size at each sector. (D) Average (for sectors S2, S3, S5–S7) monthly mean grain size at each sampling point along transects. (E) Significant wave height data are from Jeffery’s Ledge Buoy (NOAA NDBC Station 44098).
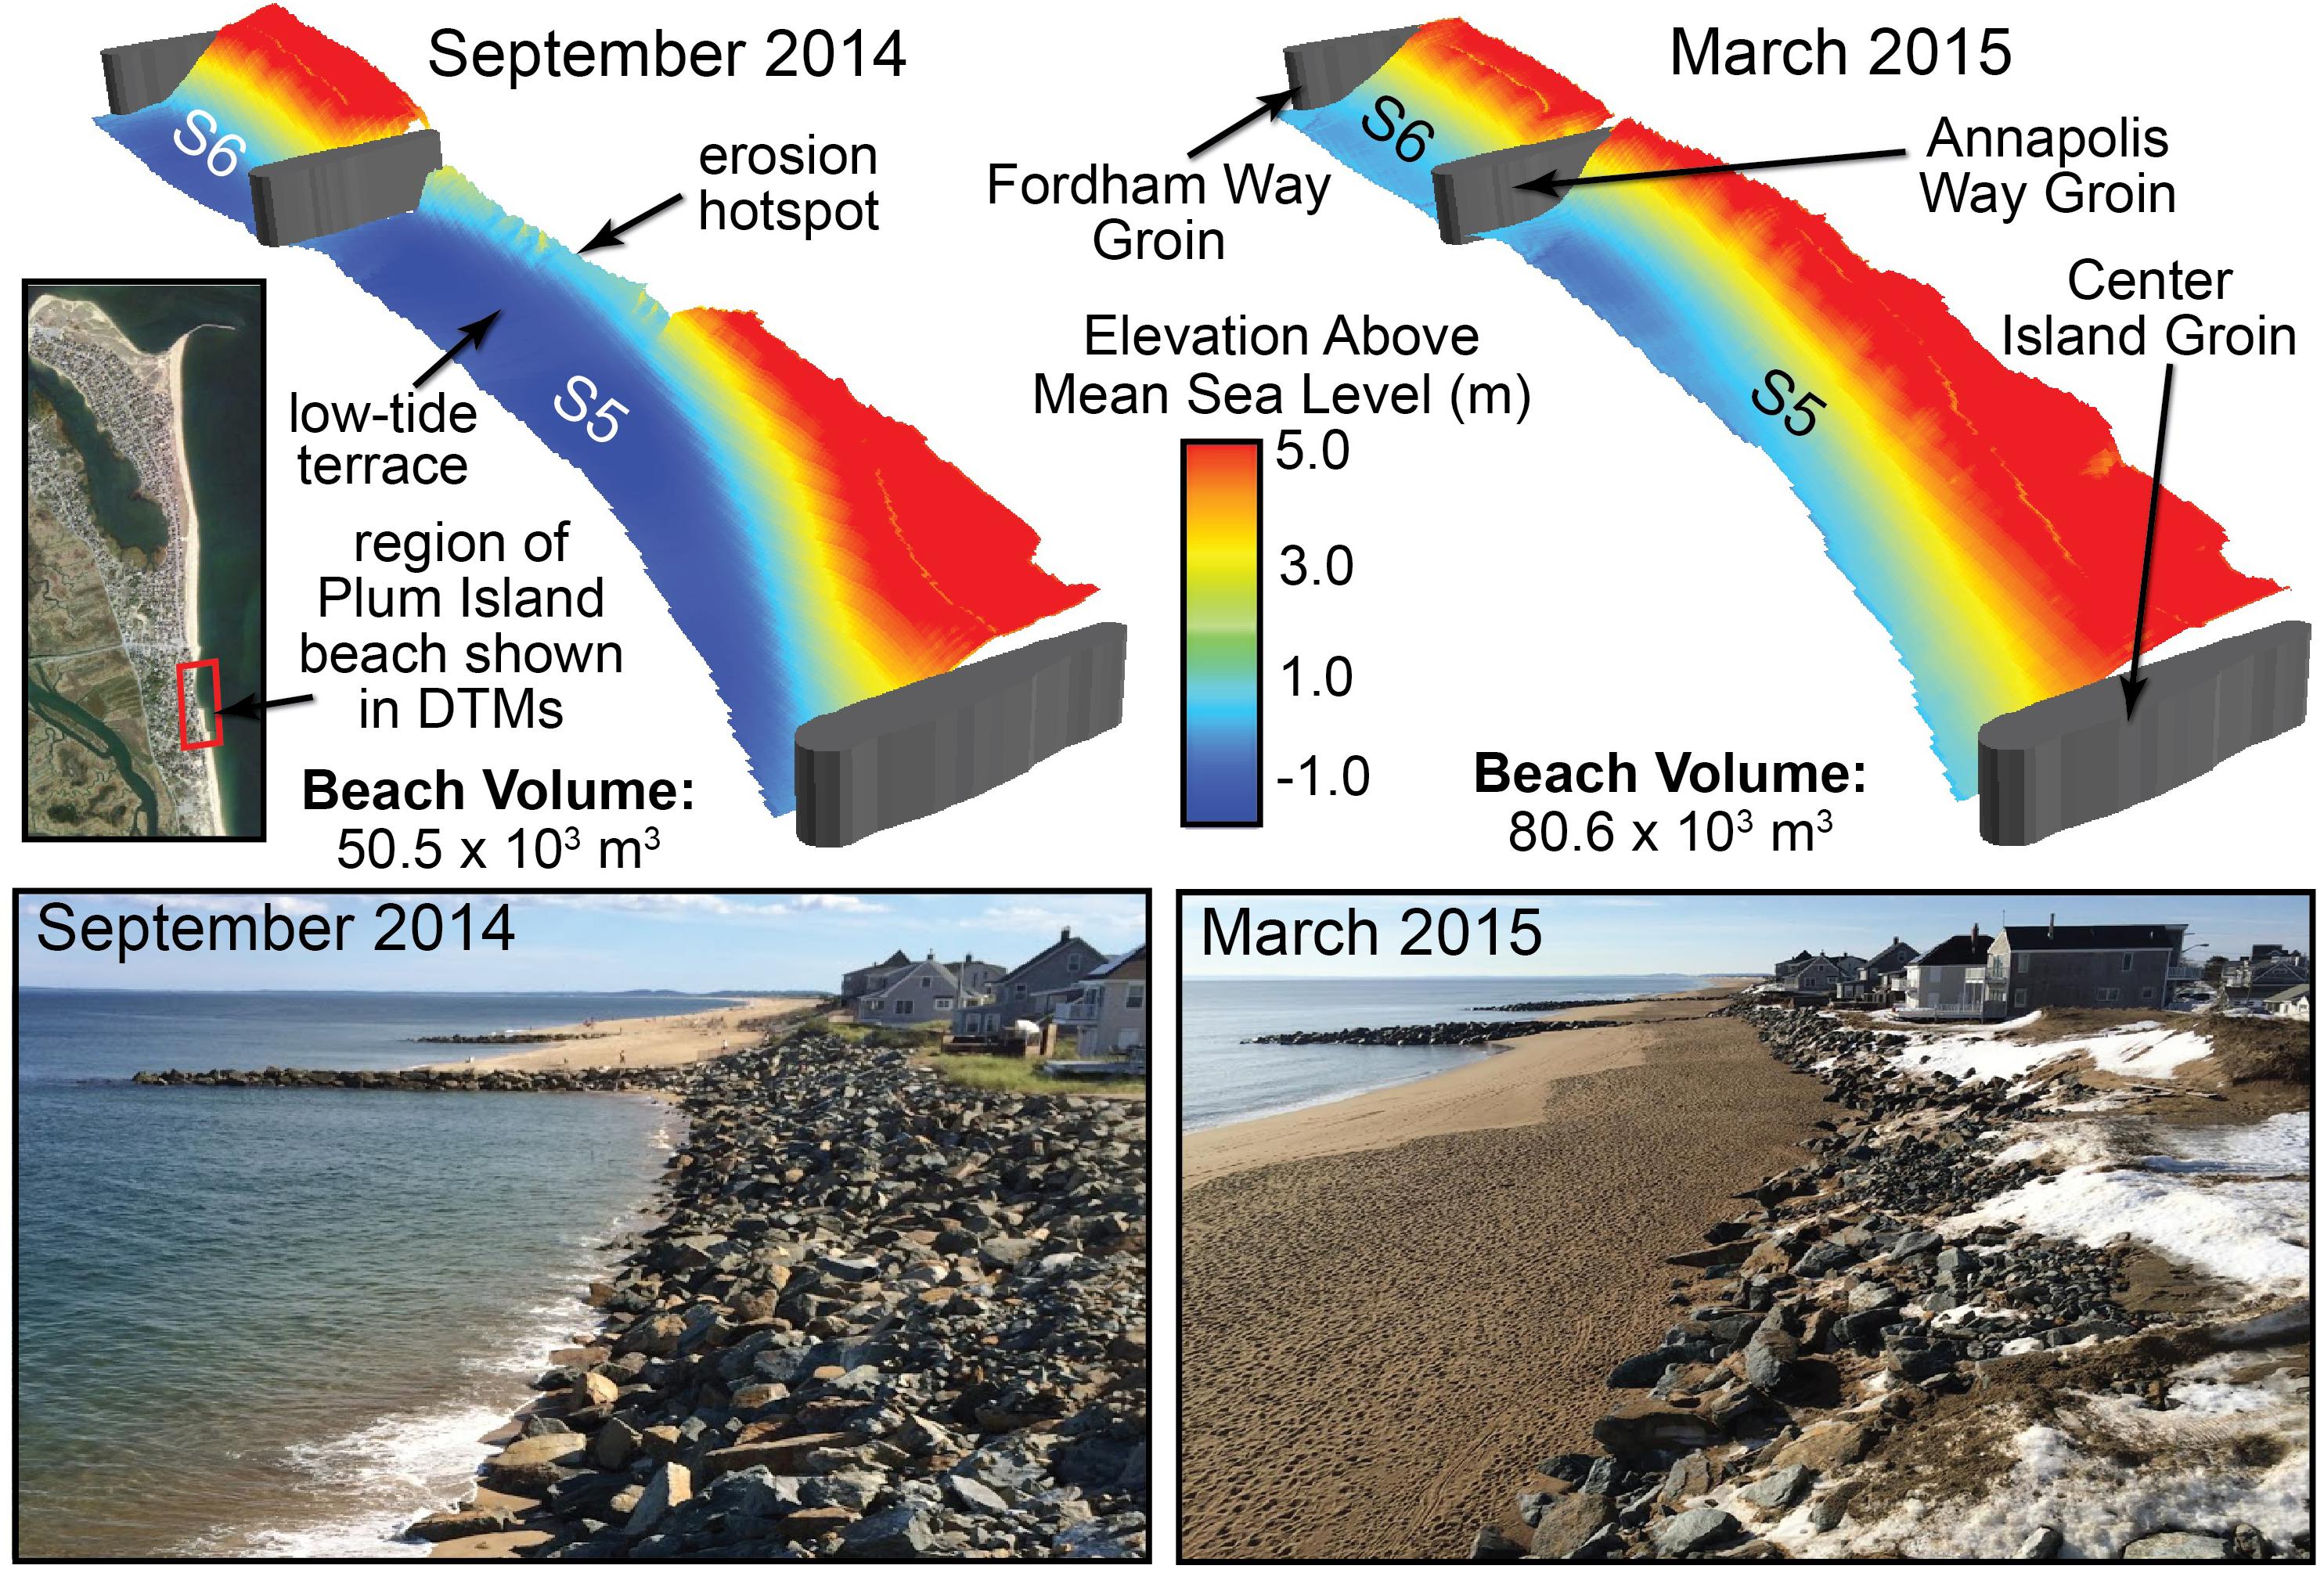
Figure 7. Short-term migration of the erosion “hotspot” to the south along the northern Plum Island beach (see location, Figure 3D) in 2014 (approximately same time as shown in Figure 6) to 2015. Digital topographic models (top) are derived from RTK-GPS surveys (Figures 3C,D). Photos (bottom) are taken at the same period of the tidal cycle (mid- to high tide) looking south, standing along Annapolis Way beach toward Fordham Way beach.
Beach and Dune Sedimentologic Patterns
Mean grain size for dune toe, mid-beach, and low-tide terrace beach samples along each of the 53 sampling transects ranged from 2.11 to -0.46 φ (0.23–1.37 mm), 2.08 to -1.08 φ (0.24–2.11 mm), and 2.22 to -0.09 φ (0.21–1.06 mm), respectively. Nearly all samples show a moderate to high degree of maturity, with insignificant differences between mean and median sizes and sorting values (0.032–0.88) between moderately and very well sorted. Dune samples are, as anticipated, the finest of the three samples taken from along most transects, but beach and low-tide terrace samples become finer than dune sands along Coffins and Wingaersheek beaches (Figure 8). A single sample composed of very coarse sand was sampled from the base of an artificially nourished dune along Annapolis Way. The coarsest beach samples are found ca. 500 m south of the Merrimack River Inlet South Jetty (within the Right Prong beach [S2]). Dune, beach, and low-tide terrace samples generally fine with increasing distance south of the mouth of this point, and to the west of the Merrimack River Inlet along Reservation Terrace (Figure 8). Whereas beach and dune samples gradually fine and show increased maturity (semi-rounded to rounded quartz grains, decreasing rock fragments) to the west along Reservation Terrace beach (S1), low-tide terrace samples are more spatially heterogeneous. In particular, several of the coarsest low-tide terrace samples, collected from the northwest corner of Reservation Terrace, contain abundant coarse (<1 mm diameter) rock fragments, a characteristic not observed along any oceanfront Plum Island samples.
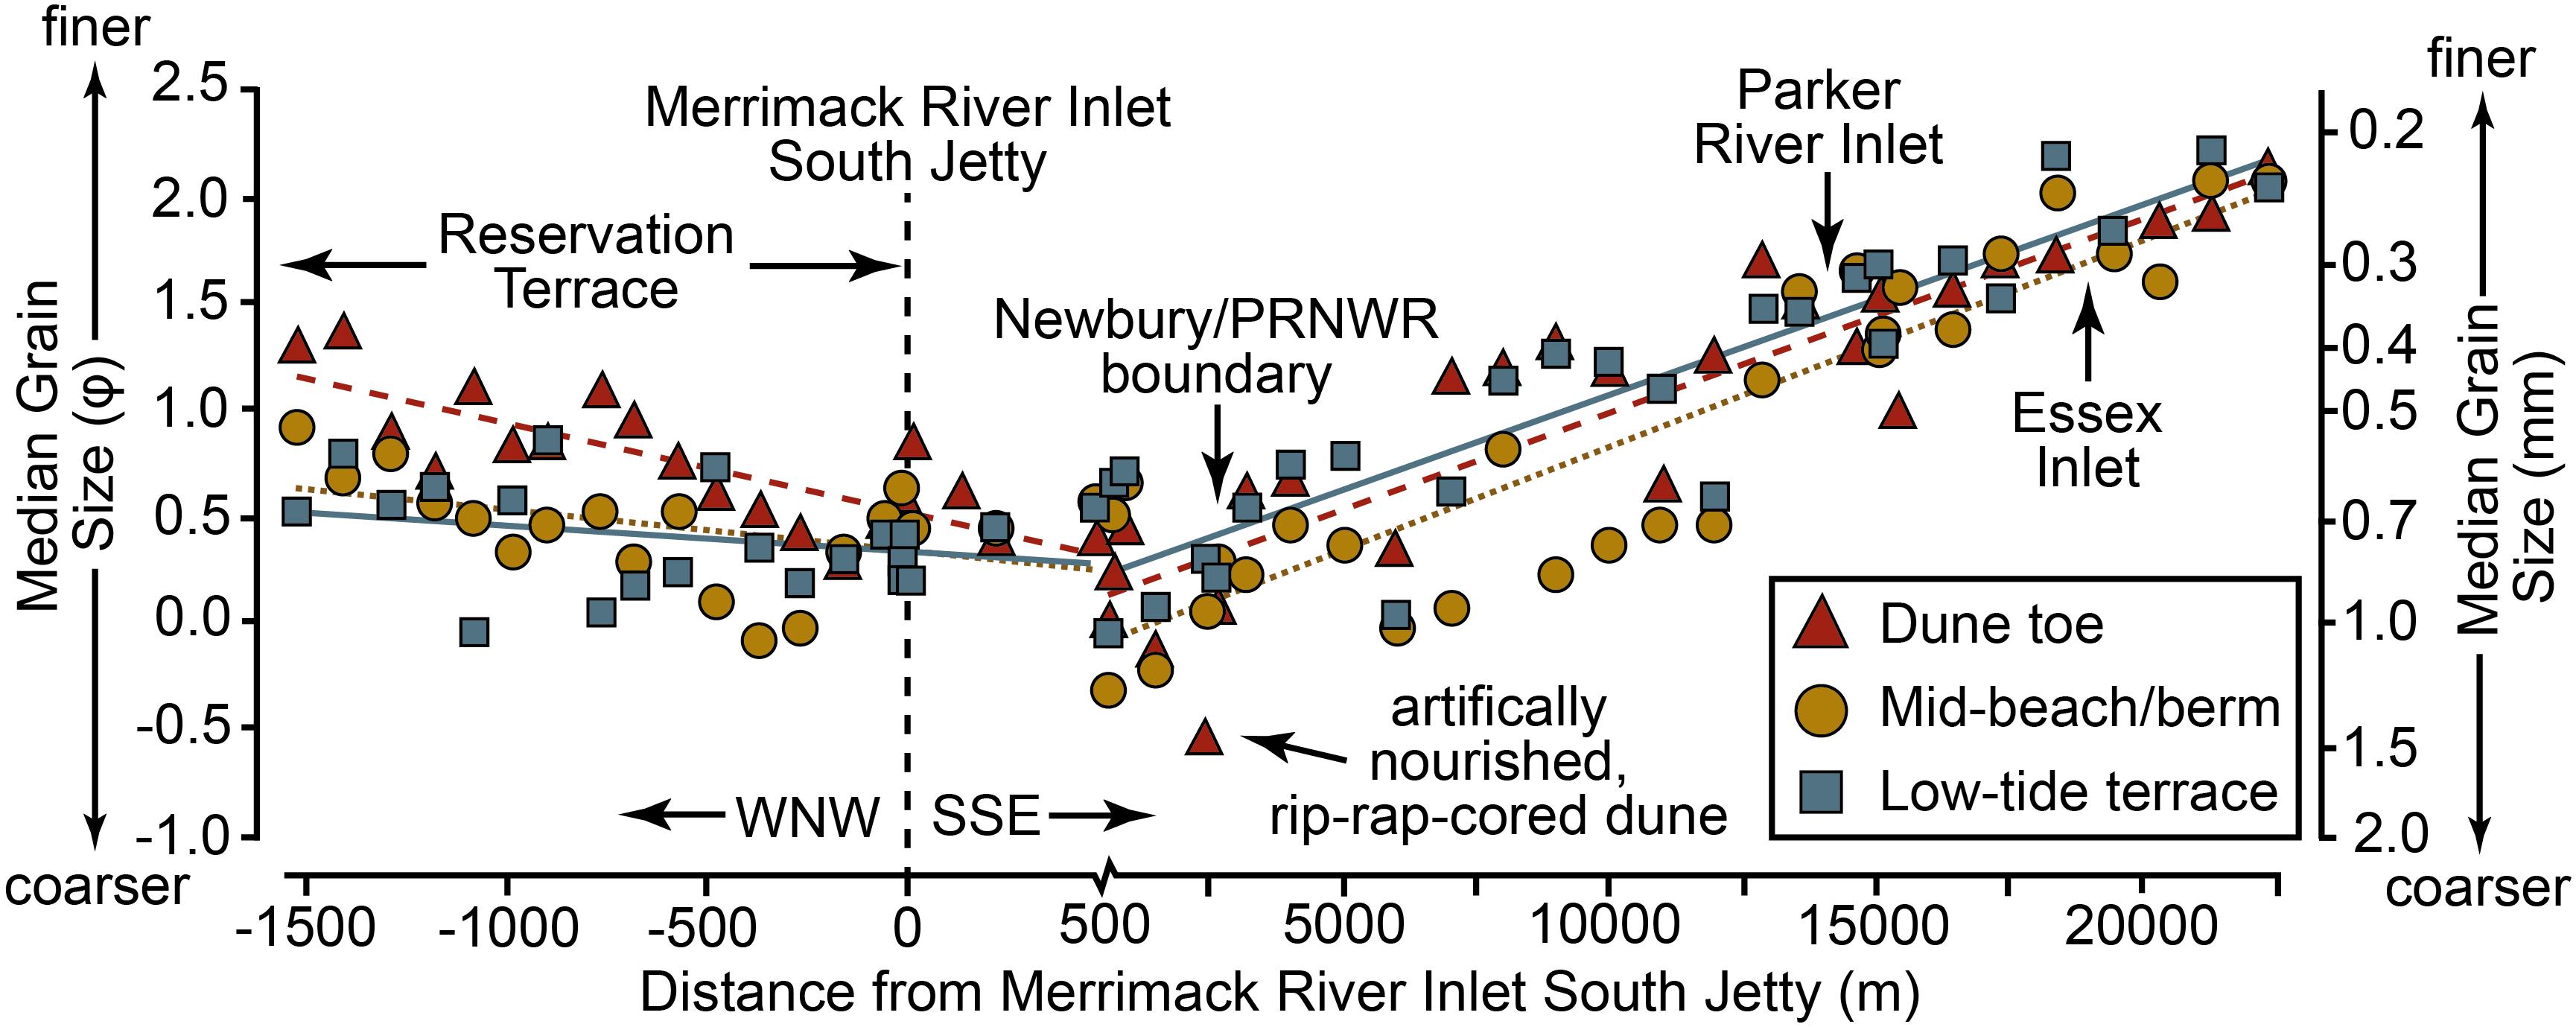
Figure 8. Spatial textural trends in each dune, mid-beach/berm, and low-tide terrace sediment samples collected in August 2015 (south of Merrimack River Inlet) and July 2016 (Reservation Terrace). Note change in axis scale at +500 m.
Seasonal variations in grain size were also observed along the northern, developed oceanfront Plum Island beach (S2–S7): sediments fined during the late summer period marked by low wave energy (July to September) and then coarsened between September and December, notably along the low-tide terrace and mid-beach (Figures 6C,D). In particular, a substantial coarsening is observed along all transects coincident with the period of high wave energy and erosion between November and December 2014 sampling periods. All samples in northern Plum Island remained moderately well to very well sorted (sorting: 0.16–0.85) during the entire sampling period.
Hydrodynamic Modeling
Simulations show that wave transformation across the nearshore bars is controlled by the elevation of the bar crest and bar continuity. The distal ebb delta and terminal lobe bar control wave transmission, while the terminal lobe continuity controls wave refraction (Figure 9A). Storm waves are attenuated by more than 50–60% over the terminal lobe (Figure 9A); the corresponding wave period is reduced by ca. 0.5 s. In the vicinity of the low longshore bar crest leading toward the bar gap, wave transmission is higher: here, wave attenuation is <30% and wave period is nearly unchanged (Figure 9A). Storm waves with northeasterly and southeasterly approach refract differentially across the bar (Figures 9B,C), causing the persistence of large wave-height gradients regardless of the deep-water wave angle (Figure 9D). In the vicinity of the hotspot, significant wave height gradients are approximately 0.5 m.
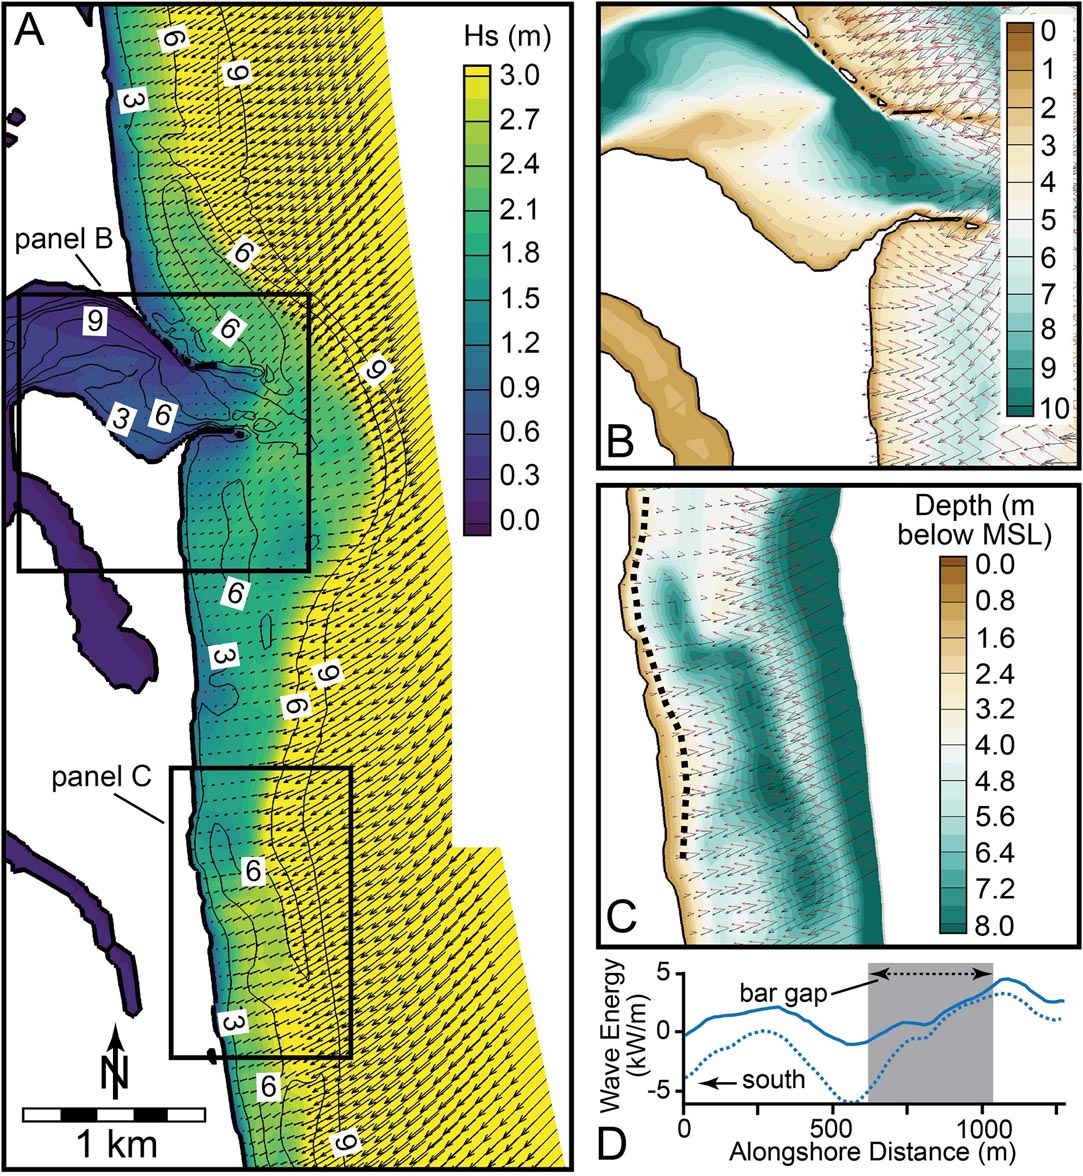
Figure 9. Hydrodynamic model results. (A) Significant wave height distribution resulting from a storm wave (Hs ∼5 m; Ts ∼12 s) approaching from the northeast (ca. 45 compass degrees). Vectors show wave energy transport direction (a proxy for sand transport), and solid black lines show depth in meters below mean sea level (MSL). Wave energy transport resulting from two storm wave conditions are shown in the vicinity of the Reservation Terrace (B) and the 2008–2018 erosional hotspot (C). For one storm event, waves approach is from the northeast (ca. 45 compass degrees; black vectors), and for one they approach from the southeast (ca. 135 compass degrees; red vectors). Contours show depth in meters below MSL, and both offshore waves are similar (Hs ∼5 m; Ts ∼12 s). (D) Alongshore variation of wave-energy transport through the erosional hotspot [along transect shown as black dashed line in (C)] for each of the two events (NE approach: solid line, SE approach: dashed line).
Discussion
Inlet Dynamics and the Shifting Shorelines of Plum Island
Sediment-Transport Dynamics at the Engineered Merrimack River Mouth
Modern bedload sediment delivered to the Merrimack River Inlet from the river itself ranges in size from fine to coarse sand and granules (FitzGerald et al., 2002). Seaward of the inlet jetties, the inlet ebb-tidal delta extends in a southerly direction and is characterized by southerly- and ebb-oriented sandwaves indicative of southerly sediment migration. This corroborates sedimentologic evidence showing a southerly fining trend in grab samples collected across the ebb delta and a general trend of increasing textural and mineralogical maturity to the south, away from the Merrimack River, reflecting winnowing and differential transportation of finer sand grains by wave action (FitzGerald et al., 1994, 2002). Our results confirm the spatial continuity of this trend: beach and dune sand transition from very coarse sand proximal to the inlet to fine sand along the length of the barrier-island chain. Dominant southerly transport is further evidenced by the growth of recurved spits on the downdrift ends of Plum Island (Sandy Point State Park) and Crane Beach (Farrell, 1969) and an increase in the spacing of offshore contours to the south along the chain (Smith, 1991), indicating net deposition along the southern coast of the embayment (Hubbard, 1976; Barnhardt et al., 2009).
Proximal to the Merrimack River Inlet (i.e., along the northern, developed coast of Plum Island), transport patterns are more complex. A combination of prevailing southerly winds and waves and refraction of northeast storm waves around the Merrimack River Inlet ebb-tidal delta creates a seasonally migrating nodal zone, north of which net transport is to the north, toward the inlet (FitzGerald, 1993). Sediment textural trends (Figure 8) indicate that the long-term position of this nodal zone is ca. 500 m south of the South Jetty, near the center of the Right Prong beach sector (S2). However, sediment accumulation south of the groins (and attendant erosion along the north side), as far south as Annapolis and Fordham ways (S5 and S6; 2,300 m south of the South Jetty), demonstrates the seasonal (or longer) dominance of northerly transport along the Newburyport and northern Newbury beaches.
The South Jetty of the Merrimack River Inlet presents a barrier to northward-migrating sand at the northern end of the Right Prong (S1) beach. This section of beach grew rapidly in the years following jetty construction: erosion in 1912 was the most severe to date along S3–S7, but the beach proximal to the jetty was its widest on record during this time. This section of beach also grew during the period of hotspot erosion along beach sectors S4, S5, and S6 in 1974–1978. However, the primary control on the volume of the Right Prong (S2) beach is the continuity of the South Jetty itself: occasional degradation of this jetty has allowed for the transport of sand over and through the wall, and to Reservation Terrace (Figure 10). This sand transport pattern is evident in sediment textural data (Figure 8) and in the apparent anti-phasing of beach widths along both Reservation Terrace and the oceanfront beach (Figure 4): since the 1960s, beach area along Reservation Terrace changes in unison with, but in the opposite direction of, that of the oceanfront beach. This timing is not coincidental: the South Jetty was twice repaired and rebuilt, once in the mid-1960s and again in 2013–2014. The most recent construction re-built the jetty to its designed height of ca. 4.8 m above mean sea level. Repairs in the 1960s was followed within years by rapid (between 1966 and 1978) areal loss of nearly 90,000 m2 of beach (equivalent sand volume: ca. 7.3 × 10⁵ m3) from Reservation Terrace; in the latter third of this period (1974–1978) alone, the oceanfront Plum Island beach grew by 25,000 m2 (equivalent sand volume: ca. 2.0 × 10⁵ m3). This trend repeated itself in the 1990s to 2000s as the jetty slowly degraded and Reservation Terrace grew by 91,500 m2 (equivalent sand volume: ca. 7.5 × 10⁵ m3) as the Plum Island oceanfront beach lost ca. 7.3 × 10⁵ m3 of sand between 1994 and 2008 (Figure 4). Following jetty repair, the Right Prong (S2) beach rapidly grew as Reservation Terrace (S1) approached its minimum mapped extent (Figure 10C).
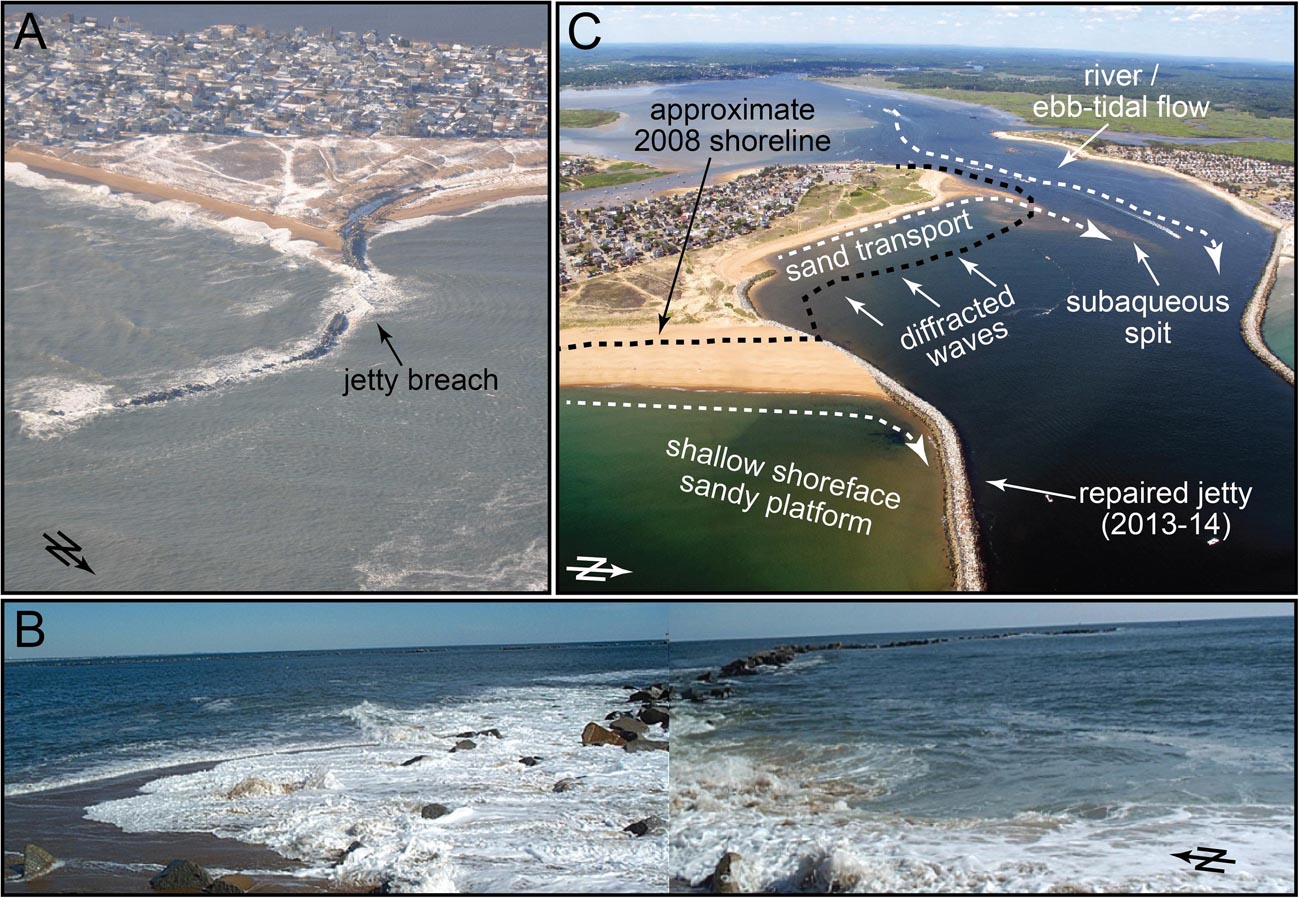
Figure 10. Merrimack River Inlet jetty sediment transport. (A) Refracted northeast storm waves propagate through a beach in the South Jetty during high tide (credit: R. Barrett, Plum Island Taxpayer’s Association, December 28, 2012). (B) Merged panoramic of waves delivering sediment through the breach in the South Jetty to proximal Reservation Terrace (credit: M. Morris, March 06, 2008). (C) Aerial view of northern Plum Island following jetty repair showing erosional beach of Reservation Terrace and growth of oceanfront beach south of Merrimack River Inlet South Jetty (credit: P. Rosen, July 27, 2016).
This more recent cycle of erosion and accretion along Reservation Terrace and the Plum Island oceanfront beach demonstrates that these beaches are not a simple closed littoral cell in which sand is exchanged between the beaches through ebb-currents within the inlet and wave action along the oceanfront beach. Most importantly, reversal of the recent erosion-accretion cycle (2008–2009) pre-dated jetty repair (2013–2014) by 5 years, possibly reflecting a decrease in the frequency of storms or high-water events capable of delivering sand across the jetty between 2008 and 2013. Additionally, although the volumes of sand lost (gained) from Reservation Terrace and those gained (lost) from the oceanfront Plum Island beach are nearly identical over decadal times (Figure 4C), there is no clear evidence that all sand eroded from Plum Island beach is reworked to the north and through the jetty, even during times of disrepair. In fact, textural trends (Figure 8) indicate that the long-term oceanfront nodal zone is located only 500 m south of the jetty, and thus the section of beach impacted by northerly long-term transport is restricted to only beach sector S2. Restricting the region of analysis of oceanfront shoreline change to only S2 would decrease the 1994–2008 beach loss volume to ca. 3.7 × 10⁵ m3, or only half of the volume gained along Reservation Terrace during that same time. Nonetheless, there is abundant evidence (e.g., accumulation of sand to the south, and erosion to the north, of Annapolis and Fordham Way groins, as well as the presence in 2008 at the South Jetty of remnants of coir logs originally placed along Center Island) that, at least during periods of hotspot erosion, the nodal point is as much as 2 km down-beach from the South Jetty (see section “Hotspot Migration and the Merrimack Inlet Ebb-Tidal Delta”). Finally, in spite of a clear westward fining trend along Reservation Terrace away from the jetty, the presence of coarse, immature sand along the northern low-tide terrace and mid-beach reveals the occurrence of some exchange of sediment between the Merrimack River and the Reservation Terrace beach. Hence, sediment delivered to Reservation Terrace is not solely derived from the oceanfront beach. The Merrimack River Inlet has also undergone routine dredging throughout both periods, including the removal of 5.4 × 10⁵ m3 of sediment during the 1960s and 1970s period of erosion along Reservation Terrace. Yet, no such dredging immediately preceded erosion along Reservation Terrace in 2008: the most recent prior river-mouth dredging was the removal of ∼11,000 m3 of sand in 1999, followed by removal of another ∼11,000 m3 in 2010, coincident with this period of erosion alone Reservation Terrace (pers. com., 2010, E. O’Donnell, Chief, Navigation Section, USACE New England District).
Thus, at least some portion of shoreline change along Reservation Terrace is in response to conditions unassociated with direct human activities within the Merrimack River Inlet (i.e., jetty degradation and repair). In particular, diffraction and refraction of waves entering the Merrimack River Inlet create turbulent wave conditions in the entrance channel and westerly longshore currents along the northeast-facing Reservation Terrace shoreline (Li et al., 2018). New modeling results (Figure 9B) indicate that, regardless of the wave approach, wave angles and thus wave energy—and therefore resulting sediment transport along the Reservation Terrace shoreline—are similar. This suggests that, once the sand is transported over the jetty to the Reservation Terrace beach, waves rework that sand until in equilibrium with the dominant wave approach. This process in combination with strong, river-influenced ebb currents (Li et al., 2018) forms a clockwise sand circulation pattern within the southwestern portion of the inlet. Sand, including sediment originating from the oceanfront Plum Island beach through breaches in the jetty, is transported along Reservation Terrace to the west by waves, aided likely by flood tidal currents. Upon reaching the northwest corner of Reservation Terrace, this sand is then carried by ebb currents to the northeast along the margin of the Merrimack River channel, forming a linear, 300–500 m long, northeast-oriented subaqueous channel-margin spit (Figure 10C). This feature persists regardless of the configuration of Reservation Terrace, with its orientation shifting between ca. 12 and 42 compass degrees. This sand gyre is corroborated by modeling studies: a 1:75-scale (undistorted) physical model of the Merrimack River Inlet (Curren and Chatham, 1979), bathymetry change analysis (Li et al., 2018) and more recent numerical models that build on the Haas and Hanes (2004) model (Woods Hole Group, 2017) and the Coastal Modeling System (CMS) Flow and Wave models (Li et al., 2018). Changes in offshore wave climate and/or the orientation of the Merrimack River thalweg are likely to alter the magnitude of the transport system and ultimately, the rate in which sand is transferred between the estuary and the Reservation Terrace beach. These are likely to be partly responsible for observed changes in the width and volume of Reservation Terrace.
Hotspot Migration and the Merrimack Inlet Ebb-Tidal Delta
In addition to long-term changes in beach volume associated with sediment exchange with Reservation Terrace, the northern-most, inlet-proximal 3 km of the Plum Island oceanfront beach is characterized by shorter-term periods of formation and longshore migration of a 300–800 m long, 80–100 m wide, erosion hotspot. This hotspot was observed in the 1950s, 1974–1976, and 2008–2018 (Figure 11) and forms with an apparent cyclicity of ca. 25–40 years (Fallon et al., 2015). Southerly migration of the hotspot occurs as a threshold process: the hotspot will be situated for several years immediately north of Center Island Groin (e.g., Figure 11B) and then, following a period of partial beach recovery (commonly associated with low wave energy), it will shift south by several hundred meters during one or more high-energy events, becoming pinned north of Annapolis Way Groin (Figure 11D). This process later repeats as the hotspot shifts to front Fordham Way and the groin at its southern end (Figure 11F). Here, we demonstrate that this hotspot forms and migrates along the beach in response to morphologic changes and sediment transport patterns of Merrimack River Inlet and its associated ebb-tidal delta (Figure 12).
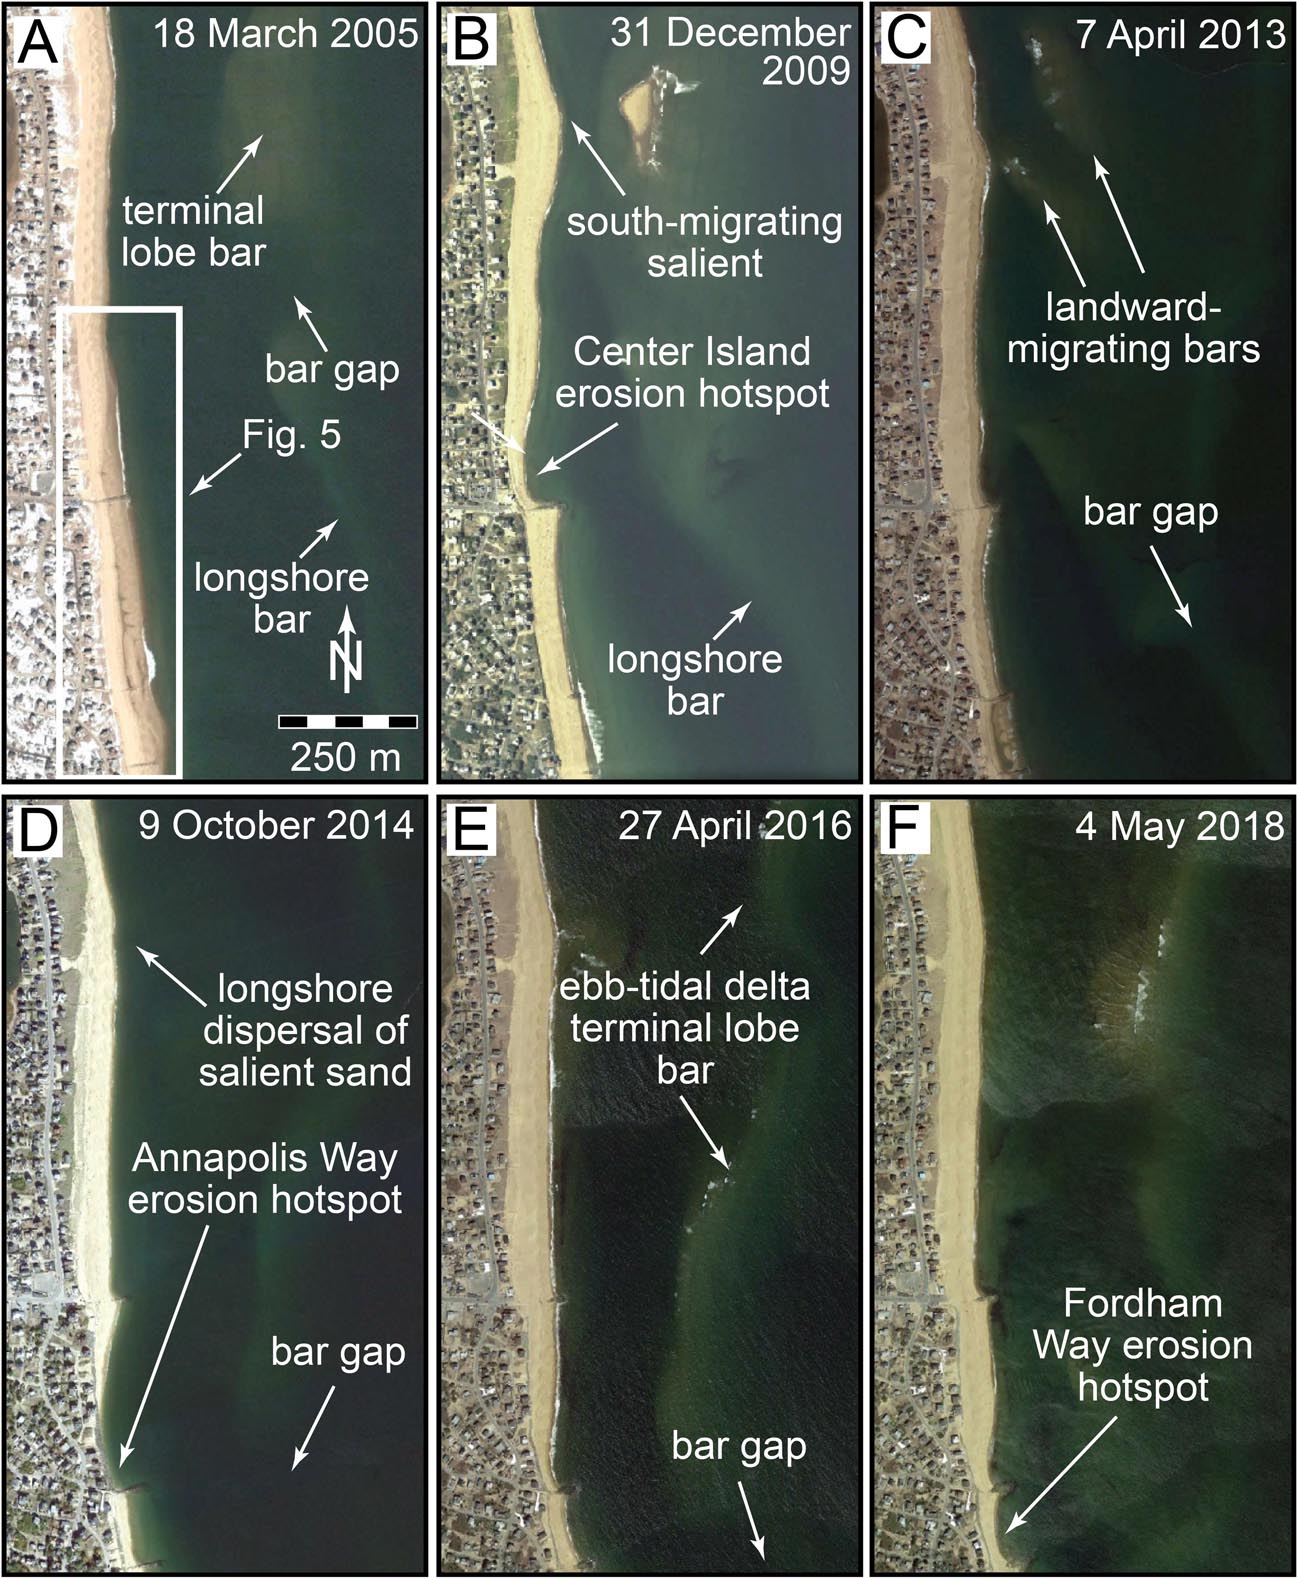
Figure 11. Formation and long-term migration of the Plum Island erosion hotspot along Center Island and Annapolis Way between 2005 (A) and 2018. This current phase of erosion initiated north of the Center Island Groin in 2007, and was followed by gradual southerly migration of the erosion hotspot to north of the Annapolis Way Groin between 2009 (B) and 2014 (C,D) and then between the Annapolis Way and Fordham Way groins between 2014 and 2018 (D–F). All imagery from Google, TerraMetrics except: (A) MassGIS (Commonwealth of Massachusetts EOEA) and (B) USDA Farm Service Agency.
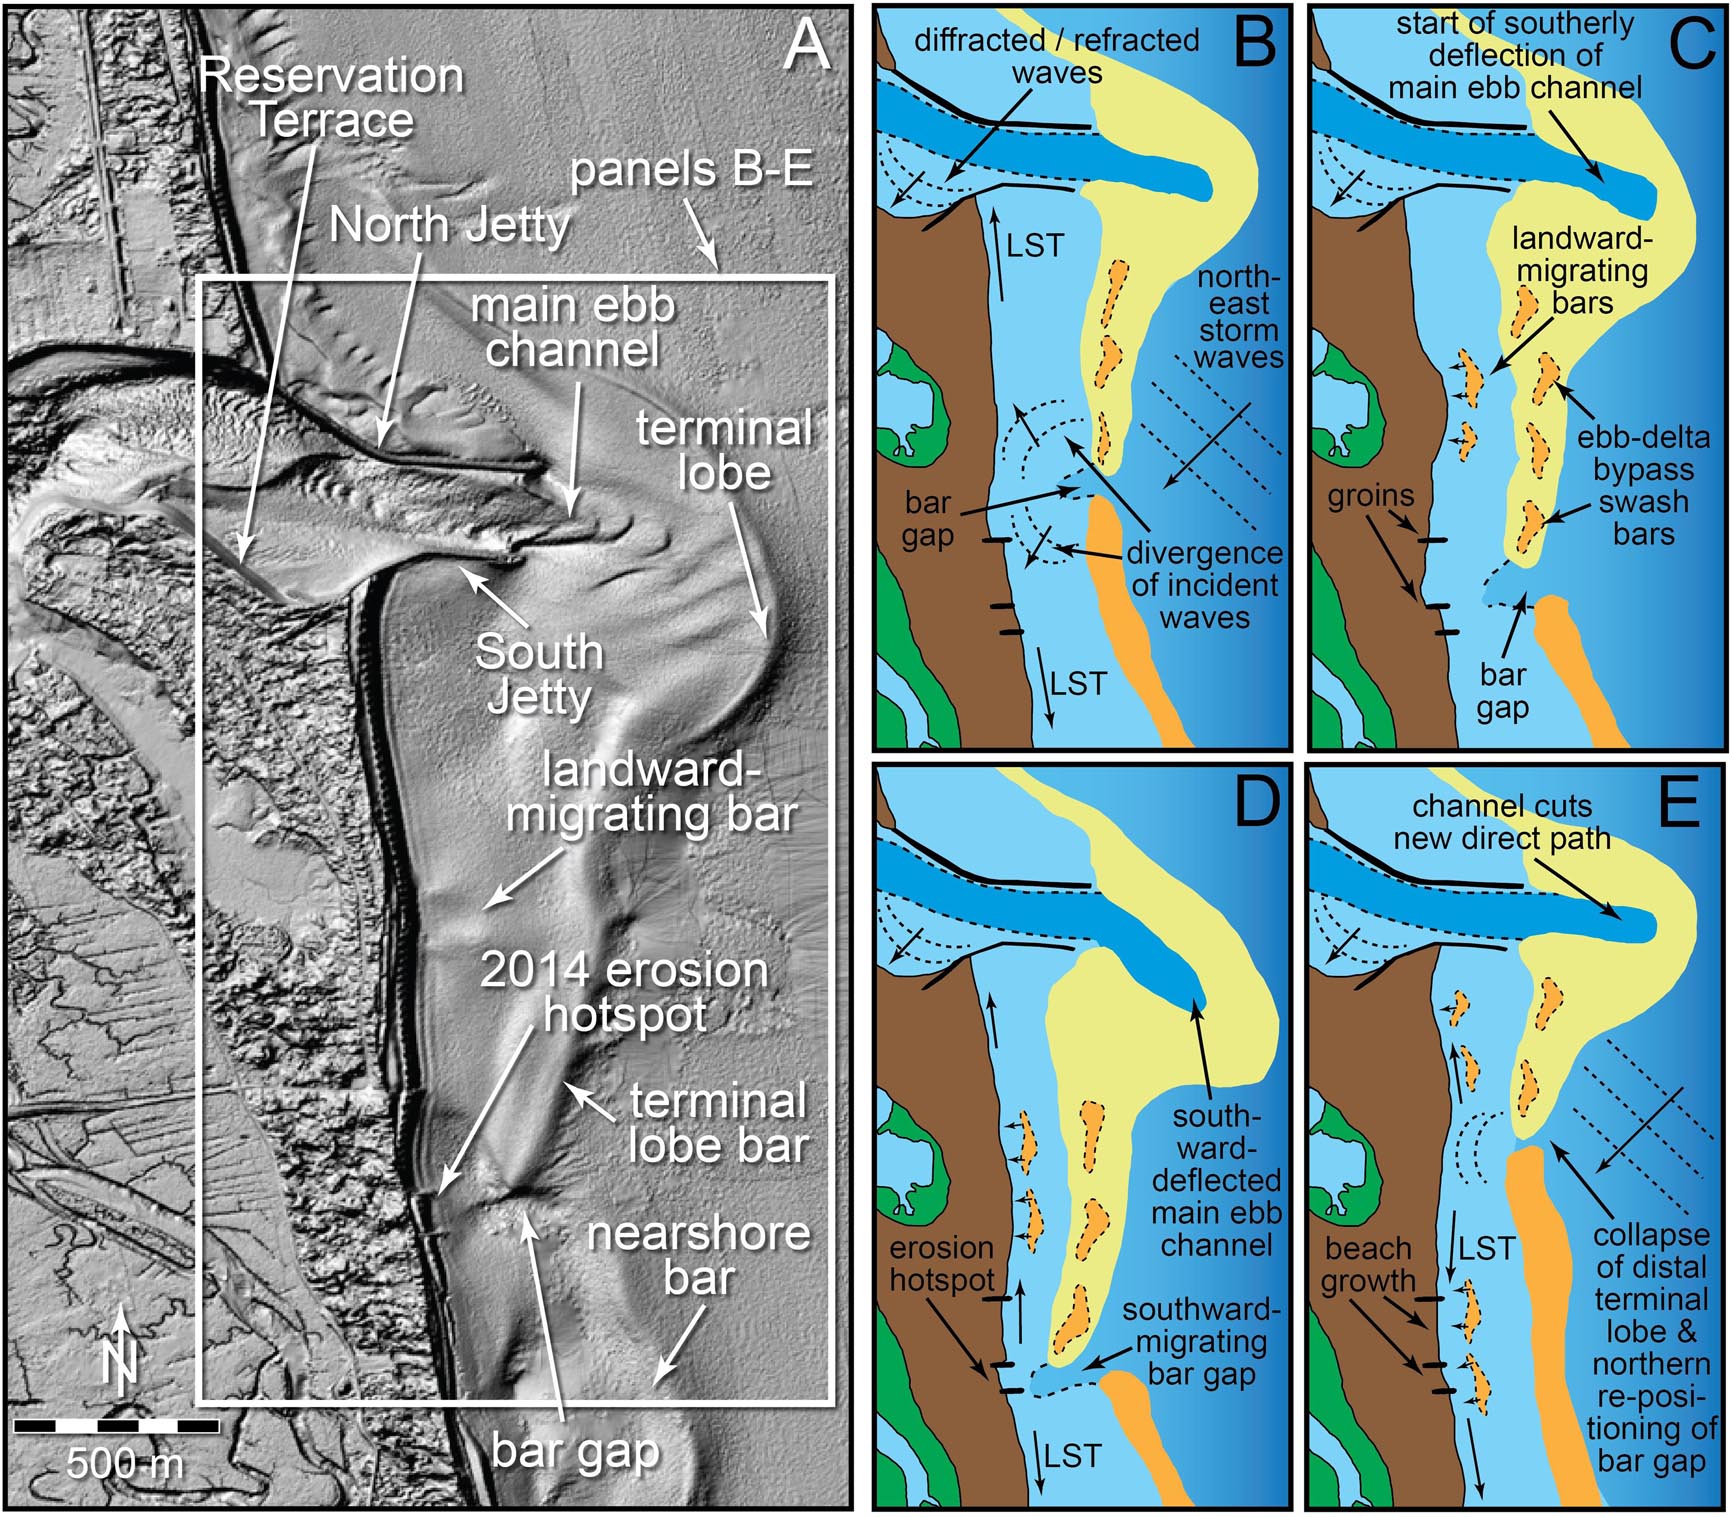
Figure 12. Conceptual model of hotspot formation, growth, and downdrift migration along Plum Island oceanfront beach. (A) Hillshaded and interpolated 2014 LiDAR data of northern Plum Island (data source: U.S. Army. Corps of Engineers [USACE], 2014) highlighting primary features shown in conceptual model; image corresponds (approximate) with panel (C). Note that morphologies shown in (B–E) are based on (A) and imagery in Figure 10, but are diagrammatic in nature, with less visible changes (e.g., migration of main ebb channel) exaggerated. Data shown in (A) was used for hydrodynamic model (Figure 9) grid.
We observed a longshore shift in the erosion hotspot along Annapolis and Fordham ways during the latter half of our beach surveys (Figures 6B, 7). In September 2014, the beach volume along Annapolis Way (S5), which had been artificially armored with rip-rap in 2013, was at the minimum observed throughout the study period. No beach sand was present above the mid-tide line. By late October 2014, this section of beach had grown by nearly 26,000 m3, the HWL had prograded 20 m seaward of the revetment, and a new beach berm and dune toe had formed. At the same time, the Fordham Way Beach (S6) had lost ca. 12,000 m3 of sand. Although the entirety of the oceanfront beach grew during this period (Figure 6A), Annapolis Way (S5) beach gained nearly 50% more sand with respect to the overall beach-sector volume than the oceanfront beach as a whole (Figure 6B). Several months later (November to December 2014), the Refuge section of the beach (S7) experienced its largest relative sand loss (∼82,000 m3) during the study period, and Fordham Way experienced its second largest relative loss; these both preferentially recovered in December 2014 to January 2015. From these observations, an overall pattern emerges of localized (“hotspot”) erosion imprinted upon seasonal to sub-seasonal beach morphologic changes. At any given time during its ca. 5–10 years cycle of growth and migration, this hotspot may be more or less severe than at other times (Figures 8, 11), but during periods when the beach is at its narrowest [generally following high-energy or high-water (extreme high tides such as occurred in August 2014) events], the 300–800 m long hotspot becomes most apparent.
The eastern-most portion of the terminal lobe of the Merrimack River Inlet ebb-tidal delta is >12 m in relief, reaches depths of <3 m, is situated nearly 450 m south of the South Jetty, and extends >2 km alongshore (Figures 3A, 12A). It becomes closer to the shoreline to the south, from >450 m along the Right Prong (S2) section of the beach to <200 m near Center Island (S4). The crest of this bar is commonly within 1 m of mean sea level and monthly visual observations coinciding with beach surveys throughout 2014 reveal that the bar was often subaerially exposed at low tide (see also Figures 11B,F). Sand is delivered to the Salient section (S3) of Plum Island beach from the ebb-tidal delta through onshore bar migration along this portion of the terminal lobe (Figures 11B,C, 12A,C). The southern end of the terminal lobe bar coincides with a break-in-the-bar (cf., Kraus and Galgano, 2001) or bar gap, and start of a secondary, low-relief (2–3 m above surrounding seafloor; maximum heights reaching ca. 3.5 m below mean sea level) subtidal bar (Figure 12A). This feature extends nearly continuously, ca. 100–200 m offshore of the low-tide terrace, along the entire southern 15 km of Plum Island. Water depths at a bar gap, a relatively short (commonly <100 m) cavity between the terminal lobe and nearshore bars (Figures 11, 12), can be several meters greater than over the adjacent bars (over which storm waves will shoal and break). This opening is most likely related to inlet sediment bypassing, a process commonly associated with the formation and landward migration of swash bars, the width and length of which vary with the size of a given inlet and volume of sand that is bypassed (FitzGerald et al., 2000; Kraus, 2000; Ridderinkhof et al., 2016). It is common to have several bars independently migrating onshore, along the ebb-tidal delta swash platform, and along the landward beach. This creates a dynamic downdrift end of the ebb-tidal delta terminal lobe bar, and incomplete welding with the lower-relief subtidal longshore bar. The associated bar gap allows propagation of larger waves onshore, thereby focusing wave energy along the beach immediately landward of the break. Model results (Figure 9) demonstrate that, regardless of the offshore wave angle, wave refraction and diffraction through the bar gap promote a divergence of incident waves and promote transport to the north, forming a short-term (during period of hotspot activity) nodal point immediately south of the hotpot. North-directed tidal residual currents (Zhao et al., 2010) promote transport and act to efficiently move sand to the north. If the bar resides in a single location for a long enough period, these mechanisms will starve the onshore beach of sand, resulting in erosion. In contrast, wave shoaling across the terminal lobe nearshore bar (north of the hotspot) and refraction around this bar dissipate energy landward of the bar, allowing for sand deposition, as evidenced by a significant (ca. 30–40%) reduction in wave heights along beach segments north of the hotspot (Figure 9D). In a fashion similar to a tombolo, the beach accretes in this region. Continued sediment delivery to the northern 1.5–2.5 km of the oceanfront beach by refracted/diffracted waves traveling to the north from the hotspot-associated nodal point allows for accretion proximal to the South Jetty, and for delivery of sand across the jetty to Reservation Terrace.
Satellite imagery over the course of the most recent period of hotspot formation and migration (Figure 11) reveals that southerly growth of the ebb-tidal delta progressively shifts toward the southern end of the terminal lobe, and the bar gap. The focus of storm wave energy, and thus the erosion hotspot, migrates further down-shore in response (Figures 12B–D). Coincident with this, the salient (focal point for onshore bar migration from the terminal lobe) also shifts south, replenishing up-drift beach segments with sand through the detachment, landward migration, and shoreline-welding of ebb delta-associated swash bars (Figure 12C). Eventually, easterly realignment of the main ebb channel to a more hydraulically efficient pathway (Figure 12E) through breaching (process of outer channel shifting; FitzGerald, 1993; FitzGerald et al., 2000, 2012) reconfigures the terminal lobe and rapidly shifts the bar gap to the north. This process can release large volumes of sand in the form of swash bars, which migrate landward, welding to the beach and contributing sand north and south to the longshore transport system.
This form of hotspot-style erosion associated with inlet outer channel shifting (or larger-scale ebb-delta breaching) is common to many tidal inlets, both jettied and unstructured (Table 1). For example, along northern Assateague Island (Maryland, United States), Kraus (2000) documented a ca. 40 years cycle of downdrift beach erosion and accretion associated with sand bypassing of the adjacent Ocean City Inlet. By contrast, along the beach downdrift of the Guadiana Estuary (Portugal), erosion and accretion cycles associated with sediment bypassing range from 15 to 25 years (Garel et al., 2014). The jetties at Guadiana Estuary are more than twice the length of those at the Merrimack River Inlet, forcing the Guadiana Inlet ebb tidal delta further offshore, and increasing the length of beach affected by these erosional cycles to more than 3 km (as compared with a maximum of only ca. 2.5 km along northern Plum Island). In fact, Fenster and Dolan (1996) demonstrated that inlet processes can dominate shoreline morphology up to nearly 4.5 km downdrift of the tidal inlet, and influence shoreline behavior >10 km from the inlet, at least in wave-dominated settings. Thus, the processes observed along the Plum Island beach are not unique to this site, or even to engineered inlets. However, here they have been met by a series of reactionary responses to short-term erosion associated with a lack of a collective consensus for best management and a longer-term perspective needed for proper planning and adaptation.
Table 1. Examples of shoreline erosion and accretion associated with inlet processes at engineered and unstructured inlets.
A Developed Coast in Peril
Reactionary Erosion Mitigation Along Plum Island’s Beaches
The coastal region surrounding Plum Island was first settled by Europeans in the late 17th century, and by the early 1800s the Merrimack River port along the mainland town of Newburyport had become commercially viable (Labaree, 1962). Installation of the Plum Island Turnpike in the early 1800s allowed for access to the island and the development of the Plum Island Hotel, the only permanent structure on Plum Island for nearly a century (Currier, 1896). In the late 19th century, the installation of the 500–700 m long Merrimack River Inlet jetties halted centennial-scale river-mouth migration and ebb-tidal-delta breaching which had previously caused near-complete erosion of the northern 2 km of the island (Hein et al., 2016). The stabilization of the island afforded by these jetties fostered extensive residential development (ca. 1200 homes and >100 roads; Fallon et al., 2017), which continues to yield significant benefits to homeowners and vacationers and contributes to local and state tax bases.
In spite of their benefits, the Merrimack River Inlet jetties shifted the inlet ebb-tidal delta seaward into deeper water, initiating the cycle of erosion and accretion along the developed section of Plum Island. This hazard drew the attention of property owners, local governments, and state and federal agencies. In response, a variety of mitigation strategies have been employed to protect private properties (Figure 13), but most have found limited success. The first of many beach nourishment projects was conducted in 1953 by the Division of Waterways of the Massachusetts Department of Public Works, through the placement of 4.3 × 10⁵ m3 of fine sand (extracted from The Basin; see location Figure 3) along a 900 m section of beach. This action was followed by additional nourishments in 1957, 1973, 1987, 1999, and 2010 (Haddad and Pilkey, 1998; Plumb, 2010). Additional soft-stabilization approaches have included emplacement of a 200 m wall of 7,000 sand bags by the Massachusetts National Guard in January of 1976 (these were lost in a storm the following month; Macone, 2008).
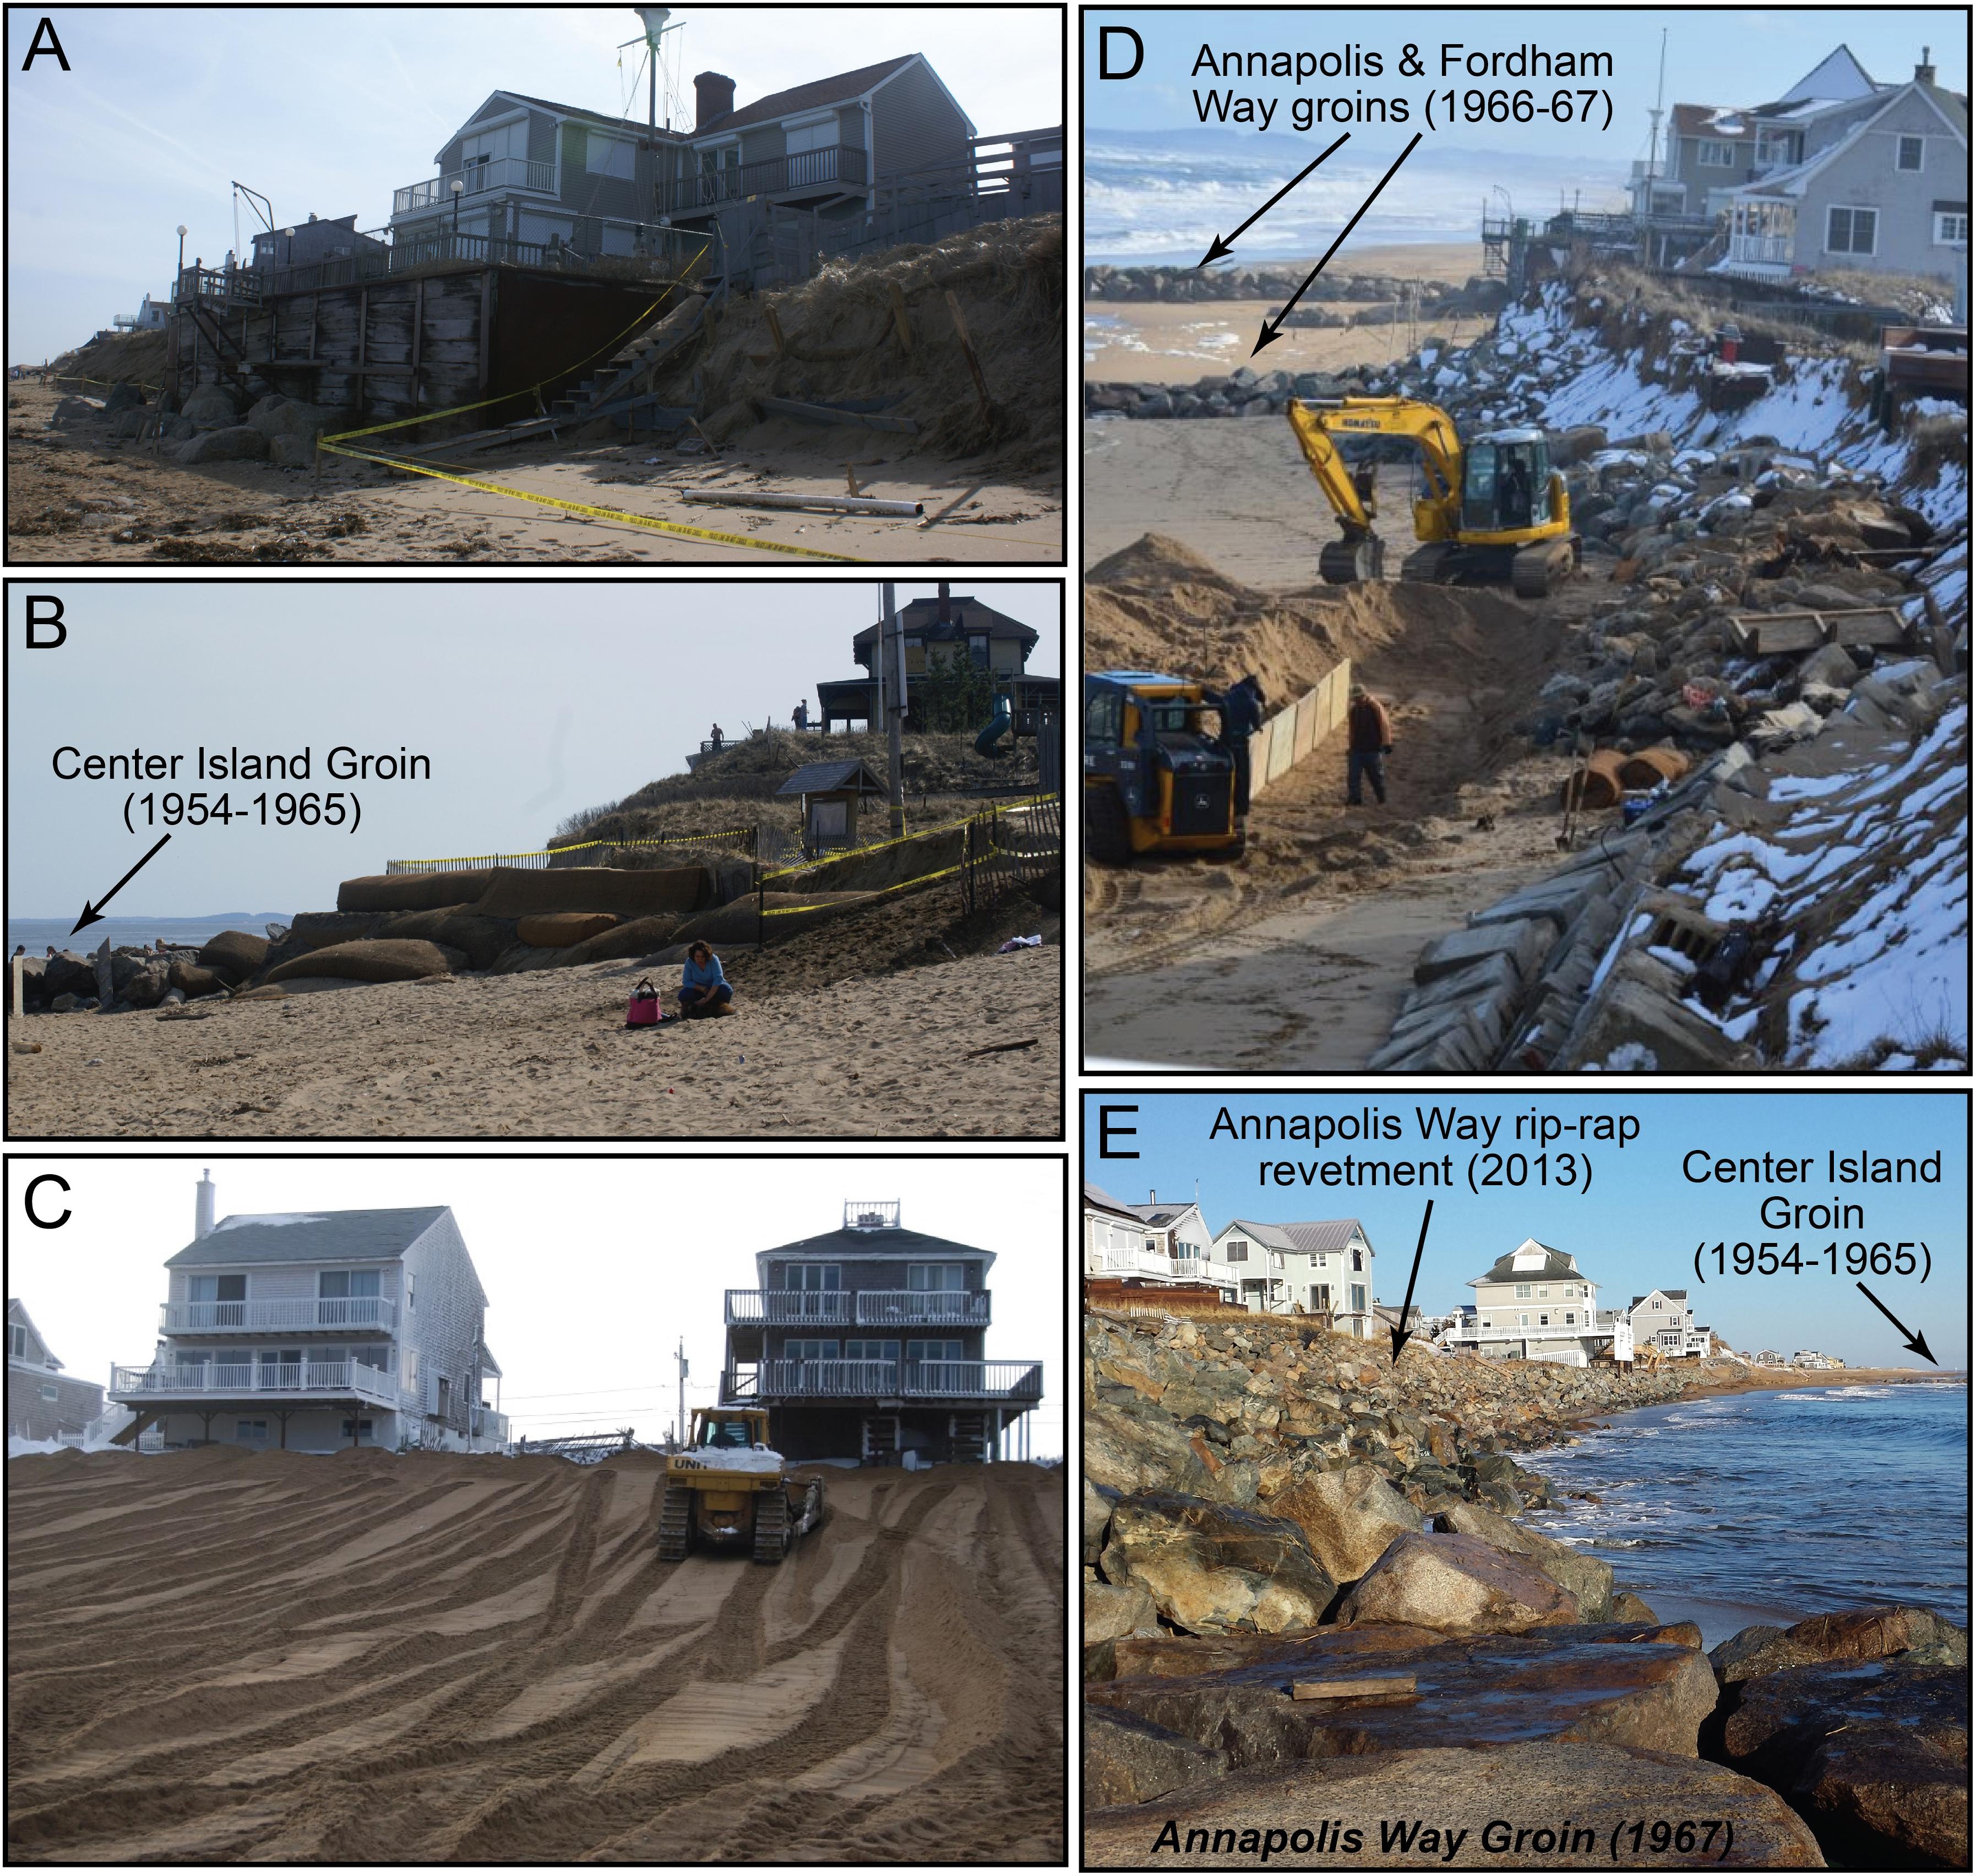
Figure 13. Examples of erosion and mitigation responses along Plum Island. (A) Erosion in 2010 along central Center Island (S4) exposes stabilizing footings for housing structure (deck) (credit: C. Hein, March 23, 2010). (B) Sand-filled coir logs placed along dune toe at southern Center Island (S4) (credit: C. Hein, March 23, 2010). (C) Beach scraping (building artificial dunes with sand pushed landward from the low-tide terrace and beach berm) in advance of nor’easter (credit: C. Walth, July 11, 2011). (D) Construction of rip-rap revetment along Annapolis Way (credit: B. Connors, April 2013). (E) View north along Annapolis Way section of Plum Island Beach. Not visible in photo in far distance is a crane repairing the Merrimack River Inlet South Jetty (credit: G. Clifford, December 16, 2013).
More recently, in response to localized erosion at the start of the most recent period of hotspot erosion, the Town of Newbury (with funding from the Commonwealth of Massachusetts) placed “geotubes” (in 2008), hay bales, and large sand-filled, coir (coconut-fiber) rolls (2009–2010) along the dune toe of Center Island (S4) beach (Figure 13B). Even though it is only partially effective and likely temporary, as much as 13% of the assessed value of proximate properties can be attributed to this soft-structure (Fallon et al., 2017). At the same time, along Annapolis Way (S5), property owners instituted a controversial (e.g., Executive Office of Energy and Environmental Affairs [EOEEA], 2010) program of periodic beach scraping to create sacrificial dunes in advance of storm impacts (Figure 13C). Although these were destroyed by waves within days, a similar approach was undertaken along Reservation Terrace (S1) in 2018 in response to ongoing erosion threats to homes that had been fronted by 200 m of beach as recently as 2008.
More permanent shoreline-stabilization measures have also been instituted, including the installation of short sections of rip-rap seawalls in the late 1970s (later re-exposed by erosion; see Figure 13A) and, along Reservation Terrace, the USACE lengthened the South Jetty landward and armored the nearby beach with nearly 6,400 metric tons of stone following the loss of one of a United States Coast Guard building in 1969. At the same time, the City of Newburyport constructed a concrete wall fronting the northern line on homes along much of Reservation Terrace. However, the primary and longest-lasting approach has been the construction of rip-rap groins along the oceanfront beach. Between 1954 and 1967, the Commonwealth of Massachusetts constructed a series of seven groins, each 50–75 m long. Of these, the Fordham Way, Annapolis Way, and Center Island groins (Figure 13) serve as temporary pinning points for the southerly migrating erosion hotspot. Four other groins, spaced at ca. 400 m between the Center Island Groin and the South Jetty, are buried by sand. The USACE, which had earlier advised against emplacement of groins (United States Army, Corps of Engineers [USACE], 1952), recommended that these be extended to at least 300 m in length in order for them to intersect the nearshore bar and more effectively trap sand (United States Army, Corps of Engineers [USACE], 1967); no such modifications were made. These groins serve to “pin” the southerly migrating erosion hotspot, focusing higher wave energy associated with the break-in-bar along a narrower section of the beach, thereby contributing to erosion today.
In response to the most recent phase of hotspot erosion along Annapolis and Fordham ways (S5, S6) in 2013–2014, local homeowners collectively funded the construction of rip-rap revetments along ca. 500 m of dune toe fronting 16–18 plots/properties (Figures 13D,E). This action challenged rules embodied in the Commonwealth’s Wetlands Protection Act (WPA), as implemented through the municipal conservation commissions. In the vicinity of Annapolis and Fordham Ways, those rules classify the beach and foredune as a “coastal dune” resource, thereby barring modifications to the dune, such as the placement of protective structures. While Commonwealth officials have expressed their disapproval over the revetment construction, local homeowners, backed by the Pacific Legal Foundation, which litigates issues that threaten the underpinnings of private property rights, have threatened to go to court should the Commonwealth act to force the removal of the revetment (Graikoski and Hoagland, 2017).
While protecting adjacent properties, the revetment has exacerbated hotspot erosion by enhancing wave scour at its base. As a result, subaerial beach is absent along this stretch of coast during periods of more intense erosion [e.g., December 2013 (Figure 13E) to September 2014 (Figure 7)]. Additionally, this has removed a sediment source (dune erosion) from the littoral system, and along with a steeper nearshore beach slope, likely enhancing erosion in proximal stretches of the Plum Island beach. A similar scenario is observed along Saco Bay (Maine, United States), where a rip-rap revetment was installed in response erosion at an average rate of 2.5 m/yr along the 5–6 km downdrift of the jettied Saco River mouth. Here, beach armoring led to a reduction in longshore sediment supply, causing rapid erosion at the downdrift end of the revetment, and the need to lengthen the revetment multiple times (Dickson et al., 2009).
Long-Term Mitigation and Adaptation Planning in the Absence of Collective Consensus
Hurricanes are likely to increase in frequency and magnitude (Emanuel, 2013; Kossin et al., 2010, 2014; Knutson et al., 2015), decrease in forward speed (Gutmann et al., 2018; Kossin, 2018), and track further northward along the United States East Coast (Garner et al., 2017) in response to climate change. Although it is unclear whether northeast storms will undergo a similar increase in intensity, it is likely that this overall enhanced storm climate will produce larger storm surges and higher wave conditions. Along Plum Island, these factors, coincident with more frequent flooding associated with an acceleration in sea-level rise (Talke et al., 2018), will increase storm-related beach erosion, dismantlement of coastal structures, and wave overtopping of the South Jetty, likely resulting in enhanced fluxes of sand to Reservation Terrace from the Plum Island oceanfront beach.
The planning for adaptation and mitigation along Plum Island oceanfront and Reservation Terrace beaches to these predicted changes is hampered by the complexity of the timescales and patterns of erosion along these beaches, leading to a lack of any unified understanding, policy, or response to erosion when it does threaten structures. Instead, mitigation has been entirely reactionary in nature, responding to individual storm events, rather than the longer-term trends in beach erosion and accretion associated with sediment fluxes between the Reservation Terrace and oceanfront beaches, and hotspot migration along the southern oceanfront beach. As a result of a confluence of interests and human actions—large public infrastructure expenditures, highly valued real estate, environmental concerns for preserving the barrier beach, and the adherence to public trust doctrine—the Commonwealth, pressured by interest groups, has consistently attempted to attempt to stave off or mitigate coastal change along Plum Island (Gurley, 2015). Only recently has Massachusetts—which does not have a master plan for organized coastal retreat—begun incorporating climate change into the Commonwealth’s hazard mitigation and adaptation planning, including through a $2.4 billion bond package in the 2019 budget (Rios, 2018). However, counteracting any state-level initiatives are growing revenues generated from property taxes in the City of Newburyport and Town of Newbury, which have factored significantly into local governmental decision-making in relation to further infrastructure development and beach protection. For example, as recently as 2006 the City of Newburyport, in concert with the Commonwealth Department of Environmental Protection, constructed a city water and sewage project connecting Plum Island with mainland Newburyport, at a cost of ca. $25 million (Gurley, 2015). Damage to the sewer system on Plum Island during a series of northeast storms in February 2015 eventually resulted in a $5.5 million settlement to the City for repair (Boute, 2016).
Lacking consensus management at the governmental level, local citizens, commonly with support from local or state governmental officials, have organized several education and planning initiatives. For example, the Merrimack River Beach Alliance, co-chaired by a state senator, was formed in 2008 to promote the preservation of Plum Island and Salisbury Beach (located north of the Merrimack River Inlet; see Figure 1), largely through soft and hard engineering interventions funded at the state and federal level. More recently, Storm Surge: The Merrimack Valley Coastal Adaptation Workgroup, was formed in Spring 2013, largely in response to the controversial shoreline-hardening along Annapolis and Fordham ways. This organization seeks to encourage, educate, and support local communities to prepare for the impacts of climate change (sea-level rise and storms), with a particular focus on long-term adaptation and retreat planning. Although largely educational, the chair of this group (a co-author of this manuscript) is also leading development of the City of Newburyport’s climate adaptation plan in his role as co-chair of the City’s Climate Resiliency Committee. Incorporation of plans for managed retreat of shoreline property holders in this local plan, as well as state-level initiatives (e.g., Coastal Erosion Commission Commonwealth of Massachusetts [CEC], 2015), while unpopular with many local residents (Shi and Huang, 2018), mark a major change in attitudes toward human habitation of Plum Island, but one lacking precedent and a clear future. Within the context of Plum Island’s unique dynamic coastal environment, these efforts comprise a general approach to the engagement of scientists with stakeholders in the optimistic expectation that a more informed community can debate the merits of the full array of potential adaptive responses, both in the short- and long-term.
Conclusion: Sustainable Management of an Engineered River-Mouth Beach
More than 200 years of human alteration of the lower Merrimack River and Plum Island beaches have produced a sizable tax base and recreation site for the Town of Newbury, City of Newburyport, and their citizens. However, unintended consequences associated with the same shoreline hardening structures that stabilized the northern 3 km of the island have led to periods of severe erosion, threatening both public and private homes and infrastructure. Both refraction of northeast storm waves around the Merrimack River Inlet ebb-tidal delta and strong southeast swell produce a local reversal of net southerly longshore transport. During these conditions, which can be enhanced at times of spring tides, breaking waves overtop the rock structure, transporting sand across the landward end of the South Jetty, feeding the inner-inlet beach (Reservation Terrace). While this reversal, combined with tidal- and wave- induced currents inside the inlet, can lead to accretion of ca. 7.5 × 10⁵ m3 of sand along the Reservation Terrace beach, it is largely at the expense of the oceanfront beach to the south.
Superimposed on the local transport system are smaller-scale variations in wave energy along the shore, which correspond to shifting configuration of the ebb-delta platform. This process creates southerly migrating erosion hotspots (setback of the high-water line by ∼100 m) that, when active, can focus severe erosion on a small portion of the developed beach, while leaving other areas stable or accretionary. These hotspots can last 5–10 years in an aperiodic pattern, and associated beach volume changes associated can be more than 30% of those measured over multi-decadal cycles along the inner-inlet Reservation Terrace beach.
Variability in the timescales and patterns of beach erosion at Plum Island has contributed to the lack of any unified understanding, policy, or response to erosion when it does threaten structures. The responses have been reactionary and short-term in nature: beginning in the late 1950s and early 1960s, a range of beach structures, including groins and riprap seawalls were constructed as a result of an erosional cycle; many have been lost to erosion since then. Local citizen-led response to the most recent erosional period has been even more controversial, comprising the installation of rip-rap revetments along the dune toe fronting nearly two blocks of homes (including in front of lots where houses previously lost to erosion have been replaced by much larger structures, and a single empty lot from which a house had been moved landward) between 2013 and 2015. This action may have exacerbated beach erosion even while protecting adjacent homes, representing a challenge to the Commonwealth’s wetlands protection policies. The two local municipalities, Newbury and Newburyport, benefit significantly from property taxes on highly valued coastal properties, and they face conflicting motivations for responding to the threats of shoreline change (Fallon et al., 2017).
The Plum Island case serves as just one example of how humans have greatly altered sediment transport dynamics along an inlet-associated coastal beach but have failed to develop sustainable strategies to balance the dynamic, interacting natural and human processes that were the consequence. Although communities on Plum Island and surrounding towns now have recognized the need to plan for long-term coastal changes associated with climate change, real-time mitigation continues to be reactive, responding to short-term (<5 years) erosion threats. A collective consensus for best management is lacking, and the development of a longer-term perspective needed for proper planning and adaptation has been elusive. With a deepening understanding of the coastal dynamics on Plum Island, including a characterization of the relative contributions of both nature and humans, we can be more optimistic that adaptations beyond mere reactions to shoreline changes are achievable.
Author Contributions
CH, PR, and PH designed the study and obtained the funding. AF, SB, and GM conducted field data collection and laboratory analyses as part of graduate masters (AF) and undergraduate senior (SB and GM) theses at the Virginia Institute of Marine Science and William & Mary, respectively. IG conducted hydrodynamic modeling. DF, MM, and GF provided scientific, local, and historical input. CH drafted the manuscript with contributions from all co-authors.
Funding
This work was supported financially by the National Science Foundation (NSF) Coastal SEES program (awards OCE 1325430 and OCE 1325366). PH also received partial support through the NSF Coupled Natural-Human Systems program (award AGS 1518503) and the Northeast Regional Sea Grant and Woods Hole Sea Grant Programs (NOAA Cooperative Agreement award NA14OAR4170074).
Conflict of Interest Statement
The authors declare that the research was conducted in the absence of any commercial or financial relationships that could be construed as a potential conflict of interest.
Acknowledgments
We acknowledge Mr. Bob Connors (Plum Island resident) and Ms. Nancy Pau (Parker River National Wildlife Refuge) for beach access and logistical support. We thank Z. Hughes, J. Connell, C. Shuman, and J. Shawler for field and lab support. This is contribution 3825 of the Virginia Institute of Marine Science.
Supplementary Material
The Supplementary Material for this article can be found online at: https://www.frontiersin.org/articles/10.3389/feart.2019.00103/full#supplementary-material
Footnotes
References
Abele, R. W. Jr. (1977). Analysis of Short-Term Variations in Beach Morphology (and Concurrent Dynamic Processes) for Summer and Winter Periods, 1971-72, Plum Island, Massachusetts. Fort Belvoir, VA: U.S. Army, Corps of Engineers, Coastal Engineering Research Center.
Armaroli, C., Ciavola, P., Perini, L., Calabrese, L., Lorito, S., Valentini, A., et al. (2012). Critical storm thresholds for significant morphological changes and damage along the Emilia-Romagna coastline. Italy. Geomorphology 143, 34–51. doi: 10.1016/j.geomorph.2011.09.006
Barnhardt, W., Andrews, B., Ackerman, S., Baldwin, W., and Hein, C. (2009). High Resolution Geologic Mapping of the Inner Continental Shelf: Cape Ann to Salisbury Beach Massachusetts. Reston, VA: U.S. Department of Interior.
Bernatchez, P., Fraser, C., Lefaivre, D., and Dugas, S. (2011). Integrating anthropogenic factors, geomorphological indicators and local knowledge in the analysis of coastal flooding and erosion hazards. Ocean Coast. Manage. 54, 621–632. doi: 10.1016/j.ocecoaman.2011.06.001
Boute, B. J. (2016). Plum Island Sewer System Failure Settled for $5.5m. Available at: https://www.bostonglobe.com/metro/2016/09/01/settlement-reached-over-plum-island-sewer-system-failure/0uODn33qF5VcDXPOA1ERJL/story.html. (accessed September 5, 2016)
Brothers, L. L., Belknap, D. F., Kelley, J. T., and Janzen, C. D. (2008). Sediment transport and dispersion in a cool-temperate estuary and embayment, Saco River estuary, Maine, USA. Mar. Geol. 251, 183–194. doi: 10.1016/j.margeo.2008.02.004
Buijsman, M. C., Sherwood, C. R., Gibbs, A. E., Gelfenbaum, G., Kaminsky, G. M., Ruggiero, P., et al. (2003). Regional Sediment Budget of the Columbia River Littoral Cell, USA Analysis of Bathymetric- and Topographic-Volume Change. Reston, VA: U.S. Department of Interior.
Buonaiuto, F. S. Jr., and Bokuniewicz, H. J. (2008). Hydrodynamic partitioning of a mixed energy tidal inlet. J. Coastal Res. 24, 1339–1348. doi: 10.2112/07-0869.1
Castelle, B., Bourget, J., Molnar, N., Strauss, D., Deschamps, S., and Tomlinson, R. (2007). Dynamics of a wave-dominated tidal inlet and influence on adjacent beaches, Currumbin Creek, Gold Coast, Australia. Coast. Eng. 54, 77–90. doi: 10.1016/j.coastaleng.2006.08.007
Charlier, R. H., Chaineux, M. C. P., and Morcos, S. (2005). Panorama of the history of coastal protection. J. Coastal Res. 21, 79–111. doi: 10.2112/03561.1
Coastal Erosion Commission Commonwealth of Massachusetts [CEC] (2015). Report of the Coastal Erosion Commission, Volume 1: Findings and Recommendations. Available at: https://www.mass.gov/files/documents/2016/12/vl/cec-final-report-dec2015-v1.pdf (accessed August 09, 2017).
Cooper, J. A. G., and McKenna, J. (2008). Social justice in coastal erosion management: the temporal and spatial dimensions. Geoforum 29, 294–306. doi: 10.1016/j.geoforum.2007.06.007
Curren, C. R., and Chatham, C. E. (1979). Design for Wave Protection and Erosion Control; Hydraulic Model Investigation. Vicksburg: USACE Waterways Experiment Station.
Currier, J. J. (1896). “Ould Newbury”: Historical and Biographical Sketches. Boston: Damrell and Upham.
Defeo, O., McLachlan, A., Schoeman, D. S., Schlacher, T. A., Dugan, J., Jones, A., et al. (2009). Threats to sandy beach ecosystems: a review. Estuar. Coast. Shelf S. 81, 1–12. doi: 10.1016/j.ecss.2008.09.022
Dickson, S. M., Slovinsky, P. A., Kelley, J. T., Belknap, D. F., and Brothers, L. L. (2009). “Coastal storms, sediment budgets, and mitigating engineering in Saco Bay,” in Proceedings of the Northeast Geological Society of America Field Trip Guide, (Reston, VA: U.S. Dept. of the Interior), 16.
Donnelly, J. P., Hawkes, A. D., Lane, P., MacDonald, D., Shuman, B. N., Toomey, M. R., et al. (2015). Climate forcing of unprecedented intense-hurricane activity in the last 2000 years. Earth’s Future 3, 49–65. doi: 10.1002/2014EF000274
El Mrini, A., Anthony, E. J., Maanan, M., Taaouati, M., and Nachite, D. (2012). Beach-dune degradation in a Mediterranean context of strong development pressures, and the missing integrated management perspective. Ocean Coast. Manage. 69, 299–306. doi: 10.1016/j.ocecoaman.2012.08.004
Elias, E. P. L., and van der Spek, A. J. F. (2006). Long-term morphodynamic evolution of Texel Inlet and its ebb-tidal delta (The Netherlands). Mar. Geol. 225, 5–21. doi: 10.1016/j.margeo.2005.09.008
Emanuel, K. A. (2013). Downscaling CMIP5 climate models shows increased tropical cyclone activity over the 21st century. Proc. Natl. Acad. Sci. U.S.A. 110, 12219–12224. doi: 10.1073/pnas.1301293110
Executive Office of Energy and Environmental Affairs [EOEEA] (2010). Beach Scraping Report. Byfield, MA: EOEEA.
Fallon, A. R., Hein, C. J., Rosen, P. S., and Gannon, H. L. (2015). “Cyclical shoreline erosion: the impact of a jettied river mouth on the downdrift barrier island,” in Proceedings of the Coastal Sediments ’15, (San Diego, CA).
Fallon, A. R., Hoagland, P., Jin, D., Phalen, B., Fitzsimons, G., and Hein, C. J. (2017). Adapting without retreating: responses to shoreline change on an inlet-associated coastal beach. Coast. Manage. 45, 360–383. doi: 10.1080/08920753.2017.1345607
Farrell, S. C. (1969). “Growth cycle of a small recurved spit, Plum Island, Massachusetts,” in Coastal Environments: Northeastern Massachusetts and New Hampshire, (Amherst, MA: University of Massachusetts, Geology Department, Field Trip Guidebook 1969), 316–336.
Fenster, M., and Dolan, R. (1996). Assessing the impact of tidal inlets on adjacent barrier island shorelines. J. Coastal Res. 12, 294–310.
FitzGerald, D. M. (1984). Interactions between the ebb-tidal delta and landward shoreline: price Inlet, South Carolina. J. Sediment. Petrol. 54, 1303–1318.
FitzGerald, D. M. (1993). Origin and stability of tidal inlets in Massachusetts. Coast. Estuar. Stud. 44, 1–61. doi: 10.1029/ce044p0001
FitzGerald, D. M., Buynevich, I. V., Fenster, M. S., Kelley, J. T., and Belknap, D. F. (2005). “Coarse grained sediment transport in northern New England Estuaries: a synthesis,” in High Resolution Morphodynamics and Sedimentary Evolution of Estuaries, eds D. M. FitzGerald and J. Knight (New York, NY: Springer), 195–214.
FitzGerald, D. M., Buynevich, I. V., and Hein, C. J. (2012). “Morphodynamics and facies architecture of tidal inlets and tidal deltas,” in Principles of Tidal Sedimentology, eds R. A. Davis and R. W. Dalrymple (New York: Springer), 301–333. doi: 10.1007/978-94-007-0123-6_12
FitzGerald, D. M., Buynevich, V. I, Davis, R. A. Jr., and Fenster, M. S. (2002). New England tidal inlets with special reference to riverine-associated inlet systems. Geomorphology 48, 179–208. doi: 10.1016/S0169-555X(02)00181-2
FitzGerald, D. M., Kraus, N. C., and Hands, E. B. (2000). Natural Mechanisms of Sediment Bypassing at Tidal Inlets. Vicksburg: USACE Research and Development Center.
FitzGerald, D. M., Rosen, P. S., and van Heteren, S. (1994). “New England barriers,” in Geology of Holocene Barrier Island Systems, ed. R. A. Davis (Berlin: Springer-Verlag), 305–394.
Fontolan, G., Pillon, S., Delli Quadri, F., and Bezzi, A. (2007). Sediment storage at tidal inlets in northern Adriatic lagoons: ebb-tidal delta morphodynamics, conservation and sand use strategies. Estuar. Coast. Shelf S. 75, 261–277. doi: 10.1016/j.ecss.2007.02.029
Frings, P. J., Clymans, W., Fontorbe, G., Gray, W., Chakrapani, G., Conley, D. J., et al. (2015). Silicate weathering in the Ganges alluvial plain. Earth Planet. Sci. Lett. 427, 136–148. doi: 10.1016/j.epsl.2015.06.049
Galgano, F. A. (2009). Beach erosion adjacent to stabilized microtidal inlets. Middle States Geogr. 42, 18–32.
Garel, E., Sousa, C., Ferreira, O., and Morales, J. A. (2014). Decadal morphological response of an ebb-tidal delta and down-drift beach to artificial breaching and inlet stabilisation. Geomorphology 216, 13–25. doi: 10.1016/j.geomorph.2014.03.031
Garner, A. J., Mann, M. E., Emanuel, K. A., Kopp, R. E., Lin, N., Alley, R. B., et al. (2017). Impact of climate change on New York City’s coastal flood hazard: increasing flood heights from the preindustrial to 2300 CE. Proc. Natl. Acad. Sci. U.S.A. 114, 11861–11866. doi: 10.1073/pnas.1703568114
Gowan, C., Stephenson, K., and Shabman, L. (2006). The role of ecosystem valuation in environmental decision making: hydropower relicensing and dam removal on the Elwha River. Ecol. Econ. 56, 508–523. doi: 10.1016/j.ecolecon.2005.03.018
Graikoski, M., and Hoagland, P. (2017). Comparing policies for encouraging retreat from the Massachusetts coast. Sea Grant Law Pol. J. 8:1.
Granja, H. M., and Carvalho, G. S. (2000). Inland beach migration (beach erosion) and coastal zone management: the experience of the north-west coast of Portugal. Period. Biol. 201, 413–424.
Gurley, G. (2015). Plum Island at Risk: CommonWealth. Available at: http://commonwealthmagazine.org/environment/plum-island-at-risk/ (accessed April 29, 2016)
Gutmann, E. D., Rasmussen, R. M., Liu, C., Ikeda, K., Bruyere, C. L., Done, J. M., et al. (2018). Changes in hurricanes from a 13-yr convection-permitting pseudo–global warming simulation. J. Clim. 31, 3643–3657. doi: 10.1175/JCLI-D-17-0391.1
Haas, K. A., and Hanes, D. M. (2004). Process based modeling of total longshore sediment transport. J. Coast. Res. 20, 853–861. doi: 10.2112/1551-5036(2004)20%5B853:pbmotl%5D2.0.co;2
Haddad, T. C., and Pilkey, O. H. (1998). Summary of the New England beach nourishment experience (1935-1996). J. Coast. Res. 14, 1395–1404.
Hansen, M., and Knowles, S. C. (1988). “Ebb-tidal delta response to jetty construction at three South Carolina inlets,” in Hydrodynamics and Sediment Dynamics of Tidal Inlets, eds D. G. Aubrey and L. Weishar (New York, NY: Springer), 364–381. doi: 10.1007/978-1-4757-4057-8_20
Hapke, C. J., Himmelstoss, E. A., Kratzmann, M. G., List, J. H., and Thieler, E. R. (2011). National Assessment of Shoreline Change: Historical Shoreline Change along the New England and Mid-Atlantic Coasts. Reston, VA: U.S. Department of Interior, 1–66.
Hein, C. J., FitzGerald, D. M., Buynevich, I. V., van Heteren, S., and Kelley, J. T. (2014). Evolution of paraglacial coasts in response to changes in fluvial sediment supply. Geol. Soc. 388, 247–280. doi: 10.1144/sp388.15
Hein, C. J., FitzGerald, D. M., Carruthers, E. A., Stone, B. D., Barnhardt, W. A., and Gontz, A. M. (2012). Refining the model of barrier island formation along a paraglacial coast in the Gulf of Maine. Mar. Geol. 307–310, 40–57. doi: 10.1016/j.margeo.2012.03.001
Hein, C. J., Fitzsimons, G. G., FitzGerald, D. M., and Fallon, A. R. (2016). Records of migration and ebb-delta breaching at historic and ancient tidal inlets along a river-fed paraglacial barrier island. J. Coastal Res. 75, 228–232. doi: 10.2112/SI75-46.1
Hill, H. W., Kelley, J. T., Belknap, D. F., and Dickson, S. M. (2004). The effects of storms and storm-generated currents on sand beaches in Southern Maine, USA. Mar. Geol. 210, 149–168. doi: 10.1016/j.margeo.2004.05.008
Houston, J. R., and Dean, R. G. (2015). Erosional impacts of modified inlets, beach encroachment, and beach nourishment on the east coast of Florida. J. Coastal Res. 32, 227–240. doi: 10.2112/JCOASTRES-D-15-00105.1
Hubbard, D. K. (1976). “Changes in inlet offset due to stabilization,” in Proceedings of the 15th International Conference on Coastal Engineering, (Honolulu).
Hume, T. M., and Herdendorf, C. E. (1992). Factors controlling tidal inlet characteristics on low drift coasts. J. Coastal Res. 8, 355–375.
Inman, D. L., and Jenkins, S. A. (1984). “The Nile littoral cell and man’s impact on the coastal zone of the southeastern Mediterranean,” in Proceedings of the 19th International Conference on Coastal Engineering, (Houston, TX), 1600–1617.
Jiménez, J. A., and Sánchez-Arcilla, A. (1993). Medium-term coastal response at the Ebro delta. Spain. Mar. Geol. 114, 105–118. doi: 10.1016/0025-3227(93)90042-T
Knutson, T. R., Sirutis, J. J., Zhao, M., Tuleya, R. E., Bender, M., Vecchi, G. A., et al. (2015). Global projections of intense tropical cyclone activity for the late twenty-first century from dynamical downscaling of CMIP5/RCP4. 5 scenarios. J. Clim. 28, 7203–7224. doi: 10.1175/JCLI-D-15-0129.1
Kossin, J. P. (2018). A global slowdown of tropical-cyclone translation speed. Nature 558, 104–108. doi: 10.1038/s41586-018-0158-3
Kossin, J. P., Camargo, S. J., and Sitkowski, M. (2010). Climate modulation of North Atlantic hurricane tracks. J. Clim. 23, 3057–3076. doi: 10.1175/2010JCLI3497.1
Kossin, J. P., Emanuel, K. A., and Vecchi, G. A. (2014). The poleward migration of the location of tropical cyclone maximum intensity. Nature 509, 349–352. doi: 10.1038/nature13278
Kraus, N. C. (2000). Reservoir model of ebb-tidal shoal evolution and sand bypassing. J. Waterw. Port Coast. 126, 305–313. doi: 10.1061/(asce)0733-950x(2000)126:6(305)
Kraus, N. C., and Galgano, F. A. (2001). Beach Erosional Hot Spots: Types, Causes, and Solutions. Vicksburg: USACE Research and Development Center.
Labaree, B. W. (1962). Patriots and Partisans: The Merchants of Newburyport. Cambridge: Harvard University Press, 1764–1815.
Lesser, G. R., Roelvink, J. A., van Kester, J. A. T. M., and Stelling, G. S. (2004). Development and validation of a three-dimensional morphological model. Coast. Eng. 51, 883–915. doi: 10.1016/j.coastaleng.2004.07.014
Li, H., Brown, M., Beck, T., Frey, A., Rosati, J., Habel, M., et al. (2018). Merrimack Estuary and Newburyport Harbor Sediment Management Studies. Vicksburg: USACE Research and Development Center.
Macone, J. (2008). ‘How Many Times are We Going to Save Something?’ Beach Erosion, Regrowth, an Endless Pattern. Newburyport, MA: The Daily News of Newburyport.
McLachlan, A. (1996). Physical factors in benthic ecology: effects of changing sand particle size on beach fauna. Mar. Ecol. Prog. Ser. 131, 205–217. doi: 10.3354/meps131205
Milliman, J. D., and Farnsworth, K. L. (2011). River Discharge to the Coastal Ocean. Cambridge: Cambridge University Press.
Nerem, R. S., Beckley, B. D., Fasullo, J. T., Hamlington, B. D., Masters, D., and Mitchum, G. T. (2018). Climate-change–driven accelerated sea-level rise detected in the altimeter era. Proc. Natl. Acad. Sci. U.S.A. 115, 2022–2025. doi: 10.1073/pnas.1717312115
Nichols, R. L. (1942). Shoreline changes on Plum Island, Massachusetts. Am. J. Sci. 240, 349–355. doi: 10.2475/ajs.240.5.349
NOAA Office of Ocean and Coastal Resource Management (2013). Beach Nourishment: A Guide for Local Government Officials. National Oceanographic and Atmospheric Administration. Available at: https://coast.noaa.gov/archived/beachnourishment/html/human/law/index.htm (accessed September 10, 2015).
Nordstrom, K. F. (2000). Beaches and Dunes on Developed Coasts. Cambridge: Cambridge University Press.
Oertel, G. F. (1977). Geomorphic cycles in ebb deltas and related patterns of shore erosion and accretion. J. Sed. Res. 47, 1121–1131. doi: 10.1306/212F72F2-2B24-11D7-8648000102C1865D
Pilkey, O. H., and Clayton, T. D. (1989). Summary of beach replenishment experience on U.S. East Coast barrier islands. J. Coastal Res. 5, 147–158.
Ralston, D. K., Geyer, W. R., Lerczak, J. A., and Scully, M. (2010). Turbulent mixing in a strongly forced salt wedge estuary. J. Geophys. Res. 115:C12. doi: 10.1029/2009JC006061
Ridderinkhof, W., de Swart, H. E., van der Vegt, M., and Hoekstra, P. (2016). Modeling the growth and migration of sandy shoals on ebb-tidal deltas. J. Geophys. Res. 121, 1351–1372. doi: 10.1002/2016JF003823
Rios, S. (2018). Entrench Or Retreat? That Is the Question On Plum Island. Available at: https://www.wbur.org/news/2018/08/02/plum-island-climate-change-entrench-retreat (accessed August 3, 2018)
Robin, N., Levoy, F., Monfort, O., and Anthony, E. (2009). Short-term to decadal-scale onshore bar migration and shoreline changes in the vicinity of a megatidal ebb delta. J. Geophys. Res. 114, 1–13. doi: 10.1029/2008JF001207
Sexton, N. R., Dietsch, A. M., Don Carlos, A. W., Koontz, L., Solomon, A. N., and Miller, H. M. (2012). National Wildlife Refuge Visitor Survey 2010/2011: Individual Refuge Results for Parker River National Wildlife Refuge. Reston, VA: U.S. Department of Interior.
Shi, W., and Huang, J.-C. (2018). Correcting on-site sampling bias: a new method with application to recreation demand analysis. Land Econ. 94, 459–474. doi: 10.3368/le.94.3.459
Smith, J. B. (1991). Morphodynamics and Stratigraphy of Essex River Ebb-Tidal Delta: Massachusetts. Vicksburg: USACE.
Stein, M. L. (2012). Interpolation of Spatial Data: Some Theory for Kriging. New York, NY: Springer Science & Business Media.
Talke, S. A., Kemp, A. C., and Woodruff, J. (2018). Relative sea level, tides, and extreme water levels in Boston Harbor from 1825 to 2018. J. Geophys. Res. 123, 3895–3914. doi: 10.1029/2017JC013645
Taylor, J. A., Murdock, A. P., and Pontee, N. I. (2004). A macroscale analysis of coastal steepening around the coast of England and Wales. Geogr. J. 170, 179–188. doi: 10.1111/j.0016-7398.2004.00119.x
The Heinz Center (2000). Evaluation of Erosion Hazards. Washington, DC: The H. John Heinz Center for Science, Economics and the Environment.
Thieler, R. E., Smith, T. L., Knisel, J. M., and Sampson, D. W. (2013). Massachusetts Shoreline Change Mapping and Analysis Project, 2013 Update. Reston, VA: U.S. Department of Interior, 1–16.
United States Army, Corps of Engineers [USACE] (1952). Office of the Division Engineer, New England Division: Beach Erosion Control Report on Cooperative Study of Plum Island. Plum Island, MA: USACE.
United States Army, Corps of Engineers [USACE] (1967). New England Division: Small Beach Erosion Control Project. Plum Island, MA: USACE.
United States Army, Corps of Engineers [USACE] (1973). New England Division: Small Beach Erosion Control Project. Plum Island Beach, MA: USACE.
United States Army, Corps of Engineers [USACE] (2014). 2014 USACE NAE Topobathy Lidar. Newbury, MA: USACE. Available at: https://inport.nmfs.noaa.gov/inport/item/49777 (accessed July 20, 2015).
Van Rijn, L. C. (2011). Coastal erosion and control. Ocean Coast. Manag. 54, 867–887. doi: 10.1016/j.ocecoaman.2011.05.004
Wang, H., Yang, Z., Saito, Y., Liu, J. P., Sun, X., and Wang, Y. (2007). Stepwise decreases of the Huanghe (Yellow River) sediment load (1950-2005): impacts of climate change and human activities. Glob. Planet. Chang. 57, 331–354. doi: 10.1016/j.gloplacha.2007.01.003
Wang, P., and Beck, T. M. (2012). Morphodynamics of an anthropogenically altered dual-inlet system: John’s Pass and Blind Pass, west-central Florida, USA. Mar. Geol. 291, 162–175. doi: 10.1016/j.margeo.2011.06.001
Watts, I. M., and Zarillo, G. A. (2013). “Macroscale geomorphic evolution of an inlet,” in Proceedings of the 7th International Conference on Coastal Dynamics, (Arcachon), 1881–1892.
Woods Hole Group (2017). Great marsh Resiliency Project Wave Analysis and Numerical Modeling. Falmouth: Woods Hole Group.
Yang, S. L., Milliman, J. D., Li, P., and Xu, K. (2011). 50,000 dams later: erosion of the Yangtze River and its delta. Glob. Planet. Chang. 75, 14–20. doi: 10.1016/j.gloplacha.2010.09.006
Keywords: tidal-inlet dynamics, beach erosion, coastal adaptation, developed beach, shoreline change
Citation: Hein CJ, Fallon AR, Rosen P, Hoagland P, Georgiou IY, FitzGerald DM, Morris M, Baker S, Marino GB and Fitzsimons G (2019) Shoreline Dynamics Along a Developed River Mouth Barrier Island: Multi-Decadal Cycles of Erosion and Event-Driven Mitigation. Front. Earth Sci. 7:103. doi: 10.3389/feart.2019.00103
Received: 15 January 2019; Accepted: 24 April 2019;
Published: 14 May 2019.
Edited by:
Clara Armaroli, University of Ferrara, ItalyReviewed by:
Edward Anthony, Aix-Marseille Université, FranceYann Balouin, Bureau de Recherches Géologiques et Minières, France
Copyright © 2019 Hein, Fallon, Rosen, Hoagland, Georgiou, FitzGerald, Morris, Baker, Marino and Fitzsimons. This is an open-access article distributed under the terms of the Creative Commons Attribution License (CC BY). The use, distribution or reproduction in other forums is permitted, provided the original author(s) and the copyright owner(s) are credited and that the original publication in this journal is cited, in accordance with accepted academic practice. No use, distribution or reproduction is permitted which does not comply with these terms.
*Correspondence: Christopher J. Hein, hein@vims.edu