Severe Convection Features in the Amazon Basin: A TRMM-Based 15-Year Evaluation
 Ana M. P. Nunes
 Maria A. F. Silva Dias
 Evandro M. Anselmo
 Carlos A. Morales
- Department of Atmospheric Sciences, Universidade de São Paulo, São Paulo, Brazil
Rainfall in the Amazon Basin is very heterogeneous, mainly because the area encompassed is quite large. Among the systems responsible for rainfall, some stand out as extreme storm events. This study presents a criterion for identifying potentially severe convection (PSC) in the Amazon region from the Tropical Rainfall Measuring Mission (TRMM) database, specifically from Precipitation Features (PF)—1998–2012—generated and stored by the University of Utah. The seasonal and spatial distributions are similar to distributions of Mesoscale Convective Systems already cataloged in previous studies based on GOES satellite images. The seasons with the highest number of cases are austral spring, winter, and fall. With the Amazon region divided into six subregions and cases accumulated by quarter (JFM, AMJ, JAS, OND) the south of the Amazon subregion (SA) accounts for the largest number of cases with the OND quarter with higher occurrence and the lowest in AMJ. Different diurnal cycles of PSC are observed across the region with the more western areas, closer to the Andes, favoring nighttime cases, especially in the austral spring and summer. The diurnal cycle of the number of the most extreme cases is more pronounced than the diurnal cycle when a large collection of deep convection cases are included.
Introduction
The Amazon Basin rainfall is heterogeneous with annual totals showing a maximum in the northwest of the basin that extends toward the southeast, with a secondary maximum in the north close to the mouth of the Amazon River (Rao and Hada, 1990; Liebmann and Marengo, 2001). A modulation of rainfall by the large Amazonian rivers provides a mesoscale variability of rainfall as well (Silva Dias et al., 2004; Fitzjarrald et al., 2008; Paiva et al., 2011; Santos et al., 2014) with more rain close to the rivers due to the interaction of the river breeze with the large scale flow.
In the seasonal scale, Kousky (1988) and Marengo et al. (2001) show that there is a lag of 6 months between the onset of the rainy season in the northwest of the Amazon basin (June/July) and the rainy season in the southern half of the basin (starting in December). The rainy season begins in the austral spring in southern Amazon, with most of the rain in the austral summer. The austral winter corresponds to the dry season in most of the region, although it represents a rainy maximum for the far northwest of the basin. Well-defined wet and dry seasons are associated with the so-called South American Monsoon System, hereafter SAMS (Carvalho et al., 2011). Within the SAMS, the South Atlantic Convergence Zone (SACZ) represents a dominant feature of the wet season and is seen as a wide region of rainfall extending from the northwest to the southeast of the Basin and reaching the southern Atlantic. The SACZ may last for several days and be associated with extreme rainfall in most of central and southeastern Brazil (Carvalho et al., 2004).
The proximity to the equator and to the Atlantic Ocean indicates the marked influence of the Inter Tropical Convergence Zone (ITCZ; Hastenrath, 1984) which directly affects the northern part of the basin. The ITCZ reaches its southernmost position, 2°S, in March-April, and its northernmost position, 14°N, in August-September. Anomalies in the ITCZ linked to sea surface temperature anomalies in the Equatorial Atlantic have a considerable impact on rainfall in the Amazon Basin, including the occurrence of drought (Marengo et al., 2011).
Annual and monthly rainfall totals, however, do not provide a complete picture of convective intensity and of the eventually-associated severity. In the southwest Amazon basin, several authors (Anagnostou and Morales, 2002; Carvalho et al., 2002; Petersen et al., 2002; Silva Dias et al., 2002; Rickenbach, 2004; Albrecht et al., 2011) have identified periods in which rainfall is more stratiform and shallow with low amplitude of the diurnal cycle associated with the active phase of SAMS, i.e., when the SACZ is active. During break phase periods of the SAMS, rainfall is associated with deep convection, with a well-defined peak in the afternoon. It is also associated with high ice content, which may produce hail, lightning, and strong winds at the surface associated with downdrafts. According to Williams et al. (2002) among others, in the first case, cloud systems are similar to maritime systems, while in the latter case they have a more continental-type behavior. The continental case has the potential to show some severity in the form of high ice content, which may produce hail and strong winds at the surface and high lightning flash rates.
The question addressed here is where and when severe convection occurs in the Amazon Basin. We start by looking into how should we define and count a severe storm in a region with low density population of about 4 inhabitants/km2 (http://www.censo2010.ibge.gov.br/sinopse/index.php?dados=10&uf=00). Previous work in the past by several authors indicates the way to follow here.
There are many definitions of severe storms. The concept of storm severity is associated to the fact that a system can generate phenomena with a significant social and economic impact. However, this is an arbitrary concept and varies according to geographical and topographical features. Johns and Doswell (1992), Moller (2001), and Mills and Conquhoun (1998) among others, through analysis of regions in the United States of America and Australia, define severe weather as storms that are capable of generating at least one of the following phenomena: tornado, strong winds at the surface or even high precipitation rates causing flash floods. Nascimento (2004) and Silva Dias (2011) indicate that for southern Brazil, the region where most severe weather has been observed is located south of 20°S. However, Mesoscale Convective Systems (MCS) and a few tornado reports have been observed (Silva Dias et al., 2009; Dias, 2011) in the Amazon basin.
Intense convection cases in equatorial and tropical latitudes have been documented. Nesbitt et al. (2000), Zipser et al. (2006), and Liu et al. (2008) show strong indications that extreme storm events occur in the Amazon, although this is not a preferred region of the globe or even of South America for the most extreme events. With respect to the surface impact, Nelson et al. (1994) were the first to detect in the Amazon basin concentrated deforestation, with a length of several kilometers and a few tens of meters wide, which were called blowdowns. The reason for the name was local evidence that the trees in the deforested strip were cut down by bursts of high-speed winds, the so called downbursts or microbursts. Garstang et al. (1998) attributed the blowdowns to the large squall lines generated at the northern coast (Cohen et al., 1995; Alcântara et al., 2011) that propagate due south and west throughout the Amazon Basin.
For the Amazon Basin, however, with its low population density outside of urban areas, the measure of storm severity by their detected impacts is quite a difficult task. Romatschke and Houze (2010) analyze extreme convection during the wet season in South America; they do not study the rest of the year as we propose to do here. They use three-dimensional Precipitation Radar fields, from the Tropical Rainfall Measuring Mission (TRMM), to identify severe convection. They also analyze the large scale forcing associated with each region.
There are at least three main reason to attempt a broader study of when and where severe convection is most likely to be observed in the Amazon basin: (1) to provide a framework for weather forecasts in the region, (2) to provide an input for the possible impact on local deforestation by natural causes, and (3) to provide a framework for improvement of global climate models.
Identifying the occurrence of potentially severe convection (PSC) in the Amazon Basin has a local importance since the growing population and economic growth of the region increases vulnerability to severe weather, mainly close to urban areas. As an example, on 7 September 2012 a boat with 45 people onboard was capsized by strong winds produced by a thunderstorm close to the city of Manaus (Globo, 2012).
Deforestation plays a major role in carbon balance, and the Amazon region is traditionally a focal point of this issue (IPCC, 2013). Negrón-Juárez et al. (2010) showed that the tree mortality associated with severe convection is important enough to be considered in the carbon budgets in the region that consider deforestation.
From a broader view of the global atmospheric circulation, theoretical studies (e.g., Raupp et al., 2008; Raupp and Silva Dias, 2010) have indicated that the diurnal cycle of deep convection in equatorial regions such as the Amazon Basin may be associated with the resonant interactions of large-scale tropical waves, which are ultimately associated with tropical extra-tropical teleconnections. According to these studies, the diurnal cycle of deep convection throughout the region may be an important ingredient in the multiscale interactions involved. Global models are known to have errors in the phase of the diurnal cycle, especially in tropical continental areas such as the Amazon basin, where simulated convection has a maximum that is too early (Bechtold et al., 2004). Most of the deep convective parameterizations provide an afternoon maximum of rainfall that is homogeneous throughout the basin.
This paper presents an analysis of potentially-severe cases of convection in the Amazon basin and for the different subregions. The analysis is based on 15 years of TRMM satellite data. A criterion for identification of potentially-severe cases is used based on previous work by Nesbitt et al. (2000) and others. The results demonstrate the spatial variability, the diurnal cycle, and the seasonality of the occurrence of PSC. The objective is to provide a reference for the heterogeneity and a physical discussion on the spatial distribution of cases of severe convection, on the seasonal accumulation of cases throughout the Amazon Basin, and on the differences in diurnal cycles.
Data and Methods
The identification of PSC—which will be defined shortly—is based on data derived from the TRMM satellite and processed as Precipitation Features (PF) by the University of Utah (http://trmm.chpc.utah.edu). Nesbitt et al. (2000) were the first to synthetize the vast amount of information derived from the TRMM sensors as PF. They grouped pixels with radar reflectivity from the Precipitation Radar (PR) close to the surface >20 dBz, and by ice scattering signature given by the Polarization Corrected Temperature at 85 GHz (PCT85GHz) from the TRMM Microwave Imager (TMI). The PCT is a linear combination of horizontal and vertical polarizations of brightness temperature that has been used to correct the different surface emissions, specially water and land (Spencer, 1986). TMI measurements have been employed to retrieve water vapor, cloud water, ice content, and surface rainfall rates (Kummerow et al., 1998) by using five frequencies (10.7, 19.4, 21.3, 37, and 85.5 GHz). At 85 GHz, the outgoing radiation is strongly dependent on the ice scattering present in deep convection.
Different combinations of these PFs were used to analyze deep convection in several regions of the tropics. Liu et al. (2008) refined the methodology by defining three levels of processing leading to the definition of PFs. According to Liu et al. (2008) the Level 1 data corresponds to an arrangement of observations and retrievals of different instruments that are onboard the TRMM satellite. Measurements used are those in the PR group and the common grid for this arrangement corresponds to the pixels of the PR. Level 2 groups PFs according to different settings, followed by calculations of size, volume of rain, reflectivity, and brightness temperature, among others (Liu et al., 2008). Level 3 data provides individual cloud features and Level 2 precipitation systems in a grid with a resolution of 1 × 1°, which incorporates estimates by precipitation statistics from other sources as described by Liu et al. (2008) and summarized in Table 1.
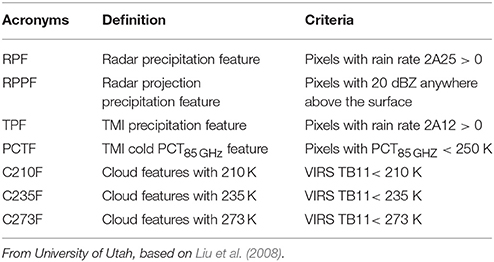
Table 1. TRMM Feature definition.
In Level 2 data, the Radar Precipitation Feature (RPF) is referred to as the precipitation feature 2A25 obtained from the PR, and includes neighboring pixels of rain rate close to the surface. The TRMM Microwave Imager Precipitation Features (TPF) is associated with contiguous pixels of rain close to the surface. The Radar Projection Precipitation Feature (RPPF) refers to precipitation features detected at the radar projection close to the surface with reflectivity >20 dBZ. The Polarization Corrected Temperature Feature (PCTF) refers to features with PCT colder than a given threshold, for example PCT85GHz < 250 K. Cloud features are defined using the Visible and Infrared Scanner (VIRS) at 10.8 μm with brightness temperature (TB11). The conditions TB11 < 210, < 235, and < 273 K are referred as the subsets C210F, C235F, and C273F, respectively. Liu et al. (2008) suggest the use of Level 2 subsets as tools to select particular cases or historic events.
To search for particular features associated with MCSs in the very large amount of data of the SSMI (Special Sensor Microwave Imager), a precursor of the TMI, Mohr and Zipser (1996) used the PCT85GHz. Here we follow their criteria to define a MCS: a contiguous area larger than 2000 km2 with PCT85GHz < 250 K with at least one pixel with PCT < 225 K or less—to assure the presence of penetrative deep convection within the larger area. The features from Level 2 are used to identify the systems. The data from this level are stored into monthly files in which the precipitation systems are listed with their individual features including day and hour of occurrence. The hour of occurrence will be used to accumulate cases in 6-h intervals, for the different subregions and seasons, and thus have an indication of the diurnal cycle. The TRMM orbit allow an overpass of the same region every 3 weeks allowing a coverage of 24 h/day (Negri et al., 2002). With 15 years of data there is good sampling of the diurnal cycle, however it is understood that not all cases will be detected. The number count obtained here may be seen as a proxy for the total amount that would be obtained by, for example, a dense array of weather radars or by a geostationary radar with a radar onboard.
The area of each system is calculated by the number of pixels, each pixel having an area of 25 km2 (http://disc.sci.gsfc.nasa.gov/precipitation/documentation/TRMM_README). Thus, 80 pixels are equivalent to 2000 km2. The identification of the several subsets uses Interactive Data Language (IDL) scripts.
Additional criteria have been tested here and they are listed in Table 2. All subsets are required to have 80 pixels or more with PCT85GHz < 250 K and rain rate volume larger than 1000 mm/h km2. This corresponds to an average rainfall rate per pixel of 40 mm/h, which is an instantaneous value given by the PR, and may be considered a heavy rainfall rate. According to Rasmussen et al. (2013) the rain rates associated with deep convection are likely to be underestimated by the TRMM PR, but we will use this in a relative sense, throughout the region. Subsets 1, 2, and 3 require at least 1 pixel within the larger area with PCT85GHz < 250, 200, and 100 K, respectively. Less ice content is associated with higher values of PCT85GHz. Thus, subsets 1 and 2 should have a lower probability of lightning (e.g., Petersen and Rutledge, 2001). Subset 3 has the coldest PCT85GHz being associated with the largest amount of ice scattering. This may be an indication of a potentially severe case. Subset 4 requires one more condition with respect to subset 3 which is the actual presence of lightning indicated by the TRMM Lightning Imager Sensor (LIS). Following Cecil et al. (2005) the lightning flash rate (min−1) has been obtained by dividing the number of lightning flashes by the average of pixels of LIS view time observed in each PF.
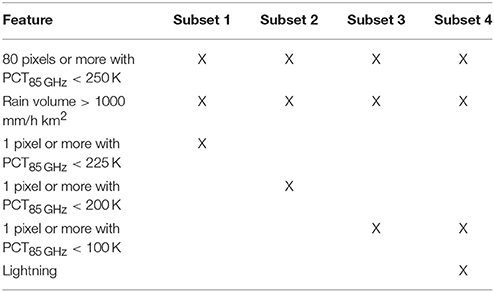
Table 2. Criteria for selection of potentially severe cases in the region containing the Amazon Basin (20°S–10°N and 80°W–40°W).
The several criteria defined in Table 2 have been applied to the entire period from 1998 to 2012, for the region 20°S–10°N e 80°W–40°W shown in Figure 1. The resulting selection is used to analyze the monthly evolution for each dataset as well as the spatial distribution of cases. For the spatial distribution, the number of cases is accumulated in 2 × 2° grid boxes.
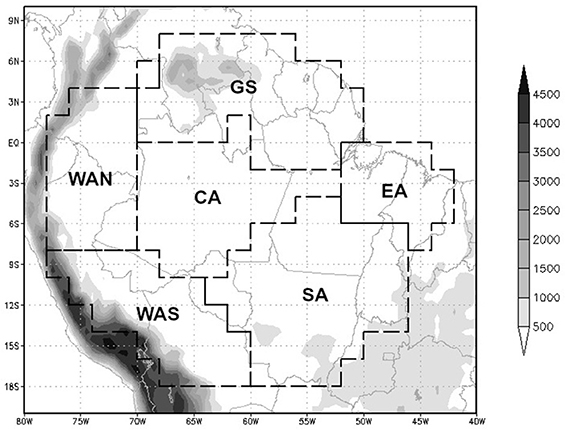
Figure 1. Regions under study denoted by black dashed lines. WAS, southern part of western Amazonia; WAN, northern part of western Amazonia; GS, Guyana Shield; CA, central Amazonia; EA, eastern Amazonia; SA: southern Amazonia (Adapted from ter Steege et al., 2013). Shading indicates topography in meters. Light gray contours indicate political boundaries for countries and Brazilian states.
Due to the great extension of Amazon basin, it is necessary to divide it into smaller areas to evaluate the different PF frequency. The Amazon subregion classification presented by ter Steege et al. (2013), based on soil and vegetation features, has been used. Figure 1 shows the following subregions: WAS (southern part of western Amazonia), WAN (northern part of western Amazonia), GS (Guyana Shield), CA (central Amazonia), EA (eastern Amazonia) e SA (southern Amazonia). Figure 1 also shows the topography of the region, with altitude given in 500 m intervals. The Andes Mountains are seen to the west of the Basin, and most of the Basin is quite flat with some elevations in the GS subregion to the north and in the southeastern boundary of the SA subregion showing the beginning of the slopes of central Brazil. Laurent et al. (2002) and Gonçalves et al. (2015) show that even small elevations of < 300 m above sea level may trigger convection in the Amazon Basin. This is observed within the flat areas of < 500 m indicated in Figure 1.
Results and Discussion
The results will first be presented for the entire area that encloses the Amazon Basin indicated in Figure 1, and then for the subregions.
Amazon Basin
The number of cases that follow the criteria listed in Table 2 for subsets 1, 2, 3, and 4 may be seen in Figure 2 for the entire area, and for the 1998–2012 period, separated by month. The totals indicated refer to the 15 years of data in each month. Criteria 1 and 2 have similar results as well as criteria 3 and 4. Criteria 3 and 4 give similar results due to the very cold PCT85GHz being associated with large amounts of ice, which is also associated with lightning (Petersen and Rutledge, 2001). For criteria 1 and 2 the number of cases varies between about 1493 and 3721 cases per month with a minimum in August and a maximum in March. Criteria 3 and 4 have monthly totals between 74 and 233 but with two minima—February and May, and two peaks—March and October. The overall minima for criteria 3 and 4 is in October and the overall minimum in February. Most of the Amazon region is in the wet season in February, while October is the transition between dry and wet season for most of the region (Marengo et al., 2001). It is seen that for criteria 3 and 4, the systems with more indications of severity, such as the amount of ice and lightning, follow a different annual cycle than the less intense systems in criteria 1 and 2. This is an indication that the wet season convective systems in the Amazon basin may not be severe, being shallower, with vertical structure similar to maritime cases, as has been indicated by Petersen and Rutledge (2001). Williams et al. (2002), and Albrecht et al. (2011) show that for southwestern Amazon, September, and October are the months with more indications of severity as measured by counts of cloud to ground lightning. For criteria 1 and 2 the maximum in March is intriguing since, according to Rao et al. (1996) the Amazon basin gets about 70% of its rainfall yearly total between September and February. March is also a secondary maximum for criteria 3 and 4, which may be a result of the larger number of cases of deep convection obtained with criteria 1 and 3.It may be seen in Figure 2 that the most restrictive criterion is the one defining subset 4, obtained when the requirement of lightning is introduced in the cases obtained in subset 3. Since lightning is one of the indicators of deep convection, it is believed that subset 4 may be used to represent the occurrence of PSC. Hereafter, the cases based on subset 4 will be referred as PSC.
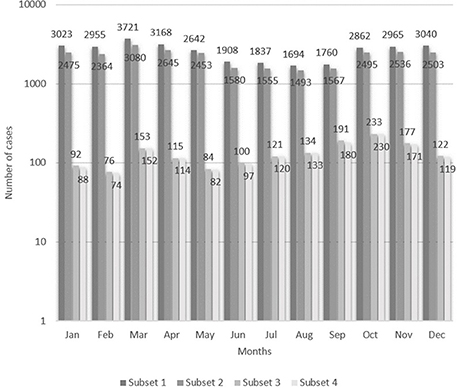
Figure 2. Number of cases for each month of potentially severe convection based on the criteria defined in Table 2 for the four subsets over the area extending from 20°S to 10°N and 80°W–40°W and for the period 1998–2012.
For each season, Figure 3 shows the histograms of total area with PCT85GHz < 250 K, total area with PCT85GHz < 100 K representing the colder cores and the rate of lightning for PSC. Table 3 synthetizes the number of cases of PSC and the percentage in upper and lower classes. The total area may reach more than 70,000 km2 in a few cases while the colder region may reach more than 1000 km2. Flashing rates of more than 220 flashes/minute have been observed. About 70% of the cases, in all seasons have total area between 2000 and 10,000 km2 and area of the colder nucleus between 25 and 200 km2. The lightning rate associated with approximately 70% of the cases is 40 flashes/min, with the exception of austral spring (SON) where almost 40% of the cases have more than 40 flashes/min. The occurrence of severe weather in the form of hail, tornados, downbursts are often associated with high lightning rates (MacGorman et al., 1989; Carey and Rutledge, 1998; Williams et al., 1999). Anselmo (2015) studied the morphology of electrical storms in South America using the TRMM LIS and showed that rates above 47.2 flashes/min may be considered extreme. The present study confirms the presence of a considerable number (30% on average) of PSC in the Amazon that may be comparable to other severe cases in the subtropical areas of South America, considered by Zipser et al. (2006) as the most extreme cases in the region. Again, if the entire basin is considered, austral spring (SON) has the largest number of PSC with the highest lightning rates.
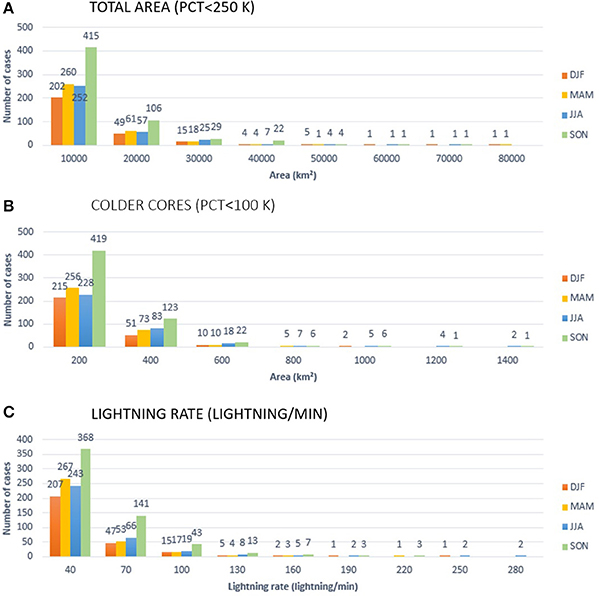
Figure 3. Histogram of number of cases per season of potentially severe convection cases in subset 4, for 1998–2012, where: (A) total area of the system defined by PCT < 250K; (B) Area of the coldest region for PCT < 100 K; (C) Lightning rate.
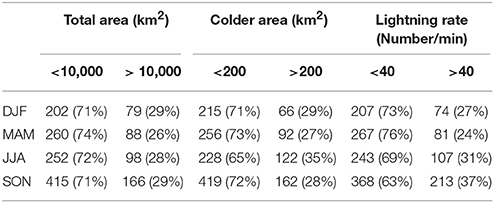
Table 3. Features of potentially severe convection cases for each season.
The spatial distribution of the number of cases of PSC accumulated in the 2 × 2° area may be seen in Figure 4, for each season. As a reference, Silva Dias et al. (2009) summarized the identification of MCSs in South America performed by several authors (Velasco and Fritsch, 1987; Conforte, 1997; Torres and Nicolini, 2002; Salio et al., 2007) based on GOES infrared images. The spatial distribution in Figure 4 shows some features that are similar to the ones presented by Silva Dias et al. (2009). During the austral summer (DJF), most of the cases are seen in the south, west, and east of the Amazon region. In the austral fall (MAM) the cases are evenly distributed in the Amazon Basin. The dry season of most of the Amazon that takes place during the austral winter (JJA) when there is a reduced number of cases as compared to the other seasons. A large number of cases is seen in the northwest sector except in the austral summer (DJF) as has been indicated in the earlier work of Velasco and Fritsch (1987). Austral spring (SON) is the season with the larger number of systems mainly located in the southwest, south, and east of the basin. As has been discussed by Fu and Li (2004), the transition between the dry and wet seasons in the Amazon Basin is associated with a change in low-level circulation and thermodynamic stability as well as a change in surface partitioning of surface fluxes where sensible heat flux decreases and latent heat flux increases. The Convective Inhibition Energy (CINE) is large at the beginning of the transition mostly related to a subsidence inversion. When CINE is overcome, very extreme convective events may take place. As the wet season progresses, CINE decreases and CAPE increases (Machado et al., 2004) and more widespread convection is observed, with few severe events. Romatschke and Houze (2010) indicate that wide convergence zones are associated with the development of deep convection during the wet season while Laurent et al. (2002) and Gonçalves et al. (2015) indicate that even low elevation topography may be enough to trigger deep convective systems in the wet season.
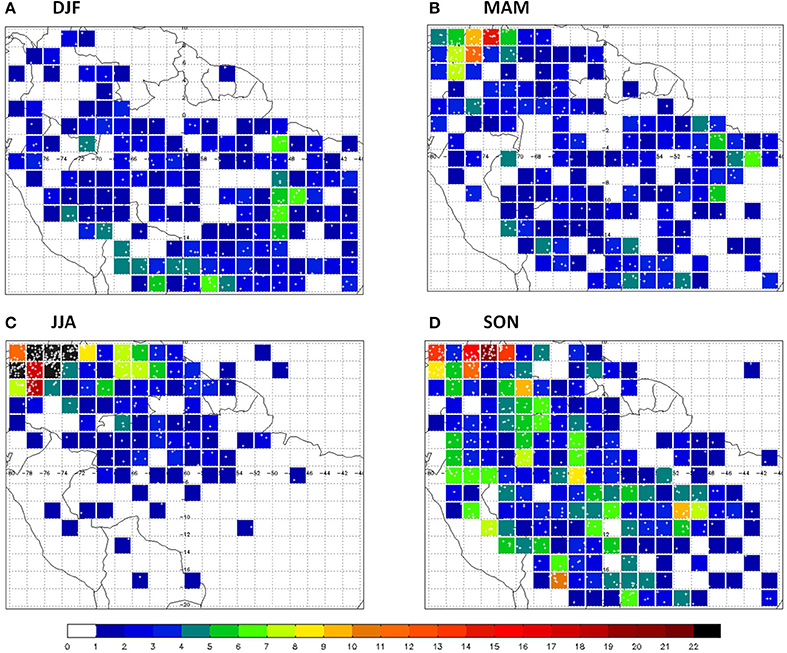
Figure 4. Distribution of the number of potentially severe cases in subset 4 at a 2° resolution grid for the period 1998–2012 for: (A) December–January–February; (B) March–April–May; (C) June–July–August; (D) September–October–November.
Subregions of the Amazon Basin
The classification of ter Steege et al. (2013) shown in Figure 1 is used to investigate the seasonal and diurnal cycles of PSC. Figure 5 shows the number of cases of PSC for each one of the six subregions and for each quarter JFM, AMJ, JAS, OND. Since the wet season does not necessarily correspond to the summer season in all regions of the Amazon (Marengo et al., 2001), the results here are shown for the previously-defined quarters and not for seasons. As a general reference, Table 4 summarizes the wet season from Marengo et al. (2011) and the rainiest quarter from Rao and Hada (1990). For the areas that are not fully included in either one of the references, the closest classification is used. It may be seen that the two classifications are consistent with the rainiest quarter contained within the wet season. For the WAN region, the classification in Rao and Hada (1990) is the one north of the Equator close to the box for the climatology used in Marengo et al. (2011).
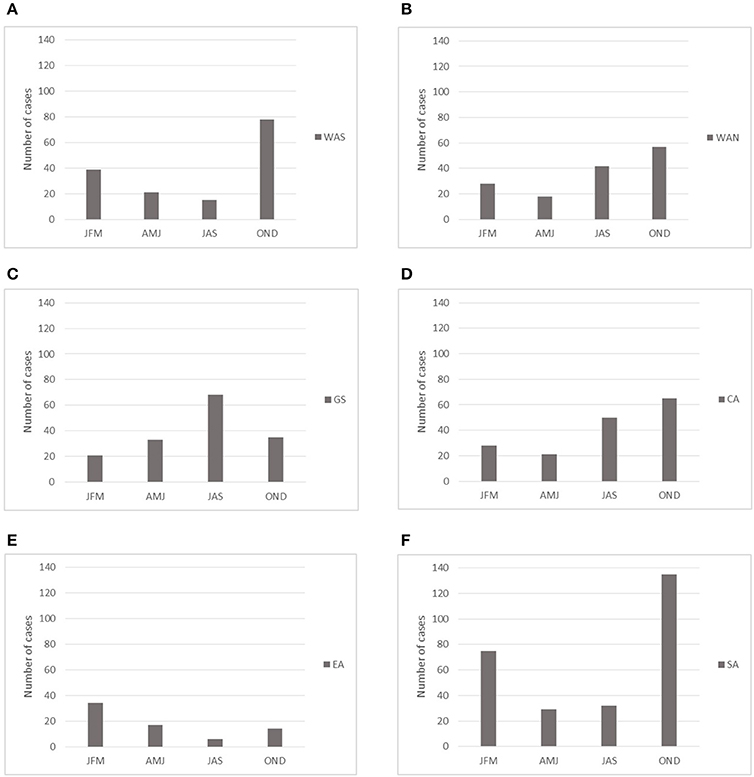
Figure 5. Number of cases for each quarter for the subregions defined in Figure 1, for 1998–2012, where: (A) WAS, (B) WAN, (C) GS, (D) CA, (E) EA, (F) SA.
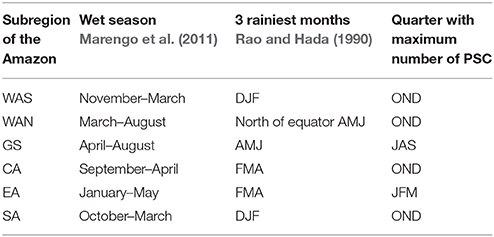
Table 4. Beginning and end of the wet season from Marengo et al. (2011), rainiest quarter from Rao and Hada (1990), and the quarter with maximum number of occurrences of PSC.
Figure 5F indicates that the SA region accounts for the largest number of cases with a total of 271 for the study period. The quarter with highest occurrence is OND (135), the lowest AMJ (29). The wet season for the SA region according to Marengo et al. (2011) is from October through March. It is seen that the largest number of PSC cases occurs before the rainiest quarter defined by Rao and Hada (1990) from December to February. The preference for the PSC is the beginning of the wet season, when rainfall is less frequent and more convective. The interannual variability in the onset of the wet season is shown by Carvalho et al. (2004) to be associated with El Niño/La Niña events, among other possible climate influences, and is seen locally as a variability of occurrence of the SACZ. When the SACZ is active for longer periods the rain is more widespread, and large accumulations of rainfall leading to extremes may be observed. When the SACZ is not active, local deep convection is more isolated, with the possibility of developing severe characteristics, as measured by the PSC criteria. As the SACZ is more frequent in the rainiest quarter, this is consistent with the maximum number of cases of PSC happening in the beginning of the wet season.
The CA, WAN and WAS subregions also show the highest occurrence of PSC in OND (65, 57 and 78, respectively) and lowest in AMJ for CA (21), WAN (18), and JAS (15) for WAS. OND is the beginning of the rainy season and directly before the 3 rainiest months for CA and for WAS. But for WAN subregion, the rainy season is from March to August, so that the quarter with the most PSC falls outside this period. WAN however does not have a well-defined dry season, and so the period outside the wet season may be referred to as the less rainy part of the year. The PSC as seen in Figure 5C is more frequent outside the wet season in OND and also in JAS. WAN is affected by the circulation associated with the ITCZ, which reaches its southernmost position in March-April. Wang and Fu (2002) define the average monthly meridional wind at low levels in a box close to WAN that shows winds from the north in October through March, shifting to being from the south the rest of the year, with intraseasonal and interannual variability. They associate winds from the south to rainfall north of the equator, and winds from the north to the monsoon rains of South America. Table 4 shows that WAN has the 3 rainiest months north of the Equator in AMJ. In OND, when the greatest amount of PSC occurs, the winds are from the north. In this situation Figure 2 shows PSC forming close to the Andes, possibly due to the confluence of the large scale flow with local circulations due to the Andes slopes topography, as suggested by DaRocha et al. (2009) using a regional model simulation. The same mechanism may be affecting the WAS subregion.
The convection of the WAS subregion was studied with a focus on the wet season of January and February 1999 during the TRMM/LBA campaign (Silva Dias et al., 2002) and during the transition from the dry to wet the season from September to December 2002 (Andreae et al., 2004; Albrecht et al., 2011). The wind regimes of easterlies and westerlies were associated with more continental and maritime type convection, respectively, by Rickenbach (2004), Williams et al. (2002), and Carvalho et al. (2002). However, these studies focus on the state of Rondônia, which is located on the northeastern edge of the WAS subregion. The western part of WAS reaches the slopes of the Andes where Figure 2 shows PSC counts in SON. Again, the local circulation interacting with the large-scale flow may explain the high number of cases in this area.
The CA subregion has been studied in several field campaigns, from early ones such as ABLE 2A and ABLE 2B (Garstang et al., 1990) to the more recent CHUVA (Machado et al., 2014) and GoAmazon (Martin et al., 2015) campaigns. Gonçalves et al. (2015) examine 1 year of Manaus weather radar data and show that the intense rain fraction given by the percentage of pixels with reflectivity larger than 45 dBZ increases between May and December, after the end of the rainy season, consistent with the maximum number of occurrences of PSC in OND. This is consistent with the timing of the large squall lines that propagate from the northern coast to the southwest across the Amazon Basin (Cohen et al., 1995; Alcântara et al., 2011) with maximum number of cases between May and September, reaching CA. Other possible sources of PSC, also mentioned in Gonçalves et al. (2015), are isolated convective events triggered by unstable thermodynamic conditions under the influence of biomass-burning aerosols, in the same line as the ones in WAS described by Albrecht et al. (2011) and Andreae et al. (2004).
The EA subregion accounts for the lowest number of cases: 71 over the period 1998–2012. This is also the only region where the cases are more frequent in JFM (34). The smallest number of cases occurs in JAS (6). This is surprising since, as described subregion, the squall lines traverse EA before reaching CA. According to Alcântara et al. (2011), the minimum number of squall lines in all categories of propagation is in October and starts increasing afterwards. A few may become PSC in JFM with an overlap with the rainiest months.
The GS subregion features a different distribution of the 157 cases when compared to the other five subregions. The maximum occurrence happens in JAS (68) and the lowest in JFM (21). GS is mostly located in the northern Hemisphere, being the northernmost region under the influence of the migrating ITCZ (Hastenrath, 1984). The wet season lasts from April to August and the 3 rainiest months are AMJ. The PSC has a maximum number of cases just after the end of the rainiest period and coincident with the months of maximum frequency of squall lines over the northern coast (Alcântara et al., 2011). Another possible source of PSC may be related to the topography of the GS subregion seen in Figure 1 and the change in meridional winds (Wang and Fu, 2002) associated with the migrating ITCZ that may provide different scenarios for year-round PSC occurrence.
The diurnal cycle of rainfall using the TRMM PR has been examined by Nesbitt and Zipser (2003) and by Negri et al. (2002), among others, for shorter time periods. Due to the different local time (LT) of sampling in each successive day by the TRMM sensors, it is possible to reconstruct the diurnal cycle, especially with a 15-year dataset such as the one used here and accumulation of cases with time intervals of more than 4 h (Negri et al., 2002). The number of cases of PSC are presented in 6-h intervals, given in local time starting at local midnight. Figure 6 shows the diurnal cycle of number of cases of PSC detected in the six subregions of the Amazon Basin defined in Figure 1 for each quarter. In Figure 7 the diurnal cycle of PSC is compared with all deep convection cases (indicated by ALL) detected in subset 1, for each quarter. This comparison is made via the relative frequency of cases in the diurnal cycle observed in each 6-h intervals in each quarter. Table 5 summarizes the time of day where the maximum occurs. As seen in Figure 2, the absolute number of cases in subset 1 (ALL) is about 20 times larger than for subset 4 (PSC).
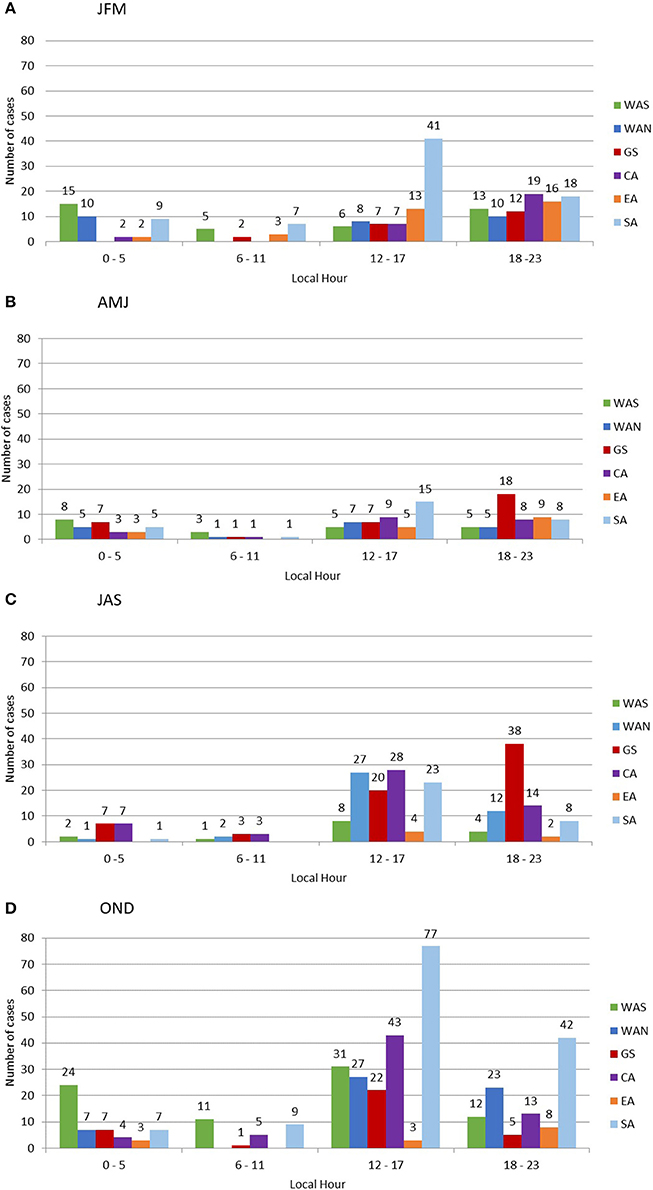
Figure 6. Hourly distribution (LT) of the number of cases of potentially severe convection cases for subset 4 for each subregion and each trimester for 1998–2012, where (A) JFM, (B) AMJ, (C) JAS, (D) OND.
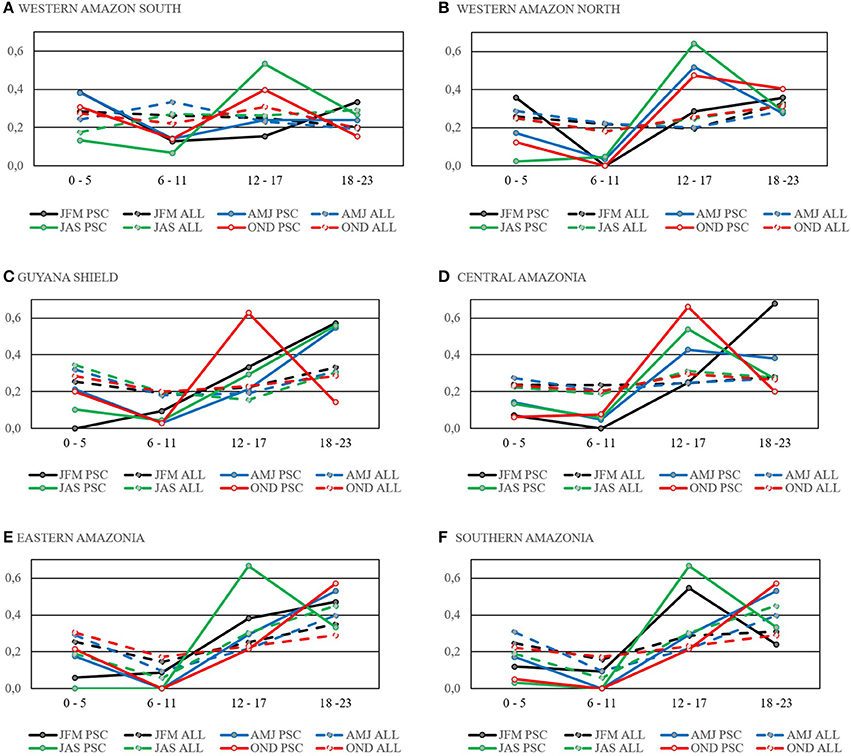
Figure 7. Relative frequency of storms in the daily cycle identified in subset 1 (ALL) and subset 4 (PSC) for each quarter (JFM, AMJ, JAS, OND). (A) WAS; (B) WAN; (C) GS; (D) CA; (E) EA, and (F) SA. Dashed lines refer to ALL and full lines to PSC. Black stands for JFM, blue for AMJ; green for JAS and red for OND.
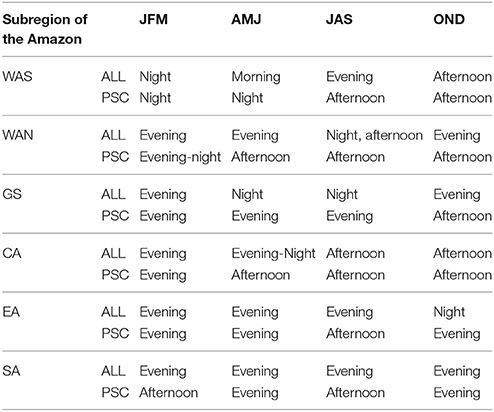
Table 5. Time of day of maximum in the number of PSC for each subregion and each quarter: night (0000–0600 LT), morning (0600–1200 LT), afternoon (1200–1800 LT), and evening (1800–2400 LT).
Figure 7 shows that the amplitude of the diurnal cycle of PSC occurrence is larger than the one for the ALL and the hour interval of maximum is not the same. Furthermore, the diurnal cycle is different in each of the quarters in a given subregion. For the entire Amazon basin, Table 5 shows that about 50% of PSC in all subregions and quarters occurs in the afternoon (between 1200 and 1800 LT) followed by 40% during the evening (1800–2400 LT). Within the ALL category, more cases occur in the evening (almost 60%) than in the afternoon.
Figures 7B,D, for WAN and CA, respectively, show similar behavior in the diurnal cycle of frequency of PSC in the different quarters. For AMJ, JAS, and OND, the maximum is in the afternoon (1200–1700 LT) while for JFM the maximum is in the evening (1800–2300 LT). In SA the difference from WAN and CA is that in AMJ the diurnal cycle is similar to JFM. In EA, Figure 7E, the maximum frequency of PSC is in the afternoon only in AMJ; in the other quarters the maximum is in the evening. In GS the only quarter with a maximum in the afternoon is OND. Figure 6 points to the SA subregion as the one with the largest number of cases in the afternoon out of all of the quarters. In October, 83% of the PSC cases in SA were observed between 1200 and LT.
For the time period between 0000 and 0600 LT, the WAS subregion has more cases than the other subregions except for in JJA. Figure 8 shows the number of cases of PSC for WAS and for WAN for 0000–0600 LT for each month. These two subregions are both characterized by proximity to the Andes Mountains, but WAS ranges in latitude from approximately 8–18°S while WAN is more equatorial, extending from approximately 4°N–8°S. The summary of Table 5 indicates differences in the timing of the maximum occurrence of PSC, but there are similarities in the diurnal cycles in JAS and OND, for example. Romatschke and Houze (2010) also find nocturnal systems in regions close to WAS and WAN during the wet season. Figure 8 shows the monthly totals of PSC occurrences at night for the WAS and WAN subregions. Cases are seen from September through May, with more cases in WAS than in WAN and a very well-defined maximum in November and a secondary maximum for WAN in March. The WAS subregion continues to experience these nocturnal occurrences throughout the rainy season. The physical mechanisms for nocturnal systems in both regions may be related to the local mountain valley circulation in a similar setting as the one observed in the more subtropical latitudes associated with MCS (e.g., Velasco and Fritsch, 1987) and seen in simulations such as the of DaRocha et al. (2009). The South American Low Level Jet–SALLJ (Vera et al., 2006) flows from the north and supplies the MCS that develop further south with heat and moisture. In WAS, the low-level flow encounters the Andes slopes and is lifted, producing significant rain in the region. What is seen from PSC-counting is that during the wet season this is also a probable source of severe weather. The nighttime behavior may have the same cause as in the subtropics, where the downslope winds from the Andes converges with the large-scale flow.
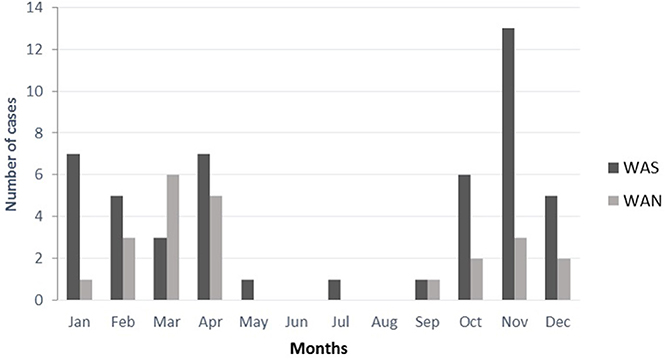
Figure 8. Number of cases per month of potentially severe convection between 00 and 06 LT for the WAS and WAN subregions and for the period 1998–2012.
The variability observed in the diurnal cycle of PSC occurrence throughout the Amazon may have different causes involving topographic features and the associated local circulations, proximity to the ocean, proximity to the high altitude of the Andes Mountains, deforestation patterns, land use, and the influence of large-scale systems such as the ITCZ or the SACZ. The relative importance of each cause in each region and in each season in defining the timing of PSC is an unresolved question.
Conclusions
Rainfall in the Amazon Basin has been the focus of several previous studies regarding its interannual, intraseasonal, and daily variability, as well as its variability across the region. Here the focus is on the documentation of deep convective activity, in particular the occurrence of potentially severe storms.
The wet season in the Amazon Basin is widely known for the large amounts of rainfall linked to SAMS. However, several studies have pointed out that rainfall in the Amazon Basin during the wet season has maritime characteristics, with large amounts of rainfall from cloud systems that are not very deep, have low amounts of ice, and almost no lightning. During the active phase of the SAMS the large scale circulation supports a widespread lift without convective inhibition that leads to rainfall. A very clean atmosphere (with low concentration of aerosols that may act as cloud condensation nuclei) has also been reported to be associated with the maritime characteristics of clouds, and has motivated the use of the term “Green Ocean” when referring to the Amazon Basin in the wet season (Andreae et al., 2004). During the transition from the dry to the wet season, and also during the break phases of SAMS, several studies have reported storms with a more continental character: deep convective systems with hail and high speed winds at the surface.
The present article documents the occurrence of extreme convective events in Amazon Basin. Using the TRMM PF developed by the University of Utah, several criteria have been used to identify the occurrence of PSC based on the TRMM PR and on the TMI. Of the four criteria used, the results are shown for the most extreme PSC, compared to the more general deep convection cases, labeled ALL. Considering the entire Amazon Basin, the population of ALL is about 20 times larger than that associated with the PSC. The monthly counts show that the ALL cases have a different annual cycle from the PSC. ALL has a maximum of occurrence in March and a minimum in August, while PSC has two maxima, March and October, and two minima, February and May. The distribution of PSC cases throughout the basin is different for each season and follows a similar pattern as obtained in previous studies of the distribution of MCSs based on the analysis of GOES satellite images. The austral winter is the season with the least amount of PSC throughout the basin, except in the northwest.
Breaking the analysis of the occurrence of PSC into six subregions defined by soil function and vegetation features (ter Steege et al., 2013) as WAS, WAN, GS, CA, EA, and SA, and looking at the quarters JFM, AMJ, JAS, OND, reveals a heterogeneous behavior. The annual cycle shows similarities between WAN, CA, and SA, which are regions that extend from northwest to southeast across the Amazon Basin and are affected by the SACZ during the wet season. In these subregions, the maximum number of PSC is seen in OND, which corresponds to early phase of the wet season for most of the region. The WAS region also shows a maximum of PSC in OND but with a different evolution in the other quarters. EA shows a maximum of PSC in JFM. The occurrence of very large Amazonian squall lines may affect PSC cases but it is noted that the two have different annual cycles. Finally, GS has a maximum occurrence of PSC in JAS. This subregion is located mostly in the northern Hemisphere and has diverse topography, bordered to the north by the Atlantic Ocean.
The diurnal cycle of PSC occurrence is also variable throughout the subregions and different from the daily cycle of the ALL cases. The amplitude of the diurnal cycle of the relative frequency of occurrence is larger for PSC than for ALL. The maximum occurrence of PSC is most common in the afternoon and evening. However, the WAS and WAN subregions show nocturnal systems likely associated with the topographical effect of the eastern slopes of the Andes Mountains.
The variety of the annual and diurnal cycles of PSC and ALL occurrences throughout the Amazon Basin certainly poses a challenge for modeling. The contribution of this work is toward an integrated view of the entire basin, with a consistent data set based on TRMM sensors and with 15 years of information that can be used to further document throughout the seasons and subregions the preferred behavior of deep convection. As mentioned before, the correct time of the maxima of the annual and diurnal cycles has global climate implications. As seen here, most of the deep convection propagates between afternoon and evening, but nocturnal systems are relevant over the slopes of the Andes as well as in the northern Mountains of the Guianas. The particular timing of the annual cycle when PSC is more frequent seems to be the early phase of the wet season. However, there are important exceptions, such as in the Guianas.
The effect of the large-scale circulation and of the overall geography with the major influence of Andes Mountains to the west, the Atlantic Ocean to the north, land-use (such as patterns of deforestation), and aerosol-loading that may affect cloud microphysics, all combine to present a complex picture. Contributing factors may have different weights in the different subregions, which may lead to future explanations for the different behavior.
Author Contributions
AN: PhD student organized the article, developed and applied the methodology and results discussed. MD: supported the first author in many ways, helping to develop the methodology, discuss results and conclusions. EA: assisted in the learning software used, data processing, suggested adjustments in methodology, discussions and corrections. CR: He suggested discussions, corrections and some help in the methodology.
Conflict of Interest Statement
The authors declare that the research was conducted in the absence of any commercial or financial relationships that could be construed as a potential conflict of interest.
Acknowledgments
The research has been funded by FAPESP Grant 2013/105014-0 and by graduate student scholarships by CAPES and CNPq.
References
Albrecht, R. I., Morales, C. A., and Silva Dias, M. A. F. (2011). Electrification of precipitating systems over the Amazon: physical processes of thunderstorm development. J. Geophys. Res. 116, D08209. doi: 10.1029/2010JD014756
Alcântara, C. R., Silva Dias, M. A. F., Souza, E. P., and Cohen, J. C. P. (2011). Verification of the role of the low level jets in Amazon squall lines. Atmos. Res. 100, 36–34. doi: 10.1016/j.atmosres.2010.12.023
Anagnostou, E. N., and Morales, C. A. (2002). Rainfall estimation from TOGA radar observations during LBA field campaign. J. Geophys. Res. 107, LBA 35-1–LBA 35-14. doi: 10.1029/2001JD000377
Andreae, M. O., Rosenfeld, D., Artaxo, P., Costa, A. A., Frank, G. P., Longo, K. M., et al. (2004). Smoking rain clouds over the Amazon. Science 303, 1337–1342. doi: 10.1126/science.1092779
Anselmo, E. (2015). Morphology of Electric Storms in South America (in Portuguese Morfologia das Tempestades Elétricas na América do Sul). Thesis, Universidade de São Paulo. Available online at: http://www.iag.usp.br/pos/meteorologia/portugues/dissertacoestestes/morfologia-das-tempestades-elétricas-na-américa-do-sul
Bechtold, P., Chaboureau, J.-P., Beljaars, A., Betts, A. K., Kohler, M., Miller, M., et al. (2004). The simulation of the diurnal cycle of convective precipitation over land in a global model. Q. J. R. Meteorol. Soc. 130, 3119–3137. doi: 10.1256/qj.03.103
Carey, L. D., and Rutledge, S. A. (1998). Electrical and multiparameter radar observations of a severe hailstorm. J. Geophys. Res. 103, 13979–14000. doi: 10.1029/97JD02626
Carvalho, L. M. V., Jones, C., Silva, A. E., Liebmann, B., and Silva Dias, P. L. (2011). The South American Monsoon System and the 1970s climate transition. Int. J. Climatol. 31, 1248–1256. doi: 10.1002/joc.2147
Carvalho, L. M. V., Jones, C., and Liebmann, B. (2004). The South Atlantic convergence zone: intensity, form, persistence, and relationships with intraseasonal to interannual activity and extreme rainfall. J. Clim. 17, 88–108. doi: 10.1175/1520-0442(2004)017<0088:TSACZI>2.0.CO;2
Carvalho, L. M. V., Jones, C., and Silva Dias, M. A. F. (2002). Intraseasonal large-scale circulations and mesoscale convective activity in tropical South America during the TRMM-LBA campaign. J. Geophys. Res 107, 21–29. doi: 10.1029/2001JD000745
Cecil, D., Goodman, S., Boccippio, D., Zipser, E., and Nesbitt, S. (2005). Three years of trmm precipitation features. Part I: radar, radiometric, and lightning characteristics. Mon. Weather Rev. 133, 543–566. doi: 10.1175/MWR-2876.1
Cohen, J. C. P., Silva Dias, M. A. F., and Nobre, C. A. (1995). Environmental conditions associated with amazonian squall lines: a case study. Mon. Weather Rev. 123, 3163–3174.
Conforte, J. C. (1997). A Study of Mesoscale Convective Complex Over South America (In Portuguese: Um Estudo de Complexos Convectivos de Mesoescala Sobre a America do Sul). Ph.D. Thesis, Instituto Nacional de Pesquisas Espaciais/INPE.
DaRocha, R. P., Morales, C. A., Cuadra, S. V., and Ambrizzi, T. (2009). Precipitation diurnal cycle and summer climatology assessment over South America: an evaluation of Regional Climate Model version 3 simulations. J. Geophys. Res. 114, D10108. doi: 10.1029/2008JD010212
Fitzjarrald, D. R., Saka1, R. K., Moraes, O. L. L., Cosme de Oliveira, R., Acevedo, O. C., Czikowsky, M. J., et al. (2008). Spatial and temporal rainfall variability near the Amazon-Tapajós confluence. J. Geophys. Res. 113, G1. doi: 10.1029/2007JG000596
Fu, R., and Li, W. (2004). The influence of the land surface on the transition from dry to wet season in Amazonia. Theor. Appl. Climatol. 78, 97–110. doi: 10.1007/s00704-004-0046-7
Garstang, M., Greco, S., Scala, J., Swap, R., Ulanski, S., Fitzjarrald, D., et al. (1990). The Amazon Boundary-Layer Experiment (ABLE 2B): a meteorological perspective. Bull. Amer. Meteor. Soc. 71, 19–32.
Garstang, M., White, S., Shugart, H. H., and Halverson, J. (1998). Convective cloud downdrafts as the cause of large blowdowns in the Amazon rainforest. Meteorol. Atmos. Phys. 67, 199–212. doi: 10.1007/BF01277510
Globo (2012). Available online at: http://g1.globo.com/am/amazonas/noticia/2012/09/barco-de-turismo-com-40-pessoas-naufraga-no-rio-negro-em-manaus.html
Gonçalves, W. A., Machado, L. A. T., and Kirstetter, P. E. (2015). Influence of biomass aerosol on precipitation over the Central Amazon: an observational study. Atmos. Chem. Phys. 15, 6789–6800. doi: 10.5194/acp-15-6789-2015
Hastenrath, S. (1984). Interannual variability and annual cycle: mechanisms of circulation and climate in the tropical atlantic sector. Mon. Weather Rev. 112, 1097–1107.
IPCC (2013). Climate Change 2013 The Physical Science Basis. Available online at: http://www.climatechange2013.org/
Johns, R. H., and Doswell, C. A. (1992). Severe local storm forecasting. Weather Forecast. 7, 588–612.
Kousky, V. E. (1988). Pentad outgoing longwave radiation climatology for the South American sector. Rev. Bras. Meteorol. 3, 217–231.
Kummerow, C., Barnes, W., Kozu, T., Shiue, J., and Simpson, J. (1998). The Tropical Rainfall Measuring Mission (TRMM) sensor package. J. Atmos. Oceanic Technol. 15, 809–817.
Laurent, H., Machado, L. A. T., Morales, C. A., and Durieux, L. (2002). Characteristics of the Amazonian mesoscale convective systems observed from satellite and radar during the WETAMC/LBA experiment. J. Geophys. Res. 107, 8054. doi: 10.1029/2001jd000337
Liebmann, B., and Marengo, J. A. (2001). Interannual variability of the rainy season and rainfall in the Brazilian Amazon Basin. J. Clim. 14, 4308–4318. doi: 10.1175/1520-0442(2001)014<4308:IVOTRS>2.0.CO;2
Liu, C., Zipser, E. J., Cecil, D. J., Nesbitt, S. W., and Sherwood, S. (2008). A Cloud and precipitation feature database from nine years of TRMM observations. J. Appl. Meteorol. Climatol. 47, 2712–2728. doi: 10.1175/2008JAMC1890.1
MacGorman, D. R., Burgess, D. W., Mazur, V., Rust, W. D., Taylor, W. L., and Johnson, B. C. (1989). Lightning rates relative to tornadic storm evolution on 22 May 1981. J. Atmos. Sci. 46, 221–251.
Machado, L. A. T., Laurent, H., Dessay, N., and Miranda, I. (2004). Seasonal and diurnal variability of convection over the Amazonia: a comparison of different vegetation types and large scale forcing. Theor. Appl. Climatol. 78, 61–77. doi: 10.1007/s00704-004-0044-9
Machado, L. A. T., Silva Dias, M. A. F., Morales, C., Fisch, G., Vila, D., Albrecht, R. L., et al. (2014). The CHUVA Project - how does convection vary across Brazil? Bull. Amer. Meteor. Soc. 95, 1365–1380. doi: 10.1175/BAMS-D-13-00084.1
Marengo, J. A., Liebmann, B., Kousky, V., Filizola, N., and Wainer, I. (2001). Onset and end of the rainy season in the Brazilian Amazon Basin. J. Clim. 14, 833–852. doi: 10.1175/1520-0442(2001)014<0833:OAEOTR>2.0.CO;2
Marengo, J. A. J., Tomasella, L. M., Alves, W. R., Soares, D., and Rodriguez, A. (2011). The drought of 2010 in the context of historical droughts in the Amazon region. Geophys. Res. Lett. 38, L12703. doi: 10.1029/2011GL047436
Martin, S. T., Artaxo, P., Machado, L. A. T., Manzi, A. O., Souza, R. A. F., Schumaker, C., et al. (2015). Introduction: observations and modeling of the green ocean Amazon (GoAmazon2014/5). Atmos. Chem. Phys. Discuss. 15, 30175–30210. doi: 10.5194/acpd-15-30175-2015
Mills, G. A., and Conquhoun, J. R. (1998). Objective prediction of severe thunderstorm environments: preliminary results linking a decision tree with an operational regional NWP model. Weather Forecast. 13, 1078–1092.
Mohr, K. I., and Zipser, E. J. (1996). Mesoscale convective systems defined by their 85-GHz ice scattering signature: size and intensity comparison over tropical oceans and continents. Mon. Weather Rev. 124, 2417–2437.
Moller, A. R. (2001). Severe local storms forecasting. Am. Meteorol. Soc. Monogr. 28, 433–480. doi: 10.1175/0065-9401-28.50.433
Nascimento, E. L. (2004). Previsão de tempestades severas utilizando-se parâmetros convectivos e modelos de mesoescala: uma estratégia operacional adotável no Brasil. Rev. Bras. Meteorol. 20, 121–140.
Negri, A. J., Bell, T. L., and Xu, L. (2002). Sampling of the diurnal cycle of precipitation using TRMM. J. Atmos. Oceanic Technol. 19, 1333–1344. doi: 10.1175/1520-0426(2002)019<1333:SOTDCO>2.0.CO;2
Negrón-Juárez, R. I., Chambers, J. Q., Guimaraes, G., Zeng, H., Raupp, C. F. M., Marra, D., et al. (2010). Widespread Amazon forest tree mortality from a single cross-basin squall line event. Geophys. Res. Lett. 37, L16701. doi: 10.1029/2010gl043733
Nelson, B. W., Kapos, V., Adams, J. B., Oliveira, W. J., Braun, O. P. G., and Amaral, I. L. (1994). Forest disturbance by large blowdowns in the Brazilian Amazon. Ecology 75, 853–858.
Nesbitt, S. W., and Zipser, J. (2003). The diurnal cycle of rainfall and convective intensity according to three years of TRMM measurements. J. Clim. 16, 1456–1475. doi: 10.1175/1520-0442-16.10.1456
Nesbitt, S. W., Zipser, E. J., and Cecil, D. J. (2000). A census of precipitation features using TRMM: radar, ice scattering, and lightning observations. J. Clim. 13, 4087–4106. doi: 10.1175/1520-0442(2000)013<4087:ACOPFI>2.0.CO;2
Paiva, R. C. D., Costa Buarque, D., Clarke, R. T., Collischonn, W., and Allasia, D. G. (2011). Reduced precipitation over large water bodies in the Brazilian Amazon shown from TRMM data. Geophys. Res. Lett. 38, L04406. doi: 10.1029/2010gl045277
Petersen, W. A., and Rutledge, S. A. (2001). Regional variability in tropical convection: observations from TRMM. J. Clim. 14, 3566–3586. doi: 10.1175/1520-0442(2001)014<3566:RVITCO>2.0.CO;2
Petersen, W. A., Nesbitt, S. W., Blakeslee, R. J., Cifelli, R., Hein, P., and Rutledge, S. A. (2002). TRMM observations of intraseasonal variability in convective regimes over the Amazon. J. Clim. 15, 1278–1294. doi: 10.1175/1520-0442(2002)015<1278:TOOIVI>2.0.CO;2
Rao, V. B., Cavalcanti, I. F. A., and Hada, K. (1996). Annual variation of rainfall over Brazil and water vapor characteristics over South America. J. Geophys. Res. 101, 26539–26551. doi: 10.1029/96JD01936
Rao, V. B., and Hada, K. (1990). Characteristics of rainfall over Brazil: annual variations and connections with the southern Oscillation. Theor. Appl. Climatol. 42, 81–91. doi: 10.1007/BF00868215
Rasmussen, K. L., Choi, S. L., Zuluaga, M. D., and Houze, R. A. Jr. (2013). TRMM precipitation bias in extreme storms in South America. Geophys. Res. Lett. 40, 3457–3461. doi: 10.1002/grl.50651
Raupp, C. F. M., Dias, P. L. S., Tabak, E. G., and Milewski, P. (2008). Resonant wave interactions in the equatorial wave-guide. J. Atmos. Sci. 65, 3398–3418. doi: 10.1175/2008JAS2387.1
Raupp, C. F. M., and Silva Dias, P. L. (2010). Interaction of equatorial waves through resonance with the diurnal cycle of tropical heating. Tellus 62, 706–718. doi: 10.1111/j.1600-0870.2010.00463.x
Rickenbach, T. M. (2004). Nocturnal cloud systems and the diurnal cariation of clouds and rainfall in Southwestern Amazonia. Mon. Weather Rev. 132, 1201–1219. doi: 10.1175/1520-0493(2004)132<1201:NCSATD>2.0.CO;2
Romatschke, U., and Houze, R. A. Jr. (2010). Extreme summer convection in South America. J. Clim. 23, 3761–3791. doi: 10.1175/2010JCLI3465.1
Salio, P., Nicolini, M., and Zipser, E. J. (2007). Mesoscale convective systems in Southeastern South America and their relationship with the South American Low Level Jet. Mon. Weather Rev. 135, 1290–1309. doi: 10.1175/MWR3305.1
Santos, D., Centano, D., Aranibar, J. G. A., and Veríssimo, A. (2014). Social Progress Index for the Brazilian Amazon. Belém do Pará: Instituto do Homem e Meio Ambiente da Amazônia.
Silva Dias, M. A. F. (2011). An increase in the number of tornado reports in Brazil. Weather Clim. Soc. 3, 209–217. doi: 10.1175/2011WCAS1095.1
Silva Dias, M. A. F., Rozante, J. R., and Machado, L. A. T. (2009). “Complexos convectivos de mesoescala na América do sul,” in Tempo e Clima no Brasil, 1st Edn., Vol. 1, eds I. Cavalcanti, N. J. Ferreira, M. A. F. Silva Dias, and M. G. A. Justi da Silva (São Paulo: Oficina de Textos), 181–194.
Silva Dias, M. A. F., Rutledge, S., Kabat, P., Silva Dias, P. L., Nobre, C., Fisch, G., et al. (2002). Cloud and rain processes in biosphere–atmosphere interaction context in the Amazon region. J. Geophys. Res. 107, 8072. doi: 10.1029/2001JD000335
Silva Dias, M. A. F., Silva Dias, P. L., Longo, M., Fitzjarrald, D. R., and Denning, A. S. (2004). River breeze circulation in eastern Amazonia: observations and modelling results. Theor. Appl. Climatol. 78, 111–121. doi: 10.1007/s00704-004-0047-6
Spencer, R. W. (1986). A satellite passive 37-GHz scattering-based method for measuring oceanic rain rates. J. Appl. Meteorol. 25, 754–766.
ter Steege, H., Pitman, N. C., Sabatier, D., Baraloto, C., Salomão, R. P., Guevara, J. E., et al. (2013). Hyperdominance in the Amazonian tree flora. Science 342, 1243092. doi: 10.1126/science.1243092
Torres, J. C., and Nicolini, M. (2002). “A composite of Mesoscale Convective Systems over souther South America and its relationship to low-level jet events,” in Conference on South American Low-Level Jet, CD-ROM, Santa Cruz de la Serra.
Velasco, I., and Fritsch, J. M. (1987). Mesoscale convective complexes in the americas. J. Geophys. Res. 92, 9591–9613. doi: 10.1029/JD092iD08p09591
Vera, C., Baez, J., Douglas, M., Emmanuel, C. B., Marengo, J., Meitin, J., et al. (2006). The South American low-level jet experiment. Bull. Amer. Meteor. Soc. 87, 63–77. doi: 10.1175/BAMS-87-1-63
Wang, H., and Fu, R. (2002). Cross-equatorial flow and seasonal cycle of precipitation over South America. J. Clim. 15, 1591. doi: 10.1175/1520-0442(2002)015<1591:cefasc>2.0.co;2
Williams, E., Boldi, B., Matlin, A., Weber, M., Hodanish, S., Sharp, D., et al. (1999). The behavior of total lightning activity in severe Florida thunderstorms. Atmos. Res. 51, 245–265.
Williams, E., Rosenfeld, D., Madden, N., Gerlach, J., Gears, N., Atkinson, L., et al. (2002). Contrasting convective regimes over the Amazon: implications for cloud electrification. J. Geophys. Res. 107, 8082. doi: 10.1029/2001JD000380
Keywords: severe storms, Amazon clouds, TRMM, precipitation features
Citation: Nunes AMP, Silva Dias MAF, Anselmo EM and Morales CA (2016) Severe Convection Features in the Amazon Basin: A TRMM-Based 15-Year Evaluation. Front. Earth Sci. 4:37. doi: 10.3389/feart.2016.00037
Received: 15 December 2015; Accepted: 23 March 2016;
Published: 13 April 2016.
Edited by:
David Mendes, Federal University of Rio Grande do Norte, BrazilReviewed by:
Ana María Durán-Quesada, University of Costa Rica, Costa RicaWeber Andrade Gonçalves, Federal University of Rio Grande do Norte, Brazil
Copyright © 2016 Nunes, Silva Dias, Anselmo and Morales. This is an open-access article distributed under the terms of the Creative Commons Attribution License (CC BY). The use, distribution or reproduction in other forums is permitted, provided the original author(s) or licensor are credited and that the original publication in this journal is cited, in accordance with accepted academic practice. No use, distribution or reproduction is permitted which does not comply with these terms.
*Correspondence: Ana M. P. Nunes, am.pereiranunes@gmail.com